multi-modal framework for automatic detection of diagnostically ...raji/cpapers/liver...
TRANSCRIPT
Multi-modal Framework for Automatic Detection ofDiagnostically Important Regions in Nonalcoholic Fatty
Liver Ultrasonic Images
Abstract
The severity of fat in ultrasonic liver images is quantified based on character-
istics of three regions in the image namely diaphragm, periportal veins and
texture of liver parenchyma. The characteristics of these regions vary with the
severity of fat in the liver, and is subjected to low signal to noise ratio, low
contrast, poorly defined organ boundaries, etc., hence locating these regions
in ultrasound images is challenging task for the sonographers. Automated de-
tection of these regions will help the sonographers to do accurate diagnosis in
shorter time, and also acts as a fundamental step to develop automated diag-
nostic algorithms. In this paper, we propose a novel multi-modal framework
for detecting diaphragm, periportal veins and texture of liver parenchyma in
ultrasonic liver ultrasound images. Since the characteristics of these regions dif-
fer from each other, we propose a specific algorithm for detecting each region.
Diaphragm and periportal veins are detected with the combination of Viola
Jones and GIST descriptor based classifier, while homogeneous texture regions
are detected with the combination of histogram features based classifier and
connected components algorithm. The proposed algorithm when tested on 180
ultrasound liver images, detected the diaphragm, periportal veins and texture
regions with an accuracy of 97%, 91% and 100% respectively.
Keywords: Steatosis, Diaphragm, Periportal veins, Ultrasonic liver
parenchyma texture, Viola Jones, GIST, Histogram features.
Preprint submitted to Journal of LATEX Templates March 22, 2018

1. Introduction1
Nonalcoholic Fatty Liver Disease (NAFLD) is one of the leading cause for2
the dysfunction of the liver and prevalent in 30% of general population in the3
developed countries [1]. If NAFLD is untreated, it may progress into chronic4
liver diseases such as fibrosis, cirrhosis, hepatocellular carcinoma, liver cancer,5
etc [2], [3]. Depending on the severity of fat, the liver is categorized into Normal,6
Grade I, Grade II and Grade III respectively. If the density of fat is less than7
5% it is considered as Normal, 5 to 33% as Grade I, 33 to 66% as Grade II and8
greater than 66% as Grade III respectively [4]. The severity of fat in the liver9
is determined using invasive and noninvasive procedures. Invasive procedures10
which include blood tests and biopsies are associated with complications like11
bleeding, bile leakage and infections. Hence doctors recommend for noninvasive12
procedures like Magnetic Resonance Imaging (MRI), Computed Tomography13
(CT) and ultrasound scanning [5, 6]. MRI and CT being expensive, doctors14
prefer for ultrasound scanning which has the advantages of real-time imaging,15
safety and less expensive [7, 8]. Although the ultrasound scanning is widely used,16
the diagnostic accuracy in quantifying the fat in the liver is very low due to the17
subjectivity involved in the scanning. Strauss et al. found that there is a low18
mean inter and intra-observability of 72% and 76% respectively in discriminating19
between normal and fatty liver, while inter and intra-observability of 47-59%20
and 59-64% respectively is observed in discriminating the severity of fat within21
Grade I, Grade II and Grade III classes. It is also found that 32 to 34% of22
fatty liver images belong to Grade I and Grade II are not distinguishable to23
sonographers eye [9]. Therefore there is a need for computer-aided diagnosis24
(CAD) algorithms to assist the sonographers to accurately diagnose the fatty25
liver diseases.26
In literature [6, 10, 11, 12, 13, 14, 15, 16, 17, 18, 19], authors are mainly27
focused on developing CAD algorithms for discriminating normal liver with28
fatty liver images, where fatty liver constituted liver images ranging from Grade29
I to Grade III category, while further distinction within the fatty liver grades is30
2

not extensively studied [20]. Accurate quantification of fat in the liver carries31
paramount importance in liver diagnosis, for example in liver transplantation,32
even a Grade I fatty liver of donor can increase the potentiality of liver failure in33
the recipient and also there is a high probability that the donor will get diseased34
[6, 21]. The patients who undergo liver resections with Grade III fatty liver35
are expected likely to suffer from post-operative complications [22]. Therefore36
accurate quantification of fat in the liver will prevent the patients to suffer from37
chronic diseases and complications associated with NAFLD. In [20, 23, 24, 25,38
26, 27, 28], the authors proposed CAD algorithms for quantifying the fatty39
content in the liver. In all these algorithms, authors employed manual cropping40
for detecting the region of interest (RoI). RoI includes the homogeneous texture41
of liver parenchyma, pixels along the direction of wave propagation, etc. To42
avoid manual intervention in CAD, researchers proposed algorithms which works43
on complete images [17, 29, 30, 31, 32]. While dealing with entire image, we are44
extracting the features from the regions which is neither important nor convey45
information useful for diagnosis leading to ineffective feature representation.46
Hence, in developing CAD algorithms, we have to ensure that the features47
are extracted only from diagnostically important regions. Detecting RoI’s in48
ultrasonic liver images is challenging due to49
• Low signal to noise ratio, poorly defined organ boundaries, low contrast,50
artifacts caused due to acoustic shadows, etc.51
• Variation in the characteristics of the RoI within intraclass and interclass52
images.53
In this paper, we propose an algorithm for automated detection of the RoI’s54
useful for quantifying the fat in liver ultrasound images. The quantification of55
fat in the liver through ultrasound scanning is done by perceiving characteristics56
in three regions of the liver such as diaphragm, periportal veins and texture of57
liver parenchyma. The RoI’s of the diaphragm, periportal veins and texture58
of liver parenchyma of the liver ultrasound image is shown in Fig. 1. The59
characteristics of these region vary accordingly with the severity of fat present60
3

Table 1: Characteristics of the diaphragm, periportal veins and texture of liver parenchyma
corresponding to different grades of fatty liver [20], [33].
Category Characteristics
Normal Visible echogenicity with visible periportal and diaphragm. The texture
of liver parenchyma appears coarser and rugged.
Grade IIncreased hepatic echogenicity with visible periportal and diaphragmatic
echogenicity. The texture appears less coarser and smooth.
Grade IIIncreased hepatic echogenicity with imperceptible periportal echogenicity with
partial obscuration of diaphragm. The texture appears more smooth and finer.
Grade IIIIncreased hepatic echogenicity with imperceptible periportal echogenicity and
obscuration of diaphragm. The texture appears diffused and appears more finer.
in the liver. The characteristics of these RoI’s with respect to different grades61
of fatty liver is discussed in Table. 1 [20], [33]. Based on the characteristics of62
RoI’s, the sonographers quantify the fat in the liver. Automatic detection of63
these regions will assist sonographers to make an accurate diagnosis in short time64
and also serves as a fundamental step for the development of robust automated65
diagnostic algorithms for quantification of fat in the liver.66
Figure 1: Ultrasonic liver images. Red boxes indicates the diaphragm, green boxes indicates
periportal veins and blue boxes indicates RoI corresponding to homogeneous texture.
In this paper, we propose an automatic algorithm for detection of diaphragm,67
periportal veins and homogeneous texture regions of liver parenchyma. Since68
4

each RoI is different with respect to other RoI’s, we developed a specific algo-69
rithm for detecting each RoI. The novelties of the paper are:70
• For detecting RoI of a diaphragm, we propose an algorithm which is a71
combination of Viola Jones (VJ) algorithm [34], GIST descriptor [35] based72
cubic SVM classifier and active contour segmentation [36, 37]. The VJ73
algorithm and GIST descriptor based classifier is trained appropriately74
with the images corresponding to the regions of the diaphragm.75
• For detecting RoI of periportal veins, we propose an algorithm which is a76
combination of VJ and GIST descriptor based quadratic SVM classifier.77
Each classifier is trained appropriately with the images corresponding to78
the regions of periportal veins.79
• For detecting RoI for the texture of liver parenchyma, we propose a two-80
stage classifier framework, which is based on the combination of histogram81
features based Gausssian SVM classifier and connected components al-82
gorithm [38]. The histogram based quadratic SVM classifier is trained83
with the images of homogeneous and nonhomogeneous regions of liver84
parenchyma.85
All the three algorithms are applied independently on the image to detect RoI’s86
of the ultrasonic liver image. The main contributions of our work lie in devel-87
oping and integrating different classification frameworks to detect all the RoI’s.88
The performance of the proposed algorithm is evaluated based on its individual89
accuracy in detecting each RoI. The detail explanation regarding the detection90
of each RoI is discussed in Section 2.91
92
The rest of the paper is organized in the following way. In Section 2, we93
discuss in detail about the proposed framework for detecting multiple RoI’s. In94
Section 3, we discuss the database used, and the protocols followed in image95
acquisition. Results of the proposed algorithm is reported in Section 4, and96
Section 5 concludes the paper with implications and future scope of the work.97
5

98
2. Multi-modal framework for automatic detection of the diaphragm,99
periportal veins and homogeneous texture of liver parenchyma.100
The block diagram representation of the proposed algorithm is shown in101
Fig. 2. The framework consists of three independent algorithms each specif-102
ically proposed for detecting RoI of a diaphragm, periportal veins and texture103
of liver parenchyma. The detailed description regarding the detection of each104
RoI is discussed in the following sections.105
2.1. Diaphragm detection106
The diaphragm appears like a slanted ‘U’ shape with an upper part trimmed107
in the liver ultrasound image. The shape, size and length of a diaphragm de-108
pends on the anatomy of patient and position of the probe used to acquire the109
liver images. Since the diaphragm lies above the liver, it appears in a lower left110
portion of the ultrasound image when captured from a subxiphoid view [39].111
The block diagram representation of the proposed algorithm for detecting RoI112
of a diaphragm is shown in Fig. 3. Initially, VJ algorithm is used to detect the113
RoI of a diaphragm. VJ algorithm which is primarily proposed for detecting114
faces in real-time also proved that the same framework is effective in detecting115
other parts like noses, eyes, upper body parts, cars, stop signs, etc. Recently VJ116
algorithm has been used in medical image analysis to detect organs like carotid117
artery, kidney, pelvis and proximal femur of a hip joint, etc [40, 41, 42], [43].118
The VJ algorithm works in three stages namely feature extraction, AdaBoost119
training and cascade of classifiers.120
2.1.1. Feature extraction121
In this stage, Haar-like features are extracted from the positive and nega-122
tive training images. Haar features are extracted using two, three, and four123
rectangular kernels [44], resulting in large number of features. For an image124
of size 24 × 24 a total of 45,396 features were extracted. For computing these125
6

Diaphragm detction Periportal vein detection
Homogeneous texture detection
Viola Jones Algorithm
Viola Jones Algorithm
GIST descriptor + Cubic SVM
Active Contour based
segmentation
GIST descriptor+
Quadratic SVM
Histogram features based sliding window model
Connected components Algorithm
Proposed algorithm for detection of RoI's
Automated detection of RoI's
Figure 2: Block diagram representation of the proposed algorithm for detection of RoI’s in
the liver ultrasound image.7

Haar like features extractedfrom cropped Diaphragm
images
Haar like features extractedfrom cropped kidney
images
Liver ultrasound
image
Integral image
Haar like Features extraction
Adaboost algorithm
Cascade classifiers
RoI of Diaphragm
(includes TP's and FP's)
Result of VJ algorithm
Image resize
GIST featureextraction
Cubic SVM classifier
RoI of Diaphragm
TP's of VJ algorithm
FP's of VJ algorithm
GIST featureextraction
(a)
(b)
Figure 3: (a). Block diagram representation of the VJ algorithm used for detecting the RoI
of a diaphragm and (b). Algorithm used to reduce the FP’s resulted from VJ algorithm.
8
many number of features with less computational complexity, an intermediate126
image representation called integral image approach is employed [45]. To make127
the RoI detection scale invariant, the features are extracted on a pyramid of 11128
images where each image is 1.25 times greater than the previous image.129
2.1.2. AdaBoost based feature selection and learning algorithm130
All the extracted features from RoI are not useful for classification, and131
training a classifier with these many number of features is a computationally132
expensive procedure. To find the most representative features to train a classi-133
fier, an AdaBoost algorithm is used [46]. The decision stumps are used as weak134
learners for classification. The AdaBoost algorithm improves the classification135
performance by combining a collection of weak learners.136
2.1.3. Cascade classifier137
To improve the detection accuracy and to reduce the computation time, a138
cascade of classifiers is used. Each cascade classifier is trained with a combi-139
nation of weak learners. The complexity of detecting the RoI increases with140
increase in the number of cascaded classifiers. The cascaded classifier architec-141
ture improves the detection rate by eliminating the diaphragms in earlier stages142
of the cascaded classifiers. The negative and positive images used in training the143
VJ algorithm for detecting RoI of a diaphragm is shown in Fig. 4 and Fig. 5.144
The positive images are extracted by cropping diaphragm from liver ultrasound145
images. The size of diaphragm used in training the VJ algorithm is varied in the146
range 48 × 48 to 64 × 78 pixels. The entire region of the diaphragm is not con-147
sidered for training due to the complex and varied structure of the diaphragm.148
While for negative training images, care is taken that the images do not contain149
shapes resembling like a diaphragm. We choose kidney ultrasound images as150
negative training examples since no part of the kidney image resemble like a151
diaphragm. The VJ algorithm is trained with 741 labeled diaphragms and 50152
kidney images. The RoI’s detected by the VJ algorithm is shown in Fig. 6.153
Although VJ algorithm results with high accuracy in detecting the diaphragm,154
9

Figure 4: Images used as positive examples in training the VJ algorithm for detection of
diaphragm.
Figure 5: Images used as negative examples in training the VJ algorithm for detection of
diaphragm. All these images belongs to the kidney.
10
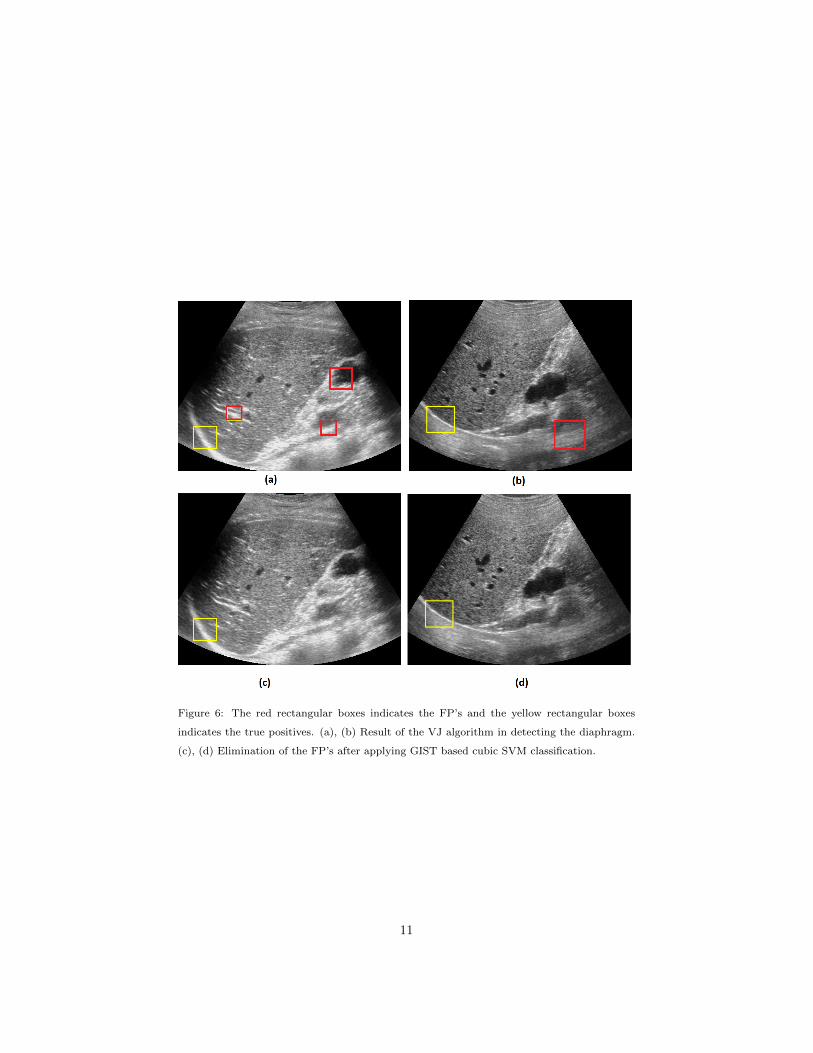
Figure 6: The red rectangular boxes indicates the FP’s and the yellow rectangular boxes
indicates the true positives. (a), (b) Result of the VJ algorithm in detecting the diaphragm.
(c), (d) Elimination of the FP’s after applying GIST based cubic SVM classification.
11
it suffered from high false positives (FP’s). While developing CAD algorithms,155
care should be taken that the algorithm will result in less number of FP’s, since156
analyzing the FP’s for diagnosis will lead to a faulty diagnosis. The VJ algo-157
rithm mostly detected border of vein walls and nonhomogeneous texture regions158
as FP’s. To eliminate FP’s, a supervised learning algorithm trained with true159
positives (TP’s) and FP’s resulted from the VJ algorithm is developed. The160
intuition of considering TP’s and FP’s of VJ is to make the classifier robust to161
the false detections. The algorithm is tested with some of the popularly used162
texture features like Histogram of Oriented Gradients (HOG) [47], histogram163
and GIST descriptor [35]. Out of all these features, GIST descriptor performed164
better in eliminating the FP’s.165
166
2.1.4. GIST descriptor based SVM classifier167
The block diagram representation regarding the classification between TP’s168
and FP’s is shown in Fig. 3b. The TP’s and FP’s resulted from VJ algorithm is169
of different size. Hence in developing the algorithm, all the TP’s and FP’s images170
are resized to a fixed resolution of 64 × 64 pixels, this size is chosen based on the171
cross-validation. From each resized image, GIST descriptor is extracted. GIST172
descriptor gives the low dimensional representation of the scene by extracting the173
spatial envelope of an image [48]. GIST represent the features like naturalness,174
ruggedness, openness, roughness and expansion of a scene [49]. GIST descriptor175
from image is extracted in the following way. Initially, the image is convolved176
with 32 Gabor filters corresponding to four scales and eight orientation resulting177
in 32 feature maps. Each feature map is divided into 4×4 grid resulting in 16178
regions. The coefficients of each region is averaged resulting in 16 features for179
each feature map. The averaged values of all 32 feature maps will result in180
a total of 16×32=512 GIST descriptor. The extracted features are then used181
to train the cubic SVM classifier. The classifier is trained with 250 TP’s and182
896 FP’s images resulted from the VJ algorithm. With 5 fold cross-validation183
scheme, the algorithm resulted with an accuracy of 94.6% in classifying TP’s184
12

and FP’s.185
After applying the GIST descriptor based SVM classification, the FP’s have186
been significantly reduced. But the output of these algorithm will not give the187
complete detection of the diaphragm. For complete detection of the diaphragm,188
active contour-based segmentation [36], active shape modeling (ASM) [50] algo-189
rithms can be is used. ASM model fails due to high nonrigidness in the shape190
of the diaphragm. Hence we employed active contour-based segmentation for191
detecting the entire contour of a diaphragm.192
2.1.5. Active contour based segmentation193
The block diagram representation for the active contour-based segmentation194
is shown in the Fig. 7. Segmenting RoI in ultrasound image poses a lot of diffi-195
culties due to large variations observed in the diaphragm from image to image.196
The Active Contour Model (ACM)[36] helps to obtain closed object contour as a197
segmentation result under the circumstances of noise and poorly defined bound-198
aries. Many variants of active contours like gradient vector flow [51], balloon199
model [52], diffusion snakes [53], active contours with edges [36], geodesic active200
contours [54], etc., have been proposed in the literature for effective segmen-201
tation. In this paper, we employed region-based active contour segmentation202
[36] to segment the diaphragm region. Active contour is an iterative process,203
which detects the contour based on the evolution. For segmenting the image,204
we need to set the initial state of the active contour by initializing the mask205
near to the diaphragm. The output obtained after VJ and GIST feature based206
cubic SVM classifier is used as a mask for initializing the active contour. Curve207
evolution is stopped when there is no further displacement in the curve, or it208
can be stopped forcibly by fixing the number of iterations. In this work, 300209
iterations is needed for complete detection of the diaphragm. The performance210
of the segmentation task is not quantified in this paper since the focus of the211
work is laid in detecting the RoI for the diaphragm which is used for developing212
CAD algorithms. The performance of the active contour-based segmentation213
for diaphragm detection is shown in Fig. 8.214
13

RoI of Diaphragm
Active contour segmentation
Diaphragmdetection
Initailazation
Figure 7: Block diagram representation for the active contour model based segmentation of a
diaphragm.
Figure 8: Diaphragm detection based on active contour segmentation after 300 iterations.
215
2.2. Periportal vein detection216
The algorithm which is used to detect RoI for diaphragm also worked ef-217
fectively in detecting the periportal veins. The segmentation algorithm is not218
employed for periportal vein detection since the entire vein is enclosed inside219
the RoI. Periportal veins are detected in two stages, in the initial stage, VJ220
algorithm is used to detect the periportal veins. The positive training images221
used to train the VJ algorithm is shown in Fig. 9. In general, more than one222
periportal vein vessels will appear in liver ultrasonic images, hence all the vis-223
ible periportal veins are considered in training the VJ algorithm. The size of224
cropped images employed in training the VJ algorithm are in the range of 15225
× 25 to 32 × 42 pixels. The positive training images are extracted by cropping226
the periportal veins corresponding to all grades of fatty liver. We used the same227
negative training images (refer Fig. 5,) which we have used for training the228
14
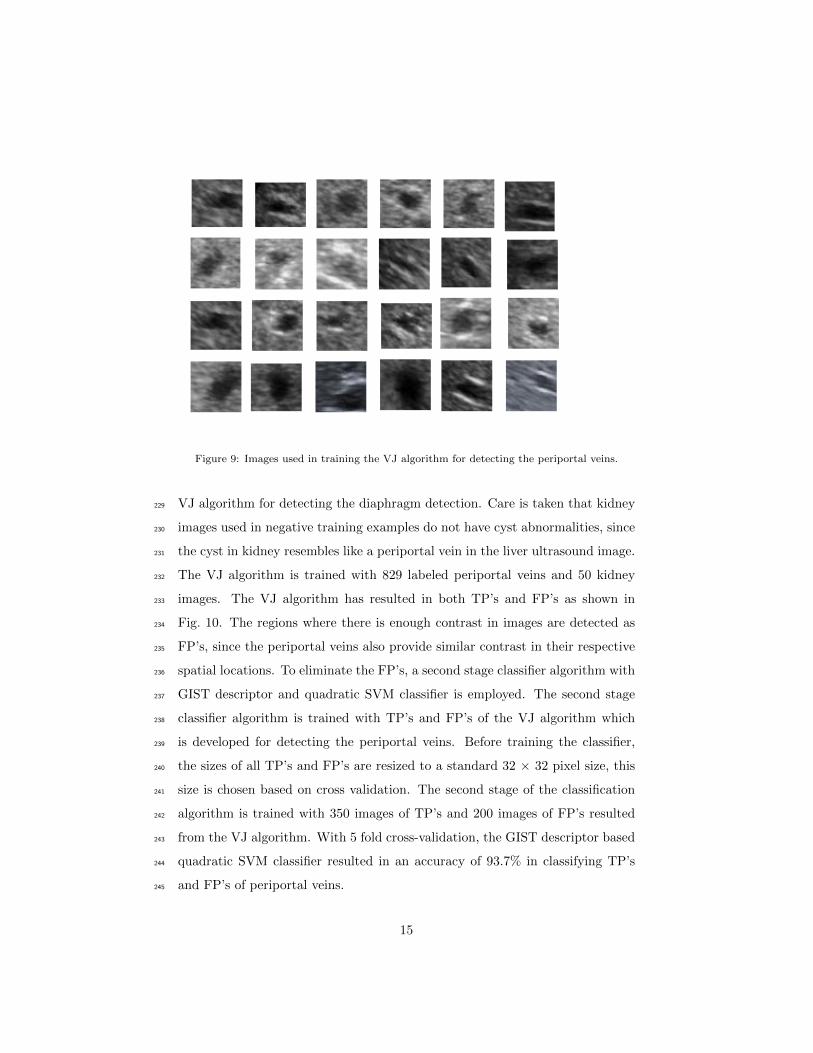
Figure 9: Images used in training the VJ algorithm for detecting the periportal veins.
VJ algorithm for detecting the diaphragm detection. Care is taken that kidney229
images used in negative training examples do not have cyst abnormalities, since230
the cyst in kidney resembles like a periportal vein in the liver ultrasound image.231
The VJ algorithm is trained with 829 labeled periportal veins and 50 kidney232
images. The VJ algorithm has resulted in both TP’s and FP’s as shown in233
Fig. 10. The regions where there is enough contrast in images are detected as234
FP’s, since the periportal veins also provide similar contrast in their respective235
spatial locations. To eliminate the FP’s, a second stage classifier algorithm with236
GIST descriptor and quadratic SVM classifier is employed. The second stage237
classifier algorithm is trained with TP’s and FP’s of the VJ algorithm which238
is developed for detecting the periportal veins. Before training the classifier,239
the sizes of all TP’s and FP’s are resized to a standard 32 × 32 pixel size, this240
size is chosen based on cross validation. The second stage of the classification241
algorithm is trained with 350 images of TP’s and 200 images of FP’s resulted242
from the VJ algorithm. With 5 fold cross-validation, the GIST descriptor based243
quadratic SVM classifier resulted in an accuracy of 93.7% in classifying TP’s244
and FP’s of periportal veins.245
15

Figure 10: Automated periportal vein detection. Red boxes indicates the FP’s and yellow
boxes indicates TP’s. (a), (b) Performance of the VJ algorithm in detecting the periportal
veins. (c), (d) Performance of the algorithm after applying the GIST feature based quadratic
SVM classifier.
16

2.3. Homogeneous texture detection246
The block diagram representation regarding the detection of RoI for homo-247
geneous textures in liver parenchyma is shown in Fig. 11. Since the texture does248
not have any shape specific information, the VJ algorithm performed poorly in249
detecting the RoI in a liver. The liver mainly consists of periportal veins, the250
texture of liver parenchyma and diaphragm. Therefore, the RoI detection for251
homogeneous texture is framed as a binary classification problem, where one252
class belongs to RoI of homogeneous texture regions and another class belongs253
to RoI’s of the diaphragm and periportal veins. The homogeneous texture is254
better represented with histogram features; these include mean, variance, skew-255
ness and kurtosis. The histogram appeared symmetry for homogeneous texture256
and nonsymmetry for nonhomogeneous texture regions giving discriminative257
representation across the homogeneous and nonhomogeneous RoI’s. The ho-258
mogeneous RoI’s in liver parenchyma is detected using a sliding window based259
approach. A window of size 64× 64 with the sliding length of 32 pixels is chosen260
for the analysis. The Gaussian SVM classifier is used to discriminate homo-261
geneous and nonhomogeneous regions based on the histogram features. The262
homogeneous texture patches used in training the classifier is shown in Fig. 12.263
A total of 400 homogeneous textures and 550 diaphragm and periportal images264
extracted from all grades of fatty liver is used in training the Gaussian SVM265
classifier. The sliding window model resulted with 100% accuracy in detecting266
the homogeneous texture regions along with the FP’s. The FP’s are resulted267
due to periportal veins. Since the periportal veins appears as blobs, we elimi-268
nated the FP’s by detecting the blobs in the homogeneous region. This is done269
by using a connected components algorithm [38]. The connected components270
algorithm is applied in the following way. Initially each detected homogeneous271
texture is binarized by setting a threshold to 20. The value 20 is chosen based272
on the cross validation. The pixels with intensity value less than 20 is set to ‘0’,273
while the pixels with intensity greater than or equal to threshold 20 is set to ‘1’.274
Then the number of pixels in each blob is computed by fixing a connectivity to275
6. It is found that we can eliminate all FP’s present in the liver parenchyma276
17

Sliding window Model based Patch extraction
Nonhomogeneous texture patches
Homogeneous texture patches
Histogram feature
extraction
Gaussian SVM
Histogram feature
extraction
Liver Ultrasound
image
RoI's of homogeneous texture (includes TP's and FP's)
RoI's of Homogeneous
texture
Connected Componenets
algorithm
Count the number of pixels in each
blob
Greater than threshold
Less or equal to threshold
RoI eliminated
RoI detected
(a)
(b)
Figure 11: Algorithm for detecting RoI corresponding to homogeneous texture of liver
parenchyma.
whose pixel count in each blob is more than 15. The optimal values for the277
connected components algorithm is chosen based on the experimental analysis.278
The performance of the proposed algorithm in detecting the homogeneous tex-279
tures is shown in Fig. 13. The multiple RoI’s are obtained for the homogeneous280
texture since the parenchyma covers wide area in the liver.281
2.4. SVM classifier282
SVM is a binary classifier, which learns a model that best separates the283
features of two classes [55]. SVM can only work if the features of the classes284
are linearly separable. To work with linearly non-separable data, SVM is op-285
erated with various kernel functions [56]. The kernel function projects the fea-286
tures into higher dimensions where the data becomes linearly separable. In this287
work, we evaluated the performance of the SVM classifier with respect to linear,288
18

Figure 12: Homogeneous texture patches used to train the classifier for RoI detection of
texture.
Figure 13: Performance of the proposed algorithm in detecting RoI for homogeneous patches.
Yellow boxes indicates the RoI of homogeneous texture patterns corresponding to liver
parenchyma.
19
quadratic, cubic and Gaussian kernels. The suitable kernels for the application289
is selected based on the experimental analysis. The inbuilt SVM function avail-290
able in the MATLAB 2017a version is used in the experiment.291
The optimal tuning parameters of different kernels are, for Cubic kernel:292
degree of polynomial=3, for Quadratic kernel: degree of polynomial=2, for293
Gaussian kernel: standard deviation=1. The kernel scale is set to ‘auto’, data294
standardization is set to ‘true’ with iterative single data algorithm as a solver.295
296
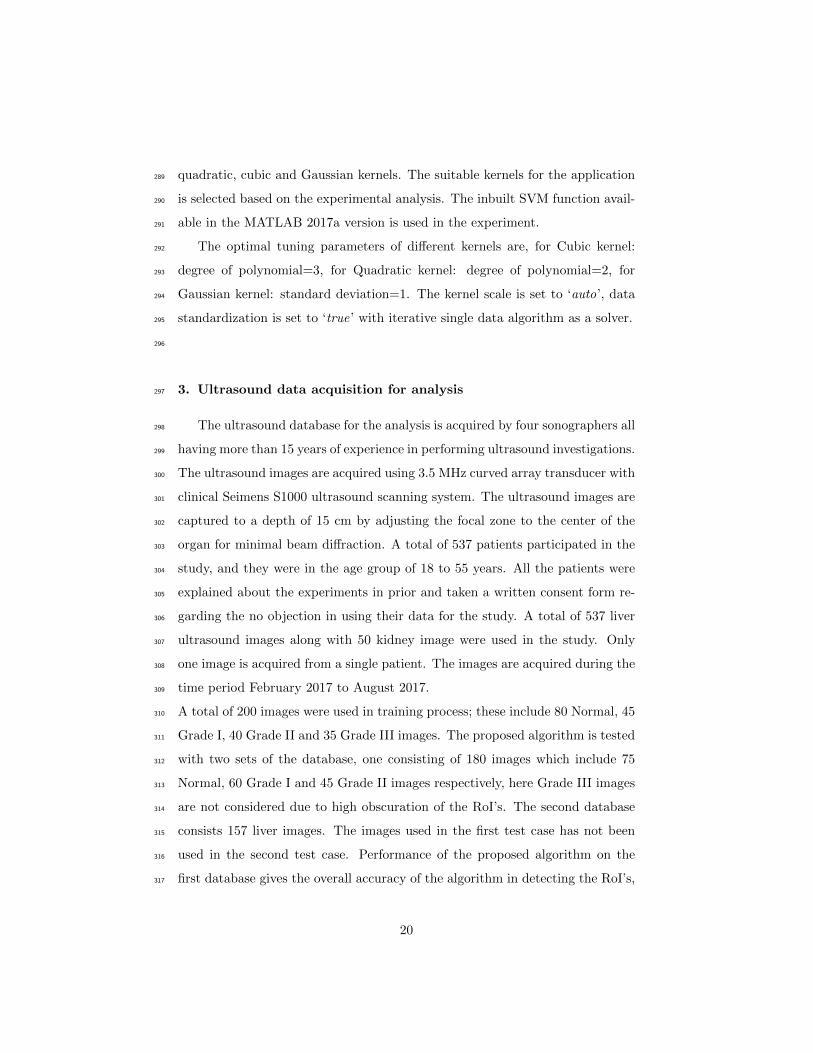
3. Ultrasound data acquisition for analysis297
The ultrasound database for the analysis is acquired by four sonographers all298
having more than 15 years of experience in performing ultrasound investigations.299
The ultrasound images are acquired using 3.5 MHz curved array transducer with300
clinical Seimens S1000 ultrasound scanning system. The ultrasound images are301
captured to a depth of 15 cm by adjusting the focal zone to the center of the302
organ for minimal beam diffraction. A total of 537 patients participated in the303
study, and they were in the age group of 18 to 55 years. All the patients were304
explained about the experiments in prior and taken a written consent form re-305
garding the no objection in using their data for the study. A total of 537 liver306
ultrasound images along with 50 kidney image were used in the study. Only307
one image is acquired from a single patient. The images are acquired during the308
time period February 2017 to August 2017.309
A total of 200 images were used in training process; these include 80 Normal, 45310
Grade I, 40 Grade II and 35 Grade III images. The proposed algorithm is tested311
with two sets of the database, one consisting of 180 images which include 75312
Normal, 60 Grade I and 45 Grade II images respectively, here Grade III images313
are not considered due to high obscuration of the RoI’s. The second database314
consists 157 liver images. The images used in the first test case has not been315
used in the second test case. Performance of the proposed algorithm on the316
first database gives the overall accuracy of the algorithm in detecting the RoI’s,317
20

while testing on the second database gives the performance of the algorithm on318
individual categories corresponding to different grades of fatty liver.319
320
4. Experimental Analysis321
4.1. Statistical analysis of the features322
In this section, we present the statistical analysis of the features correspond323
to RoI’s and nonRoI’s used to train the classifier. The statistical analysis of324
the GIST features corresponding to diaphragm and periportal veins is shown in325
Table. 2. Since the size of GIST features is of 512, which is of high dimension,326
we presented the analysis only for the first 10 features. The mean for most of327
the GIST features corresponding to the TP’s of the diaphragm is higher than328
that of the FP’s resulted from the VJ algorithm and the standard deviation for329
the GIST features of FP’s is observed to be low compared to the TP’s of the330
VJ algorithm. For periportal veins, a clear distinction between the mean of the331
GIST features of TP’s and FP’s resulted from the VJ algorithm is observed.332
Similar to the diaphragm, the low standard deviation is observed in the GIST333
features of FP’s compared to the TP’s of the VJ algorithm. The similar trend is334
observed for rest of the GIST features. The mean and standard deviation of the335
histogram features extracted from homogeneous and nonhomogeneous regions336
is shown in Table. 3. The mean of histogram features for a homogeneous region337
is observed to be significantly lower than that of nonhomogenous histogram338
features and low standard deviation of the features is observed in histogram339
features of the homogeneous region compared to the nonhomogeneous region.340
341
4.2. Performance analysis342
In this section, we present the performance of the proposed algorithm for de-343
tecting each RoI. The VJ algorithm is trained by setting the following parame-344
ters: number of cascade classifiers=5, merge threshold=80, window enlargement345
in each step is set to 1.1 with sliding window shifted by one pixel.346
21

Table 2: Mean and Standard deviation (Std) of the first ten GIST features of TP’s and FP’s
of the diaphragm and periportal veins detected from VJ algorithm.
RoI of Diaphragm RoI of periportal veins
TP’s FP’s TP’s FP’s
No Mean Std Mean Std Mean Std Mean Std
1 0.0245 0.0074 0.0206 0.0001 0.0385 0.0156 0.0503 0.0007
2 0.0253 0.0062 0.0205 0.0002 0.0452 0.0221 0.0373 0.0002
3 0.0204 0.0066 0.0183 0.0003 0.0829 0.0360 0.0427 0.0004
4 0.0196 0.0048 0.0204 0.0002 0.0613 0.0322 0.0491 0.0006
5 0.0133 0.0032 0.0200 0.0001 0.1774 0.0695 0.0654 0.0014
6 0.0305 0.0075 0.0228 0.0002 0.0674 0.0337 0.0946 0.0011
7 0.0470 0.0106 0.0374 0.0001 0.1418 0.0661 0.0962 0.0031
8 0.0524 0.0124 0.0439 0.0004 0.0701 0.0272 0.0761 0.0015
9 0.0602 0.0372 0.0373 0.0002 0.0657 0.0213 0.0694 0.0018
10 0.0744 0.0199 0.0695 0.0002 0.0415 0.0222 0.0489 0.0006
Table 3: Mean and standard deviation of histogram features correspond to homogeneous and
nonhomogeneous RoI.
Homogeneous
RoI
Nonhomogeneous
RoI
Features Mean Std Mean Std
Mean 0.2669 0.0478 0.3283 0.0659
variance 0.0079 0.0039 0.0340 0.0068
Skewness 0.6886 0.1938 1.2168 0.2566
Kurtosis 2.6839 0.7465 3.8265 0.7945
22

The VJ algorithm detects the RoI using sliding window approach due to347
which multiple detections will occur for each RoI. The multiple detections are348
eliminated by merging all the overlapped detections by taking an average for349
the coordinates of detected RoI’s. Decreasing the merge threshold increased the350
number of FP’s along with TP’s and vice-versa. The optimal merge threshold351
of 80 is chosen based on the experimental analysis. The VJ algorithm used 7,352
9, 11, 13 and 19 features at each stage of cascaded classifiers respectively. The353
performance of the proposed algorithm in detecting RoI for a diaphragm when354
VJ algorithm trained with different false alarm rates is shown in Table. 4. The355
algorithm is tested on 180 liver ultrasound images. The maximum classification356
accuracy of 97% is obtained at a false alarm rate of 0.5. Here the VJ algorithm357
detected the diaphragm with an accuracy of 98.2% with 450 FP’s, after applying358
the GIST based cubic SVM classifier, FP’s has been significantly reduced to 113.359
360
The performance of the proposed algorithm in detecting the periportal veins361
is shown in Table. 5. The VJ algorithm used 7, 8, 10, 11 and 14 features362
in each cascaded stage respectively. The optimal trade-off between TP’s and363
FP’s is obtained at a merge threshold of 50. The proposed algorithm detected364
periportal veins with a maximum accuracy of 91% for the VJ algorithm when365
trained with a false alarm rate of 0.5. The VJ algortithm detected periportal366
veins with a maximum accuracy of 96% with 425 FP’s. After applying GIST367
descriptor with quadratic SVM classifier, the number of FP’s have significantly368
reduced to 43, which in turn also reduced the overall detection accuracy of369
periportal veins from 96% to 91%.370
The histogram based Gaussian SVM classifier detected the RoI for homoge-371
neous texture with 100% accuracy. The algorithm resulted with multiple RoI’s372
for homogeneous textures along with FP’s. The FP’s are completely removed373
using the connected components algorithm.374
23

Table 4: The accuracy of the proposed algorithm for detecting the RoI of a diaphragm.
False
alarm rate
Performance of Viola Jones
algorithm
Performance of the algorithm after applying
GIST descriptor + cubic SVM classifier
Accuracy(%) FP’s Accuracy(%) FP’s
0.1 91.0 160 85.0 14
0.2 93.5 194 87.4 21
0.3 94.7 260 89.7 44
0.4 96.0 390 96.0 78
0.5 98.2 450 97.0 113
Table 5: Accuracy of the proposed algorithm in detecting the periportal veins
False alarm
rate
Performance of
Viola Jones algorithm
Performance of the algorithm after applying
GIST descriptor + Quadratic SVM classifier
Accuracy
(%)
False
Positive
Accuracy
(%)
False
Positive
0.1 89.7 84 84.0 9
0.2 91.7 131 87.0 15
0.3 93.0 141 89.6 16
0.4 94.9 314 90.7 25
0.5 96.0 425 91.0 43
Table 6: Accuracy of the proposed algorithm in detecting the RoI’s with respect to different
grades of fatty liver.
Category Database Diaphragm (%) Periportal veins (%)
Normal 48 97.5 93.7
Grade I 33 95.5 92.3
Grade II 45 93.2 90.8
Grade III 31 65.7 80.3
24

4.3. Performance of the proposed algorithm with respect to different grades of375
fatty liver.376
The performance of the proposed algorithm in detecting the RoI with respect377
to different grades of fatty liver is presented in this section. The liver ultrasound378
images correspond to different grades of fatty liver used in testing the proposed379
algorithm is shown in Fig. 14. The database consisted of 157 ultrasound images380
which include 48 normal, 33 Grade I, 45 Grade II and 31 Grade III images. For381
Normal, Grade I and Grade II images, the diaphragm and periportal veins are382
visible or partially visible to the normal eye. For 31 images of Grade III fatty383
liver, only for 15 images the diaphragm and periportal veins are partially visible,384
whereas for other images diaphragm and periportal veins are totally obscured385
and is not visible to the human eye. The accuracy of the proposed algorithm386
corresponding to different grades of the fatty liver is shown in Table. 6. The387
proposed algorithm detected diaphragm and periportal veins of the normal liver388
with an accuracy of 97.5% and 93.7% respectively. The accuracy of detecting389
diaphragm and periportal veins get reduced with an increase in the severity of390
the fat which resulted in obscuration of RoI. Even there is a high obscuration391
of RoI for Grade III fatty liver, the proposed algorithm detected diaphragm392
and periportal veins with an accuracy of 65.7% and 80.3% respectively. The393
classification accuracy is only computed for the images where diaphragms and394
periportal veins are perceivable to the human eye. For the images where di-395
aphragm and periportal veins are not visible, the algorithm did not detect any396
RoI in the region with zero FP’s. The proposed algorithm detected RoI for397
homogeneous patches with a 100% accuracy for all the liver ultrasound images.398
Since the organ boundaries are not visible in Grade III fatty liver ultrasound399
images, the RoI’s detected outside the liver image is not recognizable. The brief400
remarks regarding the performance of the proposed algorithm in detecting each401
RoI is discussed in Table. 7. The result of the proposed algorithm in detecting402
the diaphragm, periportal veins and homogeneous texture of liver parenchyma403
is shown in Fig. 15.404
The experiments are performed on a Windows desktop computer with Intel405
25

Table 7: A brief summary regarding the performance of the proposed algorithm in detecting
each RoI.
RoI detection Remarks
Diaphragm
The bounding boxes enclosing some part of the diaphragm is detected using
the VJ and GIST descriptor based cubic SVM classifier. The detected RoI is
then used to initialize the active contour algorithm to detect the entire diaphragm.
The bounding box position of RoI enclosing the diaphragm did not have an
effect in detecting the entire contour of diaphragm since the active contour algorithm
tends to capture the strong edges. The accuracy of detecting diaphragm decreased
with increase in severity of fat in the liver due to obscuration of diaphragm.
Periportal
veins
The bounding boxes enclosing periportal veins is detected using the VJ and GIST
descriptor based quadratic SVM classifier. All the detected RoI’s are completely
enclosed within the RoI. The accuracy of detecting periportal veins decreased with
increase in severity of fat in the liver due to obscuration of periportal veins.
Homogeneous
texture
The RoI’s are detected using the combination of histogram features based Gaussian
SVM classifier and connected components algorithm. The algorithm resulted
in multiple overlapping RoI’s, and the end user can select an appropriate number of
RoI’s depending on the application. The accuracy of detecting RoI for homogeneous
texture did not effected with the severity of fat present in the liver.
26

Normal
Grade I
Grade II
Grade III
Figure 14: Images correspond to different grades of fatty liver. Images in each row belongs to
single category.
27

Figure 15: Performance of the proposed algorithm in detecting the RoI’s. The region enclosed
with red color represents the diaphragm, green boxes indicate the detection of periportal veins
and blue boxes indicates the RoI of a homogeneous texture.
Core i7 processor, 16 GB RAM running with 2.8 GHz clock using MATLAB406
2017a version. For an image of size 500 × 650, the algorithm took approximately407
2.42 s for detecting RoI of a diaphragm, 2.5 s for segmenting the diaphragm after408
initialization, 4.3 s for periportal detection and 2.3 s for homogeneous texture409
detection. The algorithm took approximately 9 s for detecting multiple RoI’s.410
5. Discussion and conclusion411
In this paper, we proposed a multi-model framework for automatic detection412
of diagnostically significant regions of fatty liver namely diaphragm, periportal413
veins and homogeneous texture in ultrasonic liver images. Since the character-414
istics of these regions vary with the fatty content of the liver, it poses a serious415
challenge in detecting these regions. The proposed algorithm detected the di-416
aphragm, periportal veins and homogeneous texture of liver with an accuracy417
of 97%, 91% and 100% respectively. The accuracy of the proposed algorithm in418
detecting the RoI’s in fatty liver decreased with increase in the severity of fat419
in the liver, this is justifiable since the visibility of diaphragm and periportal420
veins reduces with the severity of the disease. In literature, computer-aided421
algorithms developed for diagnosing the fatty liver involves manual intervention422
to crop the RoI’s, hence making the algorithms semi-automated. The proposed423
algorithm eliminates the need for manual intervention by detecting the RoI’s424
28
automatically, which can be used to develop accurate and automated diagnos-425
tic algorithms. The proposed algorithm benefits the sonographers to diagnose426
more number of patients by reducing the time needed to locate RoI’s in the427
ultrasound image. As an extension of this work, we will work towards the de-428
velopment of automated algorithms for quantifying the fat in the liver based on429
detected RoI’s.430
References431
[1] Takahashi, Yoshihisa, and Toshio Fukusato. Histopathology of nonalcoholic432
fatty liver disease/nonalcoholic steatohepatitis. World journal of gastroen-433
terology: WJG 2014;20(42):15539.434
[2] Bellentani, Stefano, Federica Scaglioni, Mariano Marino, and Giorgio435
Bedogni. Epidemiology of non-alcoholic fatty liver disease. Digestive diseases436
2010;28(1):155-161.437
[3] Marchesini, Giulio, Mara Brizi, Antonio M. Morselli-Labate, Giampaolo438
Bianchi, Elisabetta Bugianesi, Arthur J. McCullough, Gabriele Forlani, and439
Nazario Melchionda. Association of nonalcoholic fatty liver disease with in-440
sulin resistance.” The American journal of medicine 1999; 107(5):450-455.441
[4] Brunt, Elizabeth M., Christine G. Janney, Adrian M. Di Bisceglie, Brent442
A. Neuschwander-Tetri, and Bruce R. Bacon. Nonalcoholic steatohepatitis:443
a proposal for grading and staging the histological lesions. The American444
journal of gastroenterology 1999; 94(9):2467-2474.445
[5] Lee, Seung Soo, and Seong Ho Park. Radiologic evaluation of nonalco-446
holic fatty liver disease. World journal of gastroenterology: WJG447
2014;20(23):7392.448
[6] Goceri, Evgin, Zarine K. Shah, Rick Layman, Xia Jiang, and Metin N.449
Gurcan. Quantification of liver fat: A comprehensive review. Computers in450
biology and medicine 2016;71:174-189451
29

[7] Hernaez, Ruben, Mariana Lazo, Susanne Bonekamp, Ihab Kamel, Frederick452
L. Brancati, Eliseo Guallar, and Jeanne M. Clark. Diagnostic accuracy and453
reliability of ultrasonography for the detection of fatty liver: A metaanalysis.454
Hepatology 2011; 54(3):1082-1090.455
[8] Allan, Richard, Kerry Thoirs, and Maureen Phillips. Accuracy of ultrasound456
to identify chronic liver disease. World Journal of Gastroenterology: WJG457
2010;16(28):3510.458
[9] Strauss, S., Gavish, E., Gottlieb, P., & Katsnelson, L.Interobserver and in-459
traobserver variability in the sonographic assessment of fatty liver. American460
Journal of Roentgenology 2007;189(6):320-323.461
[10] Bharti, Puja, Deepti Mittal, and Rupa Ananthasivan. Computer-aided462
Characterization and Diagnosis of Diffuse Liver Diseases Based on Ultrsound463
Imaging: A Review. Ultrasonic imaging 2017;39(1):33-61.464
[11] Alivar, Alaleh, Habibollah Danyali, and Mohammad Sadegh Helfroush. Hi-465
erarchical classification of normal, fatty and heterogeneous liver diseases466
from ultrasound images using serial and parallel feature fusion.” Biocyber-467
netics and Biomedical Engineering 2016;36(4):697-707.468
[12] Biswas, Mainak, Venkatanareshbabu Kuppili, Damodar Reddy Edla, Har-469
man S. Suri, Luca Saba, Rui Tato Marinhoe, J. Miguel Sanches, and Jasjit470
S.Suri. Symtosis: A liver ultrasound tissue characterization and risk strati-471
fication in optimized deep learning paradigm. Computer methods and pro-472
grams in biomedicine 2018;155:165-177.473
[13] Badawi, Ahmed M., Ahmed S. Derbala, and Abou-Bakr M. Youssef. Fuzzy474
logic algorithm for quantitative tissue characterization of diffuse liver dis-475
eases from ultrasound images. International Journal of Medical Informatics476
1999; 55(2):135-147.477
[14] Kyriacou, E., Pavlopoulos, S., Konnis, G., Koutsouris, D., Zoumpoulis,478
P. and Theotokas, L.r. Computer assisted characterization of diffused liver479
30

disease using image texture analysis techniques on B-scan images. In Nuclear480
Science Symposium IEEE 1997;(2):1479-1483.481
[15] Acharya, U. Rajendra, S. Vinitha Sree, Ricardo Ribeiro, Ganapathy Krish-482
namurthi, Rui Tato Marinho, Joo Sanches, and Jasjit S. Suri. Data mining483
framework for fatty liver disease classification in ultrasound: a hybrid feature484
extraction paradigm. Medical physics 2012;39(7Part1): 4255-4264.485
[16] Pavlopoulos, S., E. Kyriacou, D. Koutsouris, K. Blekas, A. Stafylopatis,486
and P. Zoumpoulis. Fuzzy neural network-based texture analysis of ul-487
trasonic images. IEEE Engineering in Medicine and Biology Magazine488
2000;19(1):39-47.489
[17] Acharya, U. Rajendra, Joel En Wei Koh, Yuki Hagiwara, Jen Hong Tan,490
Arkadiusz Gertych, Anushya Vijayananthan, Nur Adura Yaakup, Basri Jo-491
han Jeet Abdullah, Mohd Kamil Bin Mohd Fabell, and Chai Hong Yeong.492
Automated diagnosis of focal liver lesions using bidirectional empirical mode493
decomposition features. Computers in Biology and Medicine 2018.494
[18] Wu, Cheng-Chi, Wen-Li Lee, Yung-Chang Chen, and Kai-Sheng Hsieh.495
Evolution-based hierarchical feature fusion for ultrasonic liver tissue char-496
acterization. IEEE journal of biomedical and health informatics 2013;497
17(5):967-976.498
[19] Singh, Mandeep, Sukhwinder Singh, and Savita Gupta. An information fu-499
sion based method for liver classification using texture analysis of ultrasound500
images.” Information Fusion 2014;19:91-96.501
[20] Liao, Yin-Yin, Kuen-Cheh Yang, Ming-Ju Lee, Kuo-Chin Huang, Jin-De502
Chen, and Chih-Kuang Yeh. Multifeature analysis of an ultrasound quantita-503
tive diagnostic index for classifying nonalcoholic fatty liver disease. Scientific504
reports 2016;6.505
[21] L. Laura, W. Rachel, T. Emmanuel. Metabolic and cardiovascular compli-506
cations in the liver transplant recipient,” Ann . Gastroenterol 2015;28:111.507
31

[22] V. Khullar, A. Dolganiuc, R. J. Firpi. Pre-and-post transplant consider-508
ations in patients with nonalcoholic fatty liver disease. World J.Transpl.509
2014;4(2):8192.510
[23] Bharath, R., Pradeep Kumar Mishra, and P. Rajalakshmi. Automated511
quantification of ultrasonic fatty liver texture based on curvelet transform512
and SVD.” Biocybernetics and Biomedical Engineering 2017.513
[24] R. Bharath and P. Rajalakshmi. Deep scattering convolution network based514
features for ultrasonic fatty liver tissue characterization. In Engineering in515
Medicine and Biology Society (EMBC), 39th Annual International Confer-516
ence of the IEEE 2017;1982-1985.517
[25] Lupsor, M., R. Badea, C. Vica, S. Nedevschi, M. Grigorescu, C. Radu,518
H. Stefanescu, and D. Crisan. Non-invasive steatosis assessment in NASH519
through the computerized processing of ultrasound images: Attenuation520
versus textural parameters. In Automation Quality and Testing Robotics521
(AQTR), IEEE International Conference on 2010;2:1-6.522
[26] Ier, Semra, Abdulhakim Cokun, and Trkan kizceli. Quantitative grading523
using grey relational analysis on ultrasonographic images of a fatty liver.524
Journal of medical systems 2012;36(4):2521-2528.525
[27] Mihailescu, Dan Mihai, Vasile Gui, Corneliu Ioan Toma, Alina Popescu,526
and Ioan Sporea. Automatic evaluation of steatosis by ultrasound image527
analysis. In Electronics and Telecommunications (ISETC), 10th Interna-528
tional Symposium on, IEEE, 2012:311-314.529
[28] Vicas, Cristian, Sergiu Nedevschi, Monica Lupsor, and Radu Badea. Auto-530
matic detection of liver capsule using Gabor filters. Applications in steato-531
sis quantification. In Intelligent Computer Communication and Processing,532
IEEE 5th International Conference on, IEEE, 2009:133-140.533
[29] Acharya, U. Rajendra, Hamido Fujita, Shreya Bhat, U. Raghavendra, An-534
jan Gudigar, Filippo Molinari, Anushya Vijayananthan, and Kwan Hoong535
32

Ng. Decision support system for fatty liver disease using GIST descriptors536
extracted from ultrasound images. Information Fusion 2016;29:32-39.537
[30] Acharya, U. Rajendra, U. Raghavendra, Hamido Fujita, Yuki Hagi-538
wara,Joel EW Koh, Tan Jen Hong, Vidya K. Sudarshan et al. Automated539
characterization of fatty liver disease and cirrhosis using curvelet transform540
and entropy features extracted from ultrasound images. Computers in biol-541
ogy and medicine 2016;79:250-258.542
[31] Acharya, U. Rajendra, Oliver Faust, Filippo Molinari, S. Vinitha Sree,543
Sameer P. Junnarkar, and Vidya Sudarshan. Ultrasound-based tissue charac-544
terization and classification of fatty liver disease: A screening and diagnostic545
paradigm. Knowledge-Based Systems 2015;75:66-77.546
[32] Acharya, U.R., Fujita, H., Sudarshan, V.K., Mookiah, M.R.K., Koh,547
J.E.,Tan, J.H., Hagiwara, Y., Chua, C.K., Junnarkar, S.P., Vijayananthan,548
A. and Ng, K.H. An integrated index for identification of fatty liver disease549
using radon transform and discrete cosine transform features in ultrasound550
images. Information Fusion 2016;31:43-53.551
[33] Singh, Divya, Chandan J. Das, and Manas P. Baruah. Imaging of non alco-552
holic fatty liver disease: A road less travelled. Indian journal of endocrinology553
and metabolism 2013;17(6):990.554
[34] Viola, Paul, and Michael J. Jones. Robust real-time face detection. Inter-555
national journal of computer vision 2004; 57(2):137-154.556
[35] Oliva, Aude, and Antonio Torralba. Modeling the shape of the scene: A557
holistic representation of the spatial envelope. International journal of com-558
puter vision 2001;42(3):145-175.559
[36] Chan, Tony F., and Luminita A. Vese. Active contours without edges. IEEE560
Transactions on image processing 2001:10(2):266-277561
[37] Kass, Michael, Andrew Witkin, and Demetri Terzopoulos. Snakes: Active562
contour models. International journal of computer vision 1988; 1(4):321-331.563
33

[38] Haralock, Robert M., and Linda G. Shapiro. Computer and robot vision.564
Addison-Wesley Longman Publishing Co., Inc., 1991.565
[39] Sarwal, Aarti, Francis O. Walker, and Michael S. Cartwright. Neuromus-566
cular ultrasound for evaluation of the diaphragm. Muscle & nerve 2013;567
47(3):319-329.568
[40] Chu C, Bai J, Liu L, Wu X, Zheng G. Fully automatic segmentation of hip569
CT images via random forest regression-based Atlas selection and optimal570
graph search-based surface detection. In Asian Conference on Computer571
Vision Springer, Cham 2014;1:640-654.572
[41] Bharath, R., Punit Kumar, Chandrashekar Dusa, Vivek Akkala, Suresh573
Puli, Harsha Ponduri, K. Divya Krishna et al. FPGA-Based Portable Ul-574
trasound Scanning System with Automatic Kidney Detection. Journal of575
Imaging 2015; 1(1):193-219.576
[42] Bharath, R., Pallavi Vaish, and P. Rajalakshmi. Implementation of di-577
agnostically driven compression algorithms via WebRTC for IoT enabled578
tele-sonography. In Biomedical Engineering and Sciences (IECBES), IEEE579
EMBS Conference on, IEEE 2016:204-209.580
[43] ha K, Maek J, Burget R, Bene R, Zvodn E. Novel method for local-581
ization of common carotid artery transverse section in ultrasound images582
using modified Viola-Jones detector. Ultrasound in medicine & biology583
2013;39(10):1887-902.584
[44] Wang, Yi-Qing. An analysis of the Viola-Jones face detection algorithm.585
Image Processing On Line 2014;4:128-148.586
[45] Simard, Patrice, Lon Bottou, Patrick Haffner, and Yann LeCun. Boxlets:587
a fast convolution algorithm for signal processing and neural networks. In588
Advances in Neural Information Processing Systems 1999; 571-577.589
34

[46] Freund, Yoav, and Robert E. Schapire. A desicion-theoretic generalization590
of on-line learning and an application to boosting. In European conference591
on computational learning theory, Springer, Berlin, Heidelberg, 1995:23-37.592
[47] Dalal, Navneet, and Bill Triggs. Histograms of oriented gradients for human593
detection. In Computer Vision and Pattern Recognition, CVPR 2005. IEEE594
Computer Society Conference on 2005;1:886-893.595
[48] Douze M, Jgou H, Sandhawalia H, Amsaleg L, Schmid C. Evaluation of596
gist descriptors for web-scale image search. In Proceedings of the ACM In-597
ternational Conference on Image and Video Retrieval 2009:19598
[49] Oliva A. Gist of the scene. Neurobiology of attention. 2005;696(64):251-8.599
[50] Cootes, Timothy F., Andrew Hill, Christopher J. Taylor, and Jane Haslam.600
Use of active shape models for locating structures in medical images. Image601
and vision computing 1994;12(6):355-365.602
[51] Xu, Chenyang, and Jerry L. Prince. Snakes, shapes, and gradient vector603
flow. IEEE Transactions on image processing 1998;7(3):359-369.604
[52] Cohen, Laurent D. On active contour models and balloons. CVGIP: Image605
understanding 1991; 53(2):211-218.606
[53] 53. Cremers, Daniel, Christoph Schnorr, and Joachim Weickert. Diffusion607
snakes: combining statistical shape knowledge and image information in a608
variational framework. In Variational and Level Set Methods in Computer609
Vision, 2001. Proceedings. IEEE Workshop on;137-144.610
[54] Caselles, Vicent, Ron Kimmel, and Guillermo Sapiro. Geodesic active con-611
tours. International journal of computer vision 1997;22(1): 61-79.612
[55] Chang, Chih-Chung, and Chih-Jen Lin. LIBSVM: a library for support613
vector machines. ACM transactions on intelligent systems and technology614
(TIST) 2011;2(3):27.615
35

[56] Schlkopf, Bernhard, and Alexander J. Smola. Learning with kernels: sup-616
port vector machines, regularization, optimization, and beyond. MIT press,617
2002.618
36