m/s. y. saran kumar reddy - welcome to...
TRANSCRIPT
Y. SARAN KUMAR REDDY-EMP Sep’
2016
ENVIRONMENTAL MANAGEMENT PLAN
For
MINING LEASE FOR SILICA SAND
(12.476 Ha or 30.83 Ac)
of
M/s. Y. SARAN KUMAR REDDY Managing Partner: Y. SARAN KUMAR REDDY
Sy.No. 793/B & 796/B
KOTHAPATNAM (V), KOTA (M),
SPSR NELLORE DISTRICT
ANDHRA PRADESH
SUBMITTED TO
STATE LEVEL ENVIRONMENTAL IMPACT
ASSESSMENT AUTHORITY
ANDHRA PRADESH, GOVERNMENT OF INDIA
Y. Saran Kumar Reddy-EMP SEPTEMBER
2016
1
1. INTRODUCTION
Silica Sand mining is one of the important mining industries that are needed for molding
industry for automobile engine casting and also for glass industry. This Silica Sand is available
site specific. The inherent purity of this Silica Sand makes this a vulnerably need raw material
for both the above industries mentioned. The demand for this material can be easily assessed
with the growth in the motor industry which is expanding very rapidly and with the
improvements in style of living which reflects the usage of glass ware for different purposes.
Though plastics could replace most of the glassware utilities, some are exceptionally prepared
by glass only.
Silica sand forms the major ingredient among natural raw materials required for glass making
and it is also used in foundry, ferro-silica alloy and cement industries besides being used in
many other industries like ceramic, fertilizer, abrasives, chemical, coal washery, electrode,
paint, rubber, textile, water filtration, construction etc. The natural silica sand is preferred in
glass industries, but in cases when silica deposits are located far away, crushed quartz is used.
Silica sand deposits are widely spread over a span of 110 km2 area east of Gudur town in
Nellore district of Andhra Pradesh.
Technical assessment of viability of project is submitted in PFR. This document uses the data
available in PFR and focuses more on the environmental aspects of the work process, the
present condition, possible damage (Cumulative), present socio economic conditions and
future, and the suggested mitigation measures. Further, submission of Environmental
Management Plan (hereinafter called as EMP) is a pre-requisite attachment while submitting
Form-I, Standard Template, along with PFR for obtaining prior Environmental Clearance
(Hereinafter called EC) for the silica mines.
It is pertinent to mention that the Silica Sand projects are running in this area since decades.
Some of the mines are as old as 30 years. However they are not running continuously due to
fluctuating demand. It is to say that the Silica Sand mining in this area is not a new process but
is existing since long.

Y. Saran Kumar Reddy-EMP SEPTEMBER
2016
2
Silica sand deposits are widely spread over in the study area and as per reports of Indian
Bureau of Mines, the Silica Sand deposits of the study area can be compared with those of
Langholme sand mine in Humberside of United Kingdom (IBM, 1993). As per government
reports, number of mining leases are 74 covering an area of 1202.51 Hectares (IBM, 2012) in
Nellore district. The list provided by the AD Mines Department of Govt. of AP reveals that a
total of 1218.63 ha of area are under mining operated with 77 leases in the SA (AD Mines,
2014).
In the region of Kota and Chillakur mandals more than 21 Sona Kaluvas are reported, and most
of these are channelized for agricultural use in the villages of the SR. CGWB (2013) and are
developed through shallow dug wells, filter point wells and tube wells. The depth of dug wells
ranges from 5 to 12 m, while the depth of filter point wells generally varies from 6 to 11 m.
The yields generally range in this aquifer between 500 to 1000 m3/day.
As explained above the local agricultural and drinking water needs were met from the spring
channels and dug-wells. The locals those who are dependent on these systems for their
agricultural and drinking water needs claimed that the water levels in the wells as well as the
spring channels has come down due to hectic mining activity. The committee received
voluntary representations from the following two parties.
Subsequently the SEAC (State Expert Appraisal Committee) Government of Andhra Pradesh
formed a Sub-Committee of its members and got the study of the area done. The sub-
committee submitted their report with detailed ambient conditions of different environmental
elements like air, water, social conditions etc. The report reflected more on the hydrology of
the area which is clearly explained in approved mining plan.
The SEAC (State Expert Appraisal Committee) made certain specific recommendations in
respect of the mining operations of the individual mine. Meanwhile the MoEF & CC had
issued guidelines needing EC for the silica mines covered under cluster. To fulfill the
requirements of the said order the present EMP is prepared and being submitted.

Y. Saran Kumar Reddy-EMP SEPTEMBER
2016
3
2. SITE DETAILS
TABLE-I: DETAILS OF BOUNDARY GPS VALUES
Boundary Points North East
1 14° 9'46.0"N 80° 7'8.8"E
2 14° 9'43.3"N 80° 7'10.5"E
3 14° 9'43.6"N 80° 7'18.5"E
4 14° 9'39.6"N 80° 7'18.4"E
5 14° 9'40.2"N 80° 7'23.4"E
6 14° 9'36.4"N 80° 7'24.1"E
7 14° 9'32.9"N 80° 7'21.2"E
8 14° 9'35.0"N 80° 7'16.0"E
9 14° 9'26.4"N 80° 7'14.2"E
10 14° 9'29.6"N 80° 7'13.3"E
11 14° 9'32.6"N 80° 7'12.5"E
12 14° 9'32.3"N 80° 7'10.9"E
13 14° 9'35.2"N 80° 7'9.5"E
14 14° 9'37.2"N 80° 7'9.1"E
15 14° 9'37.6"N 80° 7'11.2"E
16 14° 9'47.2"N 80° 7'8.3"E
GOOGLE MAP
Y. Saran Kumar Reddy-EMP SEPTEMBER
2016
4
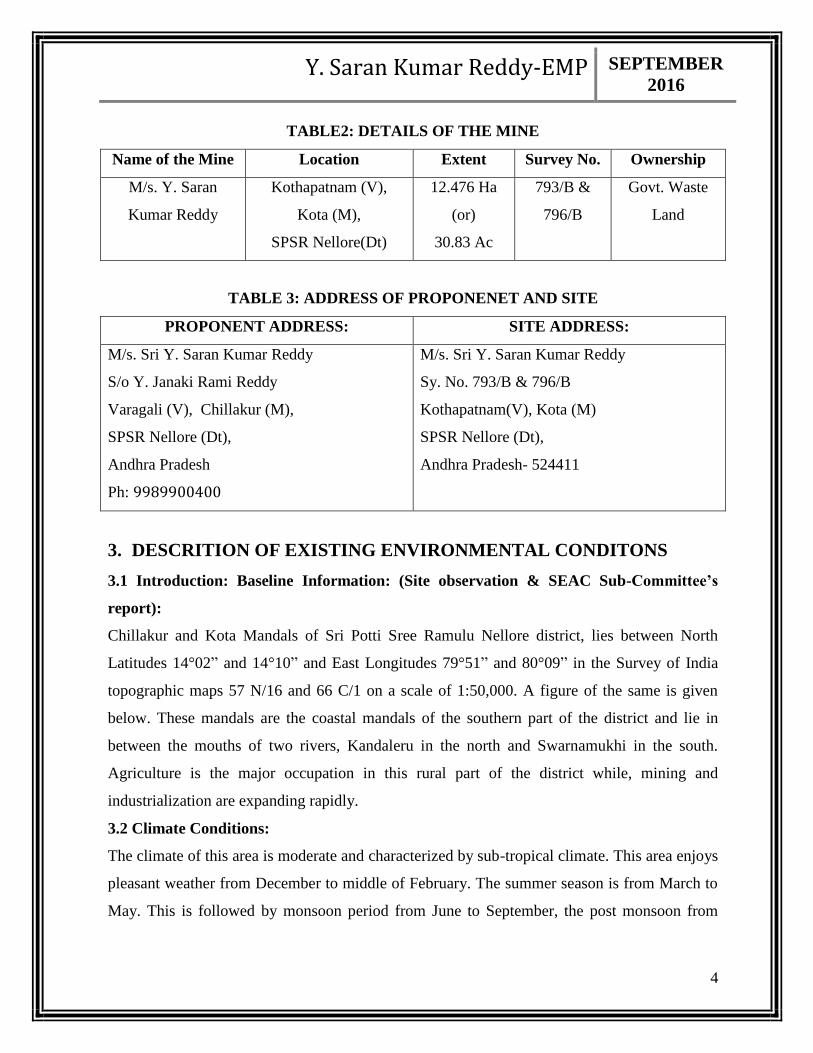
TABLE2: DETAILS OF THE MINE
Name of the Mine Location Extent Survey No. Ownership
M/s. Y. Saran
Kumar Reddy
Kothapatnam (V),
Kota (M),
SPSR Nellore(Dt)
12.476 Ha
(or)
30.83 Ac
793/B &
796/B
Govt. Waste
Land
TABLE 3: ADDRESS OF PROPONENET AND SITE
PROPONENT ADDRESS: SITE ADDRESS:
M/s. Sri Y. Saran Kumar Reddy
S/o Y. Janaki Rami Reddy
Varagali (V), Chillakur (M),
SPSR Nellore (Dt),
Andhra Pradesh
Ph: 9989900400
M/s. Sri Y. Saran Kumar Reddy
Sy. No. 793/B & 796/B
Kothapatnam(V), Kota (M)
SPSR Nellore (Dt),
Andhra Pradesh- 524411
3. DESCRITION OF EXISTING ENVIRONMENTAL CONDITONS
3.1 Introduction: Baseline Information: (Site observation & SEAC Sub-Committee’s
report):
Chillakur and Kota Mandals of Sri Potti Sree Ramulu Nellore district, lies between North
Latitudes 14°02” and 14°10” and East Longitudes 79°51” and 80°09” in the Survey of India
topographic maps 57 N/16 and 66 C/1 on a scale of 1:50,000. A figure of the same is given
below. These mandals are the coastal mandals of the southern part of the district and lie in
between the mouths of two rivers, Kandaleru in the north and Swarnamukhi in the south.
Agriculture is the major occupation in this rural part of the district while, mining and
industrialization are expanding rapidly.
3.2 Climate Conditions:
The climate of this area is moderate and characterized by sub-tropical climate. This area enjoys
pleasant weather from December to middle of February. The summer season is from March to
May. This is followed by monsoon period from June to September, the post monsoon from
Y. Saran Kumar Reddy-EMP SEPTEMBER
2016
5
October to December and the winter season from January to February. The annual normal
rainfall of the district is 1084 mm.
In this area contribution of SW monsoon is far less than the contribution of NE monsoon
rainfall. About 70% of the annual rainfall is contributed by the NE monsoon. In general the
amount of rainfall is increases from west to east about 900 to 1300 mm in the district. The
mining area being nearer to the coast this area experiences higher rainfall.
The mean daily maximum temperature in the district is about 38°C in May and the mean daily
minimum temperature is about 20°C in December/ January. Temperature in the district begins
to rise from the middle of February till May. With the onset of southwest monsoon in June, the
temperature decreases to about 20°C and is more or less uniform during the monsoon period.
The relative humidity ranges from 60 to 80% in the mornings, whereas in the evenings it varies
from about 45 to more than 70%.
The annual rainfall during 2012 is 889 mm and the long term Normal Annual Rainfall as was
reported by the CGWB (2013) was at 1,084 mm. October and November months have shown
relatively high rainfall compared to all the other months. January to April was the months with
lowest rain fall.
The mining lease area experience semi arid climatic conditions. The area experience 800mm
average annual rainfall during August-November months. The day temperature varies 28oC in
winter to 47oc in summer season. The general wind direction is SW to NE & SE-NW.
3.3 Land Environment:
The description given under this head describes about the Land Environment of mining area
and not the residential area. Geologically the area is called as ‘Dunal Sandy Loam. The sand in
this area is the result of millions of years of deposition. Now and then tectonic changes if any,
and the oceanic disturbances and the cyclones generally deposit such sands. The size of the
sand determines the travel distance of the material from its origin and the denudation that took
place. The size uniformity or un-uniformity shows both the number of elements present in the
parent rock and the predominant minerals in the parent rock. The sand is resting on a clay bed
in this area and in general in any such environment. The deposition of sand in this area varies
from 1.5 meters nearest to the shore and up to even 9 meters in highest peak of dune. The size
of the sand grain varies between 0.1mm to 1mm.

Y. Saran Kumar Reddy-EMP SEPTEMBER
2016
6
Generally the impurities in the sands of this area are very less. This makes this sand suitable
for cast forging and glass industries. The presence of iron and other aluminous material like
rutile, garnet, ilmenite, and zircon will render the sand useless for the purposes mentioned
though these minerals are valuable in other context.
The general land pattern is flat and is with dunal undulations. The total material is sand and
there is no topsoil or any other over burden. The entire are is more or less occupied by mines.
In the present mine the total lease land area is 12.476Ha.
3.4 Geological Reserves:
TABLE 4: Geo-Reserves
Sy.No. Mine Area Geo. Reserves @ 3.00M depth MT
1 M/s. Sri Y. Saran kumar
Reddy
12.476
Ha.
8,73,370
3.5 Mineable Reserves:
Tonnages held in the buffer zone and in the benches that will be left unmined to ensure slope
angle of 45o to the ultimate pit side out of safety consideration, are not available for mining.
TABLE 5: Mineable Reserves
Sy.No. Mine Mineable reserves
1 M/s. Y. Saran Kumar Reddy 8,47,600 MT
Total recoverable reserves : 6,69,285 MT
Projected annual production : 87,453 MT
Anticipated life of the mine : 7.65 say 8.00 Years

Y. Saran Kumar Reddy-EMP SEPTEMBER
2016
7
4. DESCRIPTION OF ELEMENTS OF PRESENT ENVIRONMENT:
4.1 Existing Land Use Pattern:
The mining lease area is on part of the sandy zone, with sparse vegetation small bushed form
the vegetal cover. The deposit is occupying entire mining lease area. The areas adjacent are
active with mining of the mineral.
4.2 Water Regime:
No permanent streams exists in and around the mining lease area.
4.3 Flora & Fauna:
Vegetation is sparse. Trees like Lotus and Cashew grow more in these areas.
4.4 Quality of Air, Ambient Noise Level and Water:
In general the air does not contain dust at higher levels. This is due to two reasons. One
is that the silica sand contains inherent moisture in it due to which the dust does not
rise. Second one is that the roads are sprinkled frequently.
The noise generated mainly due to machinery and vehicular traffic.
4.5 Human Settlement:
The people living in the villages besides involving themselves in mining activity.
TABLE-7: Human Settlement near to the Mine Site
S.No Village Distance Km Direction Approx. Population
(Nos)
1 Srinivasa Satram 1.00 North 200
2 Srinivasa Satram 1.00 South 200
3 East Kanupur 4.50 SW 1000
4 Ravulavaripalem 2.50 West 1200
5 Komaravaripalem 3.50 West 5000
6 Kottapatnam 3.00 South 3000
7 ldulavaripalem 3.50 SW 1000
Y. Saran Kumar Reddy-EMP SEPTEMBER
2016
8
5. ENVIRONMENTAL IMPACT ASSESSMENT:
5.1 Land Degradation:
A Large pit of 65,979 M2 to a depth of 3.0 M depth will be formed.
5.2 Air Quality:
There will not be any additional change in the air quality with the proposed modifications in
the mining scheme/plan. This is due to the reason that there will not be any additional
machinery used for the proposed changes.
5.3 Water Regime:
No permanent streams existing in and around the mining lease area.
The mining of silica sand, no adverse effect is anticipated on the water regime of the area.
5.4 Noise Levels:
Noise emitted from the machines is envisaged to be within permissible limits. However the
PPE for protecting workers from high noise levels will be provided.
5.5 Vibration Levels:
No vibrations of notable level will be generated.
5.6 Socio Economics:
The mining lease area is surrounded by7 villages within a distance of 5 kms. Agriculture is the
most important profession of the people living in the village besides involving themselves in
mining activity. The present mining activity will not cause any additional impact on the socio-
economics of the persons in the vicinity.
Y. Saran Kumar Reddy-EMP SEPTEMBER
2016
9
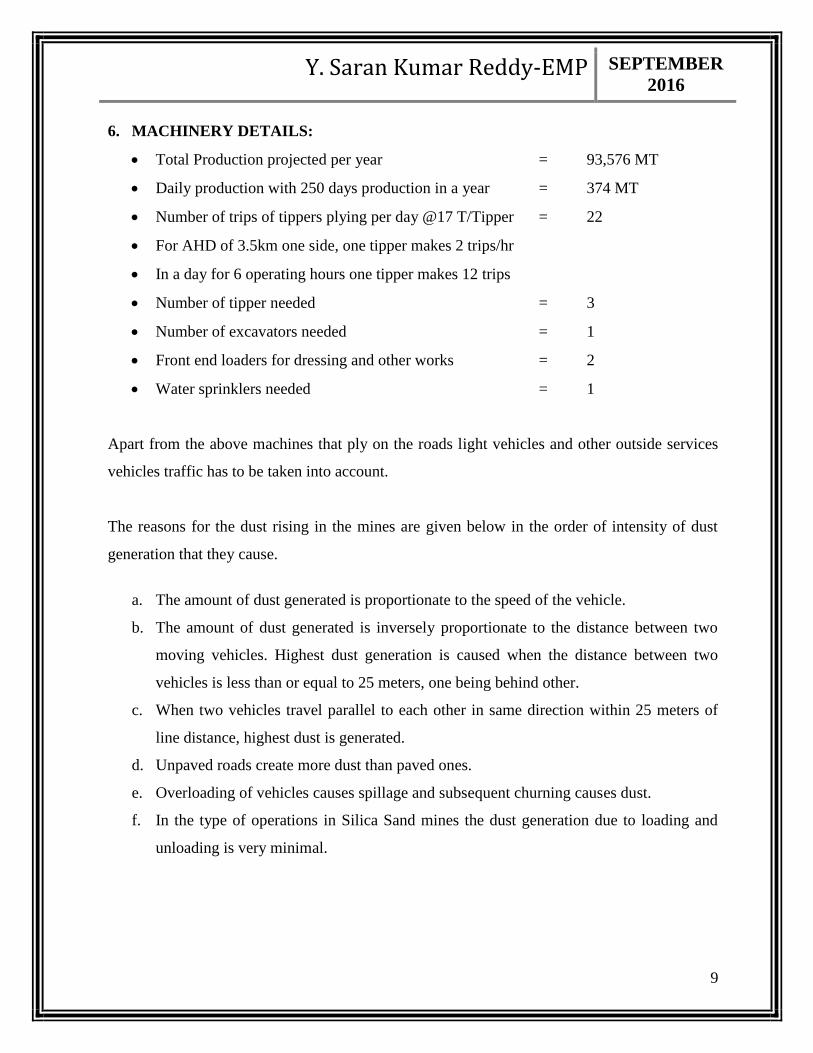
6. MACHINERY DETAILS:
Total Production projected per year = 93,576 MT
Daily production with 250 days production in a year = 374 MT
Number of trips of tippers plying per day @17 T/Tipper = 22
For AHD of 3.5km one side, one tipper makes 2 trips/hr
In a day for 6 operating hours one tipper makes 12 trips
Number of tipper needed = 3
Number of excavators needed = 1
Front end loaders for dressing and other works = 2
Water sprinklers needed = 1
Apart from the above machines that ply on the roads light vehicles and other outside services
vehicles traffic has to be taken into account.
The reasons for the dust rising in the mines are given below in the order of intensity of dust
generation that they cause.
a. The amount of dust generated is proportionate to the speed of the vehicle.
b. The amount of dust generated is inversely proportionate to the distance between two
moving vehicles. Highest dust generation is caused when the distance between two
vehicles is less than or equal to 25 meters, one being behind other.
c. When two vehicles travel parallel to each other in same direction within 25 meters of
line distance, highest dust is generated.
d. Unpaved roads create more dust than paved ones.
e. Overloading of vehicles causes spillage and subsequent churning causes dust.
f. In the type of operations in Silica Sand mines the dust generation due to loading and
unloading is very minimal.

Y. Saran Kumar Reddy-EMP SEPTEMBER
2016
10
7. UNPAVED ROADS AND DUST GENERATION DUE TO TRANSPORT:
When a vehicle travels an unpaved road, the force of the wheels on the road surface causes
pulverization of surface material. Particles are lifted and dropped from the rolling wheels, and
the road surface is exposed to strong air currents in turbulent shear with the surface. The
turbulent wake behind the vehicle continues to act on the road surface after the vehicle has
passed.
The quantity of dust emissions from a given segment of unpaved road varies linearly with the
volume of traffic. Field investigations also have shown that emissions depend on source
parameters that characterize the condition of a particular road and the associated vehicle traffic.
Characterization of these source parameters allow for “correction” of emission estimates to
specific road and traffic conditions present on public and industrial roadways.
Dust emissions from unpaved roads have been found to vary directly with the fraction of silt
(particles smaller than 75 micrometers in diameter) in the road surface materials.
The silt fraction is determined by measuring the proportion of loose dry surface dust that
passes a 200-mesh screen, using standard sieves. For this purpose ‘Rotap Sieve shaker’ is used.
At industrial sites, where haul trucks and other heavy equipment are common, emissions are
highly correlated with vehicle weight. For those roads, the moisture content of the road surface
material may be more dominant in determining differences in emission levels between, for
example a hot, desert environment and a cool, moist location.
The PM-10 and TSP (Total suspended particle) emission factors presented below are the
outcomes from stepwise linear regressions of field emission test results of vehicles traveling
over unpaved surfaces. Due to a limited amount of information available for PM-2.5, the
expression for that particle size range has been scaled against the result for PM-10.
Consequently, the quality rating for the PM-2.5 factor is lower than that for the PM-10
expression.
Y. Saran Kumar Reddy-EMP SEPTEMBER
2016
11
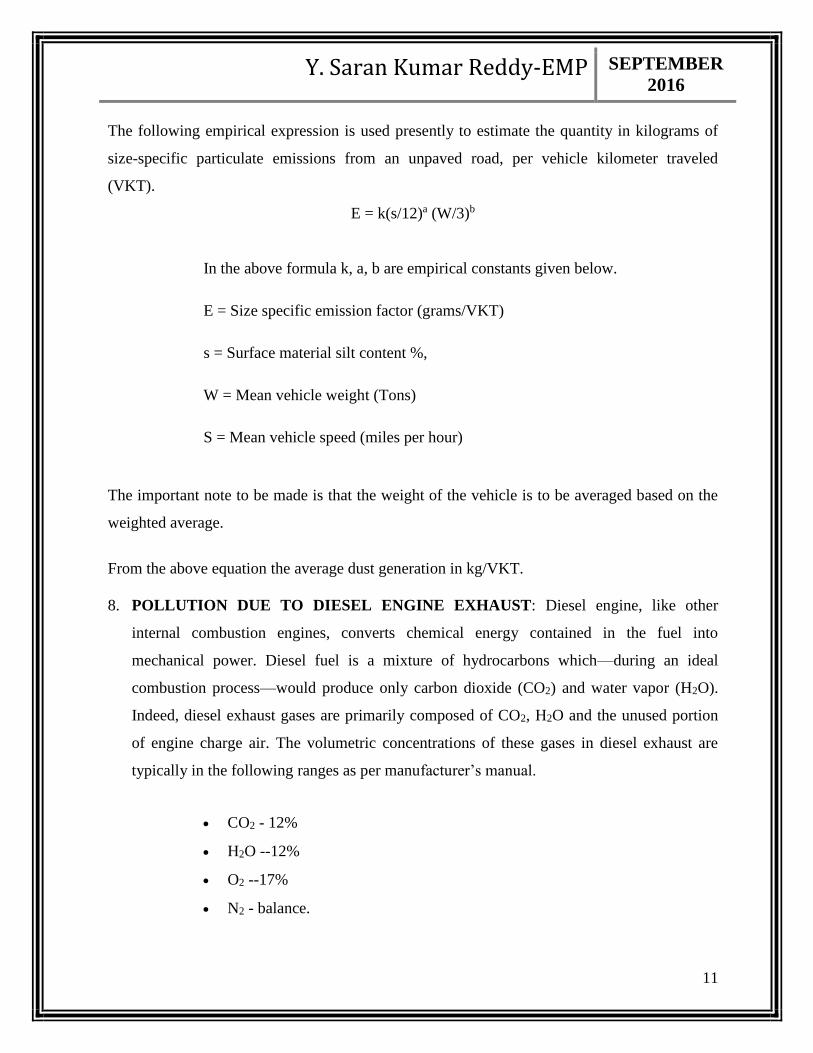
The following empirical expression is used presently to estimate the quantity in kilograms of
size-specific particulate emissions from an unpaved road, per vehicle kilometer traveled
(VKT).
E = k(s/12)a (W/3)b
In the above formula k, a, b are empirical constants given below.
E = Size specific emission factor (grams/VKT)
s = Surface material silt content %,
W = Mean vehicle weight (Tons)
S = Mean vehicle speed (miles per hour)
The important note to be made is that the weight of the vehicle is to be averaged based on the
weighted average.
From the above equation the average dust generation in kg/VKT.
8. POLLUTION DUE TO DIESEL ENGINE EXHAUST: Diesel engine, like other
internal combustion engines, converts chemical energy contained in the fuel into
mechanical power. Diesel fuel is a mixture of hydrocarbons which—during an ideal
combustion process—would produce only carbon dioxide (CO2) and water vapor (H2O).
Indeed, diesel exhaust gases are primarily composed of CO2, H2O and the unused portion
of engine charge air. The volumetric concentrations of these gases in diesel exhaust are
typically in the following ranges as per manufacturer’s manual.
CO2 - 12%
H2O --12%
O2 --17%
N2 - balance.
Y. Saran Kumar Reddy-EMP SEPTEMBER
2016
12
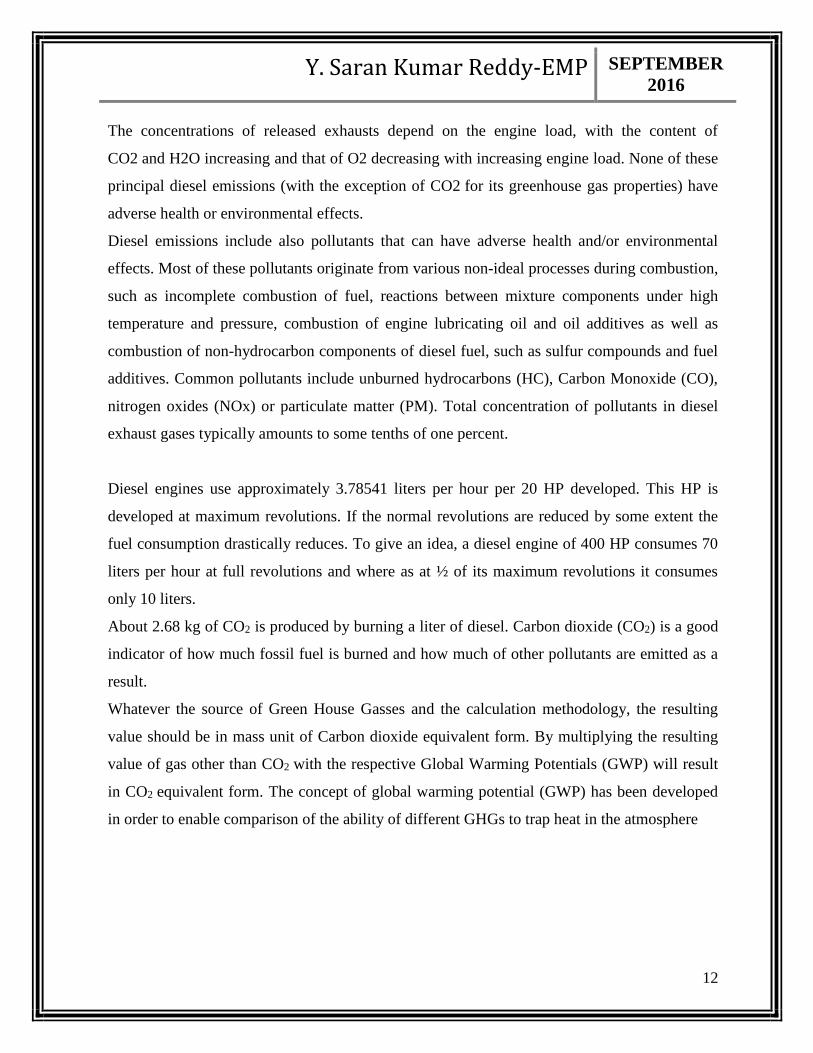
The concentrations of released exhausts depend on the engine load, with the content of
CO2 and H2O increasing and that of O2 decreasing with increasing engine load. None of these
principal diesel emissions (with the exception of CO2 for its greenhouse gas properties) have
adverse health or environmental effects.
Diesel emissions include also pollutants that can have adverse health and/or environmental
effects. Most of these pollutants originate from various non-ideal processes during combustion,
such as incomplete combustion of fuel, reactions between mixture components under high
temperature and pressure, combustion of engine lubricating oil and oil additives as well as
combustion of non-hydrocarbon components of diesel fuel, such as sulfur compounds and fuel
additives. Common pollutants include unburned hydrocarbons (HC), Carbon Monoxide (CO),
nitrogen oxides (NOx) or particulate matter (PM). Total concentration of pollutants in diesel
exhaust gases typically amounts to some tenths of one percent.
Diesel engines use approximately 3.78541 liters per hour per 20 HP developed. This HP is
developed at maximum revolutions. If the normal revolutions are reduced by some extent the
fuel consumption drastically reduces. To give an idea, a diesel engine of 400 HP consumes 70
liters per hour at full revolutions and where as at ½ of its maximum revolutions it consumes
only 10 liters.
About 2.68 kg of CO2 is produced by burning a liter of diesel. Carbon dioxide (CO2) is a good
indicator of how much fossil fuel is burned and how much of other pollutants are emitted as a
result.
Whatever the source of Green House Gasses and the calculation methodology, the resulting
value should be in mass unit of Carbon dioxide equivalent form. By multiplying the resulting
value of gas other than CO2 with the respective Global Warming Potentials (GWP) will result
in CO2 equivalent form. The concept of global warming potential (GWP) has been developed
in order to enable comparison of the ability of different GHGs to trap heat in the atmosphere
Y. Saran Kumar Reddy-EMP SEPTEMBER
2016
13
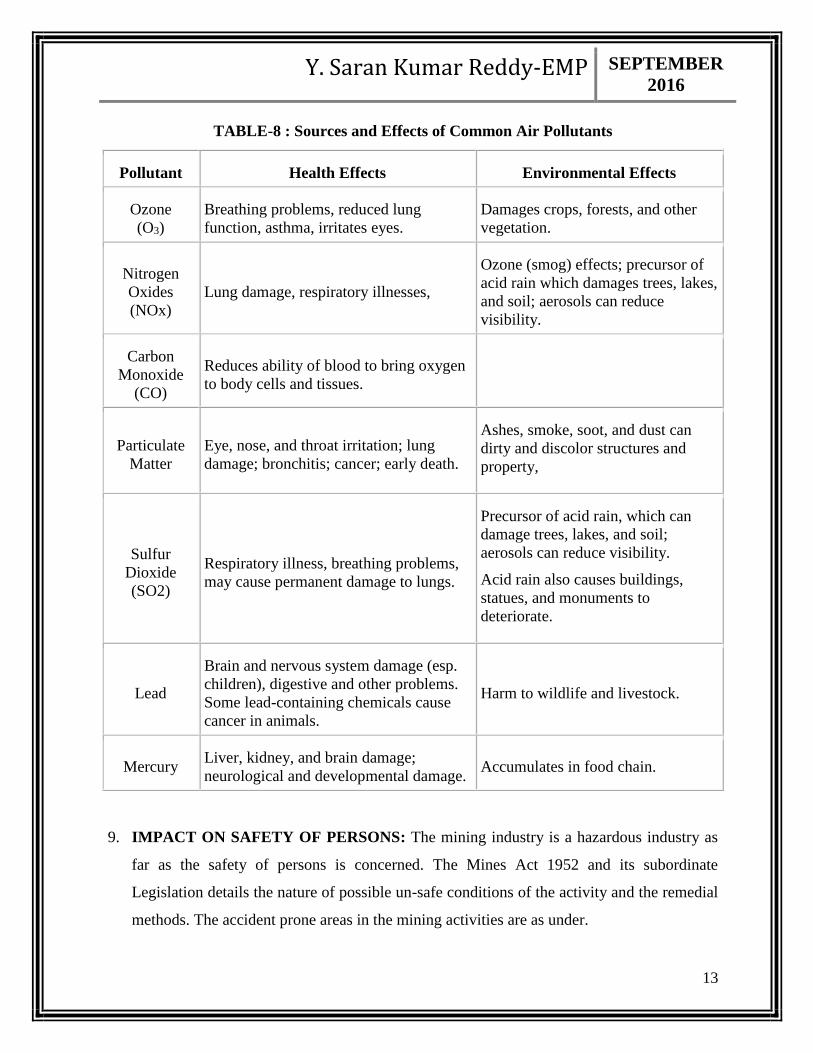
TABLE-8 : Sources and Effects of Common Air Pollutants
Pollutant Health Effects Environmental Effects
Ozone
(O3)
Breathing problems, reduced lung
function, asthma, irritates eyes.
Damages crops, forests, and other
vegetation.
Nitrogen
Oxides
(NOx)
Lung damage, respiratory illnesses,
Ozone (smog) effects; precursor of
acid rain which damages trees, lakes,
and soil; aerosols can reduce
visibility.
Carbon
Monoxide
(CO)
Reduces ability of blood to bring oxygen
to body cells and tissues.
Particulate
Matter
Eye, nose, and throat irritation; lung
damage; bronchitis; cancer; early death.
Ashes, smoke, soot, and dust can
dirty and discolor structures and
property,
Sulfur
Dioxide
(SO2)
Respiratory illness, breathing problems,
may cause permanent damage to lungs.
Precursor of acid rain, which can
damage trees, lakes, and soil;
aerosols can reduce visibility.
Acid rain also causes buildings,
statues, and monuments to
deteriorate.
Lead
Brain and nervous system damage (esp.
children), digestive and other problems.
Some lead-containing chemicals cause
cancer in animals.
Harm to wildlife and livestock.
Mercury Liver, kidney, and brain damage;
neurological and developmental damage. Accumulates in food chain.
9. IMPACT ON SAFETY OF PERSONS: The mining industry is a hazardous industry as
far as the safety of persons is concerned. The Mines Act 1952 and its subordinate
Legislation details the nature of possible un-safe conditions of the activity and the remedial
methods. The accident prone areas in the mining activities are as under.

Y. Saran Kumar Reddy-EMP SEPTEMBER
2016
14
Injury of persons while excavator loading, especially while they come within swing
zone,
Accidental collision of excavators with trucks under loading,
Accidents while reversal of tippers,
Fall of person in the excavated water logged portions of the mine,
Collapse of roads formed due to excess removal of sand from the road width,
Any type of fire accident in the machines,
Accidents while repairing, and
Accidents near dumping and loading points.
10. ENVIRONMENTAL MANAGEMENT:
This management chapter describes the measures that the lessees of the mine taking in general,
and specific measures need for protection of environment.
10.1 Management of Air Environment:
The individual mine managements proposed to control the dust through water sprinkling. The
loading points in general do not have much dust owing to the wetness that prevails due to sand
being dug in the moist ground. However the major concern is of the dust that generates on the
roads.
TABLE-9 : Common transport roads and the Ton-Kilometers
SI.No Mine Lease
Area
Total Common
Road Travelling
Tonnage
Travelling
Dust Generated*
1 12.476 Ha 335 m 374 MT/Day 242 g/day
*Dust generated during sand handling, transfer & storage is 0.000648g/kg of dried sand (Ref.
USEPA AP-42).
Thus dust can be further brought down with water sprinkling.
10.2 Water Sprinkling:
For the purpose of water sprinkling only the common road length of travel is taken into
account. Based on the data it is calculated that the water needed for sprinkling is 3.5 Lt per
sq.mt of road. The moisture holding in summer is taken as 2 hours per trip. Thus for a duration
of 8 hot hours the total water needed is as under.

Y. Saran Kumar Reddy-EMP SEPTEMBER
2016
15
Total Length of travel of common road = 335 m
Average width of road = 6 m
Total area in Sq.Mts = 2010 m2
Water needed for one round of sprinkling @3.5 lit per sq.m = 7035 lit
Total water needed for 2 rounds of sprinkling = 14070 lit 14.0 KLD
Number of tankers needed for common road alone per day = 3
TABLE-10 : Fresh Water Requirement & Wastewater generation
Purpose Fresh Water Waste Water
Domestic 1.0 KLD 0.8 KLD
Dust Suppression 14.0 KLD 0 KLD
Greenbelt Development 1.0 KLD 0 KLD
TOTAL 16.0 KLD 0.8 KLD
10.3 Management of Water Environment:
The management of water environment is fully dealt in the guidelines issued by the SEAC
(State Expert Appraisal Committee), AP. The same guidelines will be followed here also for
protection of water environment. The same are used in recommending the management of
water environment.
Mining is to be limited only to a level of > 1 m above the Water table.
To level of water table in the lease area is to be established before approving mining
plan (Already done by all lessees)
The water level in these doruvus be considered as the initial water table depth and,
mining should be permitted up to a level of 1 m above the identified level;
In the areas, with Sona Kaluvas (Spring Channels), no mining should be permitted in
the 50 m wide area on either side of the channels; and even existing mine lease areas
also need to submit a closure plan for such areas, if they have already been excavated.
This precaution is already taken in the case of all the mines in the cluster.
Y. Saran Kumar Reddy-EMP SEPTEMBER
2016
16
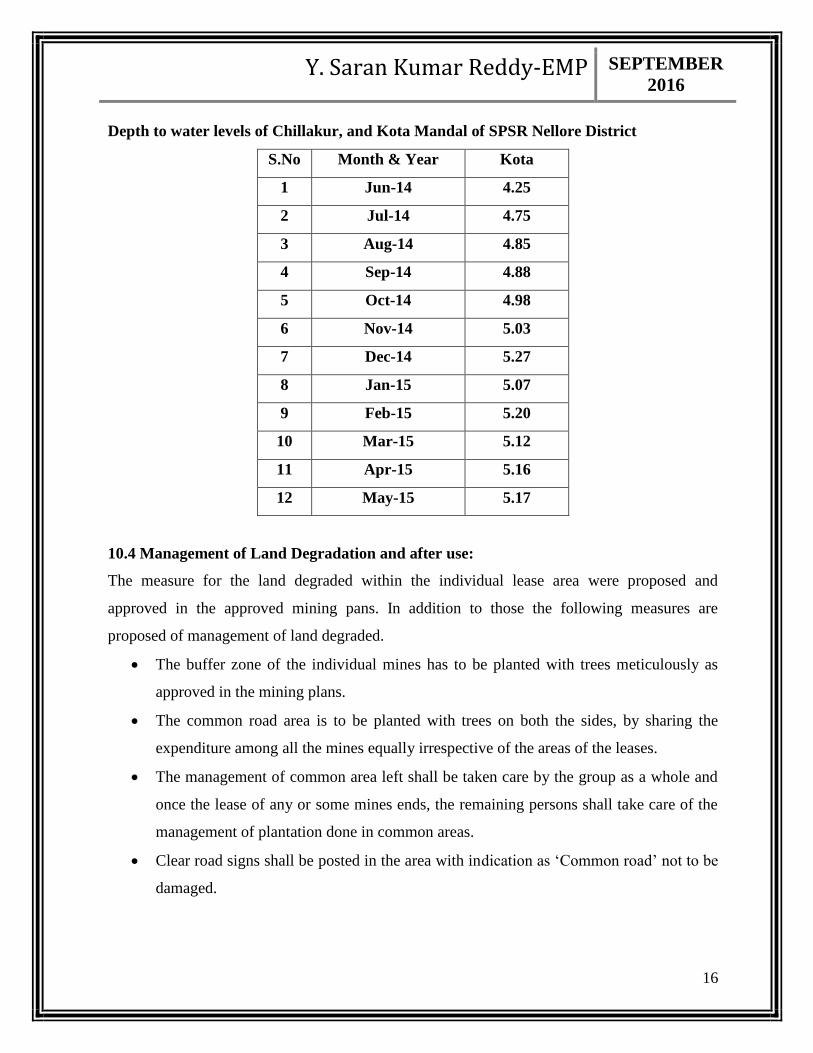
Depth to water levels of Chillakur, and Kota Mandal of SPSR Nellore District
S.No Month & Year Kota
1 Jun-14 4.25
2 Jul-14 4.75
3 Aug-14 4.85
4 Sep-14 4.88
5 Oct-14 4.98
6 Nov-14 5.03
7 Dec-14 5.27
8 Jan-15 5.07
9 Feb-15 5.20
10 Mar-15 5.12
11 Apr-15 5.16
12 May-15 5.17
10.4 Management of Land Degradation and after use:
The measure for the land degraded within the individual lease area were proposed and
approved in the approved mining pans. In addition to those the following measures are
proposed of management of land degraded.
The buffer zone of the individual mines has to be planted with trees meticulously as
approved in the mining plans.
The common road area is to be planted with trees on both the sides, by sharing the
expenditure among all the mines equally irrespective of the areas of the leases.
The management of common area left shall be taken care by the group as a whole and
once the lease of any or some mines ends, the remaining persons shall take care of the
management of plantation done in common areas.
Clear road signs shall be posted in the area with indication as ‘Common road’ not to be
damaged.
Y. Saran Kumar Reddy-EMP SEPTEMBER
2016
17
Adjacent mines once closed shall be connected with a 200 cm pipe line through the
barrier such that water flows freely in and out. This will also maintain the hydraulic
gradient of the system as a whole.
10.5 Improvements in socio economic conditions:
No additional steps are needed for improvements in socio economic conditions. As per the
latest changes in the State’s law through formation of “District Mineral Foundation”, each
lessee contributes 30% of the royalty to the development fund which the social improvement
works will be taken by the State Government.
10.6 Safety, Health and skill development of persons working:
The following steps are proposed for safety, health and skill development of persons working.
To obtain permission by all individual mine managements the permission needed under
MMR 1961- 106(2(b)) as immediately as possible,
To conduct safety audit and risk assessment once in a year, in the manner needed by
statute,
To get all the employees checked once in Five years as needed by Mines Rules.
To enroll as a member of local MVTC this renders training needed for skill
development and also for safety consciousness.
10.7 Waste Management:
The waste in general is categorized under the following heads for any opencast working.
Solid waste in which the overburden, top soil are mainly considered,
Less considered waste from the mining operations, generated as scrap of the used
machine parts, oil filters, and other material,
Used oils from the machines.
It is proposed to dispose the scrap and the oil waste by the individual mines themselves to the
local recognized collectors (For oil waste). The very nature of these Silica Sand operations
does not generate any OB or other forms of earthen waste.

Y. Saran Kumar Reddy-EMP SEPTEMBER
2016
18
Environmental Budget
Greenbelt development
Reclamation and closure options
Statutory Obligations
Environmental Monitoring
Obligations under Mines Act
Other Statutory Obligations
Conclusion
Measures for protecting Historical monuments and for rehabilitation of human
settlements likely to be disturbed due to mining activity
No historical monuments exist in the area and as the human settlements are far away from the
mining area, no disturbances are likely to be foreseen.
Solid Waste
There is virtually no waste material during mining operations. At times there may be
contamination or some lowered grade of material visible during mining operations. Such
material will be treated as waste/sub-grade material. The quantity of this material is around 2%
of the production.
YEAR WASTE @ 2% (MT)
2016-17 1872
2017-18 1779
2018-19 1754
2019-20 1585
2020-21 1756
Total 8746
Average 1749
Site Services
Rest Shelter, Drinking Water Facilitate, Public Utilities, First Aid are provided by the lessee.
Y. Saran Kumar Reddy-EMP SEPTEMBER
2016
19
11. POST PROJECT MONITORING PROGRAMME
There are no guidelines available for post project monitoring for such Silica Sand projects.
However the following monitoring schedule is proposed.
To guard the area with a guard to see that there will not be any inadvertent entry,
To divert the local drainage in such a way that the water in the area will be fully
absorbed by the ground and will recharge the ground water,
To construct bunds or some sort of parapet protection around the excavation in such a
way that the holding capacity (Artificial) will be increasing during monsoon.
12. OCCUPATIONAL HEALTH
Dust masks will be provided for protecting persons from exposure to dust.
Ear plugs will be provided to employees to reduce the Noise impact on them.
Health check up will be carried out for all employees in an external hospital as per the
statute that is once in Five years.
Y. Saran Kumar Reddy-EMP SEPTEMBER
2016
20
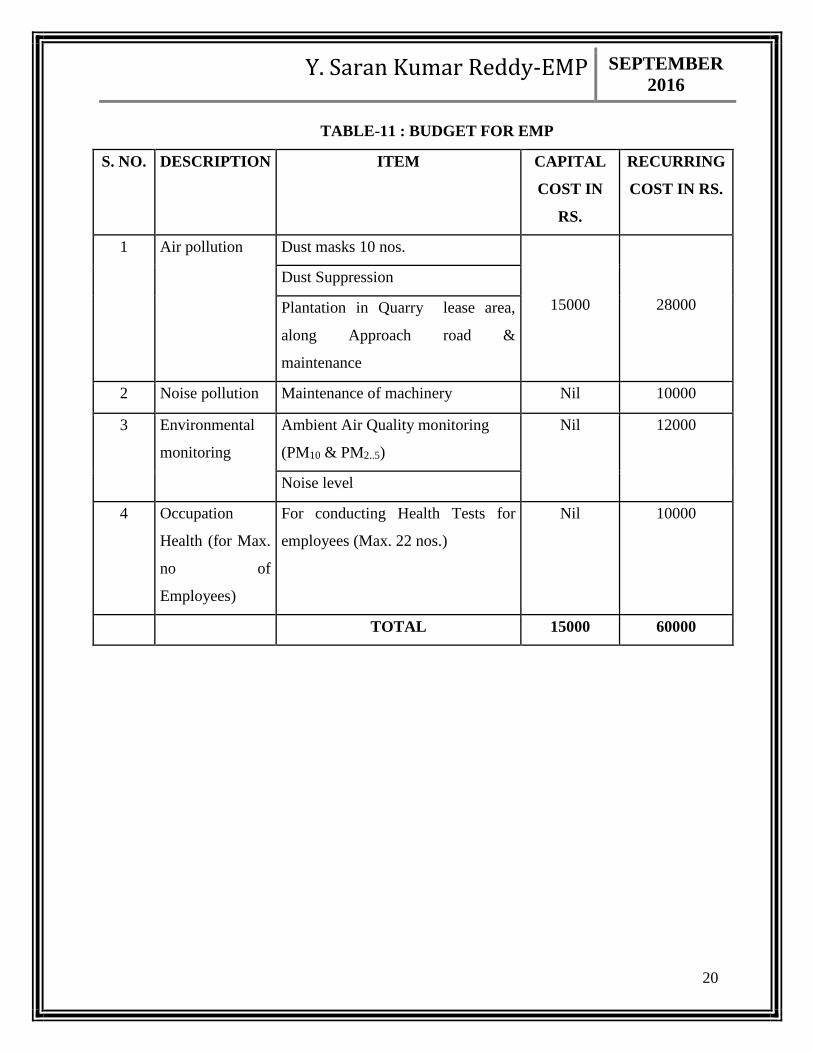
TABLE-11 : BUDGET FOR EMP
S. NO. DESCRIPTION ITEM CAPITAL
COST IN
RS.
RECURRING
COST IN RS.
1 Air pollution Dust masks 10 nos.
15000 28000
Dust Suppression
Plantation in Quarry lease area,
along Approach road &
maintenance
2 Noise pollution Maintenance of machinery Nil 10000
3 Environmental
monitoring
Ambient Air Quality monitoring
(PM10 & PM2..5)
Nil 12000
Noise level
4 Occupation
Health (for Max.
no of
Employees)
For conducting Health Tests for
employees (Max. 22 nos.)
Nil 10000
TOTAL 15000 60000