morningstar guide to income investing...investment opportunities. it takes patience to let...
TRANSCRIPT

Morningstar Guide to Income Investing

At Morningstar we are all about independence for the individual investor. Independence from conflicted advice, independence from excessive fees and independence from the presumption that it is somebody else’s responsibility to give you the life you want.
Passive income is one of the pillars of independence. Which investor hasn’t dreamt of earning income while sitting on a white-sand beach sipping a cocktail? That’s nice but a Morningstar investor knows the difference between dream and reality. This dream isn’t going to come true by itself. It takes research to uncover investment opportunities. It takes patience to let compounding do its magical work. It takes conviction to resist chasing the crowd. And it takes foresight to realise that earning money is only the first step on the journey to financial independence.
Income investing has played a crucial role in my own financial freedom. I started investing for income in university. This may not be the age at which most people gravitate towards income investing but I found the concept of passive income so compelling that I couldn’t help myself. During my time as an income investor my approach has evolved. Initially, I used a dividend reinvestment program across my entire portfolio. This served me well, particularly when the global financial crisis hit. While certain stocks I owned cut their dividend, most did not, and my focus on sustainability worked well. The dividend reinvestment program allowed me to plough cash back into my holdings at what turned out to be extremely attractive valuations. As I get older my approach continues to evolve: I’ve set up a dedicated investment account that generates income, which I can use to spend on travelling. And this account brings with it a psychological inducement: the discipline to continue saving money while also generating some immediate gratification (yes, I know this is a trick; and no, I don’t
Introduction
care because it works for me). Eventually I hope to reach the point where the income I need to live will be generated by my portfolio—then I will have reached true financial independence.
But the life moment that really cemented my views on the merits of income investing came when my parents divorced. And with divorce comes solitude, which was understandably a great source of anxiety for my mother, especially since she was never one to pay attention to investing. With her retirement rapidly approaching she asked me to take over her portfolio, and before long concepts such as sustainability took on greater importance. Ten years later, my mother is retired and living off income generated by her portfolio. There will certainly be a time when she will have to start dipping into principal, but she is in a better situation than she may otherwise have been. And for me, being part of a real-world example of the type of financial freedom that income investing can provide is a source of relief and gratification.
The Morningstar Income Investing Guide is intended to help you become a better income investor whether you are just starting out or have been investing for years. The guide outlines basic income-investing concepts and points you towards Morningstar Premium features and tools that can help you navigate your own path to financial independence.
Best regards,
Mark LaMonica, CFAIndividual Investor Product Manager

Earning income from stocks
Table of contents
Earning income from hybrids
Morningstar Model Income Equity Portfolio
Glossary
© 2019 Morningstar, Inc. All rights reserved. Neither Morningstar, its affiliates nor their content providers guarantee the data or content contained herein to be accurate, complete or timely nor will they have any liability for its use or distribution. Any general advice has been prepared by Morningstar Australasia Pty Ltd ABN: 95 090 665 544, AFSL: 240892 (a subsidiary of Morningstar, Inc.), without reference to your objectives, financial situation or needs. You should consider the advice in light of these matters and if applicable, the relevant Product Disclosure Statement before making any decision to invest. Our publications, ratings and products should be viewed as an additional investment resource, not as your sole source of information. Some material is copyright and published under licence from ASX Operations Pty Ltd ACN 004 523 782.Past performance does not necessarily indicate a financial product’s future performance. Refer to our Financial Services Guide (FSG) for more information at www.morningstar.com.au/fsg.pdf. Investors please note: Where Morningstar ratings contained in this newsletter are based on full research reports, these are available at www.morningstar.com.au. For important information regarding our research reports, research criteria, and conflict management, please refer to www.morningstar.com.au/s/documents/RRDD.pdf

4
Let’s start with the basics: What is a dividend? A dividend is a payment made by a corporation to its shareholders, with each share receiving an equal amount of value. Dividends can be paid in additional shares of stock (stock dividends or stock splits), or shares of another corporation (a process known as a spin-off). Some are one-time affairs known as special dividends. However, the vast majority of dividends are regular cash dividends, paid at predictable intervals—usually twice a year in Australia.
Dividends are everywhere: 90% of the companies in the ASX 200 Index make regular distributions of cash to shareholders, and many smaller companies also pay dividends. The yield of the ASX 200 is ~2.92%, which means that for every $1000 invested $29.20 of income will be generated. The yield increases to 3.58% if you exclude the 10% of the ASX 200 companies that pay no dividend. Australian companies tend to pay higher dividends than foreign companies and Australia has a higher yield than other global markets.
Common stocks derive their value from the same source that bonds do: cash that is paid by the security issuer directly to the investor. With a bond, the investor knows exactly what he is supposed to get. Interest payments are scheduled in advance, as is the return of principal when the bond matures. The only question directly related to these cash flows is
whether the issuer can pay on time and in full, and how much purchasing power these dollars will have when received. You could debate how much these cash flows are worth based on various scenarios for inflation, interest rates, credit spreads, economic conditions, and so on, but a bond that paid no interest and never matured would have a tough time finding buyers.
When one thinks beyond the “buy low, sell high” mentality that pervades the stock market, it turns out that common stocks are no different. Once you put some cash into a share of stock, there are only two ways you can recoup your cash. You could sell the stock on the open market, but then it has a new buyer, who would need another seller. Unless there is some other source of cash, this is the world’s biggest game of hot potato. The other source of cash is from the issuing corporation itself. It might take the form of a liquidating distribution (these are very rare), a cash buyout offer, or a dividend. The most useful payments for some investors—and the only practical ones for the largest companies—take the form of regular cash dividends.
The critical importance of dividends, as well as dividend growth, is easily observed in historic stock market returns. Since 2000, the ASX 200 has returned an average of 5.12% annually. The proportion of total return that comes from dividends is 60%.
Dividends: The truth about stocks
Earning income from stocks
Do you know the only thing that gives me pleasure? It’s to see my dividends coming in. John D. Rockefeller

5
So dividends are not just powerful in terms of delivering potential returns, they can also be practical in meeting investors’ real-world objectives. Dividends help give investors the ability to use corporate earnings as they see fit: to fund portfolio withdrawals during retirement, to meet other personal financial obligations, to reinvest in the company that paid it, or to invest in other areas of the market.
Dividends may not be the contractual obligations that a bond’s interest payments are, but once a dividend has been established, directors and managers have historically been reluctant to yank it away without good cause. An investor cannot take any dividend for granted, yet a dividend-paying company provides evidence, at least in part, that it has shareholders’ interests in mind.
012345678
01/0
6/19
9201
/06/
1993
01/0
6/19
9401
/06/
1995
01/0
6/19
9601
/06/
1997
01/0
6/19
9801
/06/
1999
01/0
6/20
0001
/06/
2001
01/0
6/20
0201
/06/
2003
01/0
6/20
0401
/06/
2005
01/0
6/20
0601
/06/
2007
01/0
6/20
0801
/06/
2009
01/0
6/20
1001
/06/
2011
01/0
6/20
1201
/06/
2013
01/0
6/20
1401
/06/
2015
01/0
6/20
1601
/06/
2017
01/0
6/20
18
S&P/ASX 200 - DS DIVIDEND YIELDS&P/ASX 200 – DS Dividend Yield
Source: Morningstar

6
Seeking a decent income from stocks is a good start, but it’s not the final destination. It is critical for investors—even dividend-oriented investors—to think in terms of total return. Let’s say you find a $25 stock that pays annual dividends of $1 a share. That’s a 4% yield, which isn’t too shabby. But if that dividend never grows, your income return is fixed at 4%, and there’s probably no reason for the stock to go up over the long term, either. By contrast, an increasing stream of income is far more useful than a flat one in an inflationary world, and a growing dividend is also likely to result in capital appreciation over time.
Compounding is often compared to pushing a snowball down a hill. As it travels down the hill, the snowball gathers more snow. The bigger it gets the more snow it gains on each rotation. The “snowball effect” shows that small actions continued over the long term can have a big impact.
The same applies in investing. Compounding is simply the concept of earning a return on your previous returns. To illustrate the power of compounding, consider the scenario of buying shares in a company with a growing dividend. For instance, you buy 1000 shares in Transurban Group (TCL) on the first day of trading in 2009. It is a low point in the global financial crisis; Australia is experiencing the first negative quarterly GDP growth in 8 years; and it’s a month before the introduction of the $42 billion economic stimulus package by the Rudd government.
We have created a chart that shows two scenarios for your investment:
1. In the first scenario, your dividend payments are deposited into your account.
g As Transurban continues to raise the dividend, your passive income increases. Each year the percent increase in the dividend compounds. As a result, your income is increasing faster than the sum of the annual totals.
g In 2009, Transurban declares $230 worth of dividends on your initial investment of $5020. By 2017, Transurban declares $545 a year in dividends. If you add up each annual increase in the dividend for the period in which you have owned the stock, there is a total increase of 91.49%. That sounds great but pales in comparison to the total increase in your income, which has increased by 136.96%. That difference of 45.47% in income growth represents the compounding of each increase building on the previous one.
g The day after the last dividend declared in 2017 is paid on February 19, 2018, the value of your investment has increased from $5020 to $11,650—an additional gain to the income you have earned.
Dividends and compounding
7
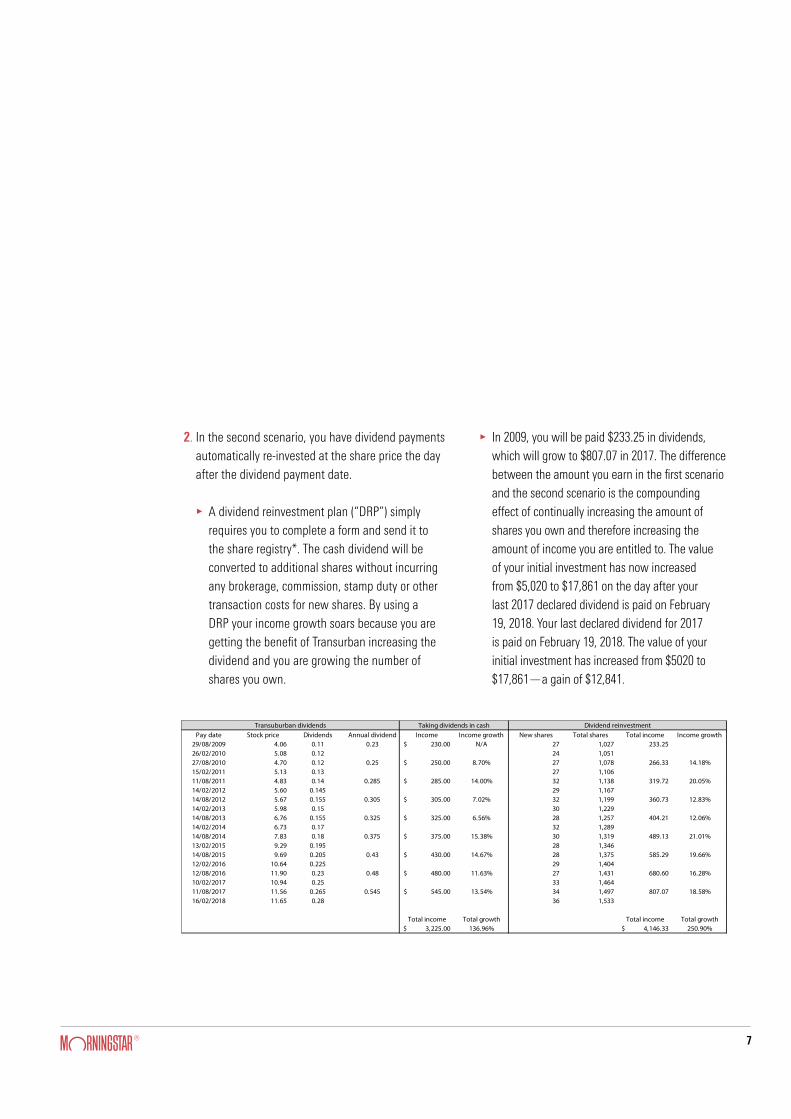
2. In the second scenario, you have dividend payments automatically re-invested at the share price the day after the dividend payment date.
g A dividend reinvestment plan (“DRP”) simply requires you to complete a form and send it to the share registry*. The cash dividend will be converted to additional shares without incurring any brokerage, commission, stamp duty or other transaction costs for new shares. By using a DRP your income growth soars because you are getting the benefit of Transurban increasing the dividend and you are growing the number of shares you own.
g In 2009, you will be paid $233.25 in dividends, which will grow to $807.07 in 2017. The difference between the amount you earn in the first scenario and the second scenario is the compounding effect of continually increasing the amount of shares you own and therefore increasing the amount of income you are entitled to. The value of your initial investment has now increased from $5,020 to $17,861 on the day after your last 2017 declared dividend is paid on February 19, 2018. Your last declared dividend for 2017 is paid on February 19, 2018. The value of your initial investment has increased from $5020 to $17,861—a gain of $12,841.
Pay date Stock price Dividends Annual dividend Income Income growth New shares Total shares Total income Income growth29/08/2009 4.06 0.11 0.23 230.00$ N/A 27 1,027 233.25 26/02/2010 5.08 0.12 24 1,051 27/08/2010 4.70 0.12 0.25 250.00$ 8.70% 27 1,078 266.33 14.18%15/02/2011 5.13 0.13 27 1,106 11/08/2011 4.83 0.14 0.285 285.00$ 14.00% 32 1,138 319.72 20.05%14/02/2012 5.60 0.145 29 1,167 14/08/2012 5.67 0.155 0.305 305.00$ 7.02% 32 1,199 360.73 12.83%14/02/2013 5.98 0.15 30 1,229 14/08/2013 6.76 0.155 0.325 325.00$ 6.56% 28 1,257 404.21 12.06%14/02/2014 6.73 0.17 32 1,289 14/08/2014 7.83 0.18 0.375 375.00$ 15.38% 30 1,319 489.13 21.01%13/02/2015 9.29 0.195 28 1,346 14/08/2015 9.69 0.205 0.43 430.00$ 14.67% 28 1,375 585.29 19.66%12/02/2016 10.64 0.225 29 1,404 12/08/2016 11.90 0.23 0.48 480.00$ 11.63% 27 1,431 680.60 16.28%10/02/2017 10.94 0.25 33 1,464 11/08/2017 11.56 0.265 0.545 545.00$ 13.54% 34 1,497 807.07 18.58%16/02/2018 11.65 0.28 36 1,533
Total income Total growth Total income Total growth3,225.00$ 136.96% 4,146.33$ 250.90%
Taking dividends in cash Dividend reinvestmentTransuburban dividends

8
Dividends can be remarkably useful. Not only do they deliver income and drive total return, they can provide a framework for analysing companies. Dividend investors seek stocks whose dividends (1) will not be cut, (2) will grow at an acceptable rate over the long term, and (3) will provide a good total return profile. That’s why the analysis of a dividend paying stock can be thought of in terms of three questions, all of which are viewed from the standpoint of the dividend: Is the dividend safe? Will it grow? And what’s the potential return?
This is a far more comprehensive approach than it might first appear. Everything relevant about a company—its operations, competitive position, financial health, growth potential, the attitude of management toward shareholders, the valuation of its stock, and more—is organised around these queries. But first, let’s visit a concept that is central to Morningstar’s approach to all stocks, including those that pay dividends: economic moats.
Economic Moats and Dividends: An economic moat—a term we borrowed from Warren Buffett—is a sustainable competitive advantage (or combination of advantages) that allows a company to earn excess returns on capital for a long period. We assign every company in our coverage universe an economic moat rating of wide, narrow, or none, depending on our assessment of its competitive strengths and
how long we expect these strengths to last. We say a company generates excess returns if its returns on capital (operating profits less taxes divided by the net assets used in the business) consistently exceed its cost of capital (the interest on its debt and the total returns required by shareholders, weighted by how a company’s assets are funded). However, it’s not enough to observe that a company earns excess returns; we also need to know why. Morningstar identifies five potential sources of an economic moat:
1. Intangible assets: These can include brands, patents, or government licences that explicitly keep competitors at bay. This can be seen in pharmaceutical companies with patent protection or with consumer brands that have long-standing and reputable profiles.
2. Cost advantage: Firms that can provide goods and services at lower costs have big advantages over rivals as they can either undercut their rivals on price or sell at the same price and earn a higher profit margin. Generally, moats based on cost advantage are due to economies of scale—that is, saving costs by increasing production.
Using dividends to evaluate stocks

9
3. Switching costs: Switching costs refer the inconveniences or expenses associated with a customer switching from one product to another. Banks can be good examples as it is time-consuming to switch bank accounts once you have set up direct deposits and payments.
4. Network effect: The network effect occurs when the value of a particular good or service increases as more people use the good or service. Social media sites are perhaps the best example as a low number of members provides less of a benefit to a user than a high number of members.
5. Efficient scale: Efficient scale applies to companies that serve limited markets where there are a small number of competitors. Potential competitors are discouraged from entering the market based on the small opportunity. An example can be a pharmaceutical company that produces drugs for diseases that only affect small patient populations.
What do economic moats have to do with dividends? Everything! If an investor can’t rely on the profitability that funds dividends, they can’t depend on the dividend. Economic moats also play a critical role in dividend growth. An economic moat doesn’t just protect existing profitability; it also suggests that additional investments of retained earnings for expansion—however modest—should earn a good return that will be reflected through enlarged dividend-paying power. But if internal reinvestment fails to produce acceptable dividend growth, that provides evidence that a company’s moat is shrinking or has possibly dried up.
Is the dividend under threat? It’s hard to understate the importance of avoiding dividend cuts. Even flat dividends aren’t too bad; an investor still has the potential to come out ahead. But, by the time it’s obvious that a dividend is going to be slashed, shareholders will have usually endured a large drop in the stock price—they’ll usually suffer a drop in income and a capital loss.

10
An economic moat. Economic moat ratings of narrow and wide are one place to look when evaluating future dividend payments potential. An economic moat does not guarantee dividend safety, of course, but no-moat companies are much more likely to cut their dividends during recessions than narrow- and wide-moat firms.
Strong finances. Dividends can be paid to common stockholders only if all other financial obligations are satisfied first—banks, bondholders, suppliers, employees, pensions, the ATO, and even hybrid holders. Being last in the pay line, an investor would typically want to see that this line is not too long.
Other financial factors that may warrant consideration can include tax problems, legal threats—pretty much any other potential claim on a company’s cash. Liquidity can be an important factor, too—dividends may come indirectly from earnings, but they’re paid in cash. Especially in seasonal or heavily cyclical fields, an investor should seek companies with cash reserves or suitably large lines of credit to smooth out shifts in cash flow. Finally, in situations involving large debt loads, it’s important to be aware of any financial covenants with bankers or bondholders that can trigger defaults even before the firm runs out of resources. (If this seems beyond your grasp, simply avoid highly leveraged situations. Debt can be a plus if used in moderation, but there is always a point beyond which it’s much more trouble than it’s worth.)
Payout ratio. This may be the single most important statistic in evaluating a dividend’s stability, but there’s always a bit of tension. All else being equal, a higher payout ratio will generate a higher dividend yield, but lower payout ratios are less risky than high ones. What you should seek is balance—current yield versus stability, as well as current yield versus future growth.
The payout ratio itself is pretty simple: it’s the proportion of earnings being paid out as dividends. If a company is earning $2 a share annually and paying dividends at a $1.20 rate, the payout ratio is 60% ($1.20 divided by $2.00). The inverse of the payout ratio—40% in this case—tells you how far earnings could drop before the dividend would no longer be covered by earnings.
One of the biggest responsibilities of the leadership of any company is making capital-allocation decisions. In other words, what you should do with cash that is generated from operating a company or accessing the capital markets (issuing stock or borrowing). The cash can be re-invested in the business (spending more on marketing, hiring people, research and development, etc.), debt can be paid back, acquisitions can be made, stock can be purchased through a buyback or dividends can be paid to investors. These decisions can be influenced by a number of factors and the wisdom of the path taken by management is critical to the future success of the company. The level of debt, the investment opportunities and the predictability of future cash flows are all critical to consider.
Sustainability: What factors can help create a reliable stream of dividends?

11
One more word about payout ratios: The optimal denominator (earnings) will be different in different circumstances. Among real estate investment trusts, funds from operations are a much better proxy for dividend-paying capacity than reported net income. In this case, payout ratios may approach 100% (or coverage may fall near 1.0 times) without necessarily indicating an unstable payout to investors. Most of these firms are set up to pay out a very large proportion of available resources while raising external capital (new stock and bond issues) to fund growth. If non-traditional statistics are needed to get a clear view of
Here are some real-world examples of how different types of Australian companies approach dividend payouts based on their business models:
the situation, you should find out what they are—and how they work.
Finally, all of the foregoing should be considered in the context of management: How devoted is the company’s leadership to maintaining the dividend?
Consider past actions as well as anything they’ve recently said. Even a dividend cut that happened 10 or 20 years ago might tell you something interesting about the fundamentals of the business—and a more recent dividend cut should tell you quite a lot.
Mature companies in mature industries that have lower growth have smaller investment opportunities for capital. Therefore, it can often be prudent to have higher payout rates. The Big Four banks in Australia are a classic example—limited ability to gain market share domestically through organic growth and a level of industry concentration that makes it impossible to make an acquisition, a poor track record investing internationally and strong and stable cash flows. Consequently, the Big Four’s high payout ratios compared to international banking peers seems justified (~65% to 80% payout ratio;
Fast growing companies with ample investment opportunities often have a lower payout ratio as management prefers to re-invest capital to continue to grow the company. CSL is a good example of local company that has a lower payout ratio but has been growing quickly. While the payout ratio of ~46% and the ~1.5% dividend yield are low by Australian standards the growth of the dividend has been quite strong and averaged 19% growth per annum since June 2008. In this case income investors that choose to purchase shares in CSL at a 1.29% yield in 2008 would have a yield at cost of 5.67% today.
vs
12
Dividend growth is a sign of health that reflects dividend stability. You can’t require a dividend increase every year from every company, but most investors look for a decent average rate of dividend growth over three- to five-year periods.
A good place to start is with a stock’s dividend record, preferably including at least 10 years of history, which preferably includes a time where the company has undergone earnings pressure. If nothing else, this will signal the willingness of management to reward shareholders. This doesn’t mean candidates with shorter records should be dismissed out of hand, but additional scepticism should be applied.
Forecasting growth is much more than simply extending a recent trend, however. The look ahead starts by separating the dividend into per-share earnings and a payout ratio, both of which are variables. If an investor can presume a stable payout ratio over time, then estimating future dividend growth is no different than estimating earnings growth. But if the current payout ratio is abnormally high or low, an investor may have to make other adjustments to normalise the starting point. Assuming one can get a handle on a normalised level of earnings and dividends the future can be broken into three questions.
How fast can the earnings per share grow? Factors such as the drivers of revenue growth (inflation, real economic growth, market share changes, investment plans, and returns on capital) may be considered, as well as changes in profit margins, interest expense, or taxes.
If the payout ratio is forecast to remain the same, the estimate of the future dividend is calculated by simply multiplying the payout ratio by the future projected earnings. Forecasting changes in the payout ratio involves detailed assessments of the opportunities for future investment given changes in the company’s operating approach or the business environment.
Estimating how fast a business grows and changes to the payout ratio are a key focus of the Morningstar equity research team. As an example, we can look at A2 Milk, which is covered by our equity analyst Adam Fleck. As part of his analysis, Adam forecasts both the future earnings and the payout ratio, which can be seen on the next page.
Will the dividend grow?

13
Within the analyst note, analyst report and analyst valuation/risk write-up, Adam goes into detail on the EPS growth he is projecting.

14
There are several reasons why Australians don’t invest overseas. Our own subscribers cite, for instance, a lack of knowledge about overseas markets, currency risk and uncertainty about how to access global investments. And when it comes to income investing, there are even more compelling reasons to stick with local equities. The dividend yield on Australian shares has consistently been among the highest in the world, not to mention the favourable tax treatment of franking credits. Together these two reasons alone leave many Australian investors wondering why they should look overseas for income.
On the surface this logic seems unassailable. If you are investing for income you should simply buy stocks with the highest dividend yield and the best tax treatment. For an Australian investor that means buying fully franked domestic shares. This assumes however—and it’s an assumption that has been the downfall of many investors—that the future will match the past. This is of course not true. Future tax treatment of dividends is subject to government policy decisions. The implied forward dividend yield of a stock is based on company policies that are set by the board of directors and influenced by the company’s performance and that of the economy at large. The argument for investing internationally for income is the same as all international investing.
By not diversifying your income streams you are making a very concentrated bet on the Australian market. Consider this: the Australian Stock Exchange makes up just 2% of global share markets. If your portfolio only includes Australian investments, you’re depriving yourself of potential income from 98% of the world’s share markets. And by sticking only to Australian shares you face other risks. A downturn in the Australian economy for instance could severely erode your income stream.
It’s crucial to note too that within the ASX 60% of companies belong to the banking and resources sectors—a concentration that limits asset class diversification and exposure to different sources of income. Such a concentration also presents other risks. Falling commodity prices or changes in interest rates, for instance, can transform—for better or worse—the economic prospects and dividends of resource companies and banks. If you rely on the Australian market for an income stream to fund your retirement these risks deserve close consideration. The benefit of diversifying your income stream can outweigh a slight reduction in the current yield and the loss of franking credits.
When comparing international income investments to Australian shares it is important to look beyond yield
International income investing

15
and tax benefits. Compare the payout rate, cash flow and balance sheet of different companies to assess the sustainability of the dividends. Explore how industry-specific and country-specific factors will influence prospects of the company and dividend. Diversification is critical when looking at your overall income stream, particularly if there’s volatility in the income source or there are concerns over future income streams and capital gains.
16
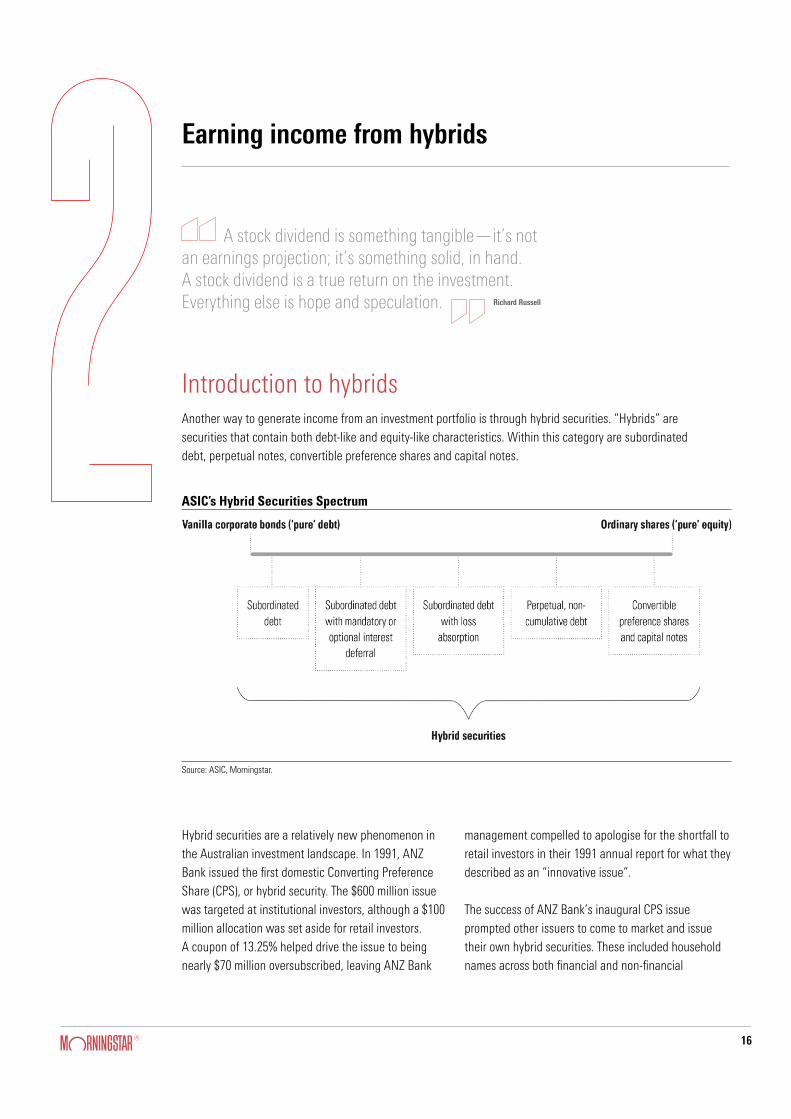
Another way to generate income from an investment portfolio is through hybrid securities. “Hybrids” are securities that contain both debt-like and equity-like characteristics. Within this category are subordinated debt, perpetual notes, convertible preference shares and capital notes.
Introduction to hybrids
ASIC’s Hybrid Securities Spectrum
Source: ASIC, Morningstar.
Hybrid securities are a relatively new phenomenon in the Australian investment landscape. In 1991, ANZ Bank issued the first domestic Converting Preference Share (CPS), or hybrid security. The $600 million issue was targeted at institutional investors, although a $100 million allocation was set aside for retail investors. A coupon of 13.25% helped drive the issue to being nearly $70 million oversubscribed, leaving ANZ Bank
management compelled to apologise for the shortfall to retail investors in their 1991 annual report for what they described as an “innovative issue”.
The success of ANZ Bank’s inaugural CPS issue prompted other issuers to come to market and issue their own hybrid securities. These included household names across both financial and non-financial
Earning income from hybrids
A stock dividend is something tangible—it’s not an earnings projection; it’s something solid, in hand. A stock dividend is a true return on the investment. Everything else is hope and speculation. Richard Russell

17
industries such as Westpac Banking Corporation, Coles Myer and General Property Trust. Since then, hybrid security structures have evolved in line with economic, regulatory and industry body developments. The trend towards retail-based hybrid issuance accelerated over the years. The majority of new issuance now targets retail investors, predominantly self-managed superannuation funds, or SMSFs. There are still institutional-only hybrid issuances from Australian issuers, but these tend to be from issuers outside of the major banks seeking to raise a relatively low amount of funds. In this case, the relatively high fixed costs of launching a listed retail offer and the quicker execution make institutional issuance a convenient source of funding.
Hybrid security issuance by Australia’s major banks has been particularly strong since 2012. This has been driven by:
g Regulatory capital requirements imposed on banks by the Australian Prudential Regulatory Authority, or APRA, as part of the revised international banking regulatory framework, developed by the Basel Committee on Bank Supervision.
gIssuer desire for funding source diversification g Hybrids being generally cheaper than issuing equity
and not dilutive to equity holdersg More flexible terms and conditions
In contrast to bank hybrids, non-financial hybrid issuance has been subdued in recent years. We attribute this to a range of factors, including:
g Rating agencies tightening the criteria to qualify as equity credit. This has resulted in corporate hybrid issues losing their 100% equity classification in place of 50% in many instances. The part-debt designation increases the amount of debt an issuer holds on the balance sheet, which can hurt their credit rating
g Cheaper alternative funding sources, particularly global debt markets
g Time and cost of execution being too high relative to alternate funding options
18
g Subordination in the capital structure. The capital structure is made up of the different securities that a company sells to finance their operations. At the top of the capital structure, debt investors get the first claim to the assets of a business in the event of a bankruptcy. Equity investors receive only the residual value after everyone else gets paid. Hybrids sit in between debt and equity within the capital structure.
g Distributions may be deferrable, either at the issuer’s discretion (optional deferral) or in the event of covenant breaches (mandatory deferral), or both.
g The distribution may be either fixed, or as is the case for most Australian hybrids, floating. For floating rate hybrids, the distribution rate is tied to another interest rate.
g They are typically perpetual securities or have a long duration until maturity. Hybrids usually have one or more call options that give the issuer the right, but not the obligation, to redeem the security before the final maturity date. The investor does not have the right to request redemption before final maturity.
g Hybrid securities may have loss-absorption mechanisms, which require holders to absorb losses while the issuer is still a going concern. For example, capital notes issued by a bank that may qualify as regulatory capital may either convert into ordinary shares, possibly worth significantly less than the original investment, or be written off completely under certain conditions.
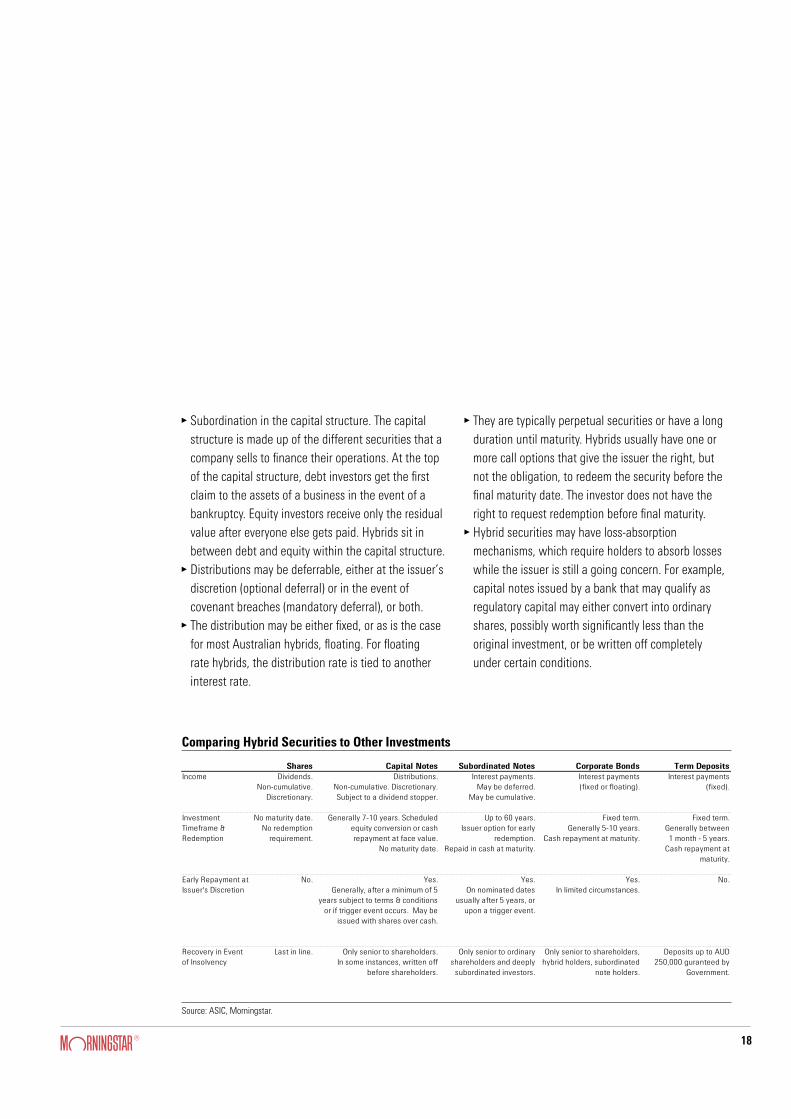
Comparing Hybrid Securities to Other Investments
Source: ASIC, Morningstar.
Credit Observer–Australian Hybrid Handbook | December 2017
Any Morningstar ratings/recommendations contained in this report are based on the full research report available from Morningstar or your adviser. © 2017 Morningstar, Inc. All rights reserved. Neither Morningstar, its affiliates, nor the content providers guarantee the data or content contained herein to be accurate, complete or timely nor will they have any liability for its use or distribution. Any general advice or ‘class service’ have been prepared by Morningstar Australasia Pty Ltd (ABN: 95 090 665 544, AFSL: 240892) and/or Morningstar Research Ltd, subsidiaries of Morningstar, Inc, without reference to your objectives, financial situation or needs. Refer to our Financial Services Guide (FSG) for more information at www.morningstar.com.au/s/fsg.pdf. You should consider the advice in light of these matters and if applicable, the relevant Product Disclosure Statement (Australian products) before making any decision to invest. Our publications, ratings and products should be viewed as an additional investment resource, not as your sole source of information. Past performance does not necessarily indicate a financial product’s future performance. To obtain advice tailored to your situation, contact a professional financial adviser. Some material is copyright and published under licence from ASX Operations Pty Ltd ACN 004 523 782 (“ASXO“).
Page 5 of 96
Page 5 of 96
Page 5 of 96
Page 5 of 96
Comparing Hybrid Securities to Other Investments
The Australian Securities & Investments Commission, or ASIC, has cautioned on numerous occasions
that hybrid securities are not "traditional fixed income", a common misperception among retail investors.
As Exhibit 3 highlights, hybrid securities contain several equity-like features that prevents them being
considered a true substitute for traditional fixed income or term deposits in an investor portfolio.
Exhibit 3 Comparing Hybrid Securities to Other Investments
Source: ASIC, Morningstar.
Types of Hybrid Securities
Subordinated Debt
Subordinated debt securities are typically long dated debt securities, sometimes up to 60 years, that
contain equity-like terms. These may include:
× Subordination – they rank behind other debt securities in the event of a winding up;
× Coupon deferral – they allow mandatory or optional coupon deferral options; and
× Loss absorption – they allow the issuer to write down unpaid coupon payments.
Subordinated notes issued by financial institutions generally contain different features to those issued
by non-financial issuers in order to satisfy prudential requirements to qualify as regulatory capital.
Perpetual Securities
Perpetual securities are typically, but not always, made up of two components, a fully paid debt security
and an unpaid preference share. These two components are stapled together and constitute the
perpetual security. They are often categorised as hybrid securities in that, like common stock, they don’t
have a maturity date. Although the issuer retains the right to redeem the securities at certain stages of
their life, they are not obligated to do so. Investors’ only option of redeeming the notes is by selling on
market, unless the issuer voluntarily decides to redeem them. They generally rank below subordinated
debt and allow deferral of interest payments.
Shares Capital Notes Subordinated Notes Corporate Bonds Term DepositsIncome Dividends.
Non-cumulative. Discretionary.
Distributions. Non-cumulative. Discretionary.Subject to a dividend stopper.
Interest payments. May be deferred.
May be cumulative.
Interest payments (fixed or floating).
Interest payments (fixed).
Investment Timeframe & Redemption
No maturity date.No redemption
requirement.
Generally 7-10 years. Scheduled equity conversion or cash repayment at face value.
No maturity date.
Up to 60 years. Issuer option for early
redemption.Repaid in cash at maturity.
Fixed term. Generally 5-10 years.
Cash repayment at maturity.
Fixed term. Generally between 1 month - 5 years.
Cash repayment at maturity.
Early Repayment at Issuer's Discretion
No. Yes. Generally, after a minimum of 5
years subject to terms & conditions or if trigger event occurs. May be
issued with shares over cash.
Yes. On nominated dates
usually after 5 years, or upon a trigger event.
Yes. In limited circumstances.
No.
Recovery in Event of Insolvency
Last in line. Only senior to shareholders. In some instances, written off
before shareholders.
Only senior to ordinary shareholders and deeply
subordinated investors.
Only senior to shareholders, hybrid holders, subordinated
note holders.
Deposits up to AUD 250,000 guranteed by
Government.

19
While many investors may consider hybrids as purely an income-generating investment, there is the possibility for capital losses and price volatility. The more equity-like a hybrid, the more the security will tend to fluctuate in price during periods of market volatility.
Examples of Hybrid Securities Across the Capital Structure
Credit Observer–Australian Hybrid Handbook | December 2017
Any Morningstar ratings/recommendations contained in this report are based on the full research report available from Morningstar or your adviser. © 2017 Morningstar, Inc. All rights reserved. Neither Morningstar, its affiliates, nor the content providers guarantee the data or content contained herein to be accurate, complete or timely nor will they have any liability for its use or distribution. Any general advice or ‘class service’ have been prepared by Morningstar Australasia Pty Ltd (ABN: 95 090 665 544, AFSL: 240892) and/or Morningstar Research Ltd, subsidiaries of Morningstar, Inc, without reference to your objectives, financial situation or needs. Refer to our Financial Services Guide (FSG) for more information at www.morningstar.com.au/s/fsg.pdf. You should consider the advice in light of these matters and if applicable, the relevant Product Disclosure Statement (Australian products) before making any decision to invest. Our publications, ratings and products should be viewed as an additional investment resource, not as your sole source of information. Past performance does not necessarily indicate a financial product’s future performance. To obtain advice tailored to your situation, contact a professional financial adviser. Some material is copyright and published under licence from ASX Operations Pty Ltd ACN 004 523 782 (“ASXO“).
Page 6 of 96
Page 6 of 96
Page 6 of 96
Page 6 of 96
Convertible Preference Shares
Convertible Preference Shares derive their name from the idea that holders receive ‘preference’ over
common equity holders to receive distributions and repayment of principal in the event of a winding up.
Like traditional debt, they pay a regular and defined distribution to holders; however, like equity they
have an element of permanence about them as there is no guaranteed date of redemption, that is, no
maturity date. Rather, they have optional and scheduled conversion dates where the shares can be
redeemed or converted into common stock, provided certain conditions are met. Should these conditions
not be met, the preference shares will remain outstanding until those conditions are satisfied.
Capital Notes
Capital Notes, which are very similar to Convertible Preference Shares, are subordinated, convertible,
redeemable and transferrable, unsecured and pay non-cumulative distributions that are franked. Capital
Notes are perpetual, which means they have no fixed maturity date and could remain on issue
indefinitely if they are not redeemed, converted or written-off. Issuers must convert Capital Notes into
ordinary shares if the scheduled conversion conditions on the scheduled conversion date are satisfied.
Capital Notes issued by regulated financial institutions include features to comply with APRA’s
requirements for securities that fund regulatory capital of APRA regulated entities.
Exhibit 4 Examples of Hybrid Securities Across the Capital Structure
Source: Morningstar. BBSW refers to the 3 Month Bank Bill Swap Rate.
Instrument Type Issuer ASX Ticker
Security Type Interest Rate
Payable
Franking Maturity Date
Optional Interest Deferral
Non-Viability or Capital Trigger
Capital Structure Ranking
Most Debt Like
Subordinated Debt
ANZ ANZHA Subordinated, unsecured
BBSW + 2.75%
No, distributions are interest payments
Jun 2022 No, unless ANZ is
insolvent
Neither Senior to Perpetual subordinated debt, preference shares and capital
notes and ordinary shares
Subordinated Debt with
Mandatory or Optional Interest
Deferral
Crown Resorts
CWNHA Subordinated, unsecured, cumulative
BBSW + 5.00%
No, distributions are interest payments
Sep 2072 Yes N/A Ranking only in priority to Crown’s ordinary shares, junior ranking
obligations and subsidiary junior ranking obligations
Subordinated Debt with Loss
Absorption
Suncorp SUNPD Subordinated, unsecured, cumulative
BBSW + 2.85%
No, distributions are interest payments
Nov 2023 Yes. Dividend Stopper
Non-Viability Trigger
Senior to ordinary shares and Additional Tier 1 Capital, equal with
other unsecured subordinated obligations, behind all
unsubordinated creditors
Perpetual Non-Cumulative Debt
NAB NABHA Unsecured, stapled, non-cumulative, perpetual
BBSW + 1.25%
No, distributions are interest payments
Perpetual Yes. Dividend Stopper
Neither Above ordinary shareholders, equal with preference shares and capital
notes but behind all other debt holders
Convertible Preference
Shares
WBC WBCPC Subordinated, unsecured, non-
cumulative, perpetual,
redeemable
BBSW + 3.25%
Yes Scheduled Conversion (Mar 2020)
Yes. Dividend Stopper
Capital Trigger Above ordinary shareholders, equal with preference shares and capital
notes but behind all other debt holders
Least Debt Like
Capital Notes CBA CBAPD Subordinated, unsecured, non-
cumulative, perpetual,
redeemable
BBSW + 2.80%
Yes Scheduled Conversion (Dec 2024)
Yes. Dividend Stopper.
Non-Viability and Capital
Trigger
Above ordinary shareholders, equal with preference shares and capital
notes but behind all other debt holders
Source: Morningstar. BBSW refers to the 3 Month Bank Bill Swap Rate.

20
Higher rate of return: Hybrid securities generally offer a relatively higher rate of return compared to senior debt, reflecting their subordination on the issuer capital structure.
Liquidity benefits: Although hybrid securities are less liquid than the ordinary shares of the underlying issuer, their secondary market liquidity is supported by their ASX listing.
Benefits of hybrids for investors
Credit Observer–Australian Hybrid Handbook | December 2017
Any Morningstar ratings/recommendations contained in this report are based on the full research report available from Morningstar or your adviser. © 2017 Morningstar, Inc. All rights reserved. Neither Morningstar, its affiliates, nor the content providers guarantee the data or content contained herein to be accurate, complete or timely nor will they have any liability for its use or distribution. Any general advice or ‘class service’ have been prepared by Morningstar Australasia Pty Ltd (ABN: 95 090 665 544, AFSL: 240892) and/or Morningstar Research Ltd, subsidiaries of Morningstar, Inc, without reference to your objectives, financial situation or needs. Refer to our Financial Services Guide (FSG) for more information at www.morningstar.com.au/s/fsg.pdf. You should consider the advice in light of these matters and if applicable, the relevant Product Disclosure Statement (Australian products) before making any decision to invest. Our publications, ratings and products should be viewed as an additional investment resource, not as your sole source of information. Past performance does not necessarily indicate a financial product’s future performance. To obtain advice tailored to your situation, contact a professional financial adviser. Some material is copyright and published under licence from ASX Operations Pty Ltd ACN 004 523 782 (“ASXO“).
Page 12 of 96
Page 12 of 96
Page 12 of 96
Page 12 of 96
Benefits of Hybrids for Investors
Hybrid securities offer a range of benefits to investors.
Higher rate of return
Reflecting their subordination on the issuer capital structure, hybrid securities generally offer a relatively
higher rate of return compared to senior debt.
Exhibit 9 National Australia Bank Capital Structure by Returns
Source: Morningstar. Data as at 22 August 2017.
Liquidity benefits
Although hybrid securities are less liquid than the ordinary shares of the underlying issuer, their
secondary market liquidity is supported by their ASX listing. We discuss liquidity in greater length in the
Key Risks section.
Income at a Higher Price Volatility than Fixed Income, but Lower Price Volatility than Equity
Hybrid securities generally pay a regular distribution while displaying lower price volatility than the
ordinary shares of the underlying issuer but a higher price volatility relative to the senior debt of the
issuer. Nevertheless, the possibility that distributions can be suspended or price volatility exceeds that
of the underlying equity remains.
Diversification benefits
Hybrid securities can diversify the overall risk of a portfolio while generating attractive returns, thereby
improving overall risk-return profiles. However, we reiterate that hybrid securities should not be
considered a like-for-like replacement for term deposits or pure debt. We believe they should be viewed
as a separate asset class with their own asset allocation to fully benefit from diversification benefits.
0.00%
1.00%
2.00%
3.00%
4.00%
5.00%
6.00%
7.00%
8.00%
9.00%
10.00%
Term Deposit (5 years) Senior Unsecured (Feb-23) Tier 2 (NABPE, 6yrs) Tier 1 (NABPD, 4.87yrs) FY18E Equity Dividend Yield
National Australia Bank Capital Structure by Returns
Source: Morningstar. Data as at 22 August 2017.
Income at a higher price volatility than fixed income, but lower price volatility than equity: Hybrid securities generally pay a regular distribution while displaying lower price volatility than the ordinary shares of the underlying issuer but a higher price volatility relative to the senior debt of the issuer. Nevertheless, the possibility that distributions can be suspended, or price volatility exceeds that of the underlying equity, remains.
Diversification benefits: Hybrid securities can diversify the overall risk of a portfolio while generating attractive returns, thereby improving overall risk-return profiles. However, we reiterate that hybrid securities should not be considered a like-for-like replacement for term deposits or pure debt. We believe they should be viewed as a separate asset class with their own asset allocation to fully benefit from diversification benefits.
For those wishing to learn more about hybrids please refer to Morningstar’s Hybrid Handbook
To see how Morningstar’s research on hybrids please refer to our Credit Research Archive

21
The Model Income Equity Portfolio aims to provide subscribers with a greater risk-adjusted returns and a higher sustainable franked dividend yield relative to the S&P/ASX 200 Accumulation Index in the long term. The portfolio is actively managed and concentrated consisting of ASX-listed stocks covered by Morningstar’s Equity Research team. Morningstar focuses portfolio exposure on companies with competitive advantages, a market price offering margin of safety, a sustainable dividend yield above the benchmark, and franking credits. This combination of
factors helps to preserve capital and reduce volatility in various market environments. Portfolio turnover is modest to minimise costs and further support after-tax performance. Morningstar Equity Research analysts’ ratings, such as Fair Value Estimate, Economic Moat, and Valuation Uncertainty, are important inputs to the portfolio construction process. Total return will tend to be driven more by income than capital appreciation, although both are of course desirable.
4 Your Money Weekly 9 August 2018 5
Morningstar Model Income Equity PortfolioPerformance and Allocation as at 31 July 2018
Portfolio Holdings Morningstar Ratings T= Shares Added Y= Shares Sold E= New Holding UR = Under Review
Stock Name % of Portfolio Morningstar Analyst Rating Morningstar Style Box Uncertainty Rating Moat Rating Stewardship Rating Code Fair Value ($) Price ($) Price/Fair Value EPS (c) DPS (c) Franking (%) (est) Price/Earnings (x) Forecast Div Yield (%) Market Cap ($m)
Cash 9.12 Telstra Corp 7.28 ■ QQQQQ Ç Medium Narrow Standard TLS 4.40 2.84 0.65 27.3 22.0 100.0 10.4 7.7 33,777
Medibank Private 5.87 ■ QQQ Ë Medium Narrow Standard MPL 3.10 3.11 1.00 17.0 13.0 100.0 18.3 4.2 8,565 Wesfarmers 5.78 ■ QQ È Medium Narrow Exemplary WES 37.50 49.46 1.32 251.1 221.0 100.0 19.7 4.5 56,080 QBE Insurance Group 5.59 ■ QQQQ Ç High None Standard QBE 12.00 10.10 0.84 71.0 45.0 30.0 14.2 4.5 13,628
Sydney Airport 5.56 ■ QQQ É Medium Narrow Standard SYD 7.20 7.07 0.98 18.1 36.5 0.0 39.0 5.2 15,930 Crown Resorts 5.47 ■ QQQ Ë High Narrow Standard CWN 14.00 13.50 0.96 56.8 60.6 60.0 23.8 4.5 9,280 Vicinity Centres 5.18 ■ QQQ È Medium Narrow Standard VCX 2.70 2.66 0.99 18.2 16.2 0.0 14.6 6.1 10,298 National Australia Bank 4.74 ■ QQQQ Ç Medium Wide Standard NAB 32.00 28.33 0.89 231.8 198.0 100.0 12.2 7.0 77,454 Commonwealth Bank 4.71 ■ QQQQ Ç Medium Wide Standard CBA 83.00 74.79 0.90 569.9 430.0 100.0 13.1 5.7 131,619
Westpac Banking Corp 4.63 ■ QQQQ Ç Medium Wide Exemplary WBC 35.00 29.46 0.84 247.5 188.0 100.0 11.9 6.4 101,189 Scentre Group 4.39 ■ QQ È Medium Narrow Standard SCG 3.85 4.25 1.10 25.2 22.2 0.0 16.9 5.2 22,597 Coca-Cola Amatil 4.33 ■ QQQ Ê Medium Narrow Standard CCL 9.40 9.58 1.02 53.3 45.0 70.0 18.0 4.7 6,936 Sonic Healthcare 4.20 ■ QQQ É Medium Narrow Standard SHL 24.00 26.08 1.09 111.9 78.0 20.0 23.3 3.0 11,076 Woodside Petroleum 3.29 ■ QQQQ É High None Standard WPL 45.00 36.14 0.80 215.1 171.5 100.0 16.8 4.7 33,833
Healthscope 3.28 ■ QQQ Ë Medium Narrow Standard HSO 2.40 2.18 0.91 10.8 7.5 0.0 20.3 3.4 3,793 Brambles 3.12 ■ QQQQ È Medium Wide Standard BXB 11.20 9.88 0.88 53.1 29.0 30.0 18.6 2.9 15,728 AGL Energy 3.02 ■ QQQ È Medium Narrow Standard AGL 21.00 21.99 1.05 150.4 112.0 80.0 14.6 5.1 14,422 Spark New Zealand 2.67 ■ QQQ Ê Medium Narrow Standard SPK 3.40 3.56 1.05 20.9 23.0 0.0 17.0 6.5 6,534 Carsales.com 2.36 ■ QQQ Ì Medium Narrow Standard CAR 13.90 13.94 1.00 54.4 44.0 100.0 25.6 3.2 3,387
Unibail-Rodamco-Westfield ADR 2.17 ■ QQQ Ç Medium Narrow Standard URW 14.00 14.87 1.06 99.2 90.7 0.0 15.0 6.1 7,187 Ramsay Health Care 1.63 ■ QQQQQ É Medium Narrow Exemplary RHC 82.00 56.24 0.69 279.9 142.7 100.0 20.1 2.5 11,365 MYOB Group 1.61 ■ QQQQ Î Medium Narrow Standard MYO 3.82 3.13 0.82 16.9 11.0 0.0 18.5 3.5 1,859
Grand Total 0.93 60.2 18.0 4.6
5.0
4.0
3.0
2.0
1.0
0.0
-1.0
Total Return (x)
Portfolio S&P/ASX 200 Accum. Index
07-0
1
07-0
2
07-0
3
07-0
4
07-0
5
07-0
6
07-0
7
07-0
8
07-0
9
07-1
0
07-1
1
07-1
2
07-1
3
07-1
4
07-1
5
07-1
6
07-1
7
07-1
8
Portfolio Returns (%)
CAGR except 1 Year and YTD PortfolioS&P/ASX 200 Accum. Index
YTD -0.02 5.73
1 Year 6.35 14.59
3 Year 3.24 7.98
5 Year 7.58 9.17
10 Year 8.66 7.05
Since Inception 11.04 8.39
y Financial Services 25.5
u Real Estate 11.6
s Consumer Defensive 10.1
i Comm. Services 9.8
d Healthcare 9.2
Value Core Growth
32 24 16 Larg
e
8 16 3 Med
0 2 0 Smal
l
Style Breakdown (%)Portfolio Distributions* (%)
Top Five Sectors (%)
Moat Rating
Stewardship Rating
Uncertainty Rating
Price/Fair Value†
79%
12% 17%
48%
35%
p Wide
p Narrow
p None
p Exemplary
p Standard
p High
p Medium
p Discount
p Fairly Valued
p Premium
■ 0–10
■ 10–25
■ 25–50
■ 51–100
* Weighted ex-cash, hence <100%.
77%
14%
65%
17%9%
-100
0
100
200
300
400
500
What is the Morningstar Model Income Equity Portfolio? We started the Morningstar Model Income Equity Portfolio in 2001 as a model (theoretical) portfolio to demonstrate the returns potentially achievable (on the basis described below) from a concentrated portfolio of high quality income-producing shares. The target dividend yield for stocks in the model portfolio is greater than the benchmark S&P/ASX 200 Accum Index (the ‘Benchmark Index’), which is also effectively a model equities portfolio with reinvestment of dividends. The Morningstar Model Income Equity Portfolio aims to have 15–30 holdings with limited trading. Companies with narrow or wide economic moats and low or medium uncertainty feature heavily in the model because of their more predictable cash flows, more stable dividends, and generally lower share price volatility.
How do Income Portfolio stocks compare with the Benchmark Index?The Morningstar Model Income Equity Portfolio is generally invested in similar classes of equities as the (model) Benchmark Index in terms of investment objectives, types of investments, countries and markets/sectors covered. Both the model portfolio and the benchmark are therefore exposed to some normal investment risks such as foreign exchange, sector, manager and liquidity risk, but not to risks such as derivatives. As both represent equity investments,
they are likely to experience volatility common with the asset class, although it is our goal to generate less risk than the benchmark in the long-run. We have achieved this historically by focusing on high quality, undervalued, sustainable dividend yield investments, but cannot guarantee future success.
How is performance calculated?Performance for both the Morningstar Model Income Equity Portfolio and the benchmark is expressed on the following basis and assumptions so that we are comparing ‘apples with apples’: 3 before deduction of fees (ie entry, exit, performance or
management fees), costs and taxes payable by either the Portfolio/benchmark or the investor; 3 without allowing for franking credits or interest earned
on cash balances; and 3 dividends that would notionally be received are
theoretically reinvested without any tax deduction.
Where this model is offered as an investable option by third party providers, management fees of between 0.44% and 0.85% (inclusive of GST) will be charged. There may also be performance fees (ranging from 10%–15% of outperformance) charged. Third party providers may also charge their own fees which will vary between providers. K
DisclaimerPerformance results represent modelled performance only. Past performance of any investment is not a reliable indicator of future performance and the performance described here is of a theoretical model. The model performance will differ from actual performance which follows that model depending on actual fees, taxes and other factors including transaction timing and divergence from constituent weightings, rounding adjustments and minimum trade sizes.
Morningstar Valuation & Fundamentals4 Your Money Weekly 9 August 2018 5
Morningstar Model Income Equity PortfolioPerformance and Allocation as at 31 July 2018
Portfolio Holdings Morningstar Ratings T= Shares Added Y= Shares Sold E= New Holding UR = Under Review
Stock Name % of Portfolio Morningstar Analyst Rating Morningstar Style Box Uncertainty Rating Moat Rating Stewardship Rating Code Fair Value ($) Price ($) Price/Fair Value EPS (c) DPS (c) Franking (%) (est) Price/Earnings (x) Forecast Div Yield (%) Market Cap ($m)
Cash 9.12 Telstra Corp 7.28 ■ QQQQQ Ç Medium Narrow Standard TLS 4.40 2.84 0.65 27.3 22.0 100.0 10.4 7.7 33,777
Medibank Private 5.87 ■ QQQ Ë Medium Narrow Standard MPL 3.10 3.11 1.00 17.0 13.0 100.0 18.3 4.2 8,565 Wesfarmers 5.78 ■ QQ È Medium Narrow Exemplary WES 37.50 49.46 1.32 251.1 221.0 100.0 19.7 4.5 56,080 QBE Insurance Group 5.59 ■ QQQQ Ç High None Standard QBE 12.00 10.10 0.84 71.0 45.0 30.0 14.2 4.5 13,628
Sydney Airport 5.56 ■ QQQ É Medium Narrow Standard SYD 7.20 7.07 0.98 18.1 36.5 0.0 39.0 5.2 15,930 Crown Resorts 5.47 ■ QQQ Ë High Narrow Standard CWN 14.00 13.50 0.96 56.8 60.6 60.0 23.8 4.5 9,280 Vicinity Centres 5.18 ■ QQQ È Medium Narrow Standard VCX 2.70 2.66 0.99 18.2 16.2 0.0 14.6 6.1 10,298 National Australia Bank 4.74 ■ QQQQ Ç Medium Wide Standard NAB 32.00 28.33 0.89 231.8 198.0 100.0 12.2 7.0 77,454 Commonwealth Bank 4.71 ■ QQQQ Ç Medium Wide Standard CBA 83.00 74.79 0.90 569.9 430.0 100.0 13.1 5.7 131,619
Westpac Banking Corp 4.63 ■ QQQQ Ç Medium Wide Exemplary WBC 35.00 29.46 0.84 247.5 188.0 100.0 11.9 6.4 101,189 Scentre Group 4.39 ■ QQ È Medium Narrow Standard SCG 3.85 4.25 1.10 25.2 22.2 0.0 16.9 5.2 22,597 Coca-Cola Amatil 4.33 ■ QQQ Ê Medium Narrow Standard CCL 9.40 9.58 1.02 53.3 45.0 70.0 18.0 4.7 6,936 Sonic Healthcare 4.20 ■ QQQ É Medium Narrow Standard SHL 24.00 26.08 1.09 111.9 78.0 20.0 23.3 3.0 11,076 Woodside Petroleum 3.29 ■ QQQQ É High None Standard WPL 45.00 36.14 0.80 215.1 171.5 100.0 16.8 4.7 33,833
Healthscope 3.28 ■ QQQ Ë Medium Narrow Standard HSO 2.40 2.18 0.91 10.8 7.5 0.0 20.3 3.4 3,793 Brambles 3.12 ■ QQQQ È Medium Wide Standard BXB 11.20 9.88 0.88 53.1 29.0 30.0 18.6 2.9 15,728 AGL Energy 3.02 ■ QQQ È Medium Narrow Standard AGL 21.00 21.99 1.05 150.4 112.0 80.0 14.6 5.1 14,422 Spark New Zealand 2.67 ■ QQQ Ê Medium Narrow Standard SPK 3.40 3.56 1.05 20.9 23.0 0.0 17.0 6.5 6,534 Carsales.com 2.36 ■ QQQ Ì Medium Narrow Standard CAR 13.90 13.94 1.00 54.4 44.0 100.0 25.6 3.2 3,387
Unibail-Rodamco-Westfield ADR 2.17 ■ QQQ Ç Medium Narrow Standard URW 14.00 14.87 1.06 99.2 90.7 0.0 15.0 6.1 7,187 Ramsay Health Care 1.63 ■ QQQQQ É Medium Narrow Exemplary RHC 82.00 56.24 0.69 279.9 142.7 100.0 20.1 2.5 11,365 MYOB Group 1.61 ■ QQQQ Î Medium Narrow Standard MYO 3.82 3.13 0.82 16.9 11.0 0.0 18.5 3.5 1,859
Grand Total 0.93 60.2 18.0 4.6
5.0
4.0
3.0
2.0
1.0
0.0
-1.0
Total Return (x)
Portfolio S&P/ASX 200 Accum. Index
07-0
1
07-0
2
07-0
3
07-0
4
07-0
5
07-0
6
07-0
7
07-0
8
07-0
9
07-1
0
07-1
1
07-1
2
07-1
3
07-1
4
07-1
5
07-1
6
07-1
7
07-1
8
Portfolio Returns (%)
CAGR except 1 Year and YTD PortfolioS&P/ASX 200 Accum. Index
YTD -0.02 5.73
1 Year 6.35 14.59
3 Year 3.24 7.98
5 Year 7.58 9.17
10 Year 8.66 7.05
Since Inception 11.04 8.39
y Financial Services 25.5
u Real Estate 11.6
s Consumer Defensive 10.1
i Comm. Services 9.8
d Healthcare 9.2
Value Core Growth
32 24 16 Larg
e
8 16 3 Med
0 2 0 Smal
l
Style Breakdown (%)Portfolio Distributions* (%)
Top Five Sectors (%)
Moat Rating
Stewardship Rating
Uncertainty Rating
Price/Fair Value†
79%
12% 17%
48%
35%
p Wide
p Narrow
p None
p Exemplary
p Standard
p High
p Medium
p Discount
p Fairly Valued
p Premium
■ 0–10
■ 10–25
■ 25–50
■ 51–100
* Weighted ex-cash, hence <100%.
77%
14%
65%
17%9%
-100
0
100
200
300
400
500
What is the Morningstar Model Income Equity Portfolio? We started the Morningstar Model Income Equity Portfolio in 2001 as a model (theoretical) portfolio to demonstrate the returns potentially achievable (on the basis described below) from a concentrated portfolio of high quality income-producing shares. The target dividend yield for stocks in the model portfolio is greater than the benchmark S&P/ASX 200 Accum Index (the ‘Benchmark Index’), which is also effectively a model equities portfolio with reinvestment of dividends. The Morningstar Model Income Equity Portfolio aims to have 15–30 holdings with limited trading. Companies with narrow or wide economic moats and low or medium uncertainty feature heavily in the model because of their more predictable cash flows, more stable dividends, and generally lower share price volatility.
How do Income Portfolio stocks compare with the Benchmark Index?The Morningstar Model Income Equity Portfolio is generally invested in similar classes of equities as the (model) Benchmark Index in terms of investment objectives, types of investments, countries and markets/sectors covered. Both the model portfolio and the benchmark are therefore exposed to some normal investment risks such as foreign exchange, sector, manager and liquidity risk, but not to risks such as derivatives. As both represent equity investments,
they are likely to experience volatility common with the asset class, although it is our goal to generate less risk than the benchmark in the long-run. We have achieved this historically by focusing on high quality, undervalued, sustainable dividend yield investments, but cannot guarantee future success.
How is performance calculated?Performance for both the Morningstar Model Income Equity Portfolio and the benchmark is expressed on the following basis and assumptions so that we are comparing ‘apples with apples’: 3 before deduction of fees (ie entry, exit, performance or
management fees), costs and taxes payable by either the Portfolio/benchmark or the investor; 3 without allowing for franking credits or interest earned
on cash balances; and 3 dividends that would notionally be received are
theoretically reinvested without any tax deduction.
Where this model is offered as an investable option by third party providers, management fees of between 0.44% and 0.85% (inclusive of GST) will be charged. There may also be performance fees (ranging from 10%–15% of outperformance) charged. Third party providers may also charge their own fees which will vary between providers. K
DisclaimerPerformance results represent modelled performance only. Past performance of any investment is not a reliable indicator of future performance and the performance described here is of a theoretical model. The model performance will differ from actual performance which follows that model depending on actual fees, taxes and other factors including transaction timing and divergence from constituent weightings, rounding adjustments and minimum trade sizes.
Morningstar Valuation & Fundamentals
Model Income Equity Portfolio
Dividends may not be the only path for an individual investor’s success, but if there’s a better one, I have yet to find it. Josh Peters

22
Glossary
Dividend (or dividend rate): We express most of our dividend data for individual stocks as an annualized amount based on the most recently declared amount per share multiplied by the frequency of dividends during a year. For example, CleanUp, Inc. declared an interim dividend of $0.78 a share in February 2016 and final dividend of $1 in September 2016, so its annualized dividend rate is $1.78 a share. Dividends in Australia are typically paid twice a year. To find historical dividend figures of ASX shares, please enter a ticker and review the Dividend History section.
Dividend growth rate: This figure reflects the compound annual growth rate in the company’s annual dividend payments over the preceding ten, five and one-year period. We also make forward-looking projections for dividend growth—typically over the upcoming 2-year period—which are also expressed as a CAGR. To find historical dividend growth and projections of ASX shares, please enter a ticker and review the Key Measures section.
Dividend yield (or current yield): A stock’s yield is the annual dividend rate divided by the stock’s current price. If CleanUp, Inc. trades at $95, and the dividend rate is $3.12 a share, the yield is 3.3%. While dividends are not contractual obligations the way a bond’s interest payments are, dividend yield provides a reference for the income potential of a given stock versus other stocks and other income- generating securities. To find the dividend yield and comparisons to the overall market yield and sector yield, enter a ticker and review the Key Measures section.
23
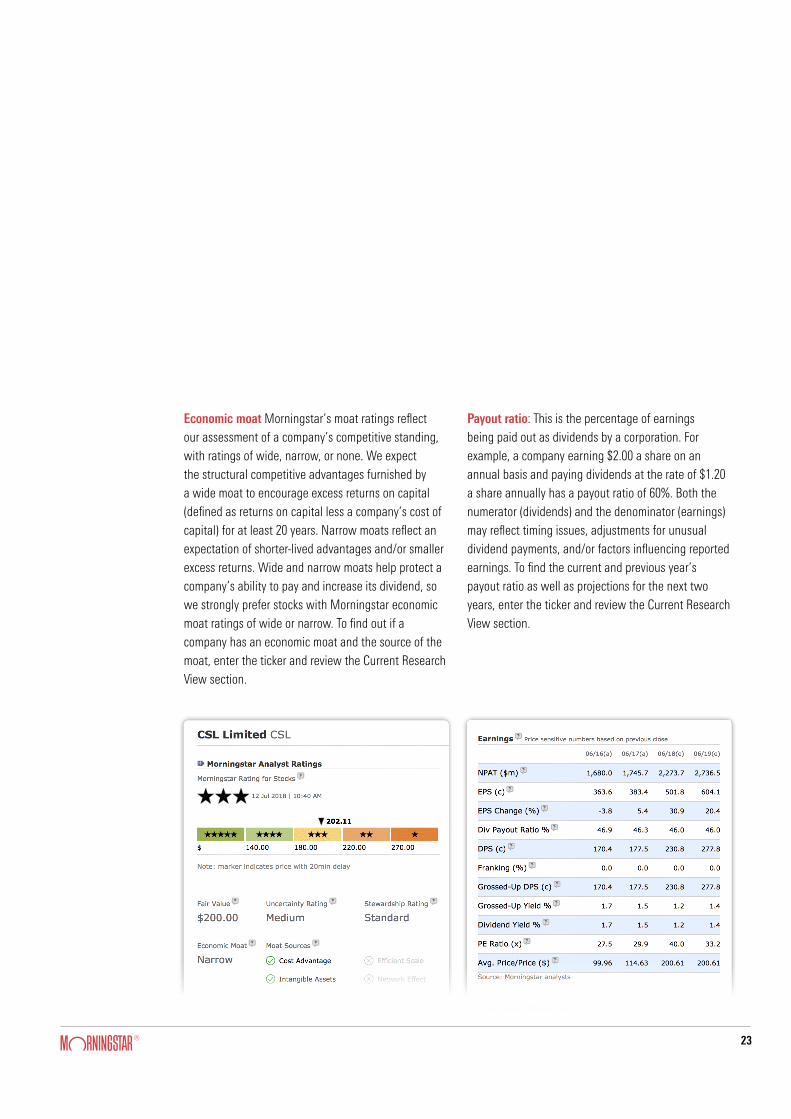
Economic moat Morningstar’s moat ratings reflect our assessment of a company’s competitive standing, with ratings of wide, narrow, or none. We expect the structural competitive advantages furnished by a wide moat to encourage excess returns on capital (defined as returns on capital less a company’s cost of capital) for at least 20 years. Narrow moats reflect an expectation of shorter-lived advantages and/or smaller excess returns. Wide and narrow moats help protect a company’s ability to pay and increase its dividend, so we strongly prefer stocks with Morningstar economic moat ratings of wide or narrow. To find out if a company has an economic moat and the source of the moat, enter the ticker and review the Current Research View section.
Payout ratio: This is the percentage of earnings being paid out as dividends by a corporation. For example, a company earning $2.00 a share on an annual basis and paying dividends at the rate of $1.20 a share annually has a payout ratio of 60%. Both the numerator (dividends) and the denominator (earnings) may reflect timing issues, adjustments for unusual dividend payments, and/or factors influencing reported earnings. To find the current and previous year’s payout ratio as well as projections for the next two years, enter the ticker and review the Current Research View section.

24
Dividend Stability: This calculation is designed to assess the probability of a future cut in dividends based on the company’s 10- year track record. It is based on two factors: (1) The number of times in the last 10 years (or less, if data is not available), in which the annual dividend has been cut. This percentage is then multiplied by the average percentage size of the cut. The higher the percentage, the more stable the dividend. A dividend stability of 100 percent indicates no dividend cuts have been recorded. To find the current and previous year’s payout ratio as well as projections for the next two years, enter the ticker and review the Key Measures section.
