monitoring alcohol consumption and harm during the covid
TRANSCRIPT
1
Monitoring alcohol consumption and harm during the COVID-19 pandemic
Monitoring alcohol consumption and harm during the COVID-19 pandemic
2
Contents Executive summary ............................................................................................................. 3
Background ..................................................................................................................... 3
Changes to alcohol consumption in 2020 ........................................................................ 3
Changes to alcohol-specific morbidity and mortality in 2020 ........................................... 4
Conclusion ....................................................................................................................... 6
1. Introduction ..................................................................................................................... 7
2. Alcohol consumption during the COVID-19 pandemic .................................................... 9
2.1 Monitoring changes in alcohol consumption using alcohol duty clearances ............ 10
2.2 Comparing HMRC duty receipts and Kantar off-trade volume sales data ............... 25
2.3 A summary of surveys measuring self-reported alcohol consumption ..................... 30
3. Alcohol-specific morbidity and mortality during the COVID-19 pandemic ..................... 48
3.1 Alcohol-specific hospital admissions ....................................................................... 48
3.2 Alcohol-specific deaths ............................................................................................ 59
3.3 Trends in verbal and physical abuse at home ......................................................... 72
4. Conclusion .................................................................................................................... 75
5. References .................................................................................................................... 77
Monitoring alcohol consumption and harm during the COVID-19 pandemic
3
Executive summary
Background This report collates data on alcohol consumption and alcohol-related harm in England throughout the coronavirus (COVID-19) pandemic and compares it to data from previous years. The report’s aim is to understand how indicators of alcohol consumption and harm have changed while the social and physical restrictions to prevent and control COVID-19 were in place. These restrictions led to changes in the availability of alcohol, most notably the approximately 31-week closure of on-trade premises, such as pubs and restaurants, during national lockdowns.
Changes to alcohol consumption in 2020 The total volume of duty-paid alcohol for the year of the pandemic (2020 to 2021) was 1.2% less than the year before the pandemic (2019 to 2020). This is despite the closure of on-trade premises during national lockdowns. In 2020 to 2021, duty-paid wine and spirits increased compared to 2019 to 2020 (+8.9% and +7.3% respectively), while cider and beer decreased (-16.7% and -14.0% respectively). The diverging trends likely relate to the fact that beer and cider are more often bought in on-trade settings, so are probably more affected by on-trade closures. Data from a consumer purchasing panel that measures off-trade volume sales of alcohol shows that between 2019 and 2020 (before and during the pandemic), volume sales increased by 25.0%. This increase was consistent and sustained for most of 2020. We saw increases for all product types, with the largest relative increase for beer (+31.2%), followed by spirits (+26.2%), wine (+19.5%), and cider (+17.6%). It’s worth noting that cider and beer saw the largest relative decreases when looking at the trends in duty-paid volume of alcohol. To understand whether consumers who typically buy different volumes of alcohol showed different trends, we selected a subsample of buyers with continuous data reporting. We then split these buyers into 5 equal sized groups (quintiles) based on the volume of alcohol they bought weekly in the 2 years before the first national lockdown. For this subsample, between 2019 to 2020 and 2020 to 2021, total volume off-trade sales increased by 24.4%. In absolute terms, the heaviest buying quintile increased their purchasing by 5.3 million litres of alcohol (+14.3%). Of the 12,607,408 extra litres of alcohol bought in 2020 to 2021 compared to 2019 to 2020, the heaviest buying quintile
Monitoring alcohol consumption and harm during the COVID-19 pandemic
4
accounted for 42% of the total increase. This proportion increased to 68.3% of the total increase when including the top 2 heaviest buying quintiles. Taken together, all survey data measuring self-reported alcohol consumption suggests a polarisation in drinking. Most respondents reported drinking the same volume and the same frequency as they did before the pandemic. Roughly similar proportions of respondents reported drinking more or more frequently and drinking less or less frequently. Where surveys measured a respondent’s drinking before the pandemic, they suggest that people who reported drinking more during the pandemic than before tended to be heavier drinkers. Generally, the surveys and polls were low quality and reporting of methods varied. Higher quality repeated cross-sectional surveys gave a clearer picture. These surveys suggest that respondents were more likely to report increasing their alcohol consumption during the pandemic compared to previous years. For example, between March 2020 and March 2021, there was a 58.6% increase in the proportion of respondents drinking at increasing risk and higher risk levels. Importantly, this data shows a step-change around the time the pandemic began, where the prevalence of increasing risk and higher risk drinking increased and then continued to be higher than previous years throughout the pandemic year.
Changes to alcohol-specific morbidity and mortality in 2020 In 2020 (during the pandemic), rates of unplanned admissions to hospital for alcohol specific causes decreased by 3.2% compared to 2019 (before the pandemic). This is likely to be related to reduced admissions for mental and behavioural disorders due to alcohol use. Unplanned admissions for alcoholic liver disease were the only alcohol specific unplanned admissions to increase between 2019 and 2020. This increase was 13.5%, and from June 2020 onwards, there were significant and sustained increases in the rate of unplanned admissions for alcoholic liver disease. We saw rapid decreases in the rate of alcohol specific admissions that coincided with the start of the pandemic (around February 2020). However, this finding is not unique to alcohol. All unplanned admissions, irrespective of their cause, sharply decreased as the pandemic took hold. They also remained significantly lower than baseline (weighted average of 2018 and 2019) throughout 2020 and 2021. This ‘lockdown effect’ likely relates to psychological factors where people reported avoiding hospitals to ease pressure on the NHS. It is also likely that people thought hospitals were high-risk settings for catching COVID-19 and were also concerned about leaving the house.
5
Monitoring alcohol consumption and harm during the COVID-19 pandemic
In 2020, there was a 20.0% increase in total alcohol specific deaths compared to 2019. We also saw significantly higher rates from May 2020 onwards (33.0% of deaths occurred in the most deprived group). Deaths from mental and behavioural disorders due to alcohol increased by 10.8% (compared to a 1.1% increase between 2018 and 2019), and deaths from alcohol poisoning increased by 15.4% (compared to a decrease of 4.5% between 2018 and 2019).
The upward trend in total alcohol specific deaths was brought about by increases in deaths from alcoholic liver disease. Alcoholic liver deaths accounted for 80.3% of total alcohol specific deaths in 2020 and saw a 20.8% increase between 2019 and 2020. From July 2020 onwards, rates of alcoholic liver disease deaths were significantly and consistently higher than baseline. Data from previous years shows a rapid acceleration in deaths from alcoholic liver disease during the year of the pandemic, beyond that of the pre-existing upward trend. For example, the increase in alcoholic liver deaths between 2018 and 2019 was 2.9%. December 2020 rates of alcoholic liver disease deaths were 58.1% higher than the corresponding baseline month (11.7 per 100,000 population compared to 7.4) which was the greatest proportional difference across 2020 and 2021 data compared to monthly baselines.
Although alcohol related cirrhosis can take a decade or more to develop, most deaths occur as a result of acute-on-chronic liver failure due to recent alcohol intake, which is strongly linked to heavy drinking. Liver mortality rates respond rapidly to changes in population level alcohol consumption and particularly to changes in drinking patterns of heavy drinkers, as we have seen during this pandemic. Liver mortality rates in England have increased 43% between 2001 and 2019, to the extent that liver disease is now the second leading disease causing premature death among people of working age.
Monitoring alcohol consumption and harm during the COVID-19 pandemic
6
Conclusion We will continue to monitor alcohol consumption and harm to investigate changes and develop appropriate policy and intervention responses. Tackling alcohol consumption and harm must be an essential part of the UK government’s COVID-19 recovery plan, given that tackling geographic health disparities are part of the government’s Build Back Better plans. Alcohol harm is a major risk factor driving these differences. Long-term, sustained action to prevent and reduce liver disease remains a priority for public health, given the stark trends in significantly higher alcoholic liver deaths, likely because of increased consumption among an already at-risk group of heavy drinkers. Before the pandemic, there were already increased alcohol-related hospital admissions and deaths. The pandemic seems to have accelerated these trends.
Monitoring alcohol consumption and harm during the COVID-19 pandemic
7
1. Introduction COVID-19 is a contagious respiratory disease first identified in Wuhan, China, in 2019. It has since spread worldwide leading to an ongoing pandemic. As of the 8 July 2021, the COVID‐19 pandemic has infected over 184 million people worldwide with more than 3.9 million deaths recorded (1). In the UK, as of the 8 July 2021, there have been almost 5 million people who have been infected (2), 128,301 deaths within 28 days of testing positive for COVID-19, and 152,725 deaths recorded with COVID-19 on the death certificate (3). Globally and nationally, these estimates are thought to be an underestimate (4). This report collates data on alcohol consumption and alcohol-related harm in England across the period of the pandemic and compares it to data from previous years. The aim is to understand how alcohol consumption and alcohol-related harm has changed in England while physical and social restrictions to prevent and control COVID-19 were in place. Public health responses to the pandemic have included actions that affect the sale of alcohol and vary across countries. For example, during the pandemic, countries including India and South Africa introduced total bans on the sale of alcohol with the aim of reducing alcohol-related violence and its burden on healthcare (5, 6). Other countries have introduced partial bans for similar reasons. For example, Russia limited the hours that alcohol was available for sale in some regions (7). In some (mostly high-income) countries across Europe and North America, alcohol was declared, explicitly or implicitly, to be one of many ‘essential goods’ (8). This meant the sale of alcohol was permitted in some form. In the UK, USA, Canada, and New Zealand, some alcohol retailers were allowed to remain open during a national lockdown (8, 9). In England, alcohol is sold for consumption in on-trade and off-trade premises. On-trade premises sell alcohol to be consumed on-site and include pubs and restaurants. Off-trade premises sell alcohol to be consumed off-site and include supermarkets. Actions to prevent and contain the spread of COVID-19 have led to some alcohol retailers in England closing. Off-trade retailers have remained open throughout all of 2020. The following on-trade retailers have remained shut since the start of the first national lockdown on 23 March 2020: nightclubs, dance venues, and sexual entertainment venues (10). During this national lockdown, on-trade retailers, such as pubs and restaurants, were closed and remained so until 4 July 2020 when they were permitted to open once again. During this first lockdown, some on-trade retailers diversified and started to operate as off-trade retailers by, for example, serving takeaway beer (11). However, the scale of this in England is unknown. From July 2020, the government took a regional approach that permitted local authorities to determine the restrictions on on-trade alcohol retailers (12). This would likely have

Monitoring alcohol consumption and harm during the COVID-19 pandemic
8
reduced the availability of alcohol in on-trade settings compared to before the pandemic. However, there is no national intelligence on the extent of these restrictions. From 14 October 2020, England moved to a 3-tier approach where much of the on-trade was again closed, or open with restrictions such as a 10pm curfew or serving alcohol only with a substantial meal (13). This tiered approach meant that different local authorities had different rules, at different times. This approach was in place until the second national lockdown which started on 5 November 2020 when on-trade retailers were again closed. The second national lockdown lasted roughly a month, ending on 2 December 2020. This was followed by a return to the tiered-approach. This time it included a more restrictive fourth tier which required on-trade retailers to shut but could serve takeaway alcohol (14). Again, there is no national intelligence on the provision of on-trade sales. A third national lockdown started on 5 January 2021 that, again, prevented on-trade retailers from selling alcohol to be consumed onsite (15). Following this, restrictions were gradually eased: on-trade retailers were permitted to open for service in gardens and outdoor spaces only from 12 April 2021, then customers were permitted to eat and drink inside from 17 May 2021.
Monitoring alcohol consumption and harm during the COVID-19 pandemic
9
2. Alcohol consumption during the COVID-19 pandemic This section reports the changes in alcohol consumption and sales throughout 2020 using 3 main datasets: 1. Alcohol duty receipts. 2. Off-trade alcohol sales data. 3. Surveys that measure self-reported alcohol consumption. Alcohol consumption in England is most commonly measured using large household surveys such as the Health Survey for England (HSE) (16). The HSE was not suitable for monitoring consumption during the pandemic for 2 important reasons. 1. The survey results are released 12 months after the calendar year in question. 2. The survey stopped at the start of lockdown and was not able to restart due to social
distancing measures. Early in the pandemic, Public Health England (PHE) had the opportunity to include a question on alcohol consumption in the YouGov panel survey. This question asking about alcohol consumption was based on the HSE question to allow for comparison and is reported on PHE’s Wider Impacts of COVID-19 on Health dashboard (WICH) (17). When the findings of surveys are compared to population-level sales data, research suggests that they typically underestimate population consumption between 55% and 60% (18, 19). This reflects recall and social desirability biases, and under-sampling of heavy drinkers in surveys (20, 21). To overcome some of these limitations, survey data can be compared against duty clearances or sales data (22). Alcohol duty clearances report the total volume of product released for sale and for which duty has been paid in both on-trade and off-trade settings in the UK (23). So, they cannot measure when products were bought, rather, they detail when goods were cleared onto the UK market by traders for purchase and consumption. Duty receipts are published monthly (23) and quarterly (24). Clearances are not a perfect measure of consumption since they cannot identify products that are: • bought but not yet consumed • bought by tourists • consumed abroad • personally imported by UK residents • brewed at-home (22)
Monitoring alcohol consumption and harm during the COVID-19 pandemic
10
Commercial data, such as Kantar Worldpanel data, provides information on volume sales of alcohol relatively quickly (25). The data is derived from a representative household sample of the population in Great Britain (GB) who scan the barcodes of products that are purchased and consumed at-home. This overcomes the issue of tourism that arises when using duty receipts, however, the data only includes off-trade sales and not on-trade sales.
2.1 Monitoring changes in alcohol consumption using alcohol duty clearances This section uses the latest published data from HM Revenue and Customs (HMRC) on alcohol duty receipts (26). It reports the change in the volume of alcohol for which duty has been paid in the UK (in this report we call this duty-paid alcohol) and includes both on-trade and off-trade sales. Alcohol traders can claim back the duty paid on spoilt alcohol, which is deducted from the total figures. We report data between January 2018 and March 2021 (the latest available data), though the data for February and March 2021 is provisional. Traders pay duty on alcohol products with more than 1.2% alcohol by volume (ABV). Beer and spirits are taxed and reported by HMRC based on alcohol content, in hectolitres of alcohol. A hectolitre is a metric unit of capacity equal to 100 litres. Wine and cider are taxed and reported by product volume, not accounting for %ABV. So, we have converted these into hectolitres of alcohol by applying the average %ABV to the volume of product for which duty was paid. To do this, we use the average %ABV categories from PHE’s analysis of the typical %ABV content of alcoholic products sold in the off-trade (27). For wine, this is 11.9%ABV and for cider, this is 4.9%ABV. There are limitations of the HMRC data you should consider. The numbers reflect the payments received by HMRC and are a proxy for consumption. Also, clearances relate to when goods entered the market (at which point duty is due), with receipts then received by HMRC from traders in the following month. Trends in the volume of duty-paid alcohol Data for the financial year 2020 to 2021 (during the pandemic) reports duty receipts equal to 5,353,583 hectolitres of alcohol (26). This is 1.2% less than in 2019 to 2020 and 2.1% less than in 2018 to 2019 (before the pandemic), despite on-trade premises being closed for almost two-thirds of the financial year (approximately 31 weeks).1 Compared to 2019 to 2020, in 2020 to 2021 wine and spirits saw increases of 8.9% and 7.3% respectively,
1 This figure underestimates the length of on-trade closures because only periods of national lockdown are counted. During England's tiered-approach to preventing and containing COVID-19, on-trade outlets in tier 3 and 4 areas could serve alcohol to be consumed off-site, though not all outlets diversified. All but one local authority was in tier 3 or 4 before the third national lockdown (6 January 2021) (see withdrawn guidance).
Monitoring alcohol consumption and harm during the COVID-19 pandemic
11
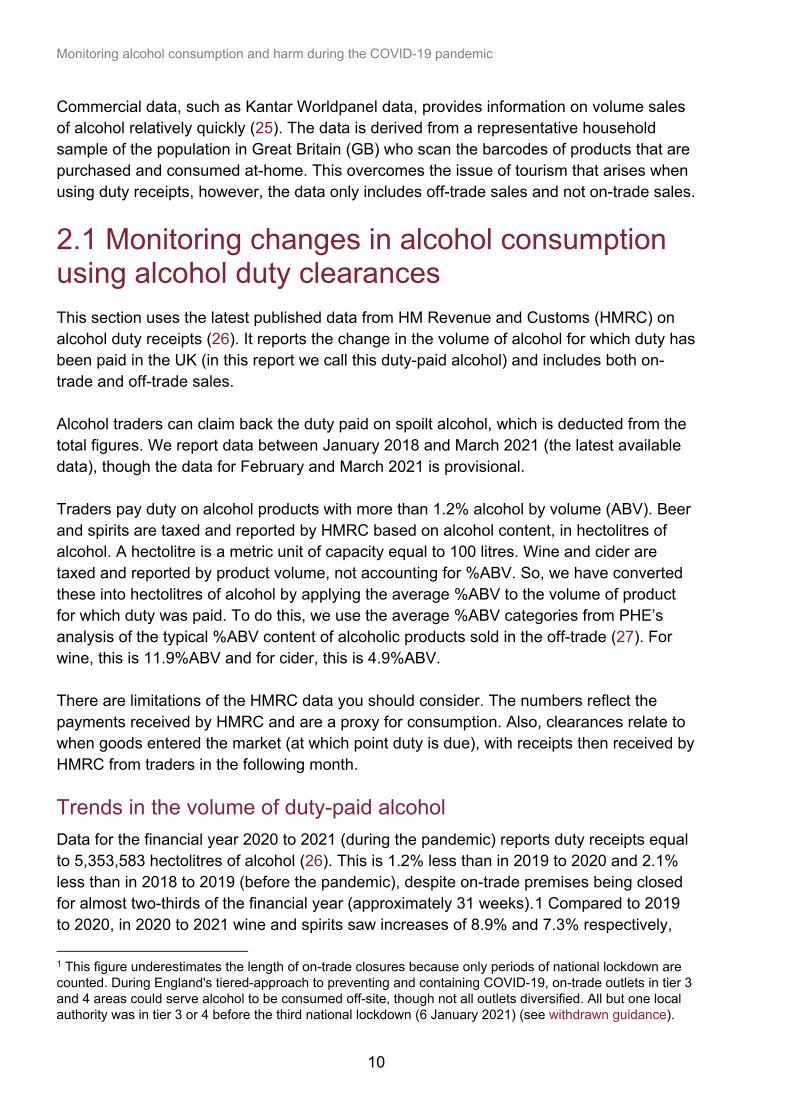
while cider and beer saw decreases of 16.7% and 14.0% respectively (figure 1). On revenue, in cash-terms, HMRC reports collecting £286 million more in alcohol duties between 2020 to 2021, compared to 2019 to 2020 (an increase of 2%). Corresponding differences between 2019 to 2020 and 2020 to 2021 in cash terms are as follows: • spirits saw and increase of £317 million (+8%) • wine increased by £299 million (+7%) • beer reduced by £307 million (-9%) • cider reduced by £23 million (-9%) Figure 1. Hectolitres of duty-paid alcohol, by product category, UK
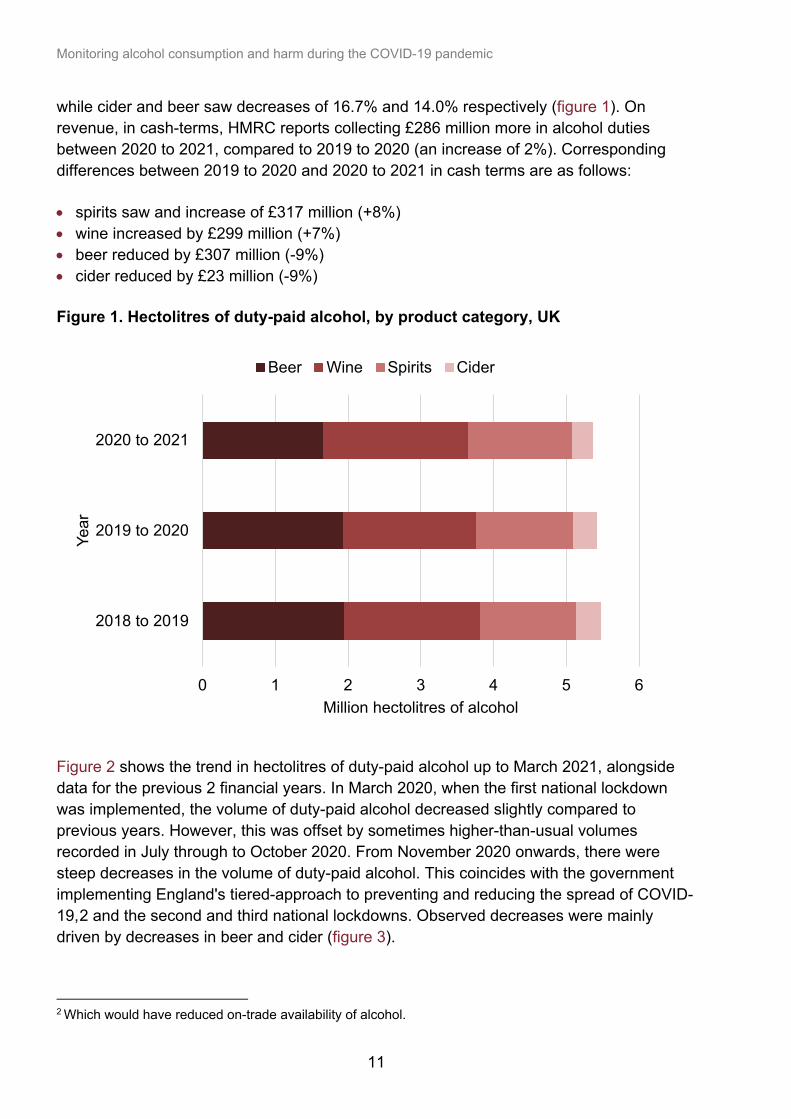
Figure 2 shows the trend in hectolitres of duty-paid alcohol up to March 2021, alongside data for the previous 2 financial years. In March 2020, when the first national lockdown was implemented, the volume of duty-paid alcohol decreased slightly compared to previous years. However, this was offset by sometimes higher-than-usual volumes recorded in July through to October 2020. From November 2020 onwards, there were steep decreases in the volume of duty-paid alcohol. This coincides with the government implementing England's tiered-approach to preventing and reducing the spread of COVID-19,2 and the second and third national lockdowns. Observed decreases were mainly driven by decreases in beer and cider (figure 3).
2 Which would have reduced on-trade availability of alcohol.
0 1 2 3 4 5 6
2018 to 2019
2019 to 2020
2020 to 2021
Million hectolitres of alcohol
Year
Beer Wine Spirits Cider
Monitoring alcohol consumption and harm during the COVID-19 pandemic
12
Figure 2. Trend in hectolitres of duty-paid alcohol, 2018 to 2019, 2019 to 2020 and 2020 to 2021, UK
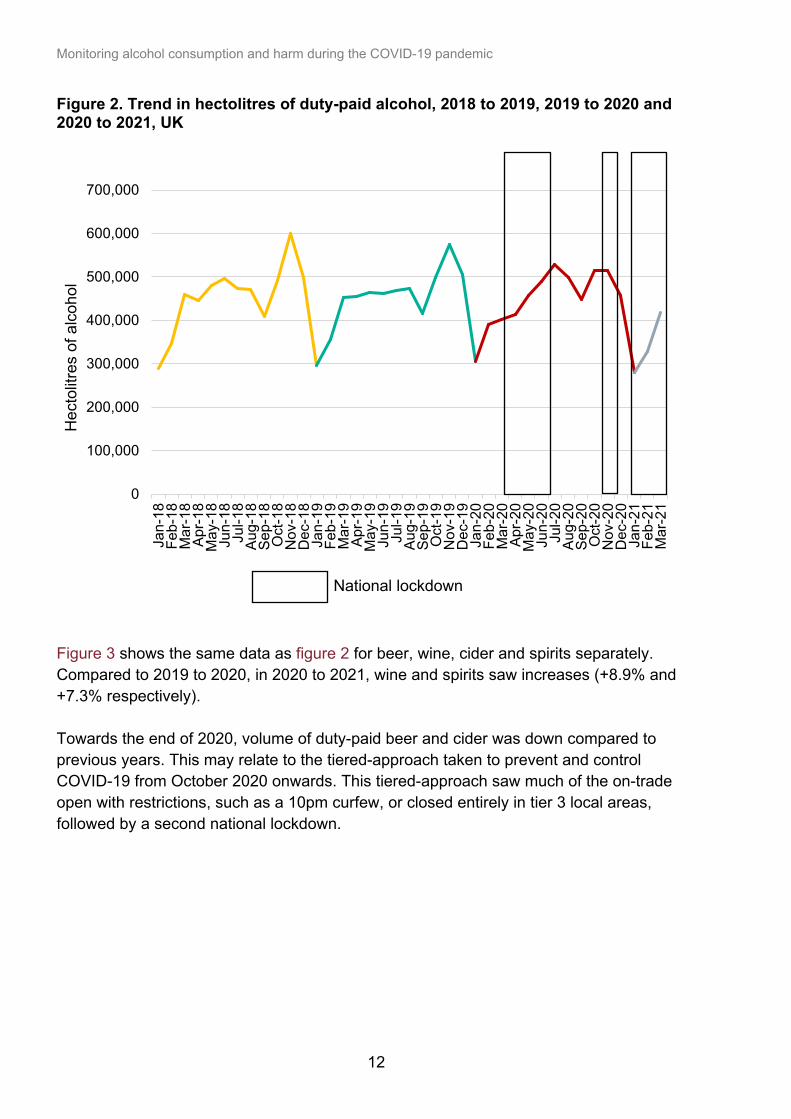
Figure 3 shows the same data as figure 2 for beer, wine, cider and spirits separately. Compared to 2019 to 2020, in 2020 to 2021, wine and spirits saw increases (+8.9% and +7.3% respectively). Towards the end of 2020, volume of duty-paid beer and cider was down compared to previous years. This may relate to the tiered-approach taken to prevent and control COVID-19 from October 2020 onwards. This tiered-approach saw much of the on-trade open with restrictions, such as a 10pm curfew, or closed entirely in tier 3 local areas, followed by a second national lockdown.
0
100,000
200,000
300,000
400,000
500,000
600,000
700,000
Jan-
18Fe
b-18
Mar
-18
Apr-1
8M
ay-1
8Ju
n-18
Jul-1
8Au
g-18
Sep-
18O
ct-1
8N
ov-1
8D
ec-1
8Ja
n-19
Feb-
19M
ar-1
9Ap
r-19
May
-19
Jun-
19Ju
l-19
Aug-
19Se
p-19
Oct
-19
Nov
-19
Dec
-19
Jan-
20Fe
b-20
Mar
-20
Apr-2
0M
ay-2
0Ju
n-20
Jul-2
0Au
g-20
Sep-
20O
ct-2
0N
ov-2
0D
ec-2
0Ja
n-21
Feb-
21M
ar-2
1
Hec
tolit
res
of a
lcoh
ol
National lockdown
Monitoring alcohol consumption and harm during the COVID-19 pandemic
13
Figure 3. Trends in the hectolitres of duty-paid alcohol for beer, cider, wine and spirits, 2018 to 2019, 2019 to 2020 and 2020 to 2021, UK
0
50,000
100,000
150,000
200,000
Jan-
18Fe
b-18
Mar
-18
Apr-1
8M
ay-1
8Ju
n-18
Jul-1
8Au
g-18
Sep-
18O
ct-1
8N
ov-1
8D
ec-1
8Ja
n-19
Feb-
19M
ar-1
9Ap
r-19
May
-19
Jun-
19Ju
l-19
Aug-
19Se
p-19
Oct
-19
Nov
-19
Dec
-19
Jan-
20Fe
b-20
Mar
-20
Apr-2
0M
ay-2
0Ju
n-20
Jul-2
0Au
g-20
Sep-
20O
ct-2
0N
ov-2
0D
ec-2
0Ja
n-21
Feb-
21M
ar-2
1
Hec
tolit
res
of a
lcoh
ol
BeerWine
Cider
Spirits
National lockdown
Monitoring alcohol consumption and harm during the COVID-19 pandemic
14
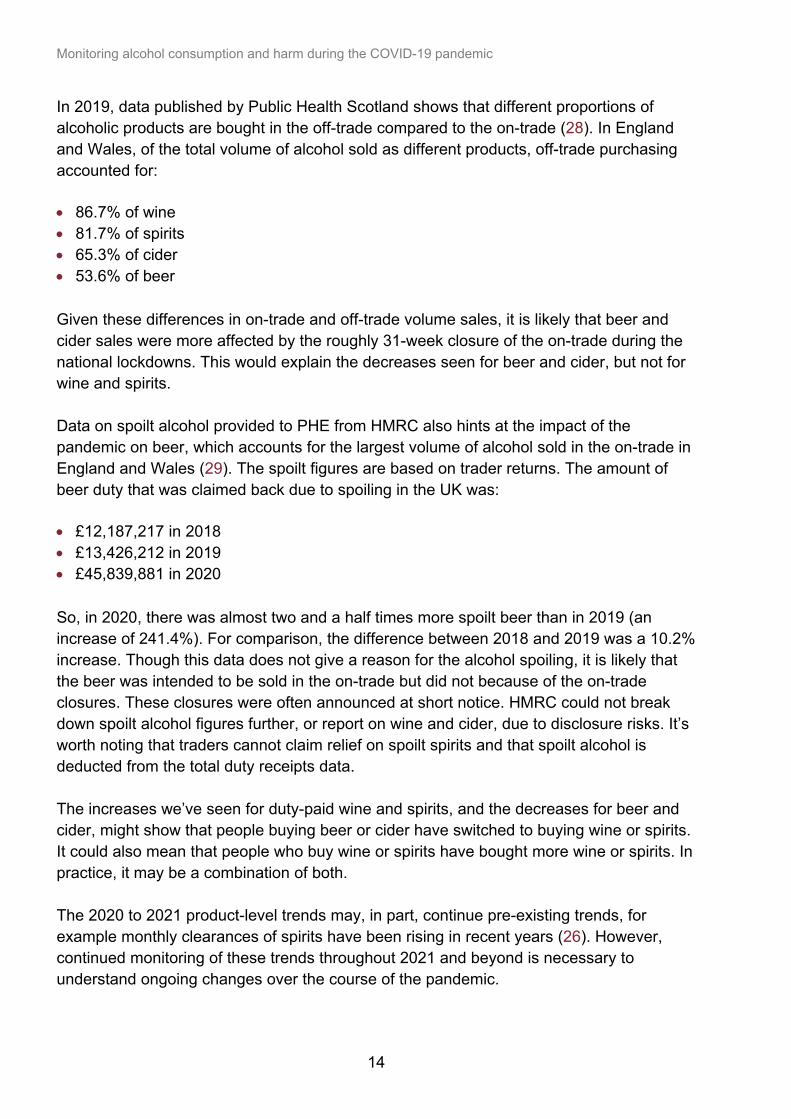
In 2019, data published by Public Health Scotland shows that different proportions of alcoholic products are bought in the off-trade compared to the on-trade (28). In England and Wales, of the total volume of alcohol sold as different products, off-trade purchasing accounted for: • 86.7% of wine • 81.7% of spirits • 65.3% of cider • 53.6% of beer Given these differences in on-trade and off-trade volume sales, it is likely that beer and cider sales were more affected by the roughly 31-week closure of the on-trade during the national lockdowns. This would explain the decreases seen for beer and cider, but not for wine and spirits. Data on spoilt alcohol provided to PHE from HMRC also hints at the impact of the pandemic on beer, which accounts for the largest volume of alcohol sold in the on-trade in England and Wales (29). The spoilt figures are based on trader returns. The amount of beer duty that was claimed back due to spoiling in the UK was: • £12,187,217 in 2018 • £13,426,212 in 2019 • £45,839,881 in 2020 So, in 2020, there was almost two and a half times more spoilt beer than in 2019 (an increase of 241.4%). For comparison, the difference between 2018 and 2019 was a 10.2% increase. Though this data does not give a reason for the alcohol spoiling, it is likely that the beer was intended to be sold in the on-trade but did not because of the on-trade closures. These closures were often announced at short notice. HMRC could not break down spoilt alcohol figures further, or report on wine and cider, due to disclosure risks. It’s worth noting that traders cannot claim relief on spoilt spirits and that spoilt alcohol is deducted from the total duty receipts data. The increases we’ve seen for duty-paid wine and spirits, and the decreases for beer and cider, might show that people buying beer or cider have switched to buying wine or spirits. It could also mean that people who buy wine or spirits have bought more wine or spirits. In practice, it may be a combination of both. The 2020 to 2021 product-level trends may, in part, continue pre-existing trends, for example monthly clearances of spirits have been rising in recent years (26). However, continued monitoring of these trends throughout 2021 and beyond is necessary to understand ongoing changes over the course of the pandemic.
Monitoring alcohol consumption and harm during the COVID-19 pandemic
15
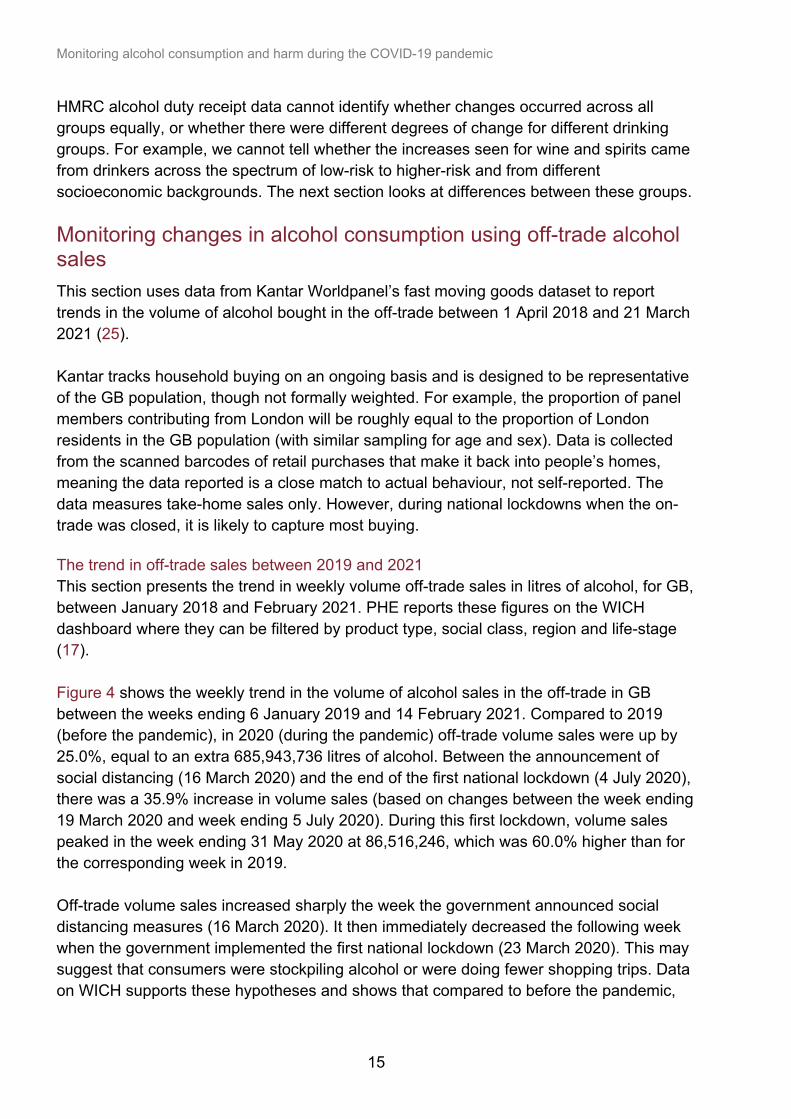
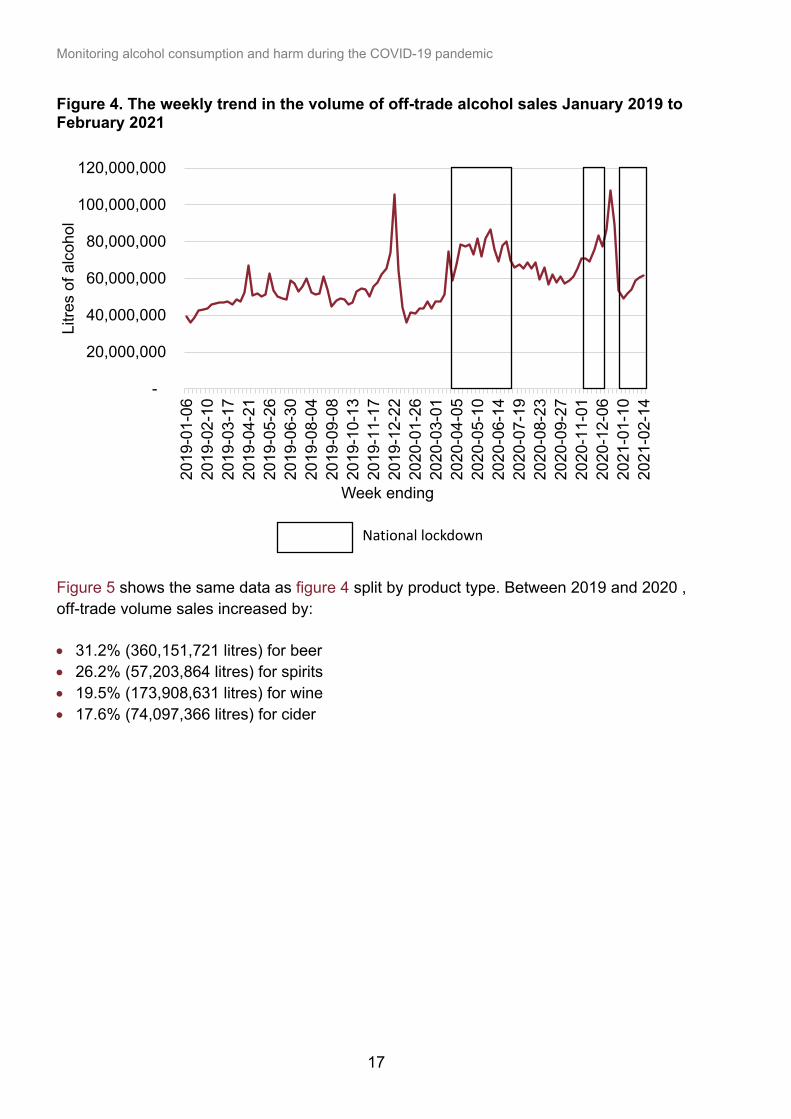
HMRC alcohol duty receipt data cannot identify whether changes occurred across all groups equally, or whether there were different degrees of change for different drinking groups. For example, we cannot tell whether the increases seen for wine and spirits came from drinkers across the spectrum of low-risk to higher-risk and from different socioeconomic backgrounds. The next section looks at differences between these groups. Monitoring changes in alcohol consumption using off-trade alcohol sales This section uses data from Kantar Worldpanel’s fast moving goods dataset to report trends in the volume of alcohol bought in the off-trade between 1 April 2018 and 21 March 2021 (25). Kantar tracks household buying on an ongoing basis and is designed to be representative of the GB population, though not formally weighted. For example, the proportion of panel members contributing from London will be roughly equal to the proportion of London residents in the GB population (with similar sampling for age and sex). Data is collected from the scanned barcodes of retail purchases that make it back into people’s homes, meaning the data reported is a close match to actual behaviour, not self-reported. The data measures take-home sales only. However, during national lockdowns when the on-trade was closed, it is likely to capture most buying. The trend in off-trade sales between 2019 and 2021 This section presents the trend in weekly volume off-trade sales in litres of alcohol, for GB, between January 2018 and February 2021. PHE reports these figures on the WICH dashboard where they can be filtered by product type, social class, region and life-stage (17). Figure 4 shows the weekly trend in the volume of alcohol sales in the off-trade in GB between the weeks ending 6 January 2019 and 14 February 2021. Compared to 2019 (before the pandemic), in 2020 (during the pandemic) off-trade volume sales were up by 25.0%, equal to an extra 685,943,736 litres of alcohol. Between the announcement of social distancing (16 March 2020) and the end of the first national lockdown (4 July 2020), there was a 35.9% increase in volume sales (based on changes between the week ending 19 March 2020 and week ending 5 July 2020). During this first lockdown, volume sales peaked in the week ending 31 May 2020 at 86,516,246, which was 60.0% higher than for the corresponding week in 2019. Off-trade volume sales increased sharply the week the government announced social distancing measures (16 March 2020). It then immediately decreased the following week when the government implemented the first national lockdown (23 March 2020). This may suggest that consumers were stockpiling alcohol or were doing fewer shopping trips. Data on WICH supports these hypotheses and shows that compared to before the pandemic,
Monitoring alcohol consumption and harm during the COVID-19 pandemic
16
consumers bought greater volumes of groceries per shop, and made fewer shop visits around the time of the lockdown (17).3 After the first national lockdown ended (4 July 2020), off-trade alcohol sales remained higher than in 2019 throughout most of the year. During November 2020 (when the second national lockdown was implemented), off-trade sales increased by 37.6%, compared to November 2019. This increase was equal to an extra 81,783,504 litres of alcohol. Data for January 2020 show decreases in off-trade volume sales, which is in line with seasonal trends from previous years. However, we saw the 2021 decrease to a lesser extent, possibly because the government implemented a third lockdown on 6 January 2021 and on-trade premises were closed. Data for the first weeks of January in 2019 to 2021 show total sales of: • 39,552,850 litres in 2019 • 44,081,509 litres in 2020 • 53,641,382 litres in 2021 So, between the first week in January 2020 and the first week in January 2021, off-trade volume sales are up by 21.7%. The latest data for February shows steeper increases than seen in 2019.
3 This finding is for all grocery shopping which would include purchases of alcohol products.
Monitoring alcohol consumption and harm during the COVID-19 pandemic
17
Figure 4. The weekly trend in the volume of off-trade alcohol sales January 2019 to February 2021
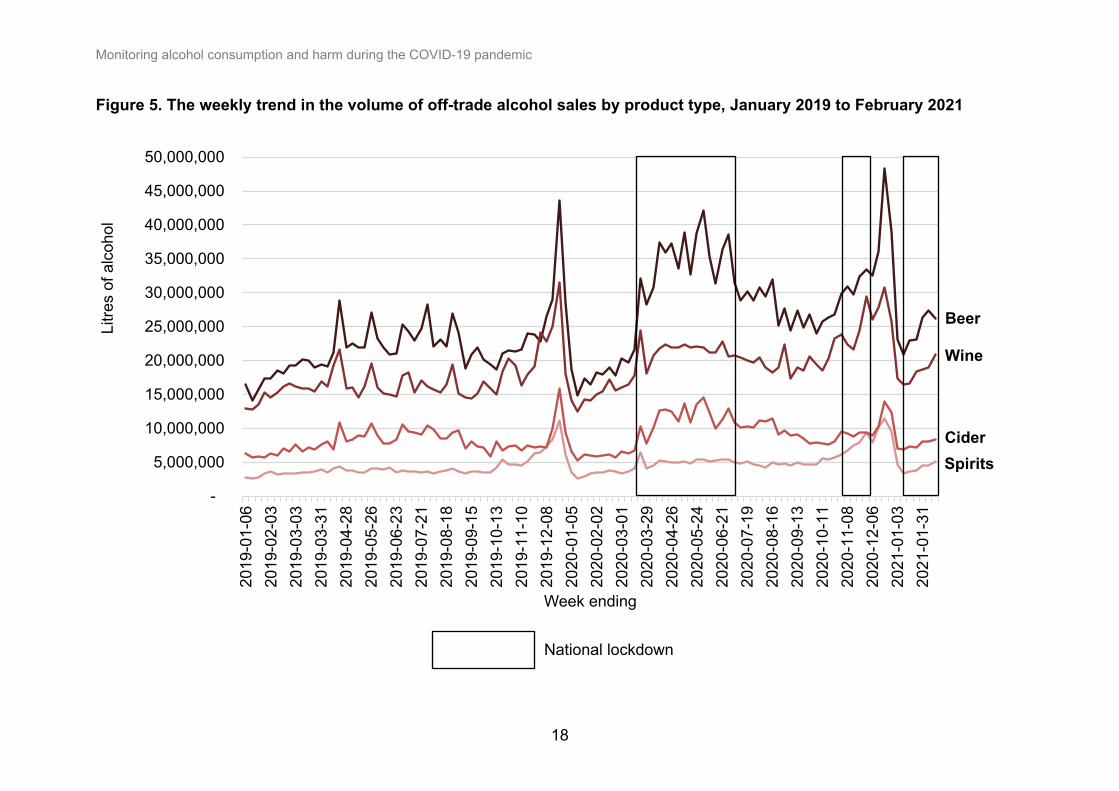
Figure 5 shows the same data as figure 4 split by product type. Between 2019 and 2020 , off-trade volume sales increased by: • 31.2% (360,151,721 litres) for beer • 26.2% (57,203,864 litres) for spirits • 19.5% (173,908,631 litres) for wine • 17.6% (74,097,366 litres) for cider
-
20,000,000
40,000,000
60,000,000
80,000,000
100,000,000
120,000,00020
19-0
1-06
2019
-02-
1020
19-0
3-17
2019
-04-
2120
19-0
5-26
2019
-06-
3020
19-0
8-04
2019
-09-
0820
19-1
0-13
2019
-11-
1720
19-1
2-22
2020
-01-
2620
20-0
3-01
2020
-04-
0520
20-0
5-10
2020
-06-
1420
20-0
7-19
2020
-08-
2320
20-0
9-27
2020
-11-
0120
20-1
2-06
2021
-01-
1020
21-0
2-14
Litre
s of
alc
ohol
Week ending
National lockdown
Monitoring alcohol consumption and harm during the COVID-19 pandemic
18
Figure 5. The weekly trend in the volume of off-trade alcohol sales by product type, January 2019 to February 2021
-
5,000,000
10,000,000
15,000,000
20,000,000
25,000,000
30,000,000
35,000,000
40,000,000
45,000,000
50,000,000
2019
-01-
0620
19-0
2-03
2019
-03-
0320
19-0
3-31
2019
-04-
2820
19-0
5-26
2019
-06-
2320
19-0
7-21
2019
-08-
1820
19-0
9-15
2019
-10-
1320
19-1
1-10
2019
-12-
0820
20-0
1-05
2020
-02-
0220
20-0
3-01
2020
-03-
2920
20-0
4-26
2020
-05-
2420
20-0
6-21
2020
-07-
1920
20-0
8-16
2020
-09-
1320
20-1
0-11
2020
-11-
0820
20-1
2-06
2021
-01-
0320
21-0
1-31
Litre
s of
alc
ohol
Week ending
National lockdown
Beer
Wine
Cider Spirits
Monitoring alcohol consumption and harm during the COVID-19 pandemic
19
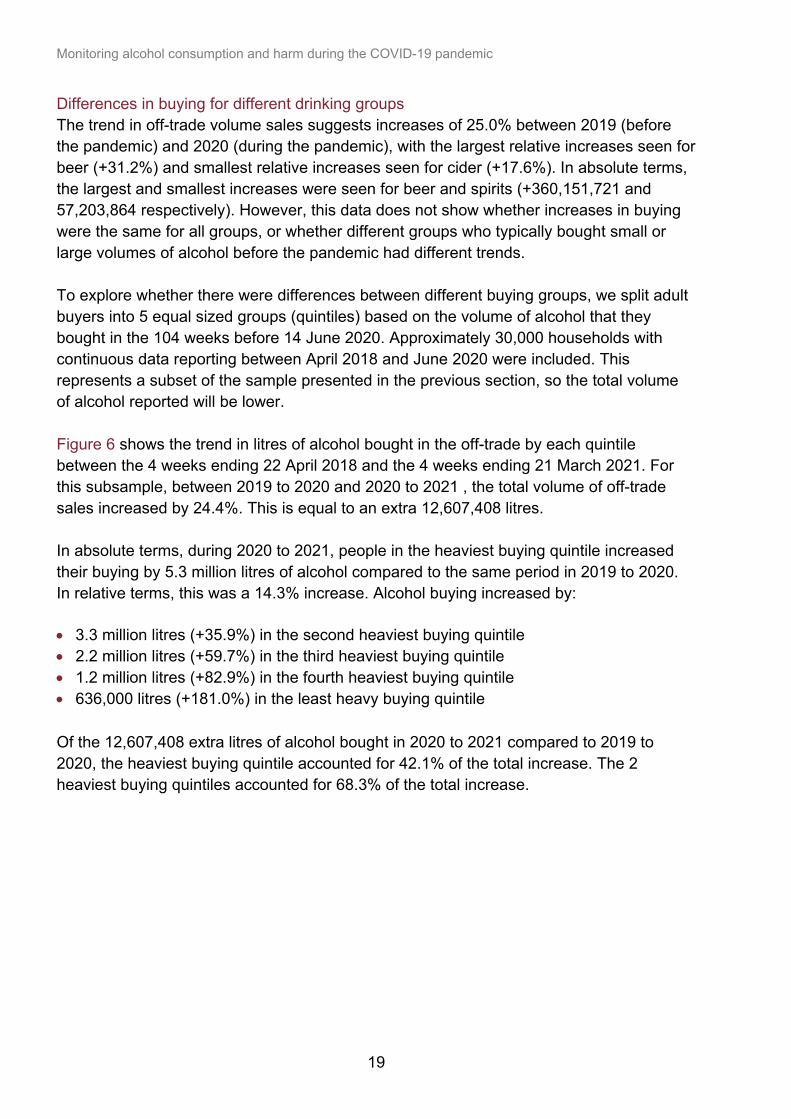
Differences in buying for different drinking groups The trend in off-trade volume sales suggests increases of 25.0% between 2019 (before the pandemic) and 2020 (during the pandemic), with the largest relative increases seen for beer (+31.2%) and smallest relative increases seen for cider (+17.6%). In absolute terms, the largest and smallest increases were seen for beer and spirits (+360,151,721 and 57,203,864 respectively). However, this data does not show whether increases in buying were the same for all groups, or whether different groups who typically bought small or large volumes of alcohol before the pandemic had different trends. To explore whether there were differences between different buying groups, we split adult buyers into 5 equal sized groups (quintiles) based on the volume of alcohol that they bought in the 104 weeks before 14 June 2020. Approximately 30,000 households with continuous data reporting between April 2018 and June 2020 were included. This represents a subset of the sample presented in the previous section, so the total volume of alcohol reported will be lower. Figure 6 shows the trend in litres of alcohol bought in the off-trade by each quintile between the 4 weeks ending 22 April 2018 and the 4 weeks ending 21 March 2021. For this subsample, between 2019 to 2020 and 2020 to 2021 , the total volume of off-trade sales increased by 24.4%. This is equal to an extra 12,607,408 litres. In absolute terms, during 2020 to 2021, people in the heaviest buying quintile increased their buying by 5.3 million litres of alcohol compared to the same period in 2019 to 2020. In relative terms, this was a 14.3% increase. Alcohol buying increased by: • 3.3 million litres (+35.9%) in the second heaviest buying quintile • 2.2 million litres (+59.7%) in the third heaviest buying quintile • 1.2 million litres (+82.9%) in the fourth heaviest buying quintile • 636,000 litres (+181.0%) in the least heavy buying quintile Of the 12,607,408 extra litres of alcohol bought in 2020 to 2021 compared to 2019 to 2020, the heaviest buying quintile accounted for 42.1% of the total increase. The 2 heaviest buying quintiles accounted for 68.3% of the total increase.
Monitoring alcohol consumption and harm during the COVID-19 pandemic
20
Figure 6. The trend in litres of off-trade alcohol bought by buying quintile between the past 4 weeks ending 1 April 2018 and 1 March 2021
-
500,000
1,000,000
1,500,000
2,000,000
2,500,000
3,000,000
3,500,000
4,000,000
4,500,00022
-Apr
-18
20-M
ay-1
817
-Jun
-19
15-J
ul-1
812
-Aug
-18
09-S
ep-1
807
-Oct
-18
04-N
ov-1
802
-Dec
-18
30-D
ec-1
827
-Jan
-19
24-F
eb-1
924
-Mar
-19
21-A
pr-1
919
-May
-19
16-J
un-1
914
-Jul
-19
11-A
ug-1
908
-Sep
t-19
06-O
ct-1
903
-Nov
-19
01-D
ec-1
929
-Dec
-19
26-J
an-2
023
-Feb
-20
22-M
ar-2
019
-Apr
-20
17-M
ay-2
014
-Jun
-20
12-J
ul-2
009
-Aug
-20
06-S
ep-2
004
-Oct
-20
01-N
ov-2
029
-Nov
-20
27-D
ec-2
024
-Jan
-21
21-F
eb-2
121
-Mar
-21
Volu
me
(litre
s)
Past 4 weeks ending
80-100% (heaviest buying quintile) 60-80% 40-60% 20-40% 0-20% (lowest buying quintile)
National lockdown
Monitoring alcohol consumption and harm during the COVID-19 pandemic
21
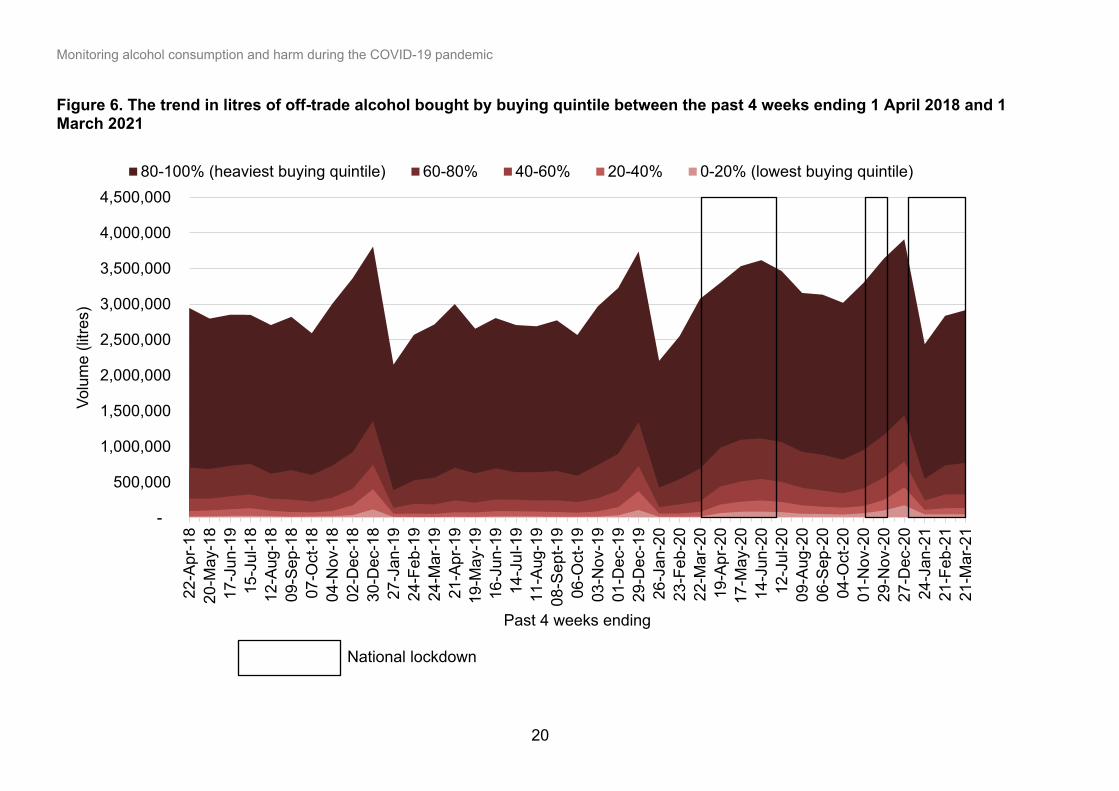
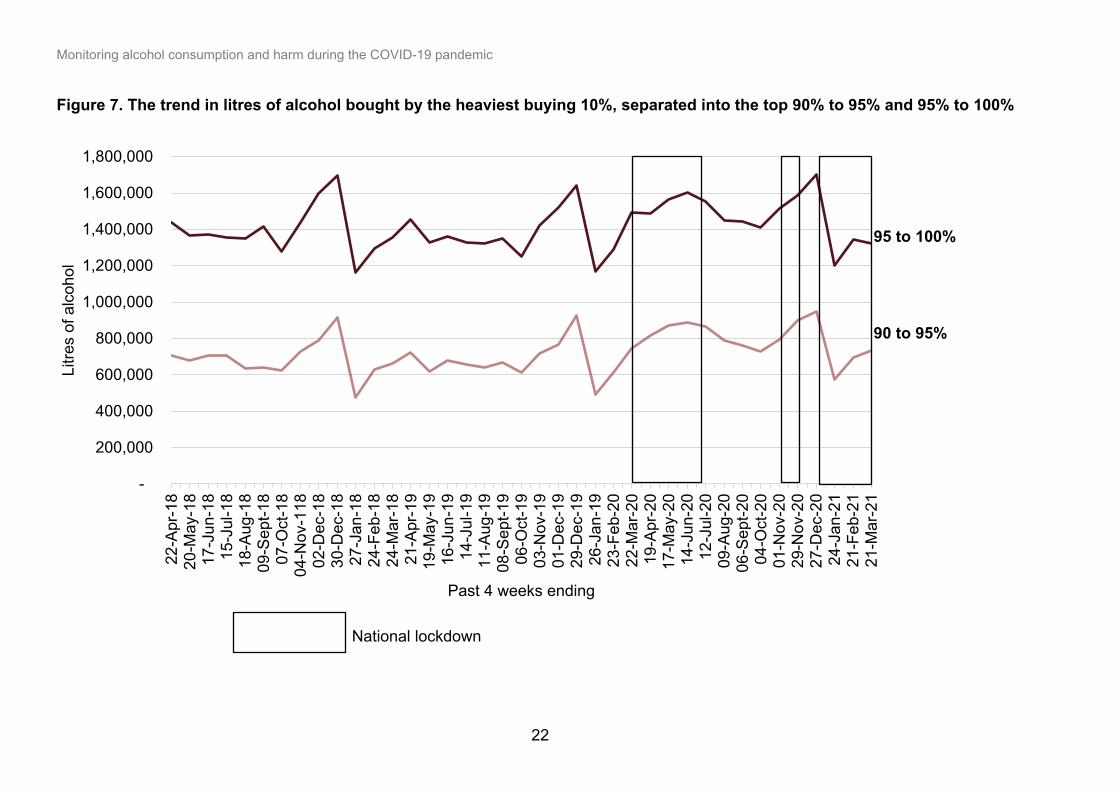
Figure 7 shows the trend in litres of alcohol bought in the off-trade for the heaviest-buying 10%, further separated into the top 90% to 95%, and 95% to 100% heaviest buyers. Compared to 2019 to 2020, the 90% to 95% heaviest buying group saw larger absolute and relative increases during 2020 to 2021 compared to the heaviest 5% of buyers. This was an increase of 17.1% (+1,512,383 litres) and 7.0% (+1,255,649 litres) respectively.
Monitoring alcohol consumption and harm during the COVID-19 pandemic
22
Figure 7. The trend in litres of alcohol bought by the heaviest buying 10%, separated into the top 90% to 95% and 95% to 100%
-
200,000
400,000
600,000
800,000
1,000,000
1,200,000
1,400,000
1,600,000
1,800,00022
-Apr
-18
20-M
ay-1
817
-Jun
-18
15-J
ul-1
818
-Aug
-18
09-S
ept-1
807
-Oct
-18
04-N
ov-1
1802
-Dec
-18
30-D
ec-1
827
-Jan
-18
24-F
eb-1
824
-Mar
-18
21-A
pr-1
919
-May
-19
16-J
un-1
914
-Jul
-19
11-A
ug-1
908
-Sep
t-19
06-O
ct-1
903
-Nov
-19
01-D
ec-1
929
-Dec
-19
26-J
an-1
923
-Feb
-20
22-M
ar-2
019
-Apr
-20
17-M
ay-2
014
-Jun
-20
12-J
ul-2
009
-Aug
-20
06-S
ept-2
004
-Oct
-20
01-N
ov-2
029
-Nov
-20
27-D
ec-2
024
-Jan
-21
21-F
eb-2
121
-Mar
-21
Litre
s of
alc
ohol
Past 4 weeks ending
National lockdown
95 to 100%
90 to 95%
Monitoring alcohol consumption and harm during the COVID-19 pandemic
23
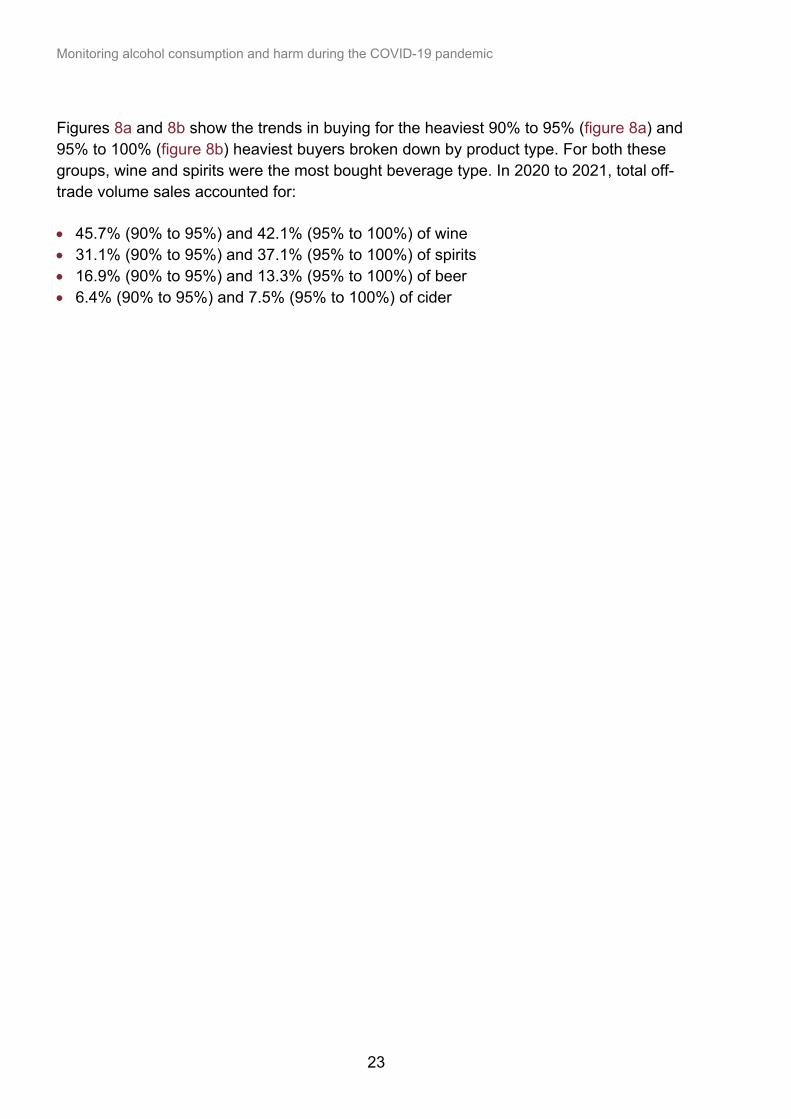
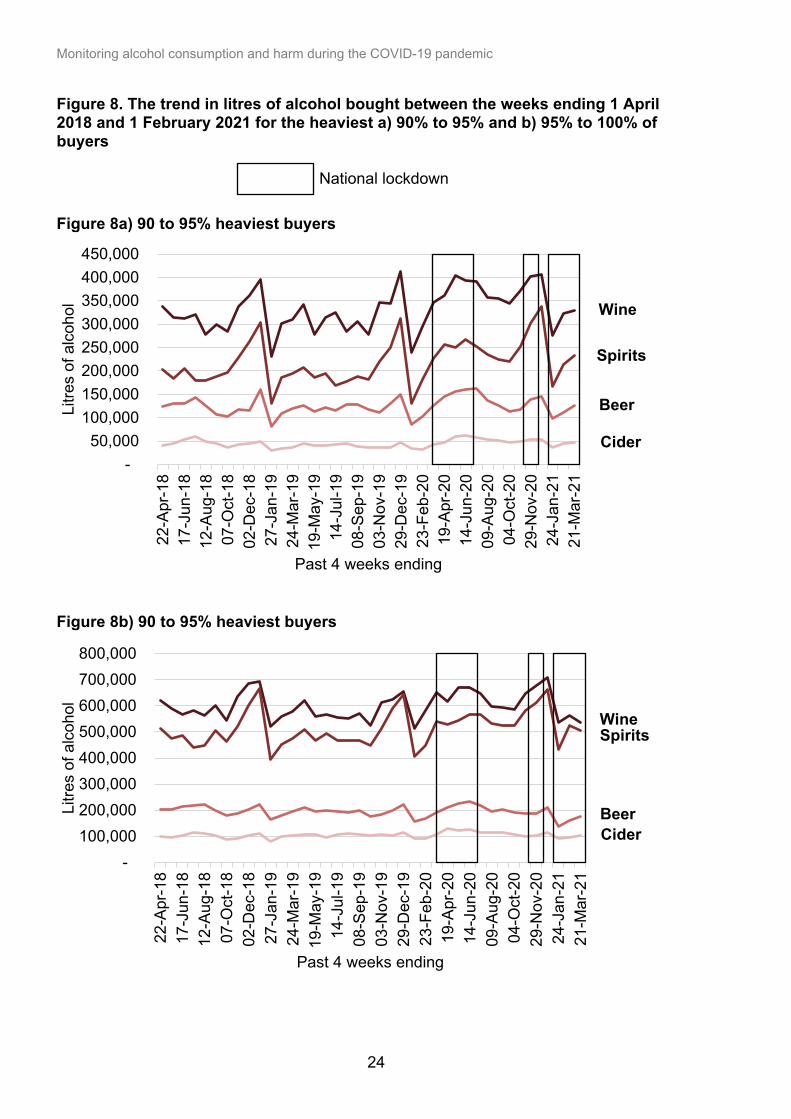
Figures 8a and 8b show the trends in buying for the heaviest 90% to 95% (figure 8a) and 95% to 100% (figure 8b) heaviest buyers broken down by product type. For both these groups, wine and spirits were the most bought beverage type. In 2020 to 2021, total off-trade volume sales accounted for: • 45.7% (90% to 95%) and 42.1% (95% to 100%) of wine • 31.1% (90% to 95%) and 37.1% (95% to 100%) of spirits • 16.9% (90% to 95%) and 13.3% (95% to 100%) of beer • 6.4% (90% to 95%) and 7.5% (95% to 100%) of cider
Monitoring alcohol consumption and harm during the COVID-19 pandemic
24
Figure 8. The trend in litres of alcohol bought between the weeks ending 1 April 2018 and 1 February 2021 for the heaviest a) 90% to 95% and b) 95% to 100% of buyers Figure 8a) 90 to 95% heaviest buyers
Figure 8b) 90 to 95% heaviest buyers
- 50,000
100,000 150,000 200,000 250,000 300,000 350,000 400,000 450,000
22-A
pr-1
817
-Jun
-18
12-A
ug-1
807
-Oct
-18
02-D
ec-1
827
-Jan
-19
24-M
ar-1
919
-May
-19
14-J
ul-1
908
-Sep
-19
03-N
ov-1
929
-Dec
-19
23-F
eb-2
019
-Apr
-20
14-J
un-2
009
-Aug
-20
04-O
ct-2
029
-Nov
-20
24-J
an-2
121
-Mar
-21
Litre
s of
alc
ohol
Past 4 weeks ending
- 100,000 200,000 300,000 400,000 500,000 600,000 700,000 800,000
22-A
pr-1
817
-Jun
-18
12-A
ug-1
807
-Oct
-18
02-D
ec-1
827
-Jan
-19
24-M
ar-1
919
-May
-19
14-J
ul-1
908
-Sep
-19
03-N
ov-1
929
-Dec
-19
23-F
eb-2
019
-Apr
-20
14-J
un-2
009
-Aug
-20
04-O
ct-2
029
-Nov
-20
24-J
an-2
121
-Mar
-21
Litre
s of
alc
ohol
Past 4 weeks ending
Wine
Spirits
Beer
Cider
Wine Spirits
Beer Cider
National lockdown
Monitoring alcohol consumption and harm during the COVID-19 pandemic
25
Consumer buying behaviour Data for 2020 to 2021 reveals some differences in consumer buying between the quintiles selecting products according to their strength (%ABV). In this section, we compare the proportion of different strength alcoholic products bought by the lightest buying quintile (0% to 20%) and the heaviest buying quintile (80% to 100%) only. For total volume sales of beer, there was not much difference between lightest and heaviest buyers, with 50.0% and 51.3% of volume sales bought as beer products with a strength between greater than 4.3%ABV and less than 7.5%ABV respectively. Corresponding figures for beer and lager buying for products with strengths greater than 7.5%ABV were 0.5% and 0.4% respectively. For spirits, there was a definite tendency for the heaviest buyers to select stronger products compared to the lightest buyers. We saw that 90.4% and 58.9% of volume sales bought as spirits were for those with a strength of greater than 35%ABV respectively. For wine, the lightest buyers purchased proportionally greater volumes of lower strength wines (31.0% of alcohol volume bought as wine was for products with less than or equal to 11%ABV). For heaviest buyers, just 13.0% of alcohol volume bought as wine was for products with less than or equal to 11%ABV. Finally, the heaviest buyers bought a greater proportion of the alcohol as cider with a strength of less than 7.5%ABV, compared to the lightest buyers (12.2% and 0.6% respectively).
2.2 Comparing HMRC duty receipts and Kantar off-trade volume sales data This section uses data measuring volume sales taken from 2 sources: 1. Kantar Worldpanel’s fast moving goods data (off-trade sales in litres of alcohol). 2. The volume of duty-paid alcohol taken from HMRC (on-trade and off-trade duty
paid-alcohol in hectolitres of alcohol). Kantar's data covers GB and duty data covers UK. Both datasets show similar trends across the period. The main difference between the 2 datasets is that HMRC includes duty-paid on-trade and off-trade alcohol, while Kantar includes off-trade sales only. Given the closure of the on-trade during national lockdowns, comparing these datasets may give insight into changes in sales trends or patterns that happen alongside on-trade premise closures. In this section we use data from calendar years to compare against HMRC, because we do not yet have data for the full financial year 2020 to 2021 for Kantar sales.
Monitoring alcohol consumption and harm during the COVID-19 pandemic
26
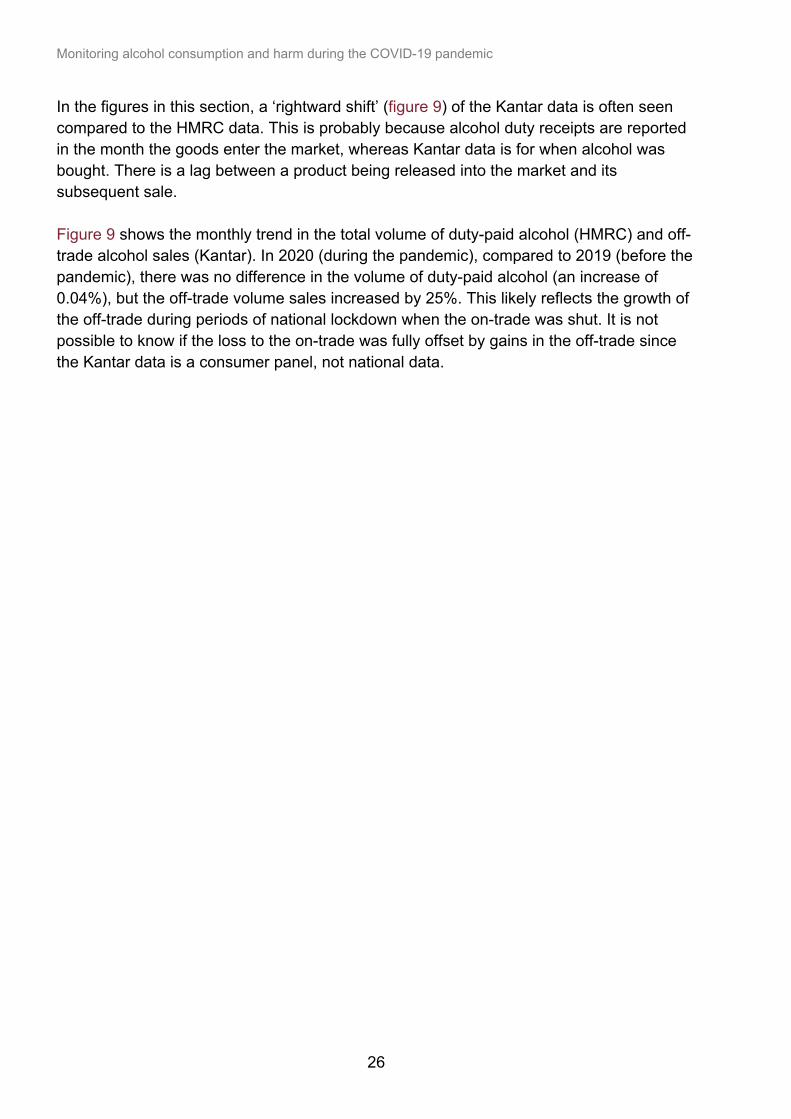
In the figures in this section, a ‘rightward shift’ (figure 9) of the Kantar data is often seen compared to the HMRC data. This is probably because alcohol duty receipts are reported in the month the goods enter the market, whereas Kantar data is for when alcohol was bought. There is a lag between a product being released into the market and its subsequent sale. Figure 9 shows the monthly trend in the total volume of duty-paid alcohol (HMRC) and off-trade alcohol sales (Kantar). In 2020 (during the pandemic), compared to 2019 (before the pandemic), there was no difference in the volume of duty-paid alcohol (an increase of 0.04%), but the off-trade volume sales increased by 25%. This likely reflects the growth of the off-trade during periods of national lockdown when the on-trade was shut. It is not possible to know if the loss to the on-trade was fully offset by gains in the off-trade since the Kantar data is a consumer panel, not national data.
Monitoring alcohol consumption and harm during the COVID-19 pandemic
27
Figure 9. Comparing the monthly trends in the total volume of duty-paid alcohol (HMRC, UK) and off-trade alcohol sales (Kantar, GB)
0
50,000,000
100,000,000
150,000,000
200,000,000
250,000,000
300,000,000
350,000,000
400,000,000
450,000,000
0
100,000
200,000
300,000
400,000
500,000
600,000
700,000
Jan-
19Fe
b-19
Mar
-19
Apr-1
9M
ay-1
9Ju
n-19
Jul-1
9Au
g-19
Sep-
19O
ct-1
9N
ov-1
9D
ec-1
9Ja
n-20
Feb-
20M
ar-2
0Ap
r-20
May
-20
Jun-
20Ju
l-20
Aug-
20Se
p-20
Oct
-20
Nov
-20
Dec
-20
Jan-
21
Litre
s of
alc
ohol
Hec
tolit
res
of a
lcoh
ol
HMRC total alcohol Kantar total alcohol
National lockdown
Monitoring alcohol consumption and harm during the COVID-19 pandemic
28
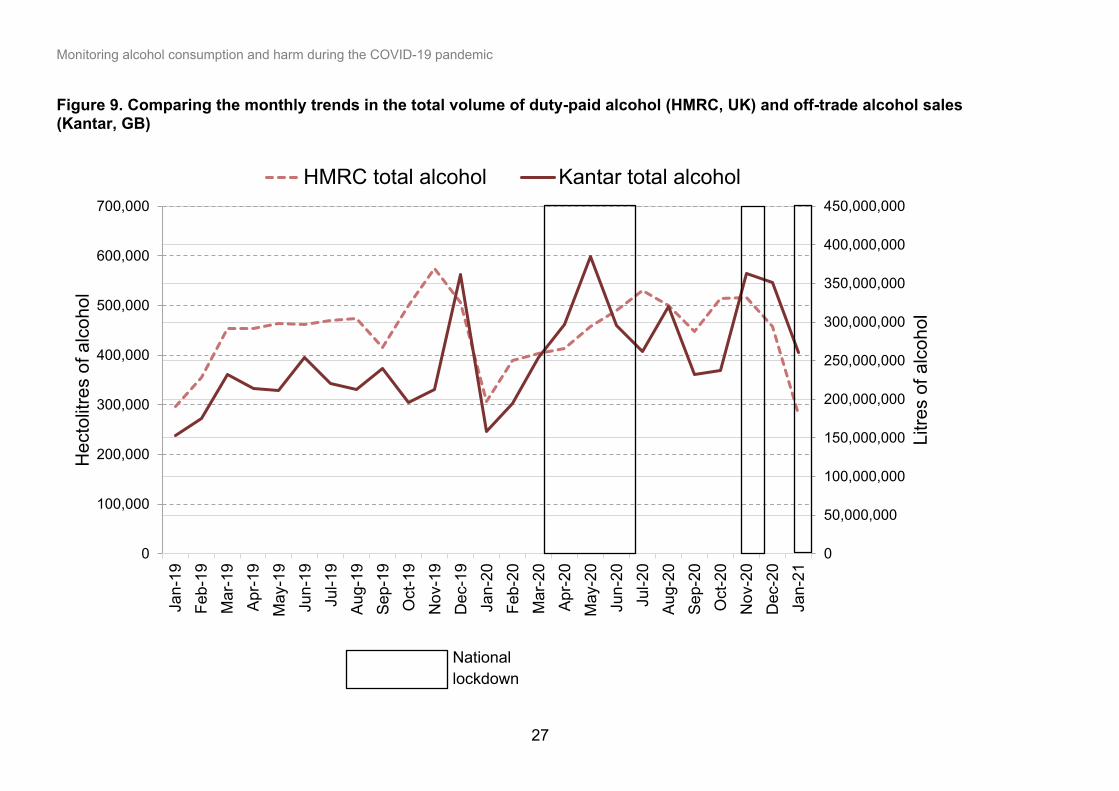
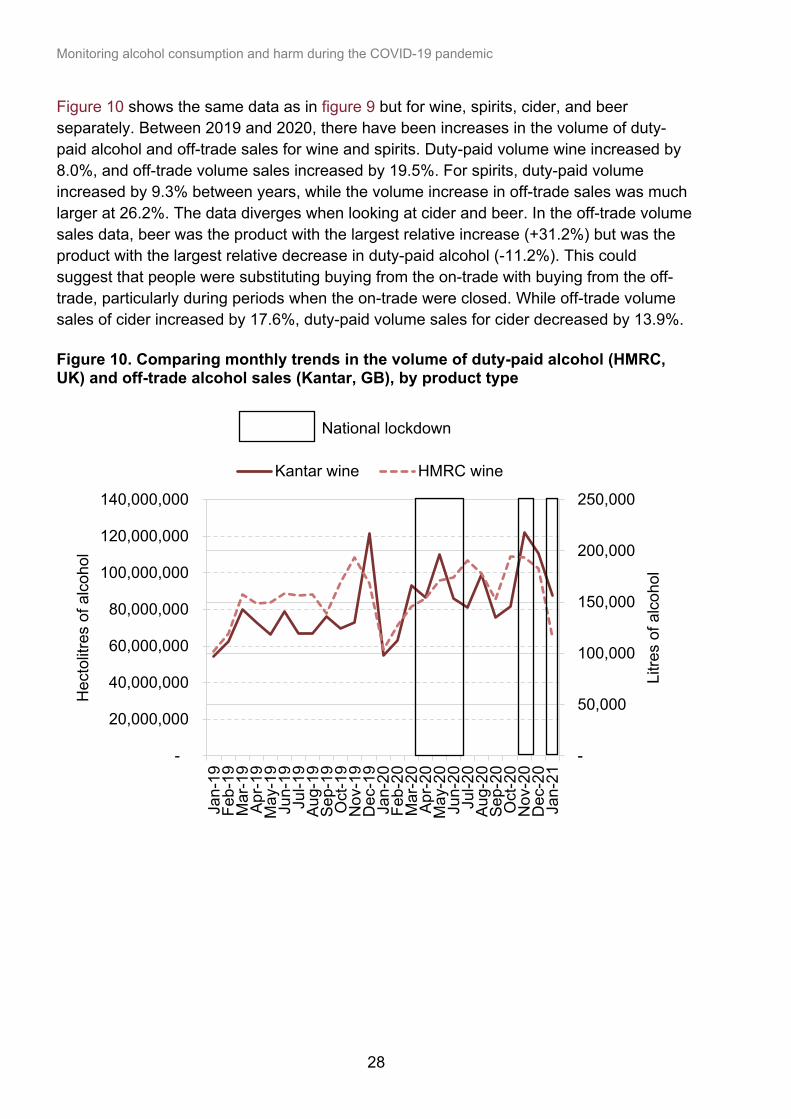
Figure 10 shows the same data as in figure 9 but for wine, spirits, cider, and beer separately. Between 2019 and 2020, there have been increases in the volume of duty-paid alcohol and off-trade sales for wine and spirits. Duty-paid volume wine increased by 8.0%, and off-trade volume sales increased by 19.5%. For spirits, duty-paid volume increased by 9.3% between years, while the volume increase in off-trade sales was much larger at 26.2%. The data diverges when looking at cider and beer. In the off-trade volume sales data, beer was the product with the largest relative increase (+31.2%) but was the product with the largest relative decrease in duty-paid alcohol (-11.2%). This could suggest that people were substituting buying from the on-trade with buying from the off-trade, particularly during periods when the on-trade were closed. While off-trade volume sales of cider increased by 17.6%, duty-paid volume sales for cider decreased by 13.9%. Figure 10. Comparing monthly trends in the volume of duty-paid alcohol (HMRC, UK) and off-trade alcohol sales (Kantar, GB), by product type
-
50,000
100,000
150,000
200,000
250,000
-
20,000,000
40,000,000
60,000,000
80,000,000
100,000,000
120,000,000
140,000,000
Jan-
19Fe
b-19
Mar
-19
Apr-1
9M
ay-1
9Ju
n-19
Jul-1
9Au
g-19
Sep-
19O
ct-1
9N
ov-1
9D
ec-1
9Ja
n-20
Feb-
20M
ar-2
0Ap
r-20
May
-20
Jun-
20Ju
l-20
Aug-
20Se
p-20
Oct
-20
Nov
-20
Dec
-20
Jan-
21
Litre
s of
alc
ohol
Hec
tolit
res
of a
lcoh
ol
Kantar wine HMRC wine
National lockdown
Monitoring alcohol consumption and harm during the COVID-19 pandemic
29
-
20,000
40,000
60,000
80,000
100,000
120,000
140,000
160,000
180,000
-
5,000,000
10,000,000
15,000,000
20,000,000
25,000,000
30,000,000
35,000,000
40,000,000
45,000,000
Jan-
19Fe
b-19
Mar
-19
Apr-1
9M
ay-1
9Ju
n-19
Jul-1
9Au
g-19
Sep-
19O
ct-1
9N
ov-1
9D
ec-1
9Ja
n-20
Feb-
20M
ar-2
0Ap
r-20
May
-20
Jun-
20Ju
l-20
Aug-
20Se
p-20
Oct
-20
Nov
-20
Dec
-20
Jan-
21
Litre
s of
alc
ohol
Hec
tolit
res
of a
lcoh
ol
Kantar spirits HMRC spirits
0
5,000
10,000
15,000
20,000
25,000
30,000
35,000
40,000
0
10,000,000
20,000,000
30,000,000
40,000,000
50,000,000
60,000,000
70,000,000
Jan-
19Fe
b-19
Mar
-19
Apr-1
9M
ay-1
9Ju
n-19
Jul-1
9Au
g-19
Sep-
19O
ct-1
9N
ov-1
9D
ec-1
9Ja
n-20
Feb-
20M
ar-2
0Ap
r-20
May
-20
Jun-
20Ju
l-20
Aug-
20Se
p-20
Oct
-20
Nov
-20
Dec
-20
Jan-
21
Litre
s of
alc
ohol
Hec
tolit
res
of a
lcoh
ol
Kantar cider HMRC cider
Monitoring alcohol consumption and harm during the COVID-19 pandemic
30
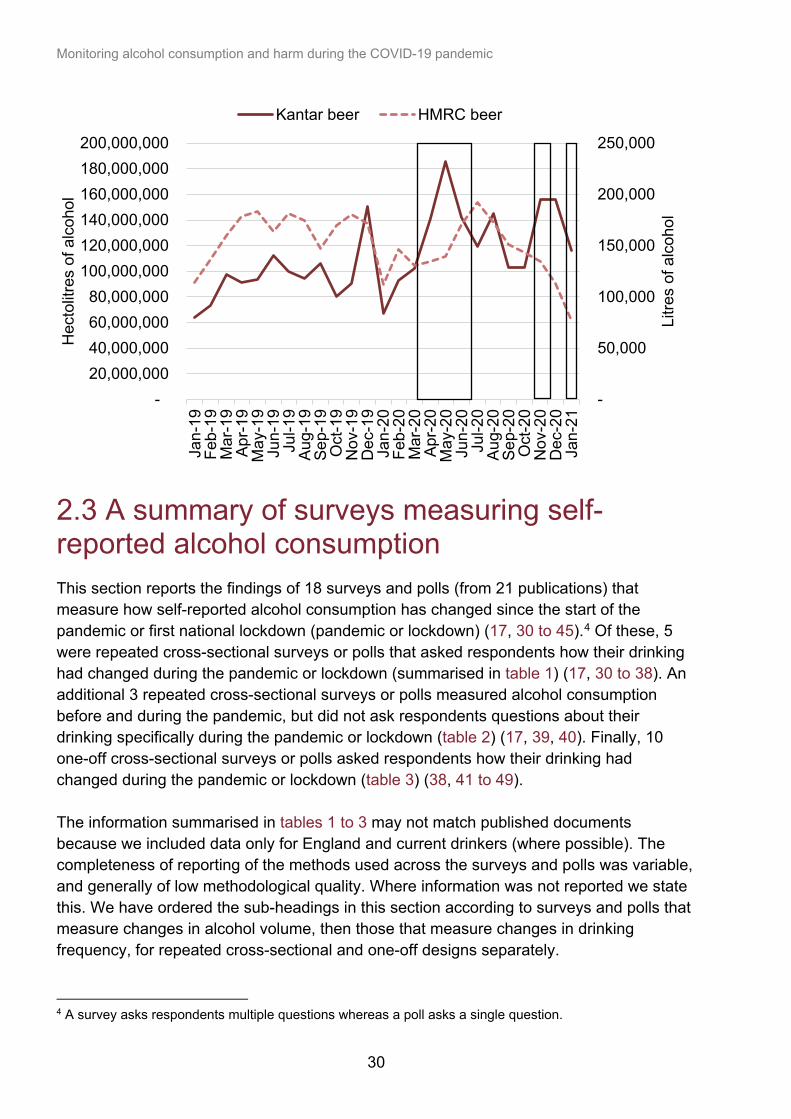
2.3 A summary of surveys measuring self-reported alcohol consumption This section reports the findings of 18 surveys and polls (from 21 publications) that measure how self-reported alcohol consumption has changed since the start of the pandemic or first national lockdown (pandemic or lockdown) (17, 30 to 45).4 Of these, 5 were repeated cross-sectional surveys or polls that asked respondents how their drinking had changed during the pandemic or lockdown (summarised in table 1) (17, 30 to 38). An additional 3 repeated cross-sectional surveys or polls measured alcohol consumption before and during the pandemic, but did not ask respondents questions about their drinking specifically during the pandemic or lockdown (table 2) (17, 39, 40). Finally, 10 one-off cross-sectional surveys or polls asked respondents how their drinking had changed during the pandemic or lockdown (table 3) (38, 41 to 49). The information summarised in tables 1 to 3 may not match published documents because we included data only for England and current drinkers (where possible). The completeness of reporting of the methods used across the surveys and polls was variable, and generally of low methodological quality. Where information was not reported we state this. We have ordered the sub-headings in this section according to surveys and polls that measure changes in alcohol volume, then those that measure changes in drinking frequency, for repeated cross-sectional and one-off designs separately.
4 A survey asks respondents multiple questions whereas a poll asks a single question.
-
50,000
100,000
150,000
200,000
250,000
- 20,000,000 40,000,000 60,000,000 80,000,000
100,000,000 120,000,000 140,000,000 160,000,000 180,000,000 200,000,000
Jan-
19Fe
b-19
Mar
-19
Apr-1
9M
ay-1
9Ju
n-19
Jul-1
9Au
g-19
Sep-
19O
ct-1
9N
ov-1
9D
ec-1
9Ja
n-20
Feb-
20M
ar-2
0Ap
r-20
May
-20
Jun-
20Ju
l-20
Aug-
20Se
p-20
Oct
-20
Nov
-20
Dec
-20
Jan-
21
Litre
s of
alc
ohol
Hec
tolit
res
of a
lcoh
ol
Kantar beer HMRC beer
Monitoring alcohol consumption and harm during the COVID-19 pandemic
31
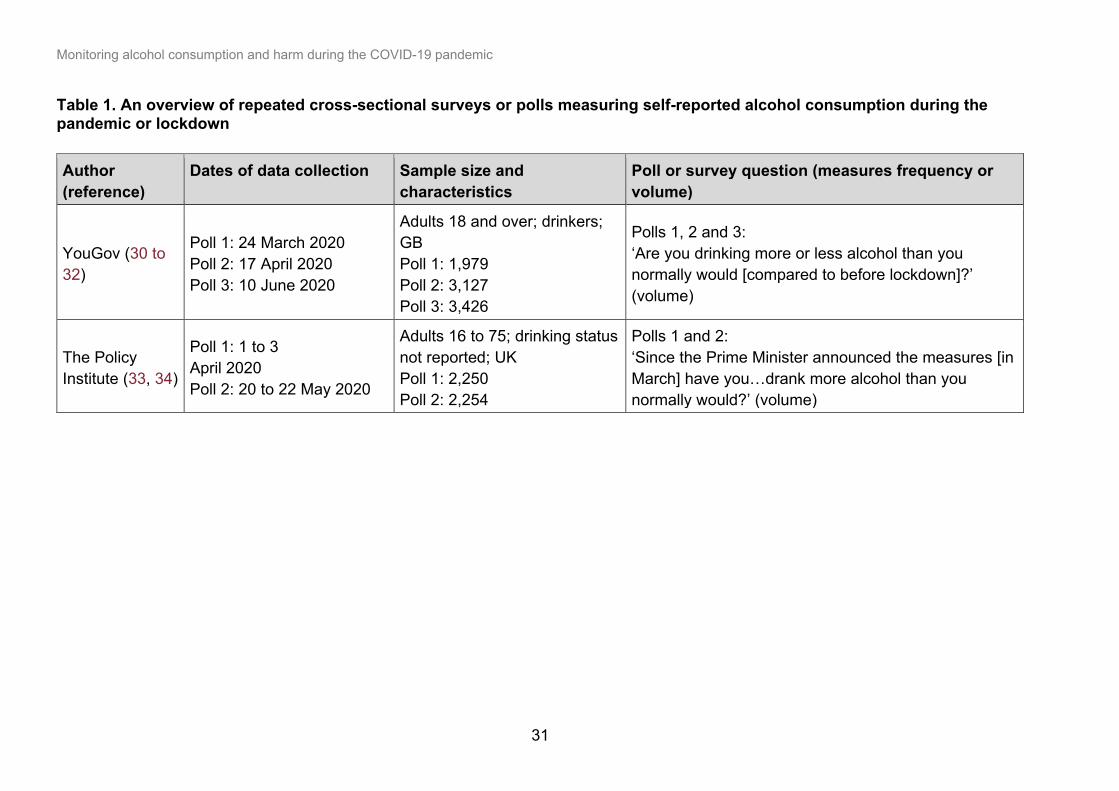
Table 1. An overview of repeated cross-sectional surveys or polls measuring self-reported alcohol consumption during the pandemic or lockdown Author (reference)
Dates of data collection Sample size and characteristics
Poll or survey question (measures frequency or volume)
YouGov (30 to 32)
Poll 1: 24 March 2020 Poll 2: 17 April 2020 Poll 3: 10 June 2020
Adults 18 and over; drinkers; GB Poll 1: 1,979 Poll 2: 3,127 Poll 3: 3,426
Polls 1, 2 and 3: ‘Are you drinking more or less alcohol than you normally would [compared to before lockdown]?’ (volume)
The Policy Institute (33, 34)
Poll 1: 1 to 3 April 2020 Poll 2: 20 to 22 May 2020
Adults 16 to 75; drinking status not reported; UK Poll 1: 2,250 Poll 2: 2,254
Polls 1 and 2: ‘Since the Prime Minister announced the measures [in March] have you…drank more alcohol than you normally would?’ (volume)
Monitoring alcohol consumption and harm during the COVID-19 pandemic
32
Author (reference)
Dates of data collection Sample size and characteristics
Poll or survey question (measures frequency or volume)
Alcohol Change (35, 36)
Survey 1: 7 to 9 April 2020 Survey 2: 26 to 29 June 2020
Adults 18 and over; drinkers and drinkers and ex-drinkers (depending on question); UK Survey 1: minimum 1,555 Survey 2: 1,647
Survey 1: ‘In the last 2 weeks (that is, since lockdown began) have you been drinking on more or fewer days than before?’ (frequency) ‘In the last 2 weeks has the amount of alcohol you’ve drunk on a typical day when you’re drinking changed?’ (volume) Survey 2: ‘How often, if at all, did you drink alcohol before and during lockdown?’ (frequency) ‘Overall, I have drunk more alcohol than usual during lockdown’ (volume)
Portman Group (37, 38)
Survey 1: 22 to 26 May 2020 Survey 2: 12 to 13 August 2020
Adults 18 and over; drinkers; UK Survey 1: 1,429 Survey 2: 1,707
Survey 1 and 2: A ‘change in drinking since lockdown?’ (volume)
YouGov data analysed by PHE (17)
4 May 2020 to 2 January 2021
Adults 18 and over; never drinkers, ex-drinkers and drinkers; England; sample not reported.
Percentage of respondents consuming: 0 units; ≤14; >14 and ≤21; >21 and ≤35; >21 and ≤35; >35 and ≤50; >50, during a typical week before the national lockdown and in the previous 7 days of being surveyed since (volume)
Monitoring alcohol consumption and harm during the COVID-19 pandemic
33
Table 2. An overview of repeated cross-sectional surveys or polls measuring self-reported alcohol consumption not specifically relating to the pandemic or lockdown Author (reference)
Dates of data collection Sample size and characteristics
Poll or survey question (measures frequency or volume)
Drinkaware (39)
Survey 1: 11 to 18 July 2019 Survey 2: 27 August to 15 September 2020
Adults 18 to 85; never drinkers, ex-drinkers and drinkers; UK Survey 1: 2,145 Survey 2: 9,046
Consumed alcohol at least: ‘once a year’, ‘once a week’, and ‘at least 4 times a week’ (frequency)
UCL Alcohol Toolkit Study analysed by PHE (17)
March 2019 and March 2021 (monthly measurements – dates not reported)
Adults 16 and over; never drinkers, ex-drinkers and drinkers; England; sample approximately 1,700 (monthly)
Percentage of increasing and higher risk drinkers (scoring more than 7 on the Alcohol Use Disorder Identification Test (AUDIT)) (frequency and volume)
YouGov (40)
July 2019 and January 2021 (6-monthly measurements – dates not reported)
Adults 18 and over; never drinkers, ex-drinkers and drinkers; GB Poll 1: 1,890 Poll 2: 1,976 Poll 3: 2,008 Poll 4: 2,007
‘Which…do you think best describes your alcohol consumption levels in the past 6 months?’ (volume)
Monitoring alcohol consumption and harm during the COVID-19 pandemic
34
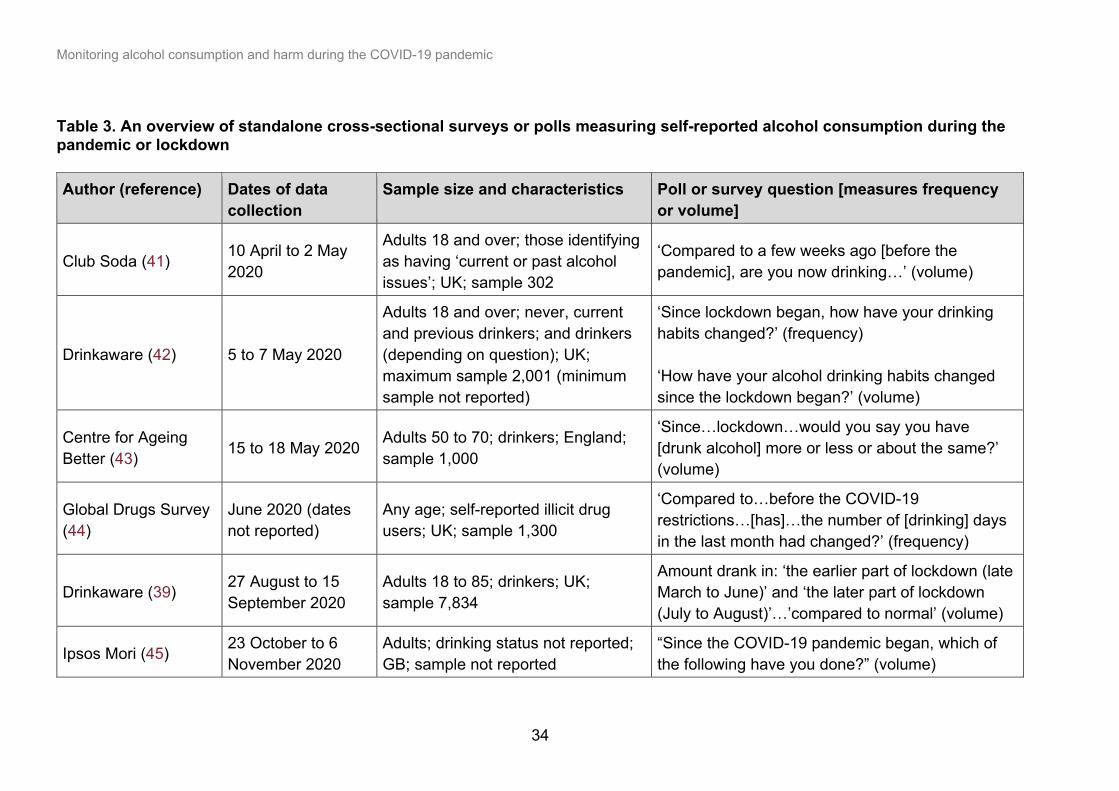
Table 3. An overview of standalone cross-sectional surveys or polls measuring self-reported alcohol consumption during the pandemic or lockdown Author (reference) Dates of data
collection Sample size and characteristics Poll or survey question [measures frequency
or volume]
Club Soda (41) 10 April to 2 May 2020
Adults 18 and over; those identifying as having ‘current or past alcohol issues’; UK; sample 302
‘Compared to a few weeks ago [before the pandemic], are you now drinking…’ (volume)
Drinkaware (42) 5 to 7 May 2020
Adults 18 and over; never, current and previous drinkers; and drinkers (depending on question); UK; maximum sample 2,001 (minimum sample not reported)
‘Since lockdown began, how have your drinking habits changed?’ (frequency) ‘How have your alcohol drinking habits changed since the lockdown began?’ (volume)
Centre for Ageing Better (43) 15 to 18 May 2020 Adults 50 to 70; drinkers; England;
sample 1,000
‘Since…lockdown…would you say you have [drunk alcohol] more or less or about the same?’ (volume)
Global Drugs Survey (44)
June 2020 (dates not reported)
Any age; self-reported illicit drug users; UK; sample 1,300
‘Compared to…before the COVID-19 restrictions…[has]…the number of [drinking] days in the last month had changed?’ (frequency)
Drinkaware (39) 27 August to 15 September 2020
Adults 18 to 85; drinkers; UK; sample 7,834
Amount drank in: ‘the earlier part of lockdown (late March to June)’ and ‘the later part of lockdown (July to August)’…’compared to normal’ (volume)
Ipsos Mori (45) 23 October to 6 November 2020
Adults; drinking status not reported; GB; sample not reported
“Since the COVID-19 pandemic began, which of the following have you done?” (volume)
Monitoring alcohol consumption and harm during the COVID-19 pandemic
35
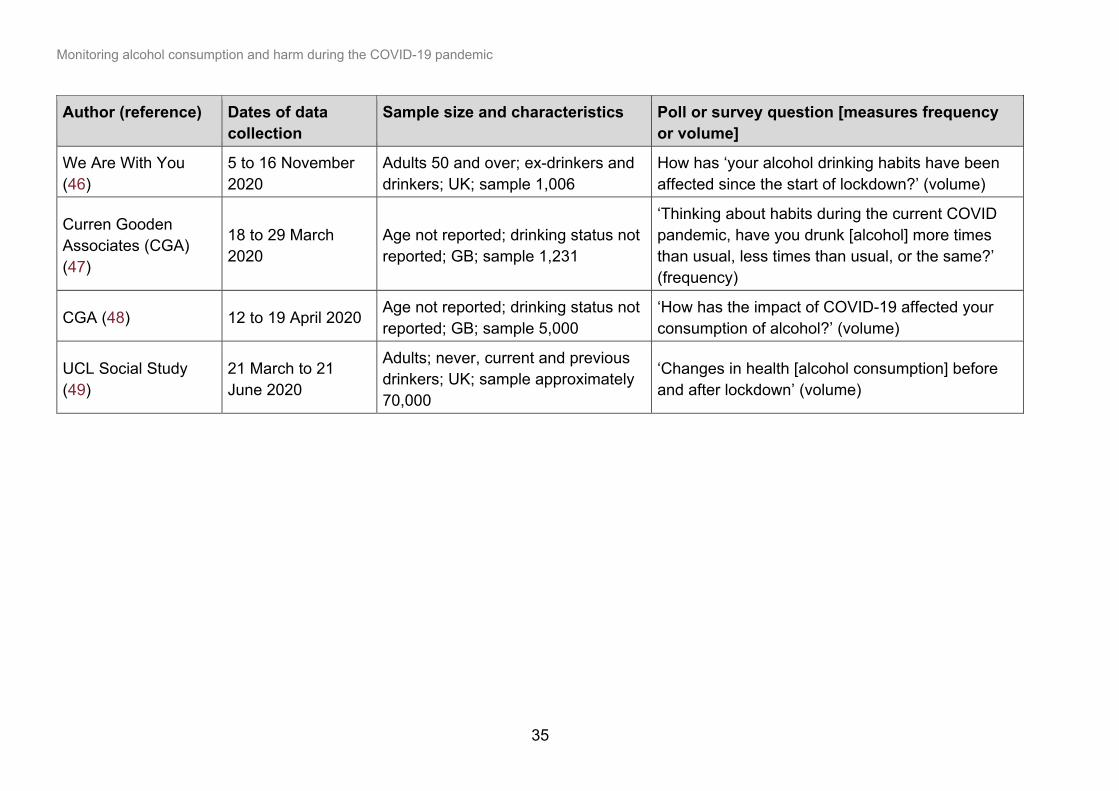
Author (reference) Dates of data collection
Sample size and characteristics Poll or survey question [measures frequency or volume]
We Are With You (46)
5 to 16 November 2020
Adults 50 and over; ex-drinkers and drinkers; UK; sample 1,006
How has ‘your alcohol drinking habits have been affected since the start of lockdown?’ (volume)
Curren Gooden Associates (CGA) (47)
18 to 29 March 2020
Age not reported; drinking status not reported; GB; sample 1,231
‘Thinking about habits during the current COVID pandemic, have you drunk [alcohol] more times than usual, less times than usual, or the same?’ (frequency)
CGA (48) 12 to 19 April 2020 Age not reported; drinking status not reported; GB; sample 5,000
‘How has the impact of COVID-19 affected your consumption of alcohol?’ (volume)
UCL Social Study (49)
21 March to 21 June 2020
Adults; never, current and previous drinkers; UK; sample approximately 70,000
‘Changes in health [alcohol consumption] before and after lockdown’ (volume)
Monitoring alcohol consumption and harm during the COVID-19 pandemic
36
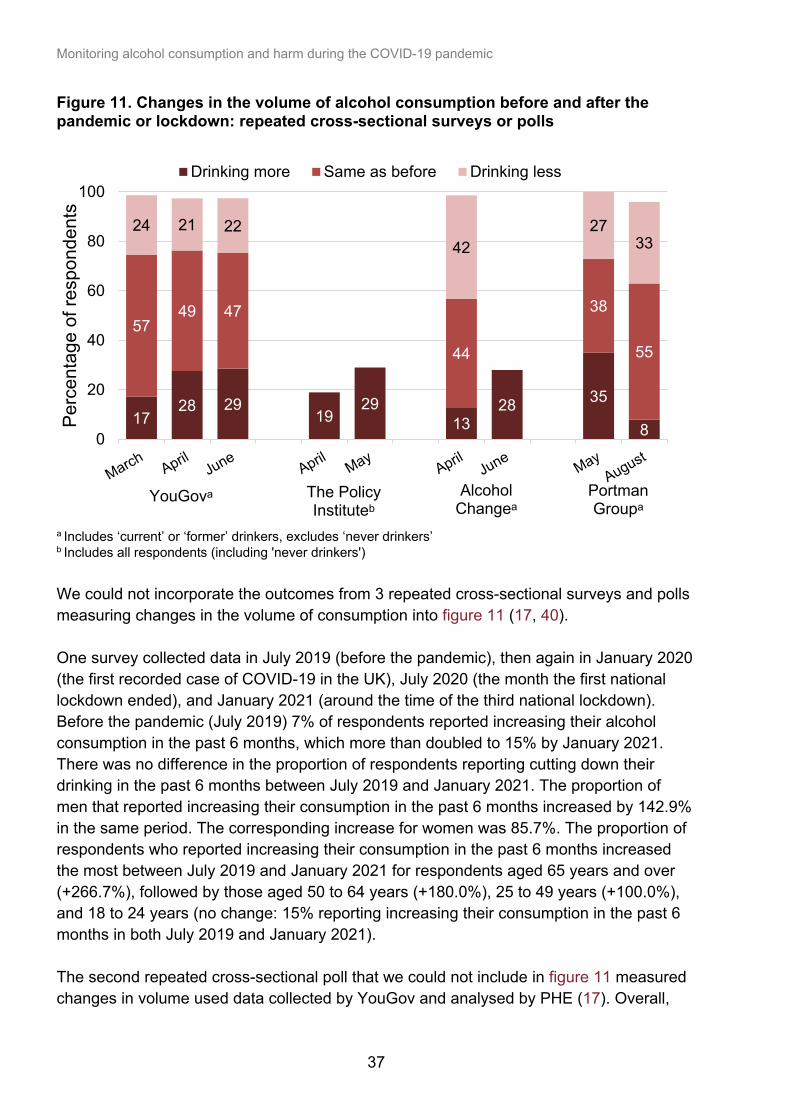
Many of the findings of the surveys and polls reported similar outcomes that could be combined, such as respondents reporting “drinking more”, “drinking less” or "no change”. Where possible, we have combined these findings to create figures. In these figures we have reported findings for the surveys and polls that report changes in drinking volume and frequency, and for repeated cross-sectional and one-off cross-sectional designs separately. These figures provide a useful general impression of changes in self-reported alcohol consumption, but you should interpret them with caution given the differences in study design month of data collection, and the questions asked to respondents. Where outcomes were too variable to include in these figures, we reported the findings separately. We excluded responses of “don’t know” from our figures. Note that figures may not sum to 100% due to rounding. Findings from repeated cross-sectional surveys and polls reporting changes in alcohol volume Figure 11 shows the findings from 4 repeated cross-sectional surveys and polls that measure changes in the volume of alcohol consumed after the pandemic or lockdown (30 to 38). This figure shows the proportion of respondents in each survey or poll who reported ‘drinking more’, ‘drinking less’ or drinking ‘the same as before’ when asked about the pandemic or lockdown. Three of the 4 surveys and polls sampled UK adults, and sample sizes ranged from 1,429 to 3,426, with data collected between March and August 2020. The methodological quality of the surveys and polls was low, and measurement of outcomes varied. Although most respondents report drinking the same volume compared to before the pandemic or lockdown, there appears to be a polarisation in drinking. That is, the proportion of respondents reported drinking more was similar to the proportion who reported drinking less. Across the surveys and polls, and across time periods, between 8% and 35% of respondents reported drinking more and between 21% and 42% reported drinking less. When looking at how the results vary over time, the surveys and polls tend to show increases in the proportion of respondents who reported drinking more between March and June (the period of the first national lockdown). This aligns with the sales and duty receipts data, but the one survey that sampled people after June (in August) reported a decrease in the proportion of respondents reporting drinking more compared to the pandemic or lockdown. This does not align with the off-trade volume sales data, which shows higher levels of alcohol purchasing in August 2020 compared to August 2019.
Monitoring alcohol consumption and harm during the COVID-19 pandemic
37
Figure 11. Changes in the volume of alcohol consumption before and after the pandemic or lockdown: repeated cross-sectional surveys or polls
a Includes ‘current’ or ‘former’ drinkers, excludes ‘never drinkers’ b Includes all respondents (including 'never drinkers') We could not incorporate the outcomes from 3 repeated cross-sectional surveys and polls measuring changes in the volume of consumption into figure 11 (17, 40). One survey collected data in July 2019 (before the pandemic), then again in January 2020 (the first recorded case of COVID-19 in the UK), July 2020 (the month the first national lockdown ended), and January 2021 (around the time of the third national lockdown). Before the pandemic (July 2019) 7% of respondents reported increasing their alcohol consumption in the past 6 months, which more than doubled to 15% by January 2021. There was no difference in the proportion of respondents reporting cutting down their drinking in the past 6 months between July 2019 and January 2021. The proportion of men that reported increasing their consumption in the past 6 months increased by 142.9% in the same period. The corresponding increase for women was 85.7%. The proportion of respondents who reported increasing their consumption in the past 6 months increased the most between July 2019 and January 2021 for respondents aged 65 years and over (+266.7%), followed by those aged 50 to 64 years (+180.0%), 25 to 49 years (+100.0%), and 18 to 24 years (no change: 15% reporting increasing their consumption in the past 6 months in both July 2019 and January 2021). The second repeated cross-sectional poll that we could not include in figure 11 measured changes in volume used data collected by YouGov and analysed by PHE (17). Overall,
1728 29
1929
1328 35
8
5749 47
44
38
55
24 21 2242
2733
0
20
40
60
80
100
Perc
enta
ge o
f res
pond
ents
Drinking more Same as before Drinking less
YouGovᵃ The Policy Instituteᵇ
Alcohol Changeᵃ
Portman Groupᵃ
Monitoring alcohol consumption and harm during the COVID-19 pandemic
38
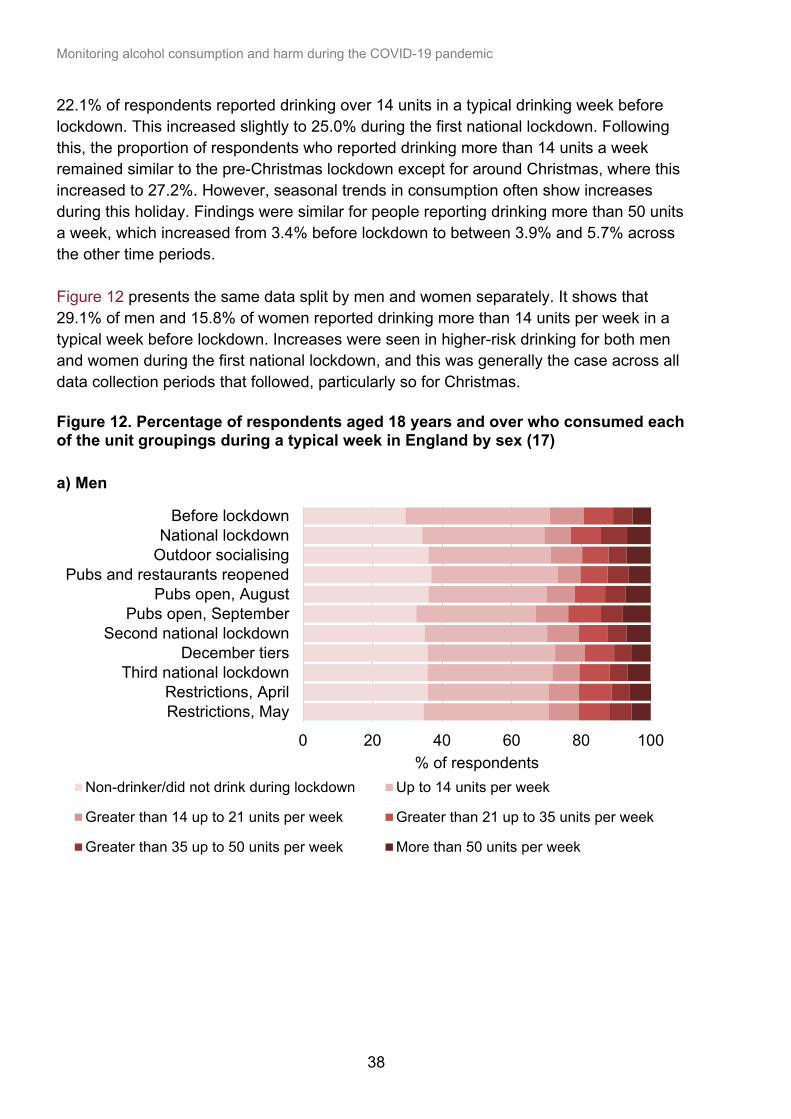
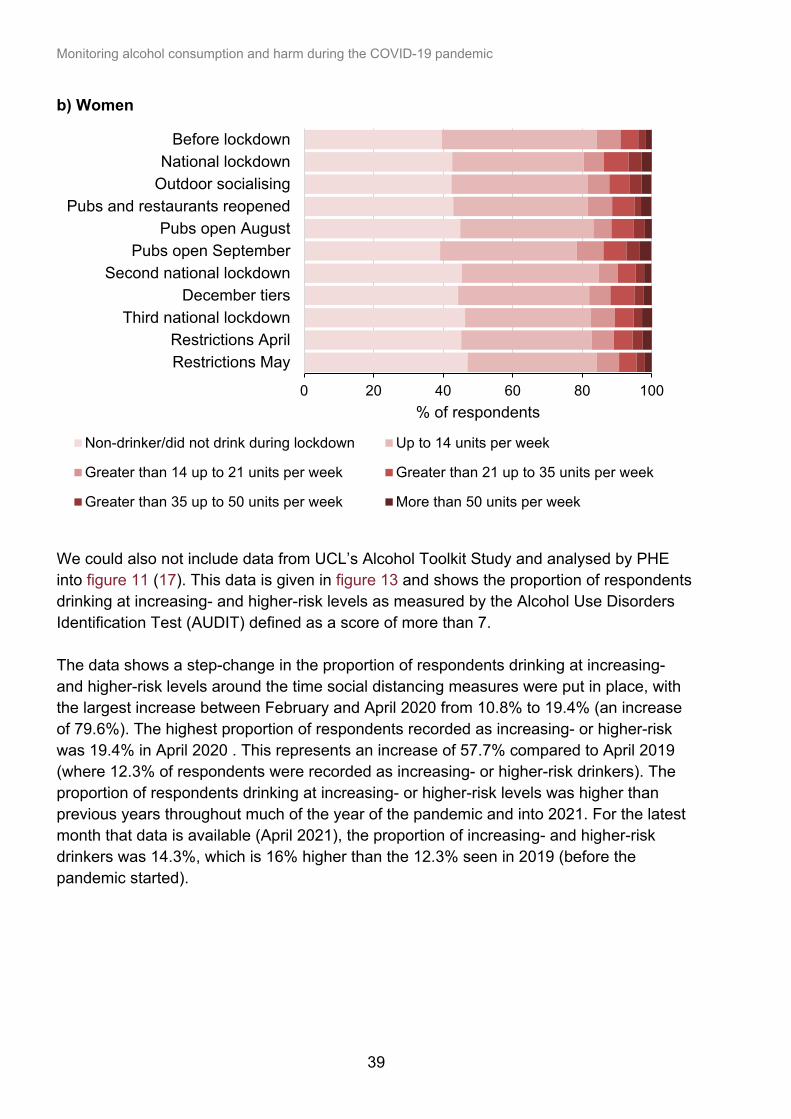
22.1% of respondents reported drinking over 14 units in a typical drinking week before lockdown. This increased slightly to 25.0% during the first national lockdown. Following this, the proportion of respondents who reported drinking more than 14 units a week remained similar to the pre-Christmas lockdown except for around Christmas, where this increased to 27.2%. However, seasonal trends in consumption often show increases during this holiday. Findings were similar for people reporting drinking more than 50 units a week, which increased from 3.4% before lockdown to between 3.9% and 5.7% across the other time periods. Figure 12 presents the same data split by men and women separately. It shows that 29.1% of men and 15.8% of women reported drinking more than 14 units per week in a typical week before lockdown. Increases were seen in higher-risk drinking for both men and women during the first national lockdown, and this was generally the case across all data collection periods that followed, particularly so for Christmas. Figure 12. Percentage of respondents aged 18 years and over who consumed each of the unit groupings during a typical week in England by sex (17) a) Men
0 20 40 60 80 100
Restrictions, MayRestrictions, April
Third national lockdownDecember tiers
Second national lockdownPubs open, September
Pubs open, AugustPubs and restaurants reopened
Outdoor socialisingNational lockdown
Before lockdown
% of respondentsNon-drinker/did not drink during lockdown Up to 14 units per week
Greater than 14 up to 21 units per week Greater than 21 up to 35 units per week
Greater than 35 up to 50 units per week More than 50 units per week
Monitoring alcohol consumption and harm during the COVID-19 pandemic
39
b) Women
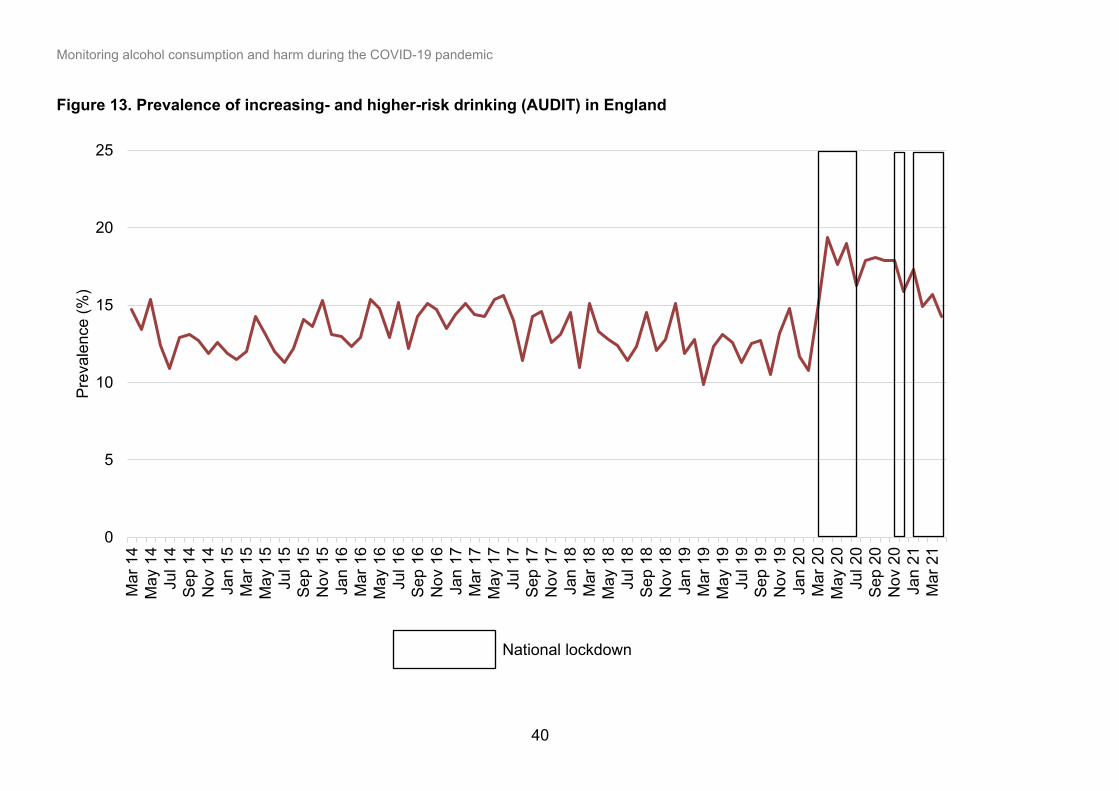
We could also not include data from UCL’s Alcohol Toolkit Study and analysed by PHE into figure 11 (17). This data is given in figure 13 and shows the proportion of respondents drinking at increasing- and higher-risk levels as measured by the Alcohol Use Disorders Identification Test (AUDIT) defined as a score of more than 7. The data shows a step-change in the proportion of respondents drinking at increasing- and higher-risk levels around the time social distancing measures were put in place, with the largest increase between February and April 2020 from 10.8% to 19.4% (an increase of 79.6%). The highest proportion of respondents recorded as increasing- or higher-risk was 19.4% in April 2020 . This represents an increase of 57.7% compared to April 2019 (where 12.3% of respondents were recorded as increasing- or higher-risk drinkers). The proportion of respondents drinking at increasing- or higher-risk levels was higher than previous years throughout much of the year of the pandemic and into 2021. For the latest month that data is available (April 2021), the proportion of increasing- and higher-risk drinkers was 14.3%, which is 16% higher than the 12.3% seen in 2019 (before the pandemic started).
0 20 40 60 80 100
Restrictions MayRestrictions April
Third national lockdownDecember tiers
Second national lockdownPubs open September
Pubs open AugustPubs and restaurants reopened
Outdoor socialisingNational lockdown
Before lockdown
% of respondents
Non-drinker/did not drink during lockdown Up to 14 units per week
Greater than 14 up to 21 units per week Greater than 21 up to 35 units per week
Greater than 35 up to 50 units per week More than 50 units per week
Monitoring alcohol consumption and harm during the COVID-19 pandemic
40
Figure 13. Prevalence of increasing- and higher-risk drinking (AUDIT) in England
0
5
10
15
20
25M
ar 1
4M
ay 1
4Ju
l 14
Sep
14N
ov 1
4Ja
n 15
Mar
15
May
15
Jul 1
5Se
p 15
Nov
15
Jan
16M
ar 1
6M
ay 1
6Ju
l 16
Sep
16N
ov 1
6Ja
n 17
Mar
17
May
17
Jul 1
7Se
p 17
Nov
17
Jan
18M
ar 1
8M
ay 1
8Ju
l 18
Sep
18N
ov 1
8Ja
n 19
Mar
19
May
19
Jul 1
9Se
p 19
Nov
19
Jan
20M
ar 2
0M
ay 2
0Ju
l 20
Sep
20N
ov 2
0Ja
n 21
Mar
21
Prev
alen
ce (%
)
National lockdown
Monitoring alcohol consumption and harm during the COVID-19 pandemic
41
The final repeated cross-sectional survey that we could not incorporate into figure 11 showed changes in drinking volume. It collected data in 2019 (before the pandemic) so we could then compare this to data collected in 2020 (during the pandemic) (39). This survey showed no change in the proportion of respondents drinking at increasing- or higher-risk levels between 2018 and 2020.5 For example, in 2018, 17% of respondents reported drinking at increasing-risk levels and 3% at higher-risk levels, which was the same in 2020. Data was not split by sex or age to enable further comparisons. Findings from one-off cross-sectional surveys and polls reporting on changes in alcohol volume Figures 14a, 14b and 14c show the findings from 8 one-off cross-sectional surveys or polls that measure changes in the volume of alcohol consumption after the pandemic or lockdown in: • the general population • respondents aged 50 years and over • respondents likely to be heavier drinkers (those ‘currently or formerly self-
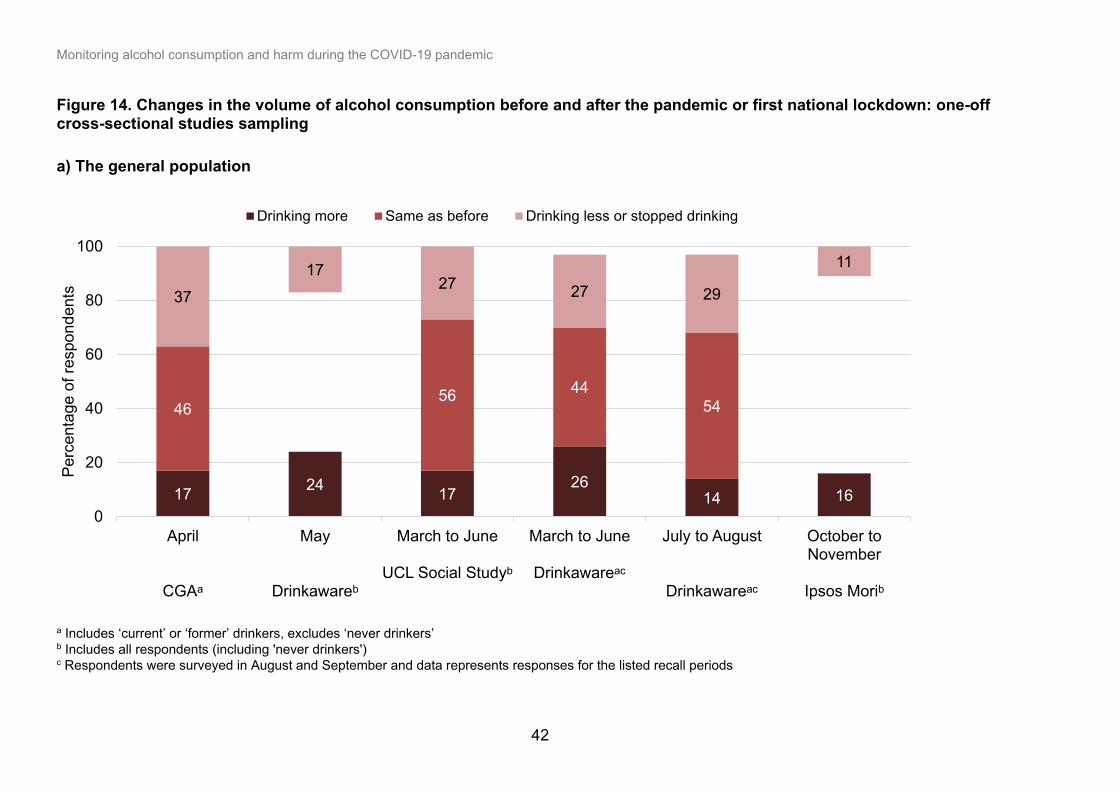
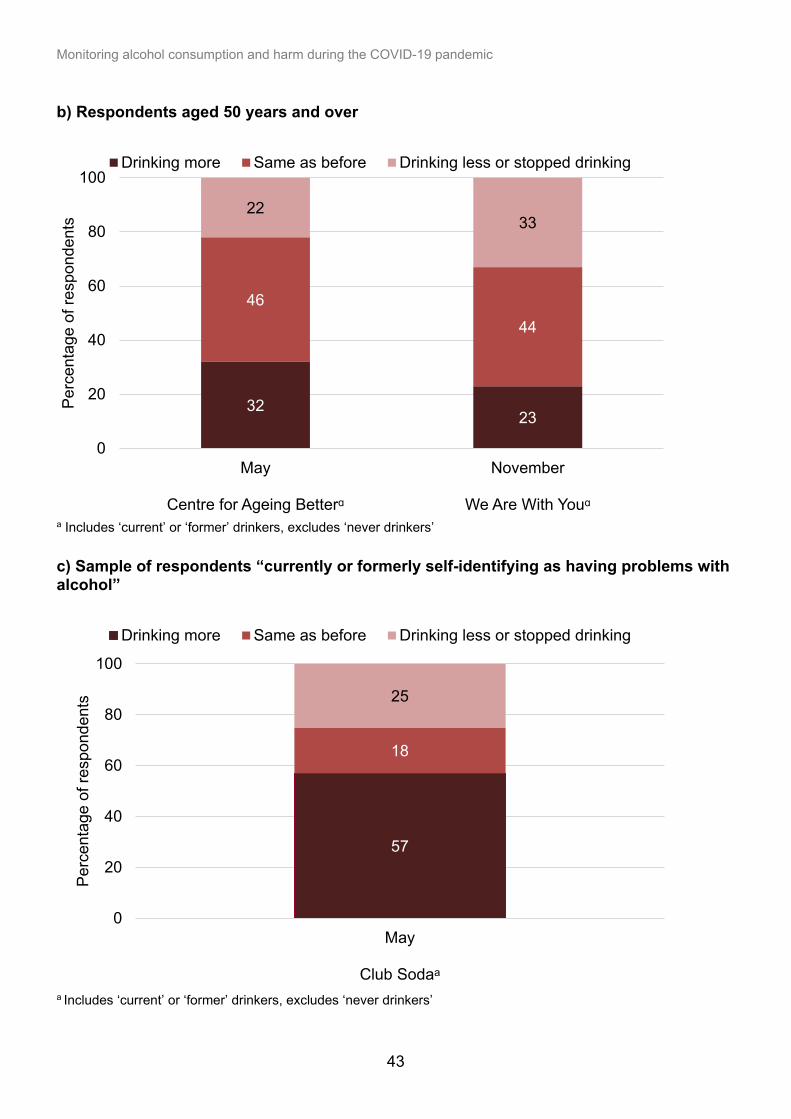
identifying as having problems with alcohol’) All surveys sampled adults, 5 of which recruited UK samples, 2 recruited GB samples, and one recruited an English sample. Sample sizes ranged from 302 to 70,000, though one poll did not report sample size. Data was collected between March and November 2020. The methodological quality of the surveys and polls was low, and measurement of outcomes varied. The figure shows the proportion of respondents reporting drinking more, less, or the same compared to before the pandemic or lockdown. Again, most respondents reported no change in alcohol consumption. Across the surveys and polls, between 14% and 26% of respondents report drinking more and between 11% and 37% report drinking less. A greater proportion of respondents from the single survey sampling who were “currently or formerly self-identifying as having problems with alcohol” reported drinking more since the start of the pandemic or lockdown.
5 Increasing-risk defined as between 15 to 49 units per week and 15 to 34 units per week for men and women respectively; higher-risk defined as 50+ units per week and 35+ units per week for men and women respectively.
Monitoring alcohol consumption and harm during the COVID-19 pandemic
42
Figure 14. Changes in the volume of alcohol consumption before and after the pandemic or first national lockdown: one-off cross-sectional studies sampling a) The general population
a Includes ‘current’ or ‘former’ drinkers, excludes ‘never drinkers’ b Includes all respondents (including 'never drinkers') c Respondents were surveyed in August and September and data represents responses for the listed recall periods
17 24 1726
14 16
4656 44
54
3717
27 27 29
11
0
20
40
60
80
100
April
CGAᵃ
May
Drinkawareᵇ
March to June
UCL Social Studyᵇ
March to June
Drinkawareᵃᶜ
July to August
Drinkawareᵃᶜ
October to November
Ipsos Moriᵇ
Perc
enta
ge o
f res
pond
ents
Drinking more Same as before Drinking less or stopped drinking
Monitoring alcohol consumption and harm during the COVID-19 pandemic
43
b) Respondents aged 50 years and over
a Includes ‘current’ or ‘former’ drinkers, excludes ‘never drinkers’ c) Sample of respondents “currently or formerly self-identifying as having problems with alcohol”
a Includes ‘current’ or ‘former’ drinkers, excludes ‘never drinkers’
3223
4644
2233
0
20
40
60
80
100
May
Centre for Ageing Betterᵅ
November
We Are With Youᵅ
Perc
enta
ge o
f res
pond
ents
Drinking more Same as before Drinking less or stopped drinking
57
18
25
0
20
40
60
80
100
May
Club Sodaᵃ
Perc
enta
ge o
f res
pond
ents
Drinking more Same as before Drinking less or stopped drinking
Monitoring alcohol consumption and harm during the COVID-19 pandemic
44
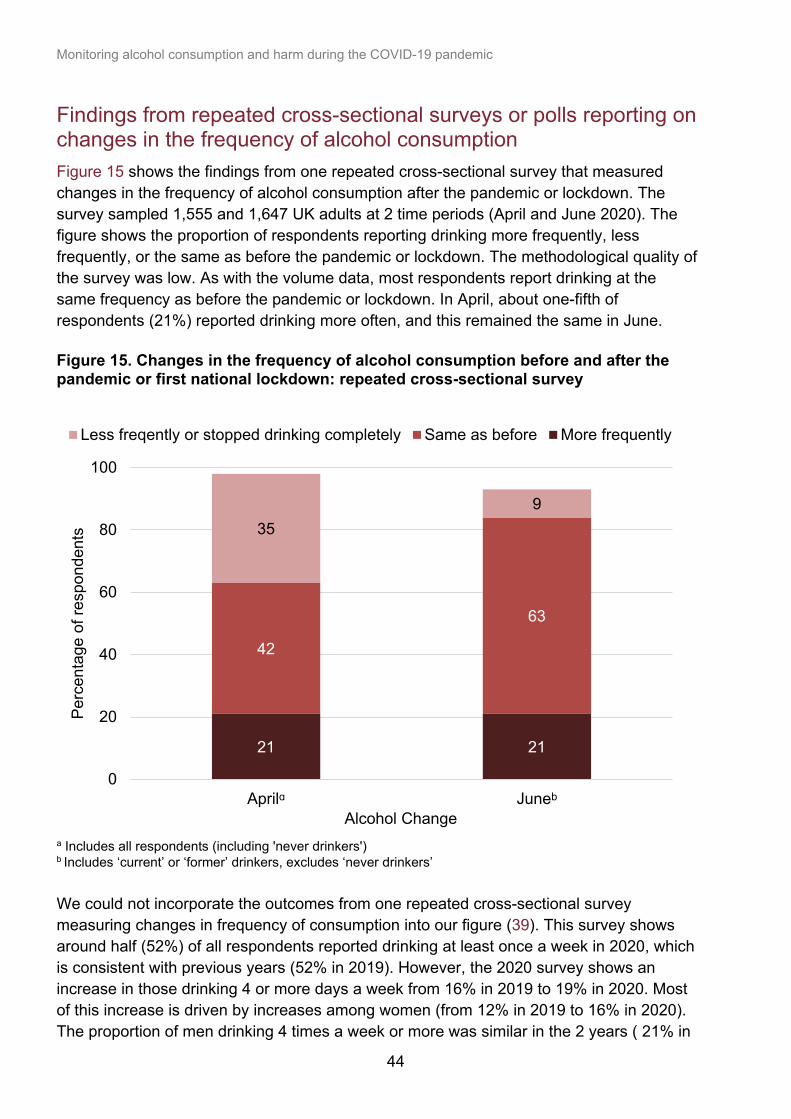
Findings from repeated cross-sectional surveys or polls reporting on changes in the frequency of alcohol consumption Figure 15 shows the findings from one repeated cross-sectional survey that measured changes in the frequency of alcohol consumption after the pandemic or lockdown. The survey sampled 1,555 and 1,647 UK adults at 2 time periods (April and June 2020). The figure shows the proportion of respondents reporting drinking more frequently, less frequently, or the same as before the pandemic or lockdown. The methodological quality of the survey was low. As with the volume data, most respondents report drinking at the same frequency as before the pandemic or lockdown. In April, about one-fifth of respondents (21%) reported drinking more often, and this remained the same in June. Figure 15. Changes in the frequency of alcohol consumption before and after the pandemic or first national lockdown: repeated cross-sectional survey
a Includes all respondents (including 'never drinkers') b Includes ‘current’ or ‘former’ drinkers, excludes ‘never drinkers’ We could not incorporate the outcomes from one repeated cross-sectional survey measuring changes in frequency of consumption into our figure (39). This survey shows around half (52%) of all respondents reported drinking at least once a week in 2020, which is consistent with previous years (52% in 2019). However, the 2020 survey shows an increase in those drinking 4 or more days a week from 16% in 2019 to 19% in 2020. Most of this increase is driven by increases among women (from 12% in 2019 to 16% in 2020). The proportion of men drinking 4 times a week or more was similar in the 2 years ( 21% in
21 21
42
63
359
0
20
40
60
80
100
Aprilᵅ Juneᵇ
Perc
enta
ge o
f res
pond
ents
Less freqently or stopped drinking completely Same as before More frequently
Alcohol Change
Monitoring alcohol consumption and harm during the COVID-19 pandemic
45
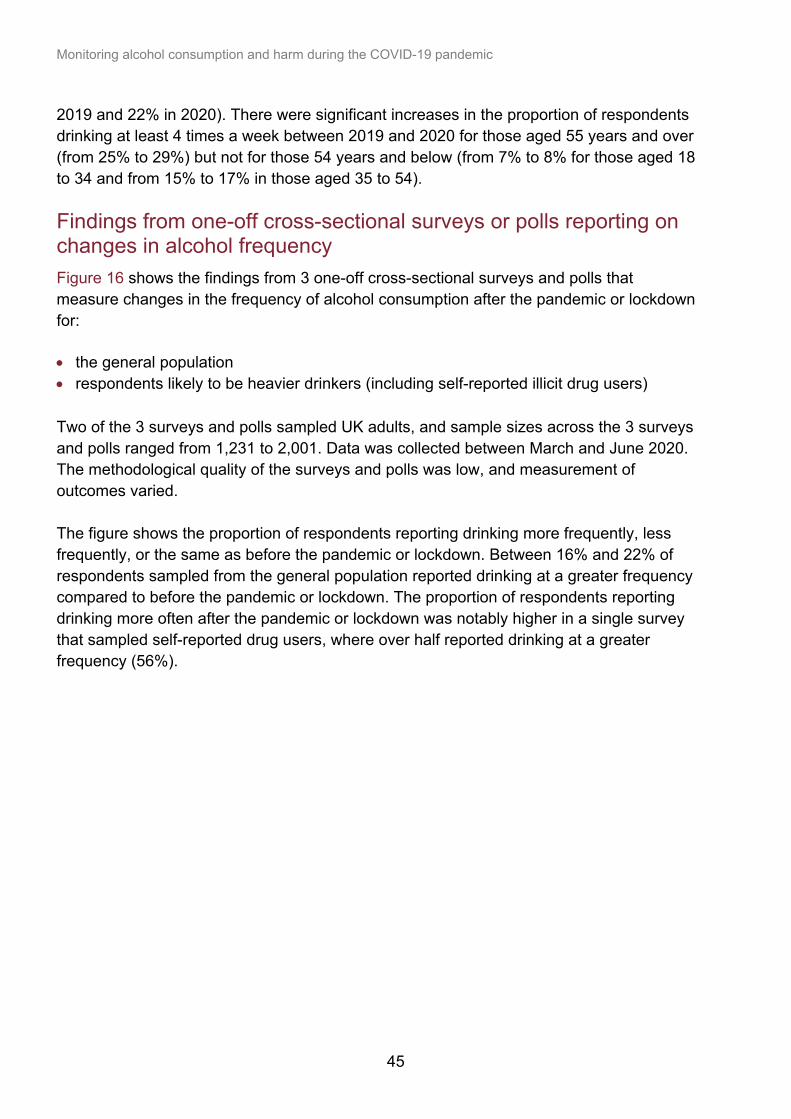
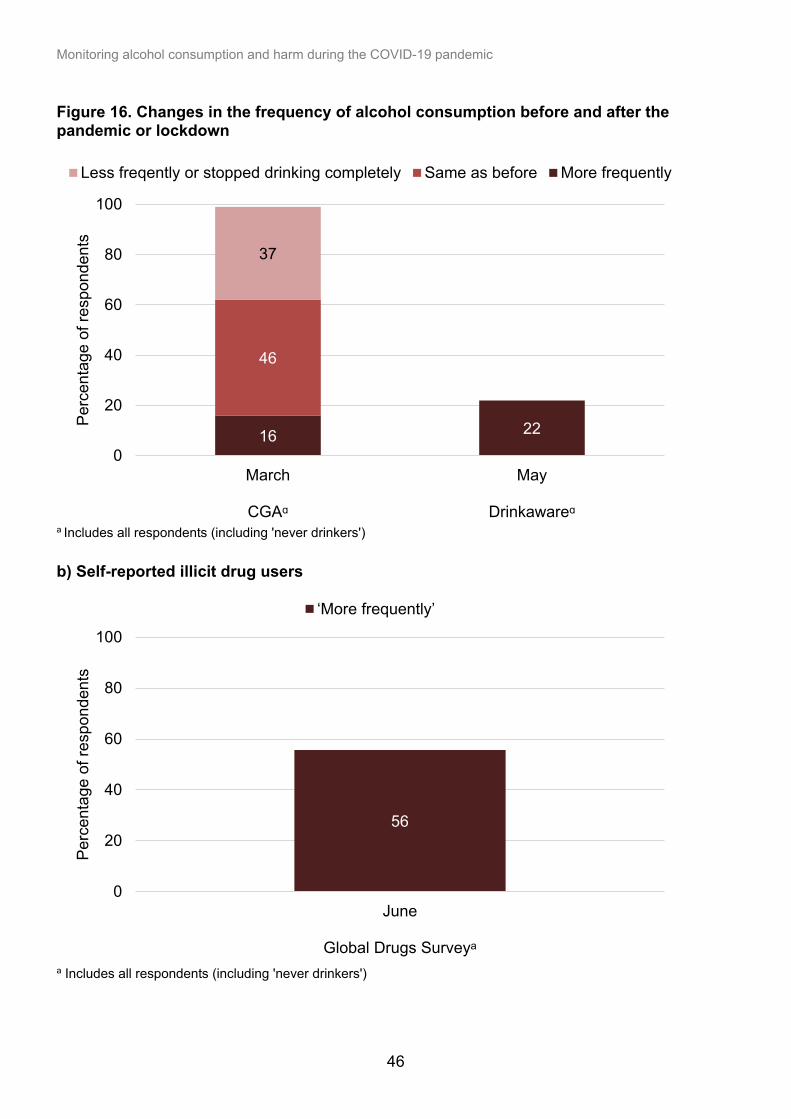
2019 and 22% in 2020). There were significant increases in the proportion of respondents drinking at least 4 times a week between 2019 and 2020 for those aged 55 years and over (from 25% to 29%) but not for those 54 years and below (from 7% to 8% for those aged 18 to 34 and from 15% to 17% in those aged 35 to 54). Findings from one-off cross-sectional surveys or polls reporting on changes in alcohol frequency Figure 16 shows the findings from 3 one-off cross-sectional surveys and polls that measure changes in the frequency of alcohol consumption after the pandemic or lockdown for: • the general population • respondents likely to be heavier drinkers (including self-reported illicit drug users) Two of the 3 surveys and polls sampled UK adults, and sample sizes across the 3 surveys and polls ranged from 1,231 to 2,001. Data was collected between March and June 2020. The methodological quality of the surveys and polls was low, and measurement of outcomes varied. The figure shows the proportion of respondents reporting drinking more frequently, less frequently, or the same as before the pandemic or lockdown. Between 16% and 22% of respondents sampled from the general population reported drinking at a greater frequency compared to before the pandemic or lockdown. The proportion of respondents reporting drinking more often after the pandemic or lockdown was notably higher in a single survey that sampled self-reported drug users, where over half reported drinking at a greater frequency (56%).
Monitoring alcohol consumption and harm during the COVID-19 pandemic
46
Figure 16. Changes in the frequency of alcohol consumption before and after the pandemic or lockdown
a Includes all respondents (including 'never drinkers') b) Self-reported illicit drug users
a Includes all respondents (including 'never drinkers')
16 22
46
37
0
20
40
60
80
100
March
CGAᵅ
May
Drinkawareᵅ
Perc
enta
ge o
f res
pond
ents
Less freqently or stopped drinking completely Same as before More frequently
56
0
20
40
60
80
100
June
Global Drugs Surveyᵃ
Perc
enta
ge o
f res
pond
ents
‘More frequently’
Monitoring alcohol consumption and harm during the COVID-19 pandemic
47
Differences among drinking groups The findings of the surveys and polls suggest that people who are drinking at higher levels are bringing about the increases in alcohol consumption seen during lockdown (35, 37). Alcohol Concern found that 51% of people drinking more since the start of lockdown drank 5 units or more on a typical day (35). Also, 50% of those who reported drinking “a lot more” in the past 2 weeks also drank 5 units or more on a typical drinking day. A follow up survey from Alcohol Concern found that heavier drinkers were more likely to report increasing the amount they drank (36). For example, 38% of those who typically drank heavily on drinking days pre-lockdown (7 units or more) said they drank more during lockdown, compared to 23% of those who drank 2 units or less on a typical drinking day. The Portman Group also found that of those drinking more during lockdown, 10% had over 35 units per week (37). This compares to 3% of the general population who reported drinking over 35 units per week before lockdown. Furthermore, the prevalence of increasing and higher risk drinkers peaked during lockdown, with this increasing to 19.4% in April 2020 (17).
Monitoring alcohol consumption and harm during the COVID-19 pandemic
48
3. Alcohol-specific morbidity and mortality during the COVID-19 pandemic Alcohol causes or contributes to over 200 diseases, conditions and injuries (22, 50). An alcohol attributable fraction (AAF) is an estimate of the proportion of cases of a condition, disease or injury that may be attributed to alcohol. Partially attributable conditions are described as alcohol-related and have an AAF less than 1, such as breast cancer or hypertension (51). Wholly attributable conditions are described as alcohol-specific and have an alcohol-attributable fraction equal to one, such as alcohol dependence or alcoholic liver disease. This report only includes alcohol-specific morbidity (hospital admissions) and mortality (deaths). This is because alcohol-specific outcomes respond more rapidly to changes in alcohol consumption compared to alcohol-related outcomes. Also, partially attributable outcomes may be influenced by other factors, such as obesity or smoking, which we do not consider in this report. This section of the report presents unplanned (non-elective) alcohol-specific hospital admissions and alcohol-specific deaths. For both admissions and deaths, we report provisional data for 2020 and 2021, and combined data for the years 2018 and 2019 (referred to as ‘baseline’). PHE publishes this data on the WICH dashboard, which is updated regularly (17). On WICH, you can select the data for different ages, ethnicities, geographies, and by deprivation. For both total alcohol-specific hospital admissions and alcohol-specific deaths, we calculate 95% confidence intervals (CIs). The mortality and hospital admission data is not subject to sampling variation because they are not drawn from a sample, but they may be affected by random variation. To help assess the variability in the rates, we have presented them alongside 95% CIs. We calculated these CIs using the methods set out by Dobson and colleagues (52). The term ‘significant’ refers to statistically significant changes or differences determined using the 95% CIs, where instances of non-overlapping CIs between figures show that the difference is unlikely to have come from random fluctuation. While more formalised or accurate methods of significance testing are available, we use the non-overlapping CI method because it is more easily understood by a wider audience than the other methods.
3.1 Alcohol-specific hospital admissions This section uses Hospital Episode Statistics (HES) data to present the trends in unplanned inpatient hospital admissions for alcohol-specific causes in England, analysed by PHE.6 We excluded elective admissions because many of these were cancelled during
6 Only finished admissions are included. Data is limited to English residents or those recorded with no fixed abode. Admissions where no age was reported for the individual are excluded. Regular day or night attenders are excluded.
Monitoring alcohol consumption and harm during the COVID-19 pandemic
49
the pandemic to reduce the burden on the NHS (53). Data is complete to the end of February 2021, and you should consider the 2020 and 2021 data as provisional. We report directly age-standardised rates (DSRs) per 100,000 population.7 Rates are presented for: • total unplanned alcohol-specific admissions • admissions for mental and behavioural disorders due to alcohol use • alcohol poisonings • alcohol-related liver disease Baseline rates combine 2018 and 2019 admission numbers and populations to create a weighted average for the 2 years. Total unplanned hospital admissions for alcohol-specific conditions Figure 17 shows the trend in the rate of alcohol-specific unplanned hospital admissions for 2020, 2021, and baseline. In 2020 (during the pandemic), there were 258,811 unplanned admissions for alcohol-specific causes, which represents a decrease of 3.2% compared to 2019 (before the pandemic) when there were 267,266 unplanned admissions. The rate of alcohol-specific admissions decreased rapidly around the time of the first national lockdown to 355.4 per 100,000 population in April 2020, which was significantly lower than the baseline rate of 482.8 per 100,000 (a decrease of 26.4%). Following this low, the rate of admissions rose to rates comparable to, or significantly higher than, previous years. The rates reached a peak of 570.1 per 100,000 in July 2020, which was significantly higher than the baseline rate for July (526.4 per 100,000 or an increase of 8.3%). Between October 2020 and January 2021, rates were significantly lower than baseline, but by February 2021 were significantly higher than baseline.
7 The DSRs were derived by applying the category specific mortality rates of each population to the European Standard population. This produces age standardised mortality rates that have the same age distribution as the standard population.
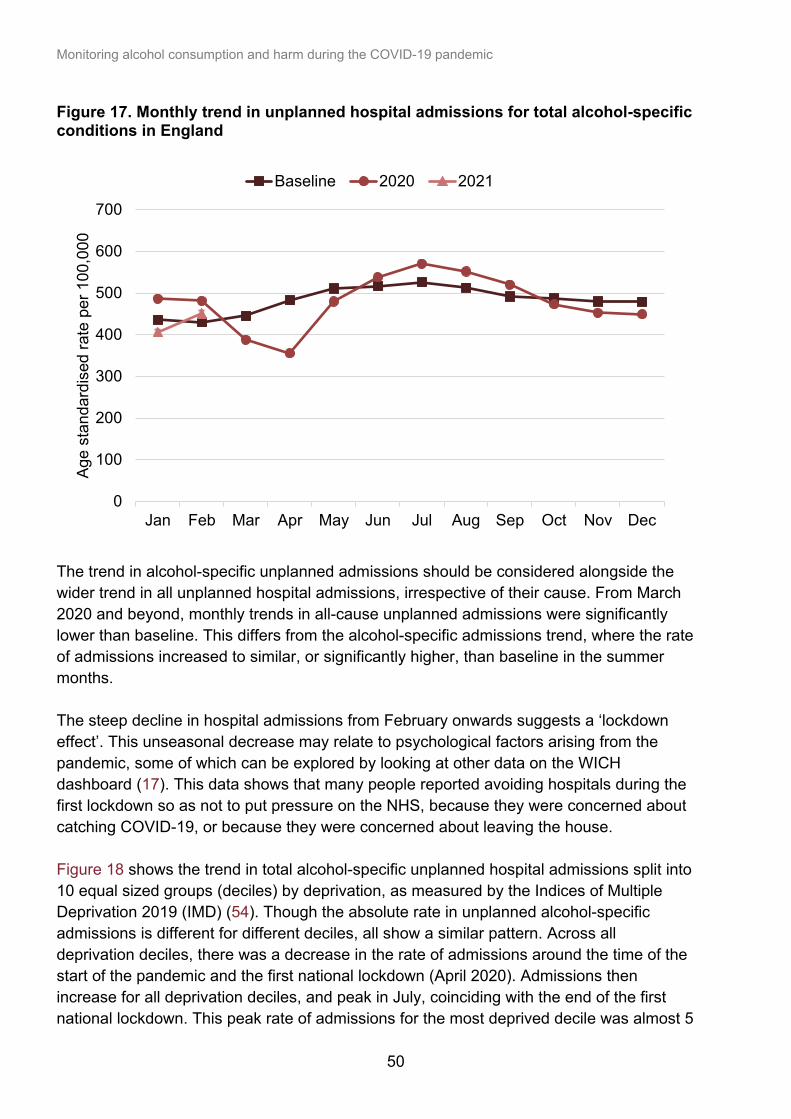
Monitoring alcohol consumption and harm during the COVID-19 pandemic
50
Figure 17. Monthly trend in unplanned hospital admissions for total alcohol-specific conditions in England
The trend in alcohol-specific unplanned admissions should be considered alongside the wider trend in all unplanned hospital admissions, irrespective of their cause. From March 2020 and beyond, monthly trends in all-cause unplanned admissions were significantly lower than baseline. This differs from the alcohol-specific admissions trend, where the rate of admissions increased to similar, or significantly higher, than baseline in the summer months. The steep decline in hospital admissions from February onwards suggests a ‘lockdown effect’. This unseasonal decrease may relate to psychological factors arising from the pandemic, some of which can be explored by looking at other data on the WICH dashboard (17). This data shows that many people reported avoiding hospitals during the first lockdown so as not to put pressure on the NHS, because they were concerned about catching COVID-19, or because they were concerned about leaving the house. Figure 18 shows the trend in total alcohol-specific unplanned hospital admissions split into 10 equal sized groups (deciles) by deprivation, as measured by the Indices of Multiple Deprivation 2019 (IMD) (54). Though the absolute rate in unplanned alcohol-specific admissions is different for different deciles, all show a similar pattern. Across all deprivation deciles, there was a decrease in the rate of admissions around the time of the start of the pandemic and the first national lockdown (April 2020). Admissions then increase for all deprivation deciles, and peak in July, coinciding with the end of the first national lockdown. This peak rate of admissions for the most deprived decile was almost 5
0
100
200
300
400
500
600
700
Jan Feb Mar Apr May Jun Jul Aug Sep Oct Nov Dec
Age
stan
dard
ised
rate
per
100
,000
Baseline 2020 2021
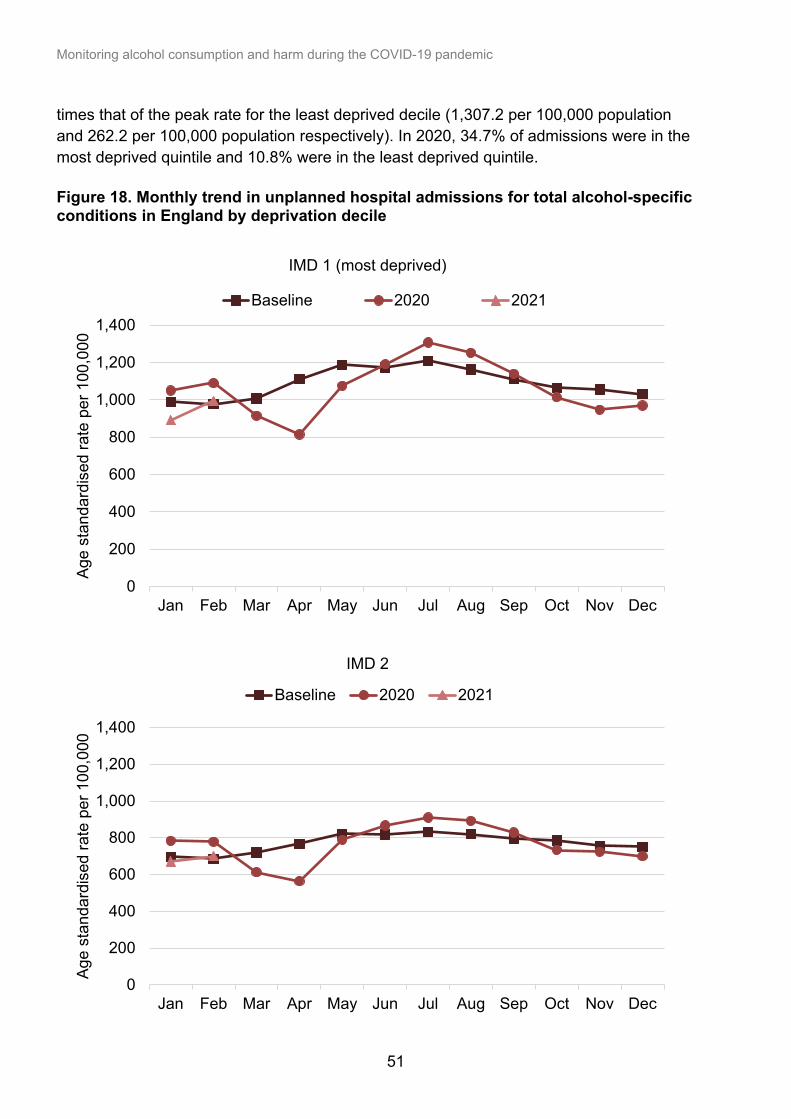
Monitoring alcohol consumption and harm during the COVID-19 pandemic
51
times that of the peak rate for the least deprived decile (1,307.2 per 100,000 population and 262.2 per 100,000 population respectively). In 2020, 34.7% of admissions were in the most deprived quintile and 10.8% were in the least deprived quintile. Figure 18. Monthly trend in unplanned hospital admissions for total alcohol-specific conditions in England by deprivation decile
0
200
400
600
800
1,000
1,200
1,400
Jan Feb Mar Apr May Jun Jul Aug Sep Oct Nov Dec
Age
stan
dard
ised
rate
per
100
,000
IMD 1 (most deprived)
Baseline 2020 2021
0
200
400
600
800
1,000
1,200
1,400
Jan Feb Mar Apr May Jun Jul Aug Sep Oct Nov Dec
Age
stan
dard
ised
rate
per
100
,000
IMD 2
Baseline 2020 2021
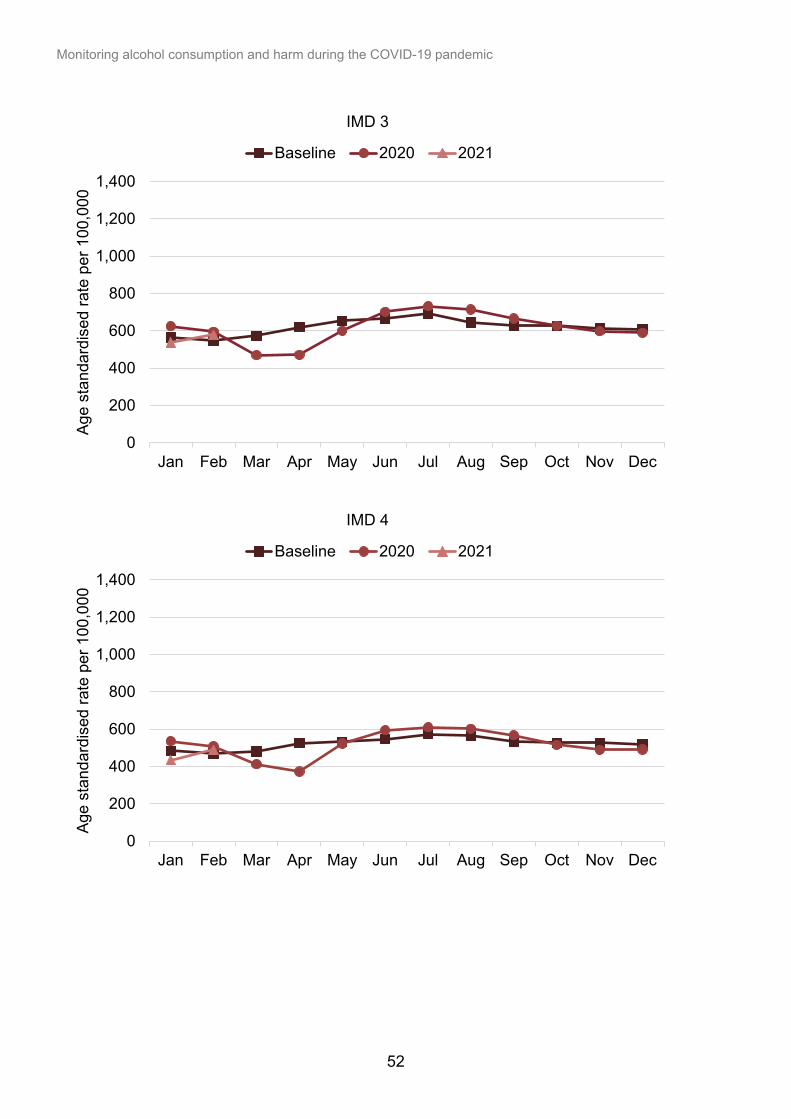
Monitoring alcohol consumption and harm during the COVID-19 pandemic
52
0
200
400
600
800
1,000
1,200
1,400
Jan Feb Mar Apr May Jun Jul Aug Sep Oct Nov Dec
Age
stan
dard
ised
rate
per
100
,000
IMD 3
Baseline 2020 2021
0
200
400
600
800
1,000
1,200
1,400
Jan Feb Mar Apr May Jun Jul Aug Sep Oct Nov Dec
Age
stan
dard
ised
rate
per
100
,000
IMD 4
Baseline 2020 2021
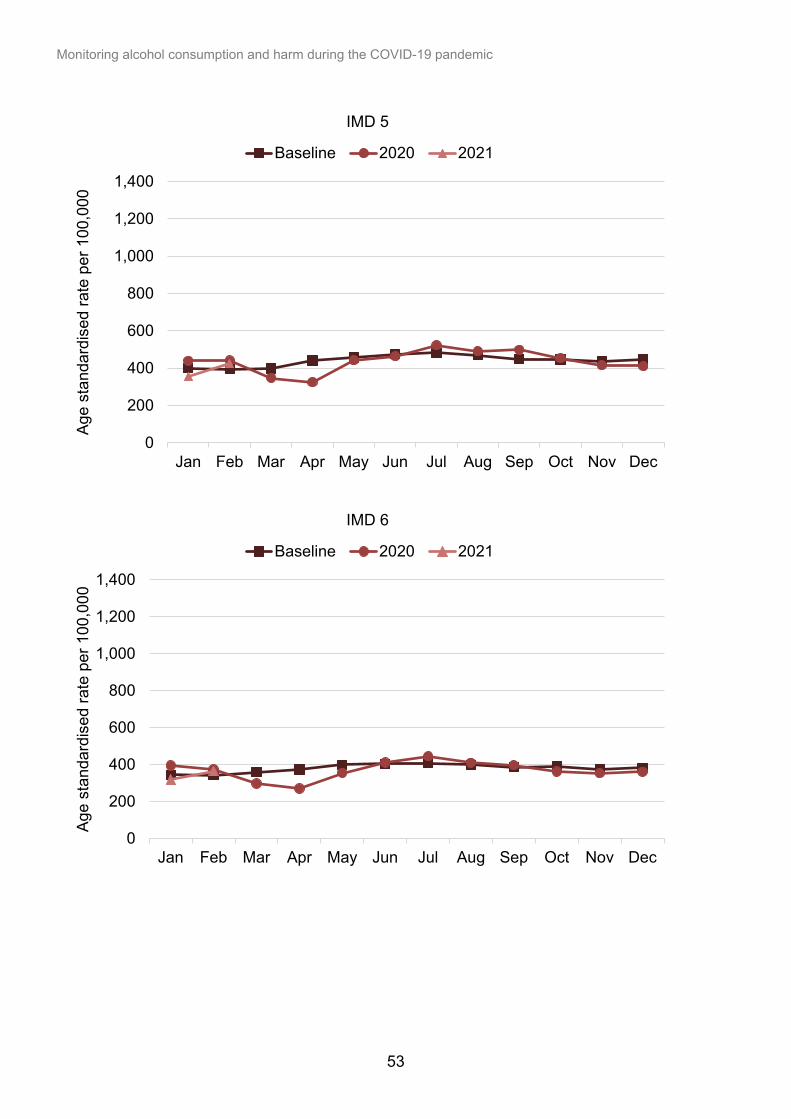
Monitoring alcohol consumption and harm during the COVID-19 pandemic
53
0
200
400
600
800
1,000
1,200
1,400
Jan Feb Mar Apr May Jun Jul Aug Sep Oct Nov Dec
Age
stan
dard
ised
rate
per
100
,000
IMD 5
Baseline 2020 2021
0
200
400
600
800
1,000
1,200
1,400
Jan Feb Mar Apr May Jun Jul Aug Sep Oct Nov Dec
Age
stan
dard
ised
rate
per
100
,000
IMD 6
Baseline 2020 2021
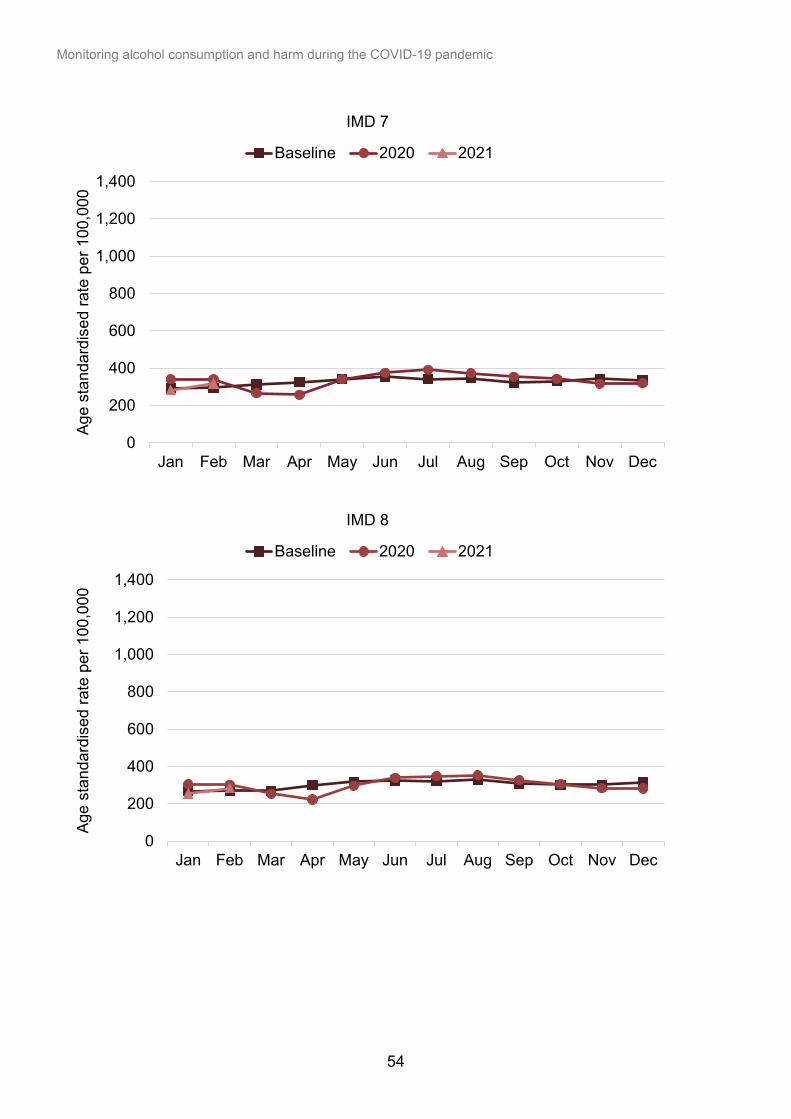
Monitoring alcohol consumption and harm during the COVID-19 pandemic
54
0
200
400
600
800
1,000
1,200
1,400
Jan Feb Mar Apr May Jun Jul Aug Sep Oct Nov Dec
Age
stan
dard
ised
rate
per
100
,000
IMD 7
Baseline 2020 2021
0
200
400
600
800
1,000
1,200
1,400
Jan Feb Mar Apr May Jun Jul Aug Sep Oct Nov Dec
Age
stan
dard
ised
rate
per
100
,000
IMD 8
Baseline 2020 2021
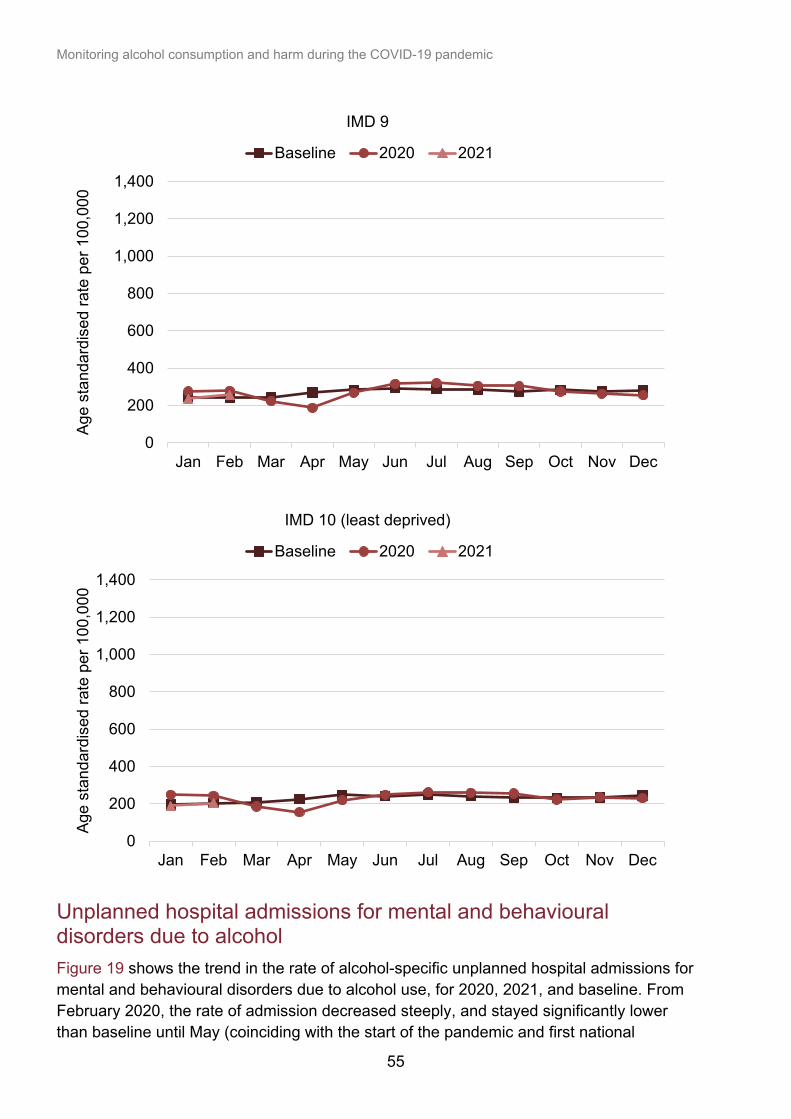
Monitoring alcohol consumption and harm during the COVID-19 pandemic
55
Unplanned hospital admissions for mental and behavioural disorders due to alcohol Figure 19 shows the trend in the rate of alcohol-specific unplanned hospital admissions for mental and behavioural disorders due to alcohol use, for 2020, 2021, and baseline. From February 2020, the rate of admission decreased steeply, and stayed significantly lower than baseline until May (coinciding with the start of the pandemic and first national
0
200
400
600
800
1,000
1,200
1,400
Jan Feb Mar Apr May Jun Jul Aug Sep Oct Nov Dec
Age
stan
dard
ised
rate
per
100
,000
IMD 9
Baseline 2020 2021
0
200
400
600
800
1,000
1,200
1,400
Jan Feb Mar Apr May Jun Jul Aug Sep Oct Nov Dec
Age
stan
dard
ised
rate
per
100
,000
IMD 10 (least deprived)
Baseline 2020 2021
Monitoring alcohol consumption and harm during the COVID-19 pandemic
56
lockdown). From May, admissions began to increase and were significantly higher than baseline between June and September. Mental and behavioural disorders make up the largest number of admissions. In 2020 (during the pandemic), there was a 3.4% reduction in the number of unplanned hospital admissions for mental and behavioural disorders due to alcohol use compared to 2019 (before the pandemic), from 219,643 to 212,168. In 2020, 35.2% of all admissions were in the most deprived quintile and 10.6% were in the least deprived quintile. Admissions for mental and behavioural disorders account for about 80% of total alcohol-specific admissions. So, they are the main factor contributing to the overall trend in alcohol-specific admissions.
Monitoring alcohol consumption and harm during the COVID-19 pandemic
57
Figure 19. Monthly trend in unplanned hospital admissions for mental and behavioural disorders due to alcohol
Unplanned hospital admissions for alcohol poisonings Figure 20 shows the trend in the rate of alcohol-specific unplanned hospital admissions for 2020, 2021, and baseline, for alcohol poisonings. The pattern we see is very similar to other alcohol-specific admissions, with a ‘lockdown effect’ followed by increases over the summer months, and subsequent decreases towards the end of 2020. By 2021, the rate of admissions for alcohol poisonings was significantly lower than baseline. Compared to 2019 (before the pandemic), in 2020 (during the pandemic) there was a 2% reduction in the number of unplanned admissions for alcohol poisonings. In 2020, 34.8% of admissions were in the most deprived quintile and 10.7% were in the least deprived quintile.
0
100
200
300
400
500
600
Jan Feb Mar Apr May Jun Jul Aug Sep Oct Nov Dec
Age
stan
dard
ised
rate
per
100
,000
Baseline 2020 2021
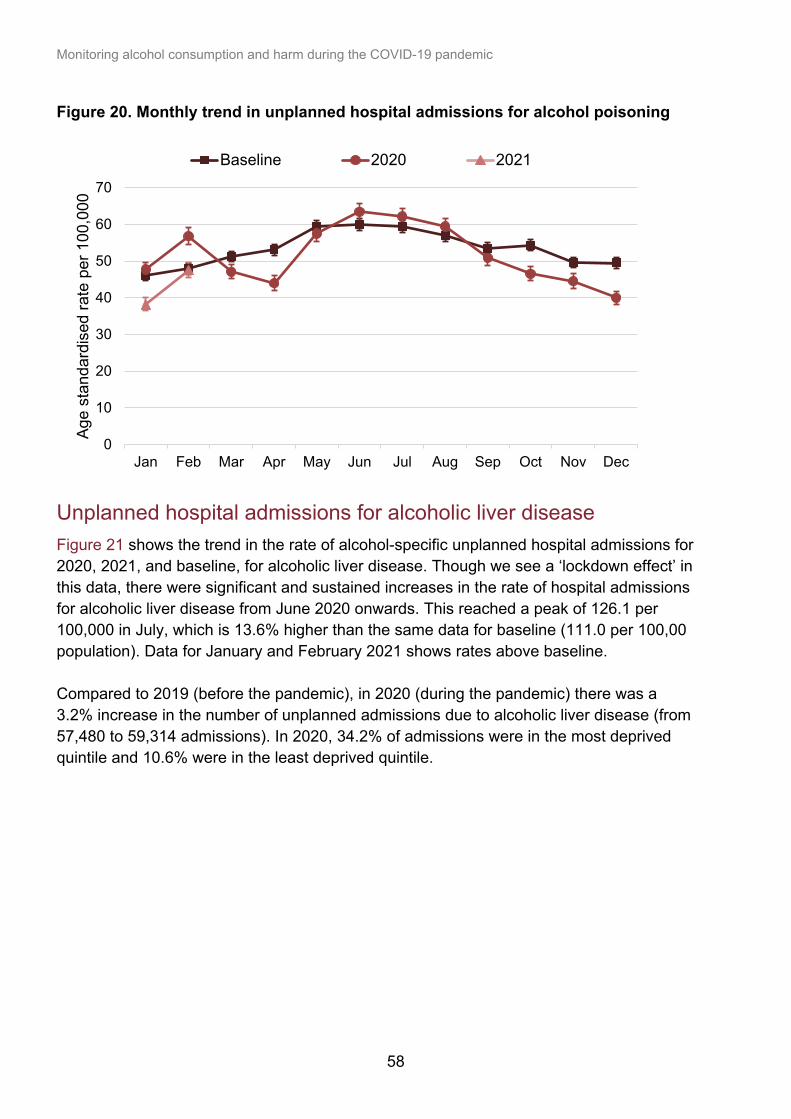
Monitoring alcohol consumption and harm during the COVID-19 pandemic
58
Figure 20. Monthly trend in unplanned hospital admissions for alcohol poisoning
Unplanned hospital admissions for alcoholic liver disease Figure 21 shows the trend in the rate of alcohol-specific unplanned hospital admissions for 2020, 2021, and baseline, for alcoholic liver disease. Though we see a ‘lockdown effect’ in this data, there were significant and sustained increases in the rate of hospital admissions for alcoholic liver disease from June 2020 onwards. This reached a peak of 126.1 per 100,000 in July, which is 13.6% higher than the same data for baseline (111.0 per 100,00 population). Data for January and February 2021 shows rates above baseline. Compared to 2019 (before the pandemic), in 2020 (during the pandemic) there was a 3.2% increase in the number of unplanned admissions due to alcoholic liver disease (from 57,480 to 59,314 admissions). In 2020, 34.2% of admissions were in the most deprived quintile and 10.6% were in the least deprived quintile.
0
10
20
30
40
50
60
70
Jan Feb Mar Apr May Jun Jul Aug Sep Oct Nov Dec
Age
stan
dard
ised
rate
per
100
,000
Baseline 2020 2021
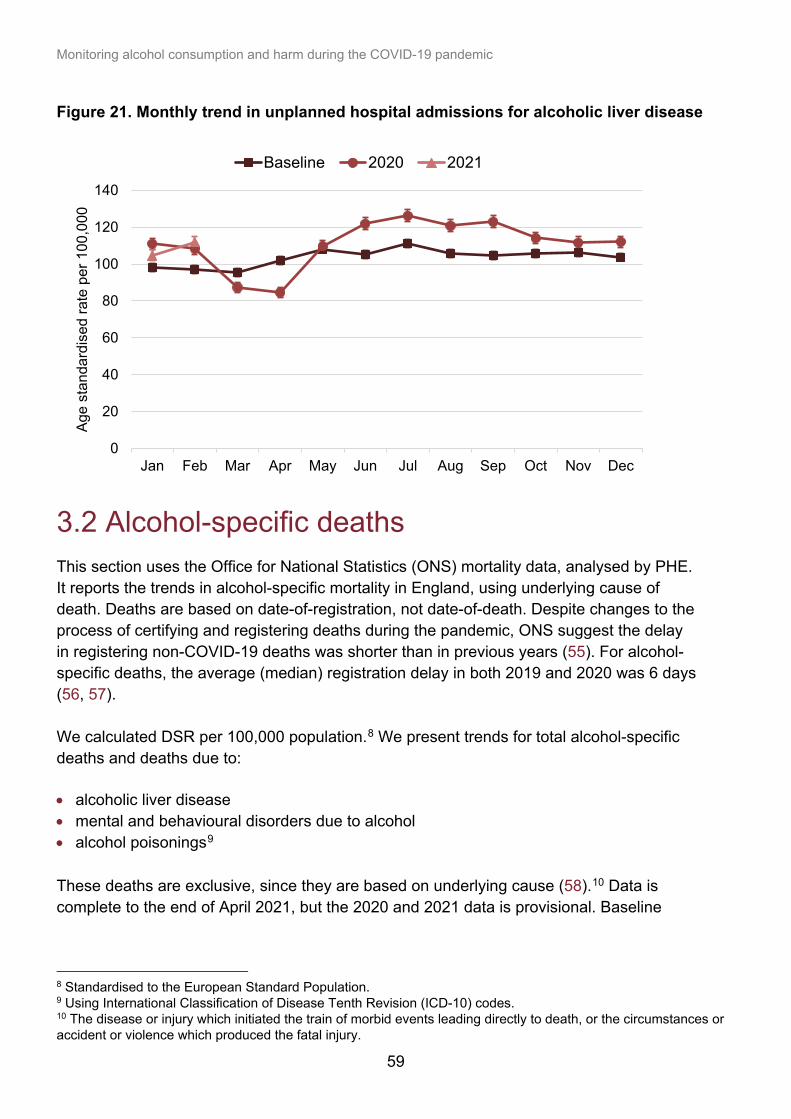
Monitoring alcohol consumption and harm during the COVID-19 pandemic
59
Figure 21. Monthly trend in unplanned hospital admissions for alcoholic liver disease
3.2 Alcohol-specific deaths This section uses the Office for National Statistics (ONS) mortality data, analysed by PHE. It reports the trends in alcohol-specific mortality in England, using underlying cause of death. Deaths are based on date-of-registration, not date-of-death. Despite changes to the process of certifying and registering deaths during the pandemic, ONS suggest the delay in registering non-COVID-19 deaths was shorter than in previous years (55). For alcohol-specific deaths, the average (median) registration delay in both 2019 and 2020 was 6 days (56, 57). We calculated DSR per 100,000 population.8 We present trends for total alcohol-specific deaths and deaths due to: • alcoholic liver disease • mental and behavioural disorders due to alcohol • alcohol poisonings9 These deaths are exclusive, since they are based on underlying cause (58).10 Data is complete to the end of April 2021, but the 2020 and 2021 data is provisional. Baseline
8 Standardised to the European Standard Population. 9 Using International Classification of Disease Tenth Revision (ICD-10) codes. 10 The disease or injury which initiated the train of morbid events leading directly to death, or the circumstances or accident or violence which produced the fatal injury.
0
20
40
60
80
100
120
140
Jan Feb Mar Apr May Jun Jul Aug Sep Oct Nov Dec
Age
stan
dard
ised
rate
per
100
,000
Baseline 2020 2021
Monitoring alcohol consumption and harm during the COVID-19 pandemic
60
rates combined 2018 and 2019 deaths and populations to create a weighted average for the 2 years. Total alcohol-specific deaths for all causes In 2020 (during the pandemic), there were 6,983 alcohol-specific deaths, an increase of 20.0% compared to 2019 (before the pandemic), when there were 5,819 deaths. Figure 22 shows the trend in the rate of alcohol-specific deaths for 2020, 2021 and baseline. From March 2020 (the first national lockdown), there was an upward trend in the rate of alcohol-specific deaths with significantly higher rates of death compared to baseline, which continued throughout the year and into 2021. In 2020, the rate of all alcohol-specific deaths peaked in December at 14.0 per 100,000, which is over double that seen in the same month for the baseline rate of 9.3 per 100,000 (+50.5%). This upward trend increased in the emerging 2021 data, reaching a peak of 15.0 per 100,000 in March 2021, a 42.9% increase compared to the same month in the baseline data (10.5 per 100,000 population). The increase in total alcohol-specific deaths was brought about by increases in alcoholic liver disease deaths, which we describe in the following section.
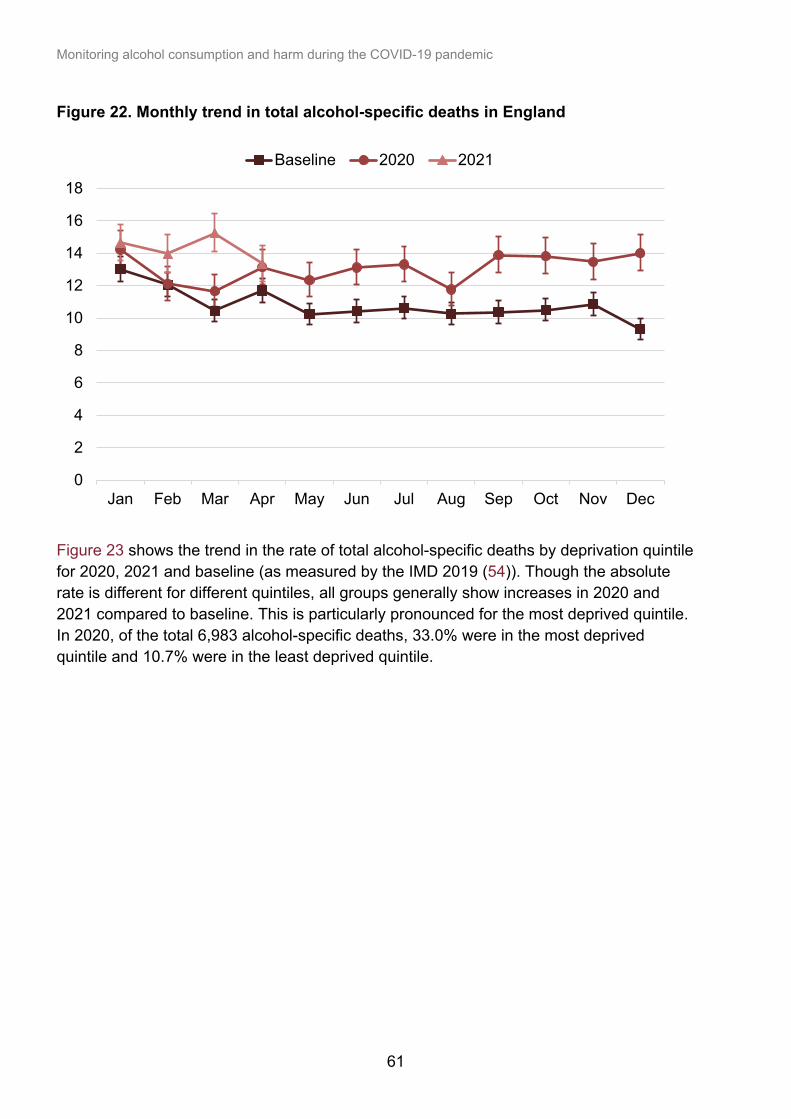
Monitoring alcohol consumption and harm during the COVID-19 pandemic
61
Figure 22. Monthly trend in total alcohol-specific deaths in England
Figure 23 shows the trend in the rate of total alcohol-specific deaths by deprivation quintile for 2020, 2021 and baseline (as measured by the IMD 2019 (54)). Though the absolute rate is different for different quintiles, all groups generally show increases in 2020 and 2021 compared to baseline. This is particularly pronounced for the most deprived quintile. In 2020, of the total 6,983 alcohol-specific deaths, 33.0% were in the most deprived quintile and 10.7% were in the least deprived quintile.
0
2
4
6
8
10
12
14
16
18
Jan Feb Mar Apr May Jun Jul Aug Sep Oct Nov Dec
Baseline 2020 2021
Monitoring alcohol consumption and harm during the COVID-19 pandemic
62
Figure 23. Monthly trend in total alcohol-specific deaths in England by deprivation quintile
0
5
10
15
20
25
30
35
Jan Feb Mar Apr May Jun Jul Aug Sep Oct Nov Dec
Age
stan
dard
ised
rate
per
100
,000
IMD 1 (most deprived)
Baseline 2020 2021
0
5
10
15
20
25
30
35
Jan Feb Mar Apr May Jun Jul Aug Sep Oct Nov Dec
Age
stan
dard
ised
rate
per
100
,000
IMD 2
Baseline 2020 2021
Monitoring alcohol consumption and harm during the COVID-19 pandemic
63
0
5
10
15
20
25
30
35
Jan Feb Mar Apr May Jun Jul Aug Sep Oct Nov Dec
Age
stan
dard
ised
rate
per
100
,000
IMD 3
Baseline 2020 2021
0
5
10
15
20
25
30
35
Jan Feb Mar Apr May Jun Jul Aug Sep Oct Nov Dec
Age
stan
dard
ised
rate
per
100
,000
IMD 4
Baseline 2020 2021
Monitoring alcohol consumption and harm during the COVID-19 pandemic
64
Figure 24 shows the trend in alcohol-specific deaths by region for 2020, 2021 and baseline. No consistent trend emerges around the time of the first national lockdown, though for most regions, alcohol-specific deaths were higher in 2020 and 2021 compared to baseline. The North East shows an increase in death rate to a greater extent than for other regions reaching a peak rate of 28.4 deaths per 100,000 population in July 2020. This is 79.7% higher than the baseline rate of 15.8 deaths per 100,000 population.
0
5
10
15
20
25
30
35
Jan Feb Mar Apr May Jun Jul Aug Sep Oct Nov Dec
Age
stan
dard
ised
rate
per
100
,000
IMD 5 (least deprived)
Baseline 2020 2021
Monitoring alcohol consumption and harm during the COVID-19 pandemic
65
Figure 24: Monthly trend in total alcohol-specific deaths in England by region
0
5
10
15
20
25
30
Jan Feb Mar Apr May Jun Jul Aug Sep Oct Nov Dec
Age
stan
dard
ised
rate
per
100
,000
North EastBaseline 2020 2021
0
5
10
15
20
25
30
Jan Feb Mar Apr May Jun Jul Aug Sep Oct Nov Dec
stan
dard
ised
rate
per
100
,000
North West
Baseline 2020 2021
Monitoring alcohol consumption and harm during the COVID-19 pandemic
66
0
5
10
15
20
25
30
Jan Feb Mar Apr May Jun Jul Aug Sep Oct Nov Dec
Age
stan
dard
ised
rate
per
100
,000
Yorkshire and the HumberBaseline 2020 2021
0
5
10
15
20
25
30
Jan Feb Mar Apr May Jun Jul Aug Sep Oct Nov Dec
Age
stan
dard
ised
rate
per
100
,000
East MidlandsBaseline 2020 2021
Monitoring alcohol consumption and harm during the COVID-19 pandemic
67
0
5
10
15
20
25
30
Jan Feb Mar Apr May Jun Jul Aug Sep Oct Nov Dec
Age
stan
dard
ised
rate
per
100
,000
West MidlandsBaseline 2020 2021
0
5
10
15
20
25
30
Jan Feb Mar Apr May Jun Jul Aug Sep Oct Nov Dec
Age
stan
dard
ised
rate
per
100
,000
East of EnglandBaseline 2020 2021
Monitoring alcohol consumption and harm during the COVID-19 pandemic
68
0
5
10
15
20
25
30
Jan Feb Mar Apr May Jun Jul Aug Sep Oct Nov Dec
Age
stan
dard
ised
rate
per
100
,000
LondonBaseline 2020 2021
0
5
10
15
20
25
30
Jan Feb Mar Apr May Jun Jul Aug Sep Oct Nov Dec
Age
stan
dard
ised
rate
per
100
,000
South EastBaseline 2020 2021
Monitoring alcohol consumption and harm during the COVID-19 pandemic
69
Total alcoholic liver disease deaths Overall, in 2020, deaths from alcoholic liver disease accounted for 80.3% of total alcohol-specific deaths. In 2020 (during the pandemic), there were 5,608 deaths from alcoholic liver disease, a 20.8% increase from the 4,643 deaths in 2019 (before the pandemic). In 2020, 32.8% were in the most deprived quintile and 10.9% were in the least deprived quintile.
There has been a rapid acceleration in deaths from alcoholic liver disease during the year of the pandemic, as the increase in alcoholic liver deaths between 2018 and 2019 was just 2.9%. Liver mortality rates in England increased 43% between 2001 and 2019, to the extent that liver disease is now the second leading disease causing premature death among people of working age.
Figure 25 shows the trend in alcohol-related liver disease deaths for 2020, 2021 and baseline. Throughout 2020, alcoholic liver mortality increased steeply, and from July 2020 into 2021, was significantly higher than baseline. In 2020, rates of alcoholic liver disease death peaked in December, and were 58.1% higher than the corresponding baseline month (11.7 per 100,000 population compared to 7.4) which was the greatest proportional difference across 2020 and 2021 data compared to monthly baselines.
Although alcohol-related cirrhosis may take a decade or more to develop, mortality often occurs from acute-on-chronic liver disease due to recent alcohol intake. As a result, liver mortality is a relatively rapid indicator of changes in alcohol consumption that are
0
5
10
15
20
25
30
Jan Feb Mar Apr May Jun Jul Aug Sep Oct Nov Dec
Age
stan
dard
ised
rate
per
100
,000
South WestBaseline 2020 2021
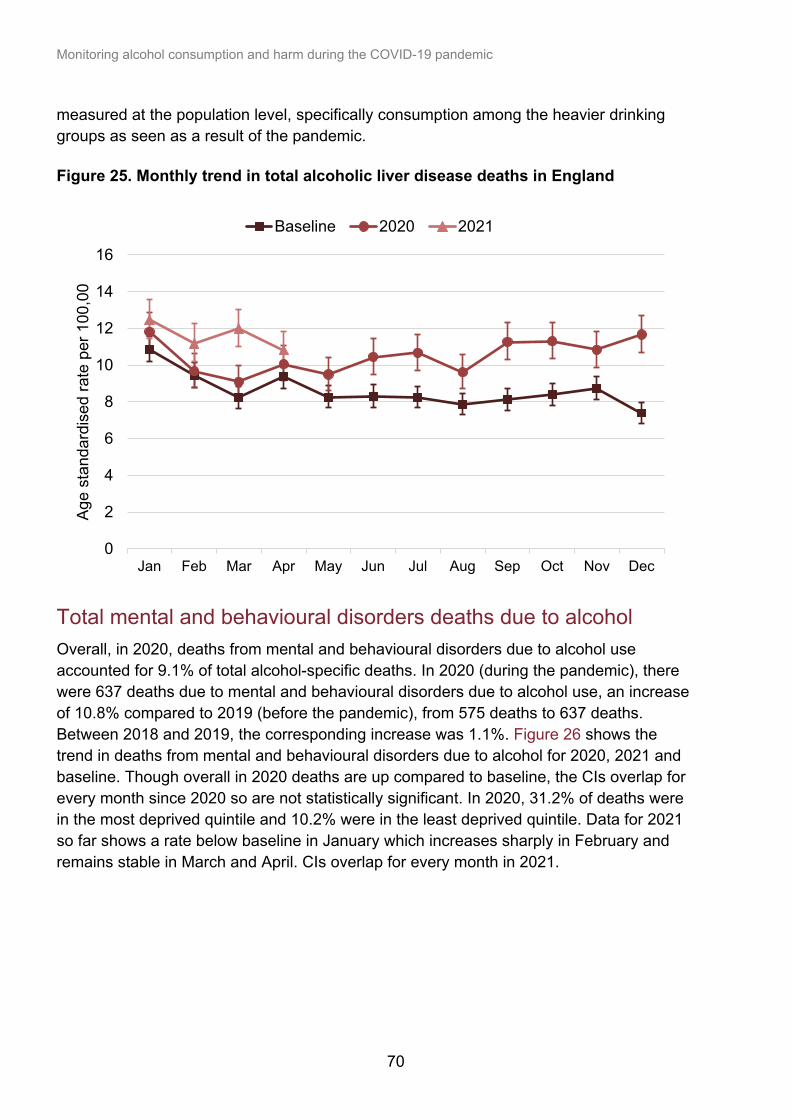
Monitoring alcohol consumption and harm during the COVID-19 pandemic
70
measured at the population level, specifically consumption among the heavier drinking groups as seen as a result of the pandemic.
Figure 25. Monthly trend in total alcoholic liver disease deaths in England
Total mental and behavioural disorders deaths due to alcohol Overall, in 2020, deaths from mental and behavioural disorders due to alcohol use accounted for 9.1% of total alcohol-specific deaths. In 2020 (during the pandemic), there were 637 deaths due to mental and behavioural disorders due to alcohol use, an increase of 10.8% compared to 2019 (before the pandemic), from 575 deaths to 637 deaths. Between 2018 and 2019, the corresponding increase was 1.1%. Figure 26 shows the trend in deaths from mental and behavioural disorders due to alcohol for 2020, 2021 and baseline. Though overall in 2020 deaths are up compared to baseline, the CIs overlap for every month since 2020 so are not statistically significant. In 2020, 31.2% of deaths were in the most deprived quintile and 10.2% were in the least deprived quintile. Data for 2021 so far shows a rate below baseline in January which increases sharply in February and remains stable in March and April. CIs overlap for every month in 2021.
0
2
4
6
8
10
12
14
16
Jan Feb Mar Apr May Jun Jul Aug Sep Oct Nov Dec
Age
stan
dard
ised
rate
per
100
,00
Baseline 2020 2021
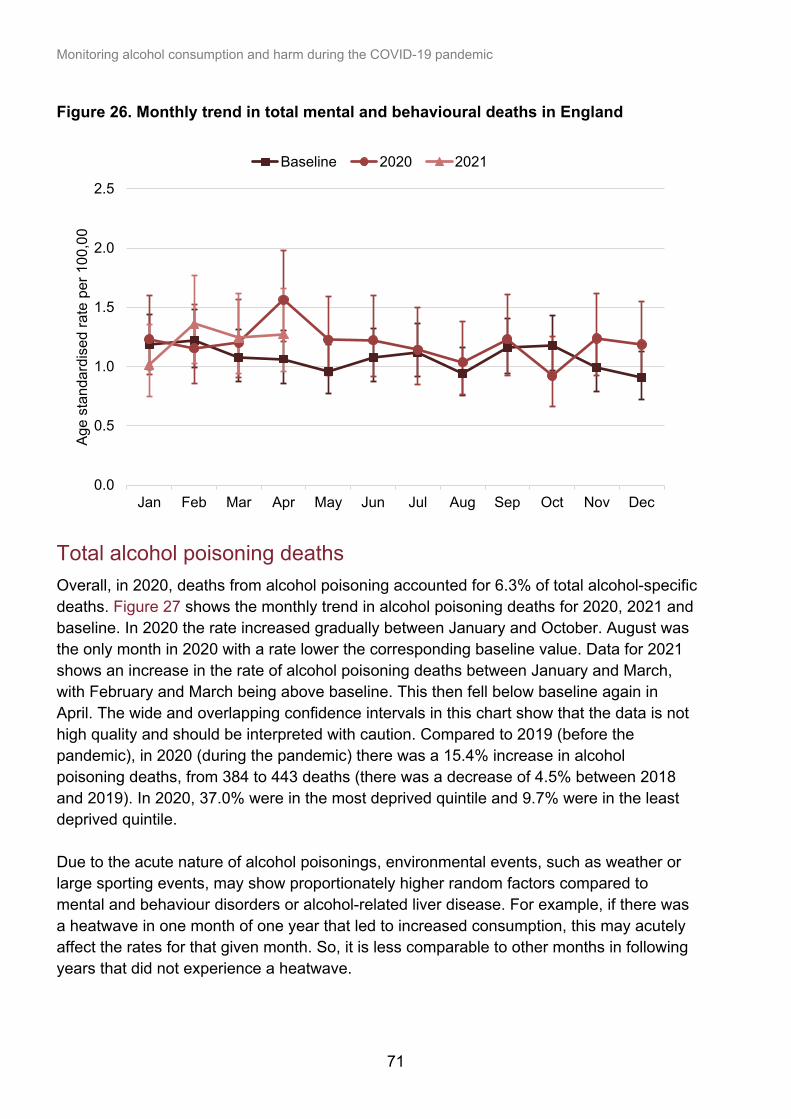
Monitoring alcohol consumption and harm during the COVID-19 pandemic
71
Figure 26. Monthly trend in total mental and behavioural deaths in England
Total alcohol poisoning deaths Overall, in 2020, deaths from alcohol poisoning accounted for 6.3% of total alcohol-specific deaths. Figure 27 shows the monthly trend in alcohol poisoning deaths for 2020, 2021 and baseline. In 2020 the rate increased gradually between January and October. August was the only month in 2020 with a rate lower the corresponding baseline value. Data for 2021 shows an increase in the rate of alcohol poisoning deaths between January and March, with February and March being above baseline. This then fell below baseline again in April. The wide and overlapping confidence intervals in this chart show that the data is not high quality and should be interpreted with caution. Compared to 2019 (before the pandemic), in 2020 (during the pandemic) there was a 15.4% increase in alcohol poisoning deaths, from 384 to 443 deaths (there was a decrease of 4.5% between 2018 and 2019). In 2020, 37.0% were in the most deprived quintile and 9.7% were in the least deprived quintile. Due to the acute nature of alcohol poisonings, environmental events, such as weather or large sporting events, may show proportionately higher random factors compared to mental and behaviour disorders or alcohol-related liver disease. For example, if there was a heatwave in one month of one year that led to increased consumption, this may acutely affect the rates for that given month. So, it is less comparable to other months in following years that did not experience a heatwave.
0.0
0.5
1.0
1.5
2.0
2.5
Jan Feb Mar Apr May Jun Jul Aug Sep Oct Nov Dec
Age
stan
dard
ised
rate
per
100
,00
Baseline 2020 2021
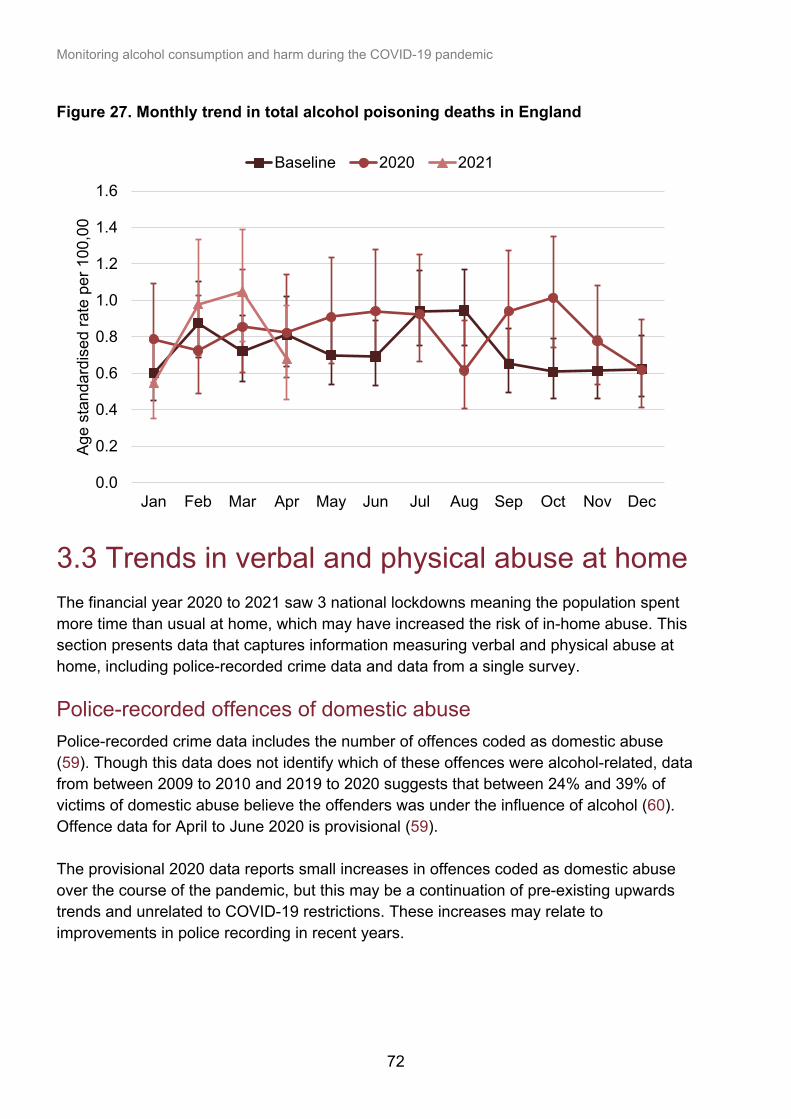
Monitoring alcohol consumption and harm during the COVID-19 pandemic
72
Figure 27. Monthly trend in total alcohol poisoning deaths in England
3.3 Trends in verbal and physical abuse at home The financial year 2020 to 2021 saw 3 national lockdowns meaning the population spent more time than usual at home, which may have increased the risk of in-home abuse. This section presents data that captures information measuring verbal and physical abuse at home, including police-recorded crime data and data from a single survey. Police-recorded offences of domestic abuse Police-recorded crime data includes the number of offences coded as domestic abuse (59). Though this data does not identify which of these offences were alcohol-related, data from between 2009 to 2010 and 2019 to 2020 suggests that between 24% and 39% of victims of domestic abuse believe the offenders was under the influence of alcohol (60). Offence data for April to June 2020 is provisional (59). The provisional 2020 data reports small increases in offences coded as domestic abuse over the course of the pandemic, but this may be a continuation of pre-existing upwards trends and unrelated to COVID-19 restrictions. These increases may relate to improvements in police recording in recent years.
0.0
0.2
0.4
0.6
0.8
1.0
1.2
1.4
1.6
Jan Feb Mar Apr May Jun Jul Aug Sep Oct Nov Dec
Age
stan
dard
ised
rate
per
100
,00
Baseline 2020 2021
Monitoring alcohol consumption and harm during the COVID-19 pandemic
73
Surveys measuring domestic abuse and violence One survey by Adfam sampled 241 respondents coping with a family or friend’s alcohol, drug or gambling problem between 15 April and 4 May 2020 (during the first national lockdown) (61). Over a quarter of respondents (28%) reported that their loved one had been more verbally abusive compared to normal, and 4% reported that they had been more physically abusive. The findings were not presented separately for those reporting a loved one’s alcohol consumption, drug use or gambling. Child and parental alcohol use This section includes data from Childline and the National Association for Children of Alcoholics (NACOA) (62, 63). These charities have helplines that children and young people can access if they are concerned about an adult’s drinking. This section also includes helpline data from the National Society for the Prevention of Cruelty to Children (NSPCC), which is for adults to call if they are concerned about a child (64). This includes parental or adult alcohol or substance misuse. Childline data monitors the number of counselling sessions offered to children who are concerned with their parent’s alcohol or substance misuse. In a report from March 2021, average 30-day figures were reported for between 6 January and 22 March 2020 to establish a pre-lockdown comparison period of 81 sessions (63). It’s worth noting that the first national lockdown was implemented on 23 March 2020, and this week is not captured in the reported data. In June 2021, monthly figures from April 2020 to March 2021 were also reported and can be compared against the pre-lockdown period (65). Throughout 2020, the number of counselling sessions provided to children who were concerned about their parent’s drinking or drug use remained fairly stable, ranging from 53 sessions per month in November to 87 sessions per month in May. However, complete data for 2020 to 2021 (during the pandemic) shows a 30% reduction in sessions for parental alcohol or substance use compared to 2019 to 2020 (before the pandemic). Sessions for alcohol and substance use accounted for less than 1% of all sessions provided by Childline throughout the period. The NACOA helpline saw increases in calls from children who were concerned about a parent’s drinking in the year of the pandemic (2020) compared to the previous year (2019) (62). For example, the number of calls in April 2020 (during the first national lockdown) represented an increase of 17% compared to the number in April 2019 (715 and 609 calls respectively). The NSPCC helpline also saw an increase in the number of calls from adults who were concerned about a child with a parent or adult suspected of alcohol or substance misuse. A report from March 2021, reported a 30-day average of 709 calls for the period of 6 January to 22 March 2020 (before the lockdown) (64). In June 2021, monthly figures for April 2020 to March 2021 were also reported (66). The monthly average for these 2 months during 2020 was 1,175 calls, an increase of 66% compared to the pre-lockdown
Monitoring alcohol consumption and harm during the COVID-19 pandemic
74
2020 average of 709. As with the reported contacts for Childline, data from 23 March 2020 (start of the first national lockdown) to the end of March 2020 is not captured in the reported data. Complete data for 2020 to 2021 (during the pandemic) shows a 45% increase in calls for concerns over a parent or other adult's alcohol or substance misuse compared to 2019 to 2020 (before the pandemic).
Monitoring alcohol consumption and harm during the COVID-19 pandemic
75
4. Conclusion The aim of this report was to provide an overview of trends in alcohol consumption and harm since the start of the COVID-19 pandemic in 2020 in England. We used data monitoring alcohol consumption from 3 main sources: 1. Alcohol duty receipts. 2. Alcohol off-trade sales data. 3. Surveys that measured self-reported alcohol consumption. In 2020 to 2021, duty-paid volume alcohol decreased by 1.2% compared to 2019 to 2020, despite the approximately 31-week closure of the on-trade during national lockdowns through the financial year. As expected, given the closure of on-trade premises throughout 2020, there has been large growth in off-trade volume sales that was sustained throughout the year of the pandemic. People who were heavy buyers of alcohol before the pandemic are mostly responsible for the increases in off-trade purchasing. Support for this finding also comes from surveys measuring self-reported alcohol consumption. Most respondents to these surveys reported no change in their drinking during the lockdowns. However, the heaviest drinking respondents appear to be reporting higher volumes and frequencies of alcohol consumption compared to before the pandemic. This may present a risk that alcohol harm persists or worsens among people already at risk of experiencing harm. Alcohol-specific unplanned hospital admissions since the start of the pandemic have decreased compared to a pre-pandemic baseline. This is similar to the pattern seen for all unplanned admissions irrespective of cause. Admissions for mental and behavioural disorders due to alcohol use and alcohol poisonings both saw decreases. Unplanned admissions for alcoholic liver disease were the only alcohol-specific cause to see a significant and sustained increase. For much of the pandemic, alcohol-specific deaths were significantly higher than for the baseline, pre-pandemic years. The increase in alcohol-specific deaths is consistent and increasing throughout the year, independent of the rise, fall, rise in COVID-19-related deaths. The picture for deaths from mental and behavioural disorders due to alcohol, and acute alcohol poisoning is mixed, with no clear differences emerging for 2020 compared with previous years. Mortality from alcohol-related liver disease shows an entirely different trend. This report shows that it is mainly liver deaths that are responsible for the significant increase. This change is consistent with increases in alcohol consumption mainly affecting the heaviest drinkers in the most deprived areas. The case for action for liver disease is even stronger as a result.
Monitoring alcohol consumption and harm during the COVID-19 pandemic
76
In the short-term and medium-term, we will continue to monitor alcohol consumption and harm to understand changes and develop appropriate policy responses. A greater understanding of changes in consumption and harm by different groups is vital to understand whether pandemic-related changes have made existing health inequalities worse. The pandemic may also influence alcohol consumption in ways that have not yet been considered. These include employment (after high levels of furlough), redundancy, economic recession and insecurity. Historically, alcohol consumption falls during a recession, but the data in this report supports a polarisation between people drinking more and those drinking less. Grief and bereavement experienced by friends and family who have lost a loved one to COVID-19 are also important factors to consider. Finally, the impact of the physical and social restrictions on mental health is not well understood, and this could have an effect on alcohol consumption. Tackling alcohol consumption and harm must be an essential part of the UK government’s COVID-19 recovery plan, given that tackling geographic health disparities are part of to the government’s Build Back Better plans. Alcohol harm is a major risk factor driving these differences. Given the stark trends in higher-than-expected liver deaths, long-term and sustained action to prevent liver disease remains a priority for public health. Before the pandemic, we were already seeing increased alcohol-related hospital admissions and deaths. The pandemic seems to have accelerated these trends.
Monitoring alcohol consumption and harm during the COVID-19 pandemic
77
5. References 1. World Health Organization. 'WHO Coronavirus (COVID-19) Dashboard'. 2021 (accessed on 8 July 2021) 2. HM Government. 'Coronavirus (COVID-19) in the UK: Cases 2021' (accessed on 8 July 2021) 3. HM Government. 'Coronavirus (COVID-19) in the UK: Deaths 2021' (accessed on 8 July 2021) 4. World Health Organization. 'Estimating mortality from COVID-19'. 4 August 2020 (accessed on 20 January 2021) 5. Nadkarni A, Kapoor A, Pathare S. 'COVID-19 and forced alcohol abstinence in India: The dilemmas around ethics and rights'. International Journal of Law and Psychiatry: 2020, volume 71, article 101579 6. Rehm J, Kilian C, Ferreira-Borges C, Jernigan D, Monteiro M, Parry CDH, and others. 'Alcohol use in times of the COVID-19: Implications for monitoring and policy'. Drug and Alcohol Review. 2020: volume 39, issue 4, pages 301-304 7. Antonova V. «Bojaryshnik»: kak izmenilis' alkogol'nye predpochtenija rossijan na samoizoljacii. ['They bought all the “Hawthorn”: how the alcoholic preferences of Russians on self‐isolation changed']. 2020 (accessed on 21 January 2021) 8. Neufeld M, Lachenmeier DW, Ferreira‐Borges C, Rehm J. 'Is Alcohol an “Essential Good” During COVID‐19? Yes, but Only as a Disinfectant!' Alcoholism: Clinical Experimental Research. 2020: volume 44, issue 9, pages 1,906-1,909 9. Hamilton I. 'Is alcohol really “essential” during covid-19?' 2020 (accessed on 21 January 2021) 10. HM Government. 'The Health Protection (Coronavirus, Restrictions) (No. 2) (England) Regulations 2020'. 2020 (accessed on 2 June 2021) 11. Harpers. 'Trade slams new lockdown ban on takeaway drink sales'. 2020 (accessed on 12 April 2021) 12. Department of Health and Social Care. 'COVID-19 contain framework: A guide for local decision-makers'. 2020 (accessed on 26 January 2021)
Monitoring alcohol consumption and harm during the COVID-19 pandemic
78
13. HM Government. 'Prime Minister announces new local COVID Alert Levels' [press release 12 October 2020] 2020 (accessed on 21 June 2021) 14. HM Government. 'The Health Protection (Coronavirus, Restrictions) (All Tiers and Obligations of Undertakings) (England) (Amendment) Regulations 2020'. 2020 (accessed on 21 June 2021) 15. HM Government. 'The Health Protection (Coronavirus, Restrictions) (No. 3) and (All Tiers) (England) (Amendment) Regulations 2021'. 2021 (accessed on 2 June 2021) 16. NHS Digital. 'Health Survey for England - Health, social care and lifestyles 2020' [updated 18 November 2020] (accessed on 21 June 2021) 17. Public Health England. Wider Impacts of COVID-19 on Health (WICH) monitoring tool (accessed on 21 June 2021) 18. Goddard E. 'Estimating alcohol consumption from survey data: updated method of converting volumes to units.' Office for National Statistics Cardiff. 2007 (accessed on 21 June 2021) 19. Bellis MA, Hughes K, Jones L, Morleo M, Nicholls J, McCoy E and others. 'Holidays, celebrations, and commiserations: measuring drinking during feasting and fasting to improve national and individual estimates of alcohol consumption'. BMC medicine. 2015: volume 13, issue 1, page 113 20. Davis CG, Thake J, Vilhena N. 'Social desirability biases in self-reported alcohol consumption and harms'. Addictive behaviors. 2010: volume 35, issue 4, pages 302-311 21. Livingston M, Callinan S. 'Underreporting in alcohol surveys: Whose drinking is underestimated?' Journal of Studies on Alcohol and Drugs. 2015: volume 76, issue 1, pages 158-164 22. Public Health England. 'The public health burden of alcohol and the effectiveness and cost-effectiveness of alcohol control policies: an evidence review'. 2016 (accessed on 22 July 2020) 23. HM Revenue and Customs. 'Alcohol Bulletin commentary (August to October 2020)'. 2020 (accessed on 1 February 2021) 24. HM Revenue and Customs. 'HMRC tax receipts and National Insurance contributions for the UK (Monthly Bulletin)'. 2021 (accessed on 17 June 2021) 25. Kantar UK. 'Kantar Worldpanel Alcohol Sales Data' accessed by PHE. 2020 (accessed on 5 February 2021)
Monitoring alcohol consumption and harm during the COVID-19 pandemic
79
26. HM Revenue and Customs. 'Alcohol Bulletin'. 2021 (accessed on 28 May 2021) 27. Public Health England. 'Review of typical ABV levels in beer, cider and wine purchased for the “in home” market'. 2020 (accessed on 1 February 2021) 28. Public Health Scotland. 'MESAS Monitoring report 2020'. 2020 (accessed on 2 February 2021) 29. HM Revenue and Customs. 'Beer duty return due to spoiled alcohol (EX46)'. 2021 (accessed on 22 April 2021) 30. YouGov. 'Daily Question | 24 March 2020 | YouGov'. 2020 (accessed on 4 February 2021) 31. YouGov. 'Daily Question | 17 April 2020 | YouGov 2020' (accessed on 26 April 2021) 32. YouGov. 'Daily Question | 10 June 2020 | YouGov 2020' (accessed on 21 June 2021) 33. The Policy Institute. 'Life under lockdown: Coronavirus in the UK'. King's College London, Ipsos MORI; 2020 (accessed on 6 July 2020) 34. The Policy Institute. 'Getting used to life under lockdown? Coronavirus in the UK'. King's College London. 2020 (accessed on 3 June 2020) 35. Alcohol Change UK. 'Drinking during lockdown - Opinium survey data tables'. 2020 (accessed on 12 May 2020) 36. Alcohol Change UK. 'Drinking in the UK during lockdown and beyond'. 2020 (accessed on 21 June 2021) 37. Portman Group. 'YouGov/Portman Group survey on alcohol consumption during the COVID-19 lockdown'. 2020 (accessed on 17 June 2020) 38. Portman Group. 'YouGov/Portman Group survey on UK alcohol consumption post the COVID-19 lockdown'. 2020 (accessed on 24 November 2020) 39. Drinkaware. 'Monitor 2020'. 2020 (accessed on 26 April 2021) 40. YouGov. 'Alcohol consumption among Brits'. 2021 (accessed on 26 April 2021) 41. Club Soda. 'How have the drinking habits of Club Soda members changed in lockdown?' June 2020. 2020 (accessed on 6 July 2020) 42. Drinkaware. 'Employers urged to support staff well being as research reveals furloughed workers drinking more on lockdown’. [press release] (accessed on 15 May 2020)
Monitoring alcohol consumption and harm during the COVID-19 pandemic
80
43. Centre for Ageing Better, Ipsos MORI. 'The experience of people approaching later life in lockdown: The impact of COVID-19 on 50 to 70 year olds in England'. July 2020 (accessed on 29 December 2020) 44. Winstock A, Davies EL, Gilchrist G, Zhuparris A, Ferris JA, Maier LJ and others. 'GDS Special Edition on COVID-19 Global Interim Report'. 2020 2 June 2020 (accessed on 10 June 2020) 45. IPSOS Mori. 'The implications of COVID-19 on our diet and health'. 2021 (accessed on 27 April 2021) 46. 'We Are With You: Drink Wise Age Well Survey of those aged 50 and over in the United Kingdom'. Personal communication. 2020 (accessed 23 November 2020) 47. CGA. 'Life in Lockdown - Looking Ahead’ (free sign up to download report). 29 March 2020 (accessed on 6 July 2020) 48. CGA. 'The Lockdown Consumer’ (free sign up to download report). 1 May 2020 (accessed on 17 June 2020) 49. University College London. 'UCL COVID-19 Social Study (Week 14)’. In-progress. 2020 (accessed on 30 June 2020) 50. Burton R, Henn C, Lavoie D, O'Connor R, Perkins C, Sweeney K, and others. 'A rapid evidence review of the effectiveness and cost-effectiveness of alcohol control policies: an English perspective'. The Lancet. 2017, volume 389, issue 10,078, pages 1,558-1,580 51. Public Health England. 'Consultation on proposed changes to the calculation of alcohol-related mortality and hospital admissions'. 2021 (accessed on 26 April 2021) 52. Dobson AJ, Kuulasmaa K, Eberle E, Scherer J. 'Confidence intervals for weighted sums of Poisson parameters'. Statistics in medicine. 1991 volume 10, issue 3, pages 457-462 53. British Medical Association. 'The hidden impact of COVID-19 on patient care in the NHS in England'. 2020 (accessed on 6 February 2021) 54. Office for National Statistics. 'English indices of deprivation 2019’. 2019 (accessed on 7 February 2020) 55. Office for National Statistics. 'Quality of mortality data during the coronavirus pandemic, England and Wales: 2020'. 2020 (accessed on 27 May 2021)
Monitoring alcohol consumption and harm during the COVID-19 pandemic
81
56. Office for National Statistics. 'Quarterly alcohol-specific deaths in England and Wales: 2001 to 2019 registrations and Quarter 1 (January to March) to Quarter 4 (October to December) 2020 provisional registrations'. 2021 (accessed on 21 June 2021) 57. Office for National Statistics. 'Alcohol-specific deaths in the UK: registered in 2019'. 2021 (accessed 27 May 2021) 58. Office for National Statistics. 'Alcohol-specific deaths in the UK QMI'. 2018 (accessed on 27 May 2021) 59. Office for National Statistics. 'Domestic abuse in England and Wales overview: November 2020'. 25 November 2020 (accessed on 15 December 2020) 60. Office for National Statistics. 'Nature of crime: violence'. 2020 (accessed on 21 June 2021) 61. Adfam. 'Families in lockdown: The effects of the COVID-19 lockdown on the family and friends of someone with an alcohol, drug or gambling problem'. 2020. (accessed on 30 June 2020) 62. The National Association for Children of Alcoholics. 'COVID so far, lockdown and the lost children'. 2020 (accessed on 21 May 2021) 63. National Society for the Prevention of Cruelty to Children. 'Childline supporting children and young people during the coronavirus pandemic: April to December 2020'. Personal communication. 2021 (accessed on 29 January 2021) 64. National Society for the Prevention of Cruelty to Children. 'Contacts to the NSPCC helpline during the coronavirus pandemic: April to December 2020'. Personal communication. 2021 (accessed on 29 January 2021) 65. National Society for the Prevention of Cruelty to Children. ‘Childline supporting children and young people during the coronavirus pandemic: April 2020 to March 2021’. Personal communication. 2021 (accessed on 25 June 2021) 66. National Society for the Prevention of Cruelty to Children. ‘Contacts to the NSPCC helpline during the coronavirus pandemic: April 2020 to March 2021’. Personal communication. 2021 (accessed on 25 June 2021)
82
Published: July 2021 PHE gateway number: GOV-8955
Website: www.gov.uk/phe Twitter: @PHE_uk Facebook: www.facebook.com/PublicHealthEngland © Crown copyright 2021
Prepared by: Dr Robyn Burton, Casey Sharpe, Chioma Amasiatu, Martin White, Mark Cook, Clare Griffiths, Meetal Khetani, Zoe Clarke, Clive Henn and Professor Nick Sheron.