modeling cpu energy consumption for energy efficient
TRANSCRIPT

Modeling CPU Energy Consumption for Energy Efficient Scheduling
Abhishek Jaiantilal, Yifei Jiang, Shivakant Mishra
University of Colorado - Boulder
GCM '10 Proceedings of the 1st Workshop on Green Computing © 2010 ACM
Outline
• Introduction
• Energy Model Overview
• Power Consumed and CPU Cycles
• Experimental Results
• Conclusions
2

Introduction (1/2)
• The processor is the component that consumes the
most power.
3

Introduction (2/2)
• Dynamic Voltage and Frequency Scaling (DVFS) is used
in CPU, referring as P-states.
• Per Core Power Gating (PCPG), or Dynamic Core Gating
(DCG) is a hardware feature allowing the cores in a multi-
core CPU to shut themselves off. It is also called C-states.
– C0 - Active state
– C1 - Inactive state with the core not running on these idle cycles
– C3 - Inactive state with the cache saved
– C6 - All the PLL turned off
4
Energy Model Overview (1/3)
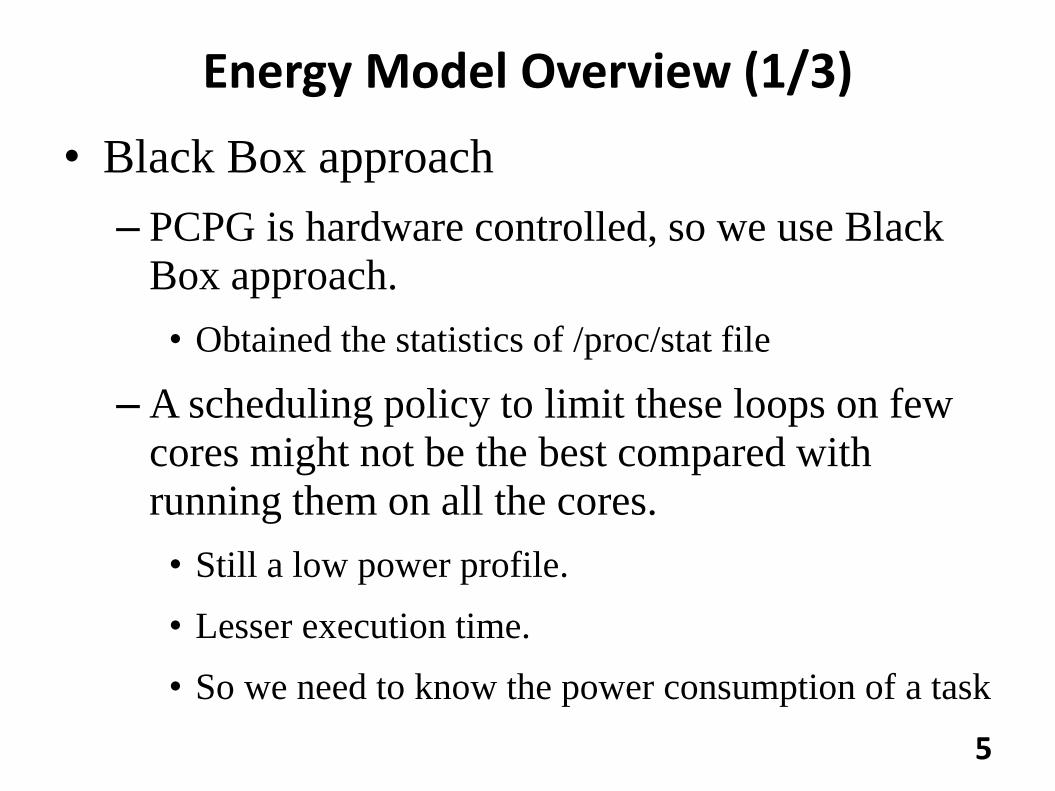
• Black Box approach
– PCPG is hardware controlled, so we use Black
Box approach.
• Obtained the statistics of /proc/stat file
– A scheduling policy to limit these loops on few
cores might not be the best compared with
running them on all the cores.
• Still a low power profile.
• Lesser execution time.
• So we need to know the power consumption of a task
5

Energy Model Overview (2/3)
6
• Even though the processes are running at 100% load, the
power consumed is different for different tasks.
• Because some of these tasks are float-cycle intensive and
others are integer or memory cycle intensive.

Energy Model Overview (3/3)
7
• Modified Black Box approach
– If we know how much power a task is consuming, then
we can fit a schedule that allowing for a shorter
execution time and a lower energy consumption.
– We need the “training data” to choose the best task
schedule depending on the tradeoff between the power
consumption and the execution time.
• Disadvantages
– Need training data from all the possible tasks first
– Computers should have the same configuration

Power Consumed and CPU Cycles (1/7)
• System power consumption
𝑃(𝑆𝑦𝑠𝑡𝑒𝑚)∝ 𝑓(𝑃 𝐶𝑃𝑈 + 𝑃 𝑀𝑒𝑚𝑜𝑟𝑦 + 𝑃 𝐹𝑎𝑛𝑠+ 𝑃 𝐻𝐷𝐷 + 𝑃 𝑁𝑜𝑟𝑡ℎ𝑏𝑟𝑖𝑑𝑔𝑒+ 𝑃 𝑆𝑜𝑢𝑡ℎ𝑏𝑟𝑖𝑑𝑔𝑒 + 𝑃 𝐺𝑟𝑎𝑝ℎ𝑖𝑐𝑠+ 𝑃(𝑂𝑡ℎ𝑒𝑟 𝑐𝑜𝑚𝑝𝑜𝑛𝑒𝑛𝑡𝑠))
– f() = Efficiency of the Power supply
8

Power Consumed and CPU Cycles (2/7)
• Simplified system power consumption
𝑃(𝑆𝑦𝑠𝑡𝑒𝑚) ∝ 𝑃 𝐶𝑃𝑈 + 𝑃 𝑀𝑒𝑚𝑜𝑟𝑦 + 𝑃 𝐵𝑖𝑎𝑠
– Bias = Power of Fans, Motherboard, North-bridge,
South-bridge, Graphics, HDD, and Other Components.
9
Power Consumed and CPU Cycles (3/7)
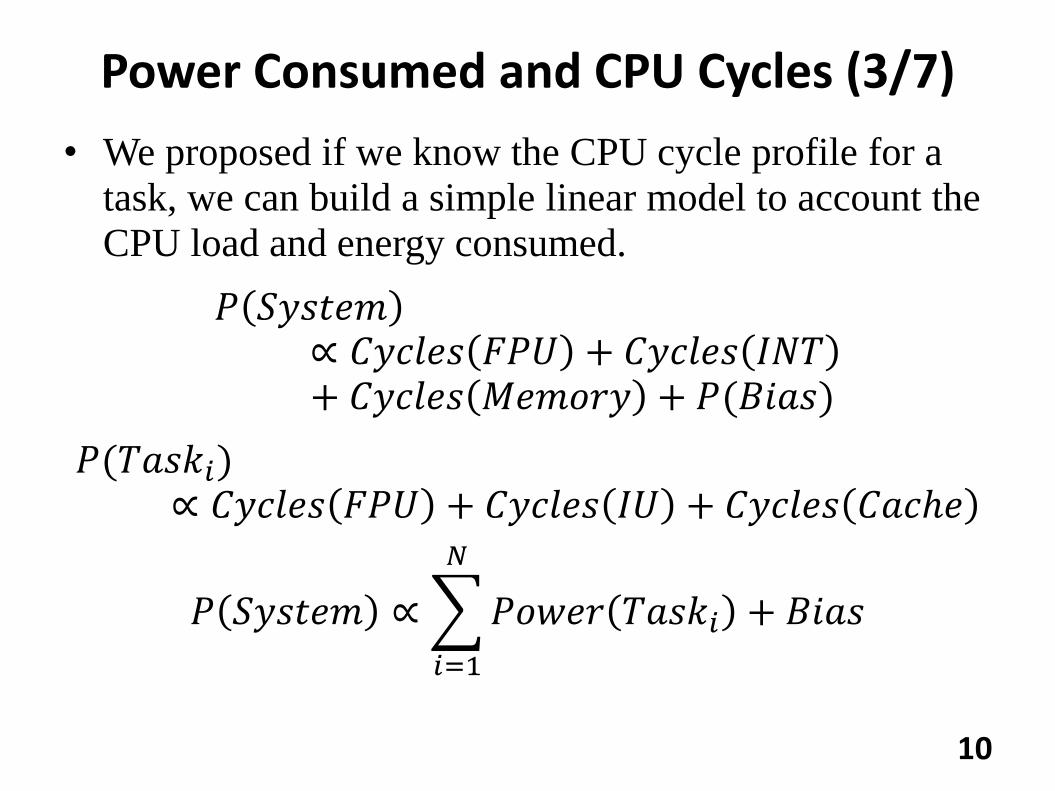
• We proposed if we know the CPU cycle profile for a
task, we can build a simple linear model to account the
CPU load and energy consumed.
𝑃 𝑆𝑦𝑠𝑡𝑒𝑚∝ 𝐶𝑦𝑐𝑙𝑒𝑠 𝐹𝑃𝑈 + 𝐶𝑦𝑐𝑙𝑒𝑠 𝐼𝑁𝑇+ 𝐶𝑦𝑐𝑙𝑒𝑠 𝑀𝑒𝑚𝑜𝑟𝑦 + 𝑃(𝐵𝑖𝑎𝑠)
𝑃(𝑇𝑎𝑠𝑘𝑖)∝ 𝐶𝑦𝑐𝑙𝑒𝑠 𝐹𝑃𝑈 + 𝐶𝑦𝑐𝑙𝑒𝑠 𝐼𝑈 + 𝐶𝑦𝑐𝑙𝑒𝑠 𝐶𝑎𝑐ℎ𝑒
𝑃 𝑆𝑦𝑠𝑡𝑒𝑚 ∝ 𝑃𝑜𝑤𝑒𝑟 𝑇𝑎𝑠𝑘𝑖
𝑁
𝑖=1
+ 𝐵𝑖𝑎𝑠
10

Power Consumed and CPU Cycles (4/7)
• We need to know the counts and the types of CPU
cycles executed by a task.
– Dtrace for Solaris
– Oprofile
– Intel Vtune for Linux
• We used Vtune in an offline manner and sampled
the application and store the cycle time over some
period. (30 minutes~1 hour)
11

Power Consumed and CPU Cycles (5/7)
• Linear Regression Model
𝑃𝑜𝑤𝑒𝑟 𝑇𝑎𝑠𝑘𝑖 = 𝐹 ∗ 𝑛𝑢𝑚𝑏𝑒𝑟 𝑜𝑓𝐹𝑃 𝑐𝑦𝑐𝑙𝑒𝑠 +𝐼 ∗ 𝑛𝑢𝑚𝑏𝑒𝑟 𝑜𝑓 𝐼𝑛𝑡 𝐶𝑦𝑐𝑙𝑒𝑠 +𝑀 ∗ 𝑛𝑢𝑚𝑏𝑒𝑟 𝑜𝑓 𝑀𝑒𝑚𝑜𝑟𝑦 𝐶𝑦𝑐𝑙𝑒𝑠
• F, I, and M are multiplier for watt cost of running a
single FP, INT, or Memory cycle. But there is no
direct way to find them.
12

Power Consumed and CPU Cycles (6/7) • We use the statistical approach of minimizing the square
error to find these unknown variables.
min𝐹,𝐼,𝑀
𝑀𝑒𝑎𝑠𝑢𝑟𝑒𝑑 𝑤𝑎𝑡𝑡𝑎𝑔𝑒 𝑌 − 𝑃𝑟𝑒𝑑𝑖𝑐𝑡𝑒𝑑 𝑤𝑎𝑡𝑡𝑎𝑔𝑒 𝑌 2
𝑌 = 𝐹 ∗ 𝑁𝑢𝑚𝑏𝑒𝑟 𝑜𝑓𝐹𝑃 𝑐𝑦𝑐𝑙𝑒𝑠 +𝐼 ∗ (𝑁𝑢𝑚𝑏𝑒𝑟 𝑜𝑓 𝐼𝑛𝑡 𝐶𝑦𝑐𝑙𝑒𝑠) +𝑀 ∗ 𝑁𝑢𝑚𝑏𝑒𝑟 𝑜𝑓 𝑀𝑒𝑚𝑜𝑟𝑦 𝐶𝑦𝑐𝑙𝑒𝑠 + 𝐵𝑖𝑎𝑠 = Xβ 𝐹, 𝐼,𝑀 > 0, β = 𝐹 𝐼 𝑀
• Once we know X, Y, then F, I, and M (stored in the β
vector) can be obtained as:
β = 𝑋𝑇𝑋 + 𝜆𝐼 −1𝑋𝑇𝑌
13

Power Consumed and CPU Cycles (7/7)
• We also used another statistical algorithm -
Random Forests in our experiments.
– Random Forests is a popular machine learning/statistical
approach that uses decision trees.
– It is a non-linear algorithm compared to the linear
regression formulation.
14

Experimental Results (1/6)
15
• Regression Model Training
– We obtained training data from the following
benchmarks first:
• memcpy
• While-float
• mprime
– Then we obtained separated test data for:
• SPECjvm
• While-Int
• While-Branch

Experimental Results (2/6)
16
• Results of Regression Model

Experimental Results (3/6)
17
• Energy Efficient Scheduler
– We proposed that we do not wake up a core from idle state until its needed. The cores that were not allocated any tasks were shut off.
– A core cannot execute more than a specific number of processor cycles.
– We used the average number of cycles executed to predict the energy consumed and then chose the best energy efficient schedule.
• The ideal case would be in an online fashion, based on the current load/cycle executed and evaluate the task schedule every second.

Experimental Results (4/6)
18

Experimental Results (5/6)
19

Experimental Results (6/6)
20

Conclusions
• We showed that a linear and Random Forests model
can be used for predicting energy consumption.
• We also proposed a simple scheduler that utilizes
this model to minimize power consumption but still
maintain similar execution time.
• In the future, we propose to come up with a better
mathematical model for scheduler.
• We also propose to use model in an online fashion
and allowing the OS to limit processes that
consume power greater than a fixed limit.
21