11 energy in denmark 2011. 2 observed energy consumption and adjusted gross energy consumption
TRANSCRIPT

11
Energy in Denmark
2011

2
600
700
800
900
1000
1990 '95 '00 '05 '11
PJ
Observed consumption Adjusted consumption
Observed energy consumption and adjusted gross energy
consumption
3
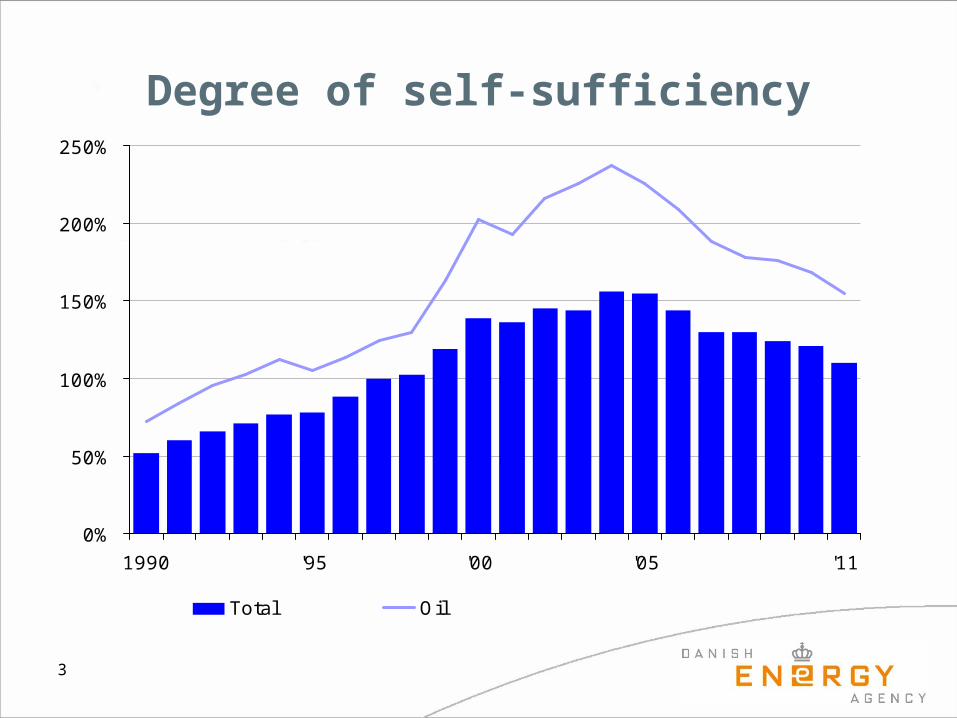
0%
50%
100%
150%
200%
250%
1990 '95 '00 '05 '11
Total Oil
Degree of self-sufficiency

4
0
200
400
600
800
1000
1200
1400
1990 '95 '00 '05 '11
PJ
Oil Natural gas Renewable energy and waste
Primary energy production
5
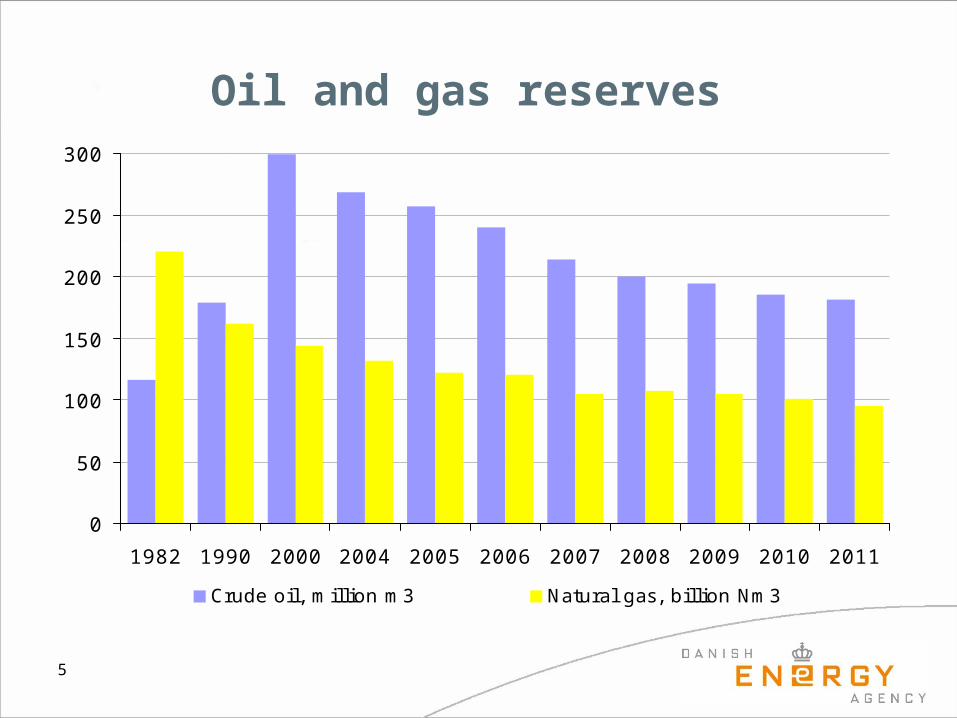
0
50
100
150
200
250
300
1982 1990 2000 2004 2005 2006 2007 2008 2009 2010 2011
Crude oil, million m3 Natural gas, billion Nm3
Oil and gas reserves

6
0
10
20
30
40
1990 '95 '00 '05 '11
PJ
Energy consumption Flaring
Natural gas consumption and flaring on platforms in the North Sea

7
0
20
40
60
80
100
120
140
1990 '95 '00 '05 '11
PJ
Wind Straw Wood Biogas Waste Heat pumps
Production of renewable energy by energy product

8
Consumption of waste
0
10
20
30
40
50
1990 '95 '00 '05 '11
PJ
Waste, renewable Waste, non-renewable

9
Consumption of renewable energy
0
50
100
150
200
1990 '95 '00 '05 '11
Share covered by indigenous production Share covered by net imports
PJ

10
Renewable energy – consumption by source
0
20
40
60
80
100
120
140
1990 '95 '00 '05 '11
PJ
Wind Biomass liquid biofuels Biogas Others

11
0
20
40
60
80
100
120
Electricity and district heating Final energy consumption
PJ
Wind Straw Wood Biogas Waste Other renewables
Use of renewable energy in 2011

12
Renewable energy- share of energy consumption
0
5
10
15
20
25
1990 '95 '00 '05 '11
%
Share of observed energy consumption
Share of adjusted energy consumption

13
Share of renewable energy according to the EU method of calculation
0
5
10
15
20
25
1990 '95 '00 '05 '11
%
Share of renewable energy according to the EU method of calculation
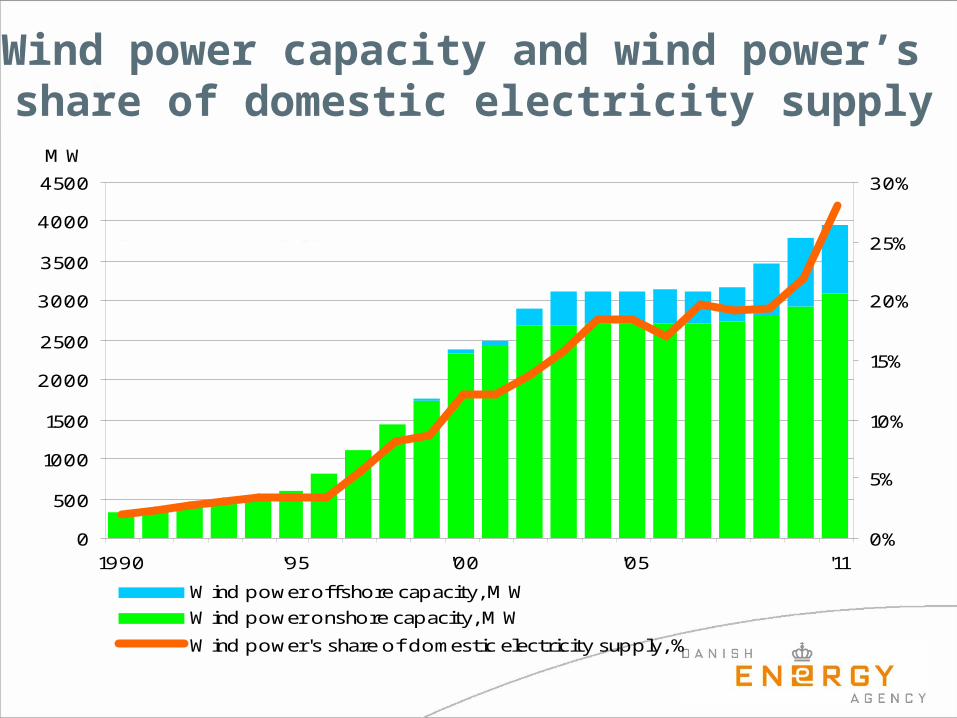
Wind power capacity and wind power’s
share of domestic electricity supply
0
500
1000
1500
2000
2500
3000
3500
4000
4500
1990 '95 '00 '05 '11
MW
0%
5%
10%
15%
20%
25%
30%
Wind power offshore capacity, MW
Wind power onshore capacity, MW
Wind power's share of domestic electricity supply, %

Wind power onshore by municipality
15

16
Wind power capacity by turbine size
0
1000
2000
3000
4000
1990 2000 2011
MW
- 499 kW 500 - 999 kW 1000 - 1999 kW 2000 - kW

17
Wind power production by turbine size
0
10000
20000
30000
40000
1990 2000 2011
TJ
- 499 kW 500 - 999 kW 1000 - 1999 kW 2000 - kW
18
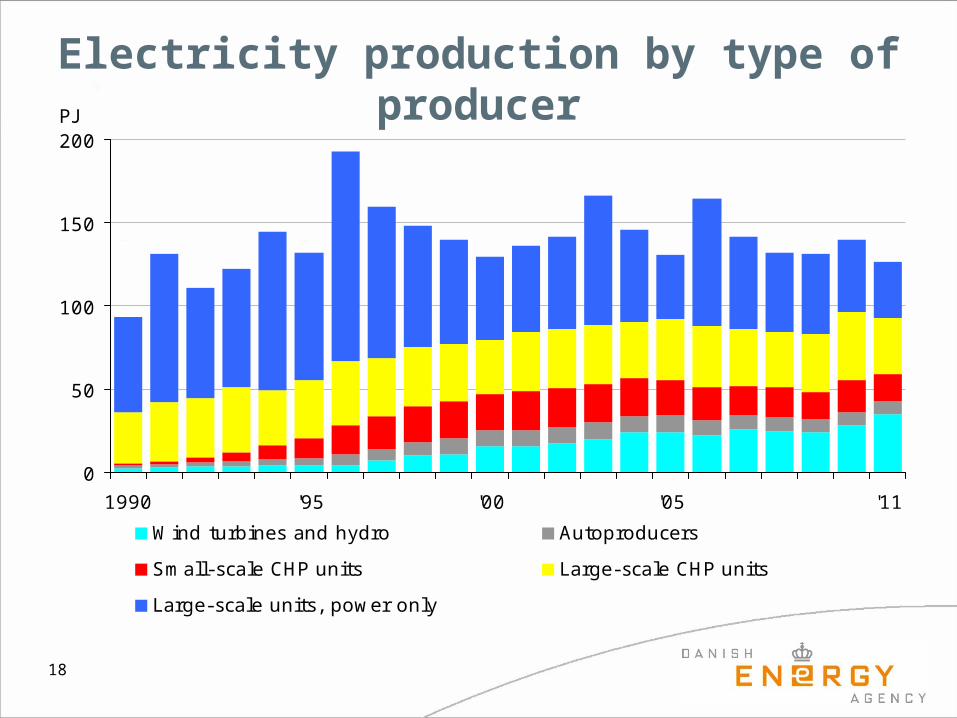
0
50
100
150
200
1990 '95 '00 '05 '11
PJ
Wind turbines and hydro Autoproducers
Small-scale CHP units Large-scale CHP units
Large-scale units, power only
Electricity production by type of producer

19
0
50
100
150
200
1994 '00 '05 '11
Coal Oil Natural gas Wind power Other
PJ
Electricity production by fuel

20
0%
10%
20%
30%
40%
50%
60%
'90 '95 '00 '05 '11
Oil Natural gas Renewable energy and waste
Other fuels than coal for electricity production

21
-40
-20
0
20
40
60
1990 '95 '00 '05 '11
PJ
Total Germany Norway Sweden
Net exports of electricity by country

22
Heat supply by type of fuel
0
20
40
60
80
CHP units District heating
TJ
Coal Natural gas Waste Biomass Other

23
0
2000
4000
6000
8000
10000
12000
14000
1990 '95 '00 '05 '11
MW
Large-scale units Small-scale units Autoproducers Wind turbines
Electricity capacity

24
0%
20%
40%
60%
80%
100%
1990 '95 '00 '05 '11
District heating Electricity
CHP share of thermal power and district heating production

25
0
20
40
60
80
100
120
140
160
1990 '95 '00 '05 '11
PJ
Large-scale CHP units Small-scale CHP units District heating units
Autoproducers, CHP Autoproducers, heat only
District heating production by type of production plant

26
Fuels composition for district heating production, percentage distribution
0%
20%
40%
60%
80%
100%
1990 '95 '00 '05 '11
Oil Natural gas Coal Renewable energy and waste

27
600
700
800
900
1000
1990 '95 '00 '05 '11
PJ
Observed consumption Adjusted consumption * )
*) Net electricity exports and climate adjusted consumption
Observed energy consumption and adjusted gross energy consumption

28
0
300
600
900
1990 '95 '00 '05 '11
PJ
Oil Natural gas Coal and coke Renewable energy etc.
Gross energy consumption by fuelAdjusted

29
0
300
600
900
1990 '95 '00 '05 '11
PJ
Oil Natural gas Coal and coke
Renewable energy etc. Electricity District heating
Gas works gas
Gross energy consumption by energy product after transformation
Adjusted
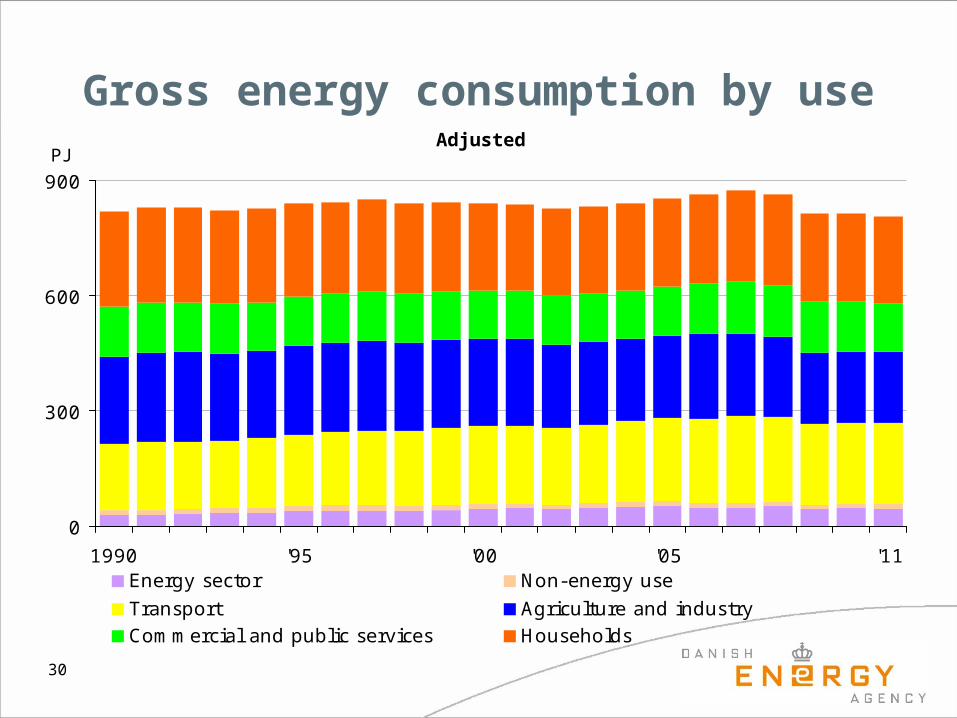
30
0
300
600
900
1990 '95 '00 '05 '11
PJ
Energy sector Non-energy use
Transport Agriculture and industryCommercial and public services Households
Gross energy consumption by useAdjusted

31
Climate adjusted
0
50
100
150
200
250
Non-energyuse
Transport Agricultureand industry
Commercialand publicservices
Households
PJ
1980 1990 2000 2011
Final energy consumption by use

32
0
100
200
300
400
500
600
700
1990 '95 '00 '05 '11
PJ
Oil Natural gasCoal and coke Renewable energy and wasteElectricity District heatingGas works gas
Final energy consumption by energy product
Adjusted

33
0,0
0,4
0,8
1,2
1990 '95 '00 '05 '11
Gross energy consumption Final energy consumption
TJ per DKK million GDP (2005 prices)
Gross energy consumption and final energy consumption per DKK million
GDP Adjusted

34
20
25
30
35
40
1990 '95 '00 '05 '11
Manufacturing industry Commercial and public services Households
Climate adjusted
PJ
Final electricity consumption by use

35
0
10
20
30
40
50
1990 '95 '00 '05 '11Total Manufacturing industryCommercial and public services HouseholdsOthers
Climate adjusted%
Electricity consumption’s share of total energy consumption

36
0
50
100
150
200
250
1990 '95 '00 '05 '11
PJ
Road Rail Domestic sea transport
Domestic aviation International aviation Military transport
Energy consumption for transport by type

37
0
50
100
150
200
250
1990 '95 '00 '05 '11
PJ
Gasoline Diesel Aviation fuels Other fuels
Energy consumption for transport by fuel type

38
0%
20%
40%
60%
80%
1990 '95 '00 '05 '11
Road transport, share of energy consumption in transport
Diesel oil, share of snergy consumption in road transport
Energy consumption for road transport

39
Final energy consumption by passengers and freight transport
0
50
100
150
200
250
1990 '95 '00 '05 '11
PJ
Transport of passengers Transport of freight Military transport

40
0
50
100
150
1990 '95 '00 '05 '11
PJ
Passenger cars and vans under 2 ton Busses
Two-wheeled (mc and moped) Train, s-train and metro
Domestic aviation International aviation
Domestic sea transport
Energy consumption for passengers transport by means of transport

41
0
20
40
60
80
1990 '95 '00 '05 '11
Trucks Vans, 2-6 tonnes Domestic sea transport Train Aviation
PJ
Energy consumption for freight transport by means of transport

42
0
50
100
150
200
1990 '95 '00 '05 '11
PJ
Total energy consumption Electricity consumption
Climate adjusted
Energy and electricity consumption in agriculture and industry

43
0
20
40
60
80
100
120
140
160
180
1900 '95 '00 '05 '11
PJ
Oil Natural gas Coal and coke
Renewable energy etc. Electricity District heating
Climate adjusted
Energy consumption in agriculture and industry by energy product

44
0
20
40
60
80
100
120
140
160
180
1990 '95 '00 '05 '11
PJ
Agriculture and forestry Horticulture Fishing Manufacturing Construction
Climate adjusted
Energy consumption by individual industry in the agriculture and
industry sector

45
0%
5%
10%
15%
20%
25%
30%
35%
1990 '95 '00 '05 '11
Agriculture and industry, total Agriculture and forestry
Horticulture Manufacturing
Climate adjusted
Electricity consumption’s share of total
energy consumption
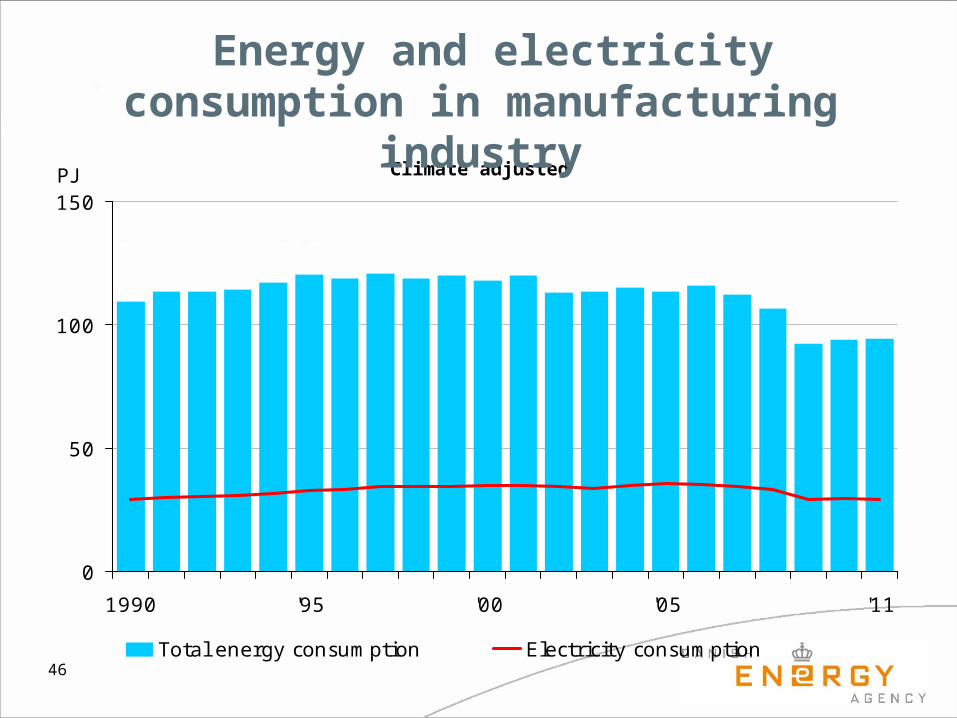
46
0
50
100
150
1990 '95 '00 '05 '11
PJ
Total energy consumption Electricity consumption
Climate adjusted
Energy and electricity consumption in manufacturing industry

47
0%
20%
40%
60%
80%
100%
1980 1990 2000 2011
Oil Natural gas Coal and coke
Renewable energy etc. Electricity District heating
Climate adjusted
Consumption of energy consumption in manufacturing industries

48
0,0
0,2
0,4
0,6
0,8
1,0
1,2
1990 '95 '00 '05 '11
0,0
0,5
1,0
1,5
2,0
2,5
3,0
Agriculture and industry Manufacturing
Construction Agriculture and horticulture
Climate adjustedClimate adjusted TJ per DKK million GVA (2005 prices)
Energy intensity in agriculture and industry

49
0
0,1
0,2
0,3
0,4
0,5
0,6
1990 '95 '00 '05 '11
Agriculture and industry Agriculture and horticulture
Manufacturing Construction
Climate adjusted
Electricity intensity in agriculture and industry
Climate adjusted [TJ per million DKK GVA (2005 prices)]

50
0
50
100
150
200
250
300
350
1990 '95 '00 '05 '11
Total Electricity
TJ per 1 000 employees
Energy consumption per employee in manufacturing industry
Climate adjusted

51
0
20
40
60
80
100
1990 '95 '00 '05 '11
PJ
Total energy consumption Electricity consumption
Climate adjusted
Energy and electricity consumption in the commercial and public services

52
0
20
40
60
80
100
1990 '95 '00 '05 '11
PJ
Oil Natural gas Coal, coke, gas works gas
Renewable energy etc. Electricity District heating
Climate adjusted
Energy consumption by energy product

53
0%
20%
40%
60%
80%
100%
1980 1990 2000 2011
Oil Natural gas
Coal, coke, gas works gas Renewable energy etc.
Electricity District heating
Climate adjusted
Composition of energy consumption in commercial and public services
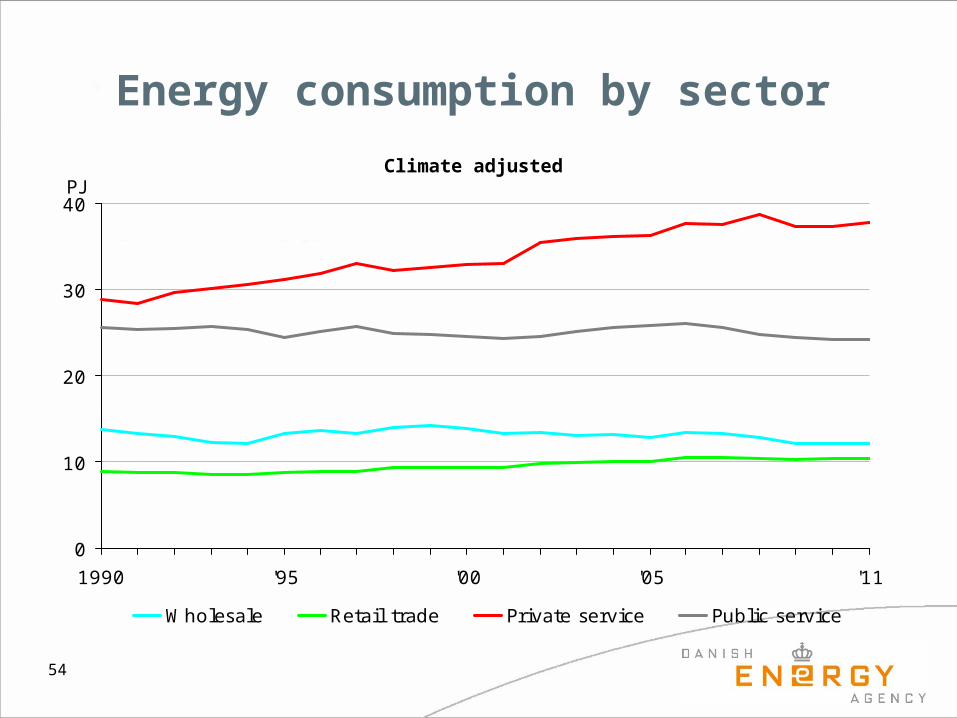
54
0
10
20
30
40
1990 '95 '00 '05 '11
PJ
Wholesale Retail trade Private service Public service
Climate adjusted
Energy consumption by sector

55
0
10
20
30
40
50
1990 '95 '00 '05 '11
PJ
Net energy consumption Local losses
Climate adjusted
Energy consumption for heating in the commercial and public services

56
0
2
4
6
8
10
12
14
16
18
1990 '95 '00 '05 '11
PJ
Wholesale Retail trade Private service Public service
Climate adjusted
Electricity consumption by sector
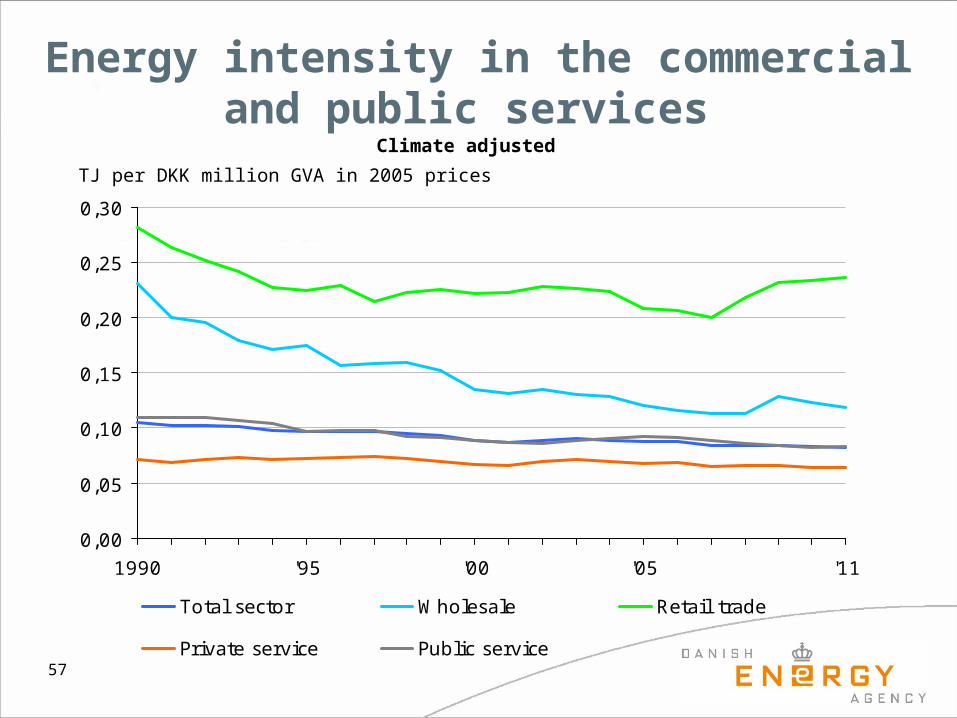
57
0,00
0,05
0,10
0,15
0,20
0,25
0,30
1990 '95 '00 '05 '11
Total sector Wholesale Retail trade
Private service Public service
TJ per DKK million GVA in 2005 prices
Climate adjusted
Energy intensity in the commercial and public services

58
0,00
0,02
0,04
0,06
0,08
0,10
0,12
0,14
0,16
0,18
1990 '95 '00 '05 '11
Total sector Wholesale Retail trade
Private service Public service
TJ per DKK million GVA in 2005 pricesClimate adjusted
Electricity intensity in commercial and public services

59
0
10
20
30
40
50
60
1990 '95 '00 '05 '11
Total energy Electricity
Climate adjustedGJ per employee
Energy consumption per employee in commercial and public services

60
100
150
200
250
1990 '95 '00 '05 '11
PJ
Observed Climate adjusted
Energy consumption in households
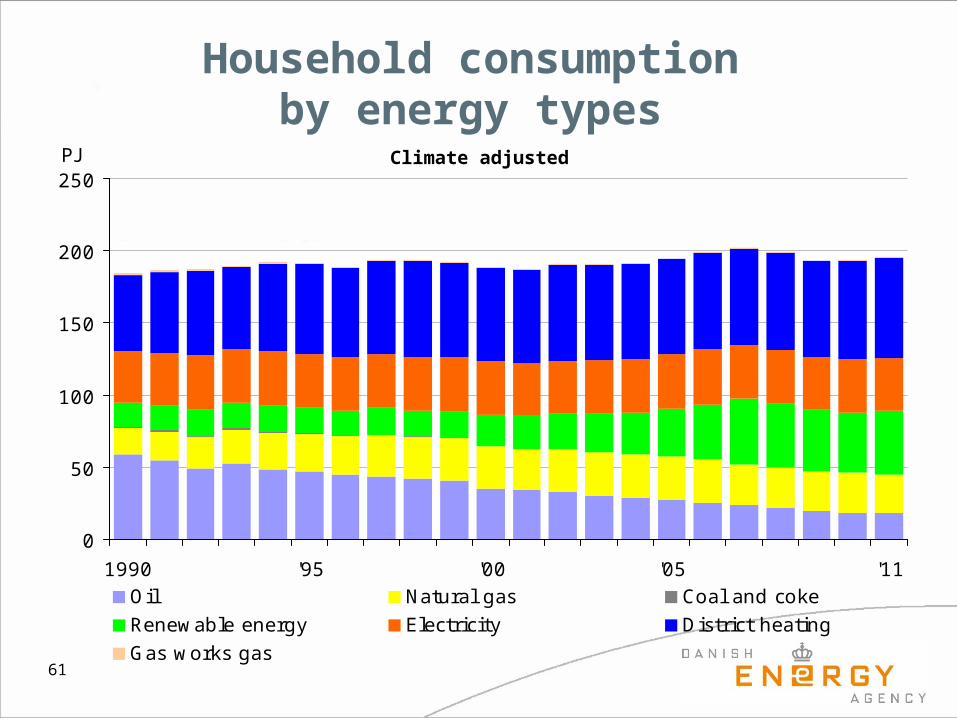
61
0
50
100
150
200
250
1990 '95 '00 '05 '11
PJ
Oil Natural gas Coal and coke
Renewable energy Electricity District heating
Gas works gas
Climate adjusted
Household consumptionby energy types

62
0
20
40
60
80
100
'90 '95 '00 '05 '11
GJ
Space heating Electrical appliances etc.
Climate adjusted
Energy consumption per household
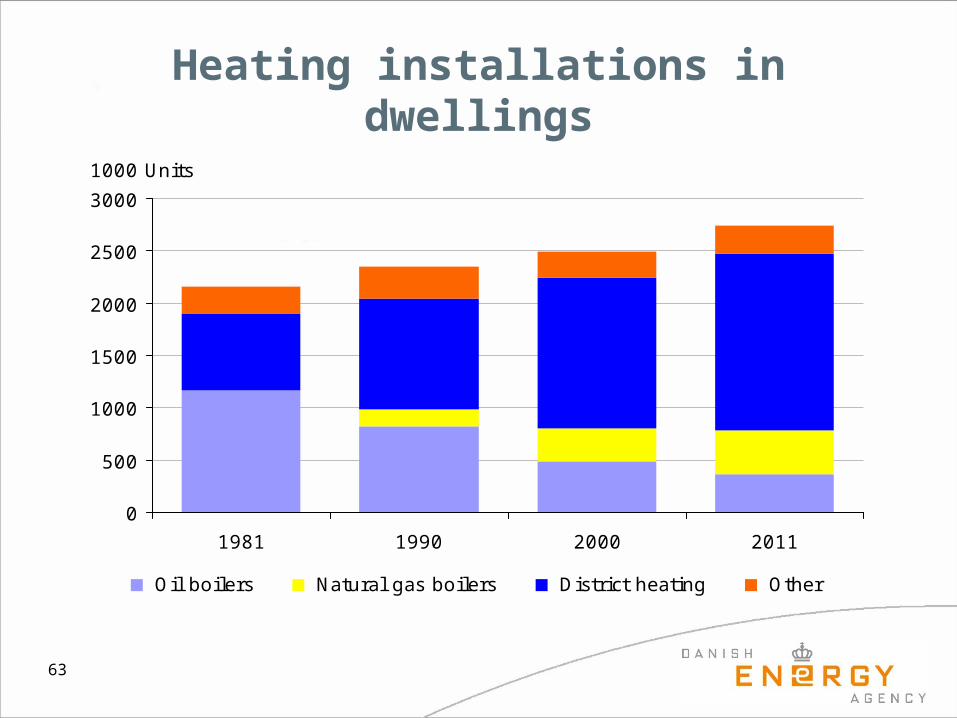
63
0
500
1000
1500
2000
2500
3000
1981 1990 2000 2011
1000 Units
Oil boilers Natural gas boilers District heating Other
Heating installations in dwellings

64
0
50
100
150
1990 '95 '00 '05 '11
Heated floor space Final energy consumption Final energy consumption per m2
Climate adjustedIndex 1990=100
Energy consumption for heating dwellings

65
0
50
100
150
200
1990 '95 '00 '05 '11
PJ
Net energy consumption Local losses
Climate adjusted
Net energy consumption and heat loss when heating dwellings

66
80
100
120
140
160
180
1990 '95 '00 '05 '11
Electricity consumption, climate adjusted
Electricity consumption, appliances etc.
Private consumption, fixed prices
Index 1990=100
Private consumption and electricity consumption in households

67
0
1.000
2.000
3.000
4.000
5.000
6.000
1990 '95 '00 '05 '11
1000 Units
TV sets Refrigerators Freezers
Dishwashers Microwave ovens Washing machines
Dryers
Household stock of electrical appliances

68
0
200
400
600
800
1990 '95 '00 '05 '11
kWh/year
TV Sets Refrigerators Freezers
Dishwashers Washing machines Dryers
Specific electrical consumption of household appliances

69
40
50
60
70
80
1990 '95 '00 '05 '11
Observed Adjusted
Million tonnes CO2
CO2 emissions from energy consumption

70
0
10
20
30
40
50
60
70
1990 1995 2000 2011
Oil Natural gas Coal Wastes, non renewable
Million tonnes CO2
CO2 emissions by fuelClimate adjusted

71
40
50
60
70
80
90
100
1990 '95 '00 '05 '11
400
500
600
700
800
900
1000
CO2 -emissions per fuel unit
CO2 -emissions per kWh electricity (right axis)
Kg per GJ Gram per kWh
CO2 emissions per fuel unit and kWh electricity
Adjusted

72
0
10
20
30
40
50
60
70
1990 1995 2000 2011
Energy sector Transformation sector Final energy consumption
Million tonnes CO2
CO2 emissions by sector

73
0
10
20
30
40
50
60
70
1990 '95 '00 '05 '11HouseholdsCommercial and public servicesAgriculture and industryTransportEnergy sector
Million tonnes CO2
CO2 emissions in end-use of energyClimate adjusted

74
40
50
60
70
80
90
100
1990 '95 '00 '05 '10
Observed emissions Adjusted emissions
Mio. tonnes CO2 -equivalent
Emissions of greenhouse gases

75
-10
10
30
50
70
90
1990 '95 '00 '05 '10
Emissions from energy consumption Industrial process, flaring etc.
Emissions from agriculture Other emissions
Forestry and land use
Observed net emissions of greenhouse gases by origin
Million tonne CO2 -equivalent
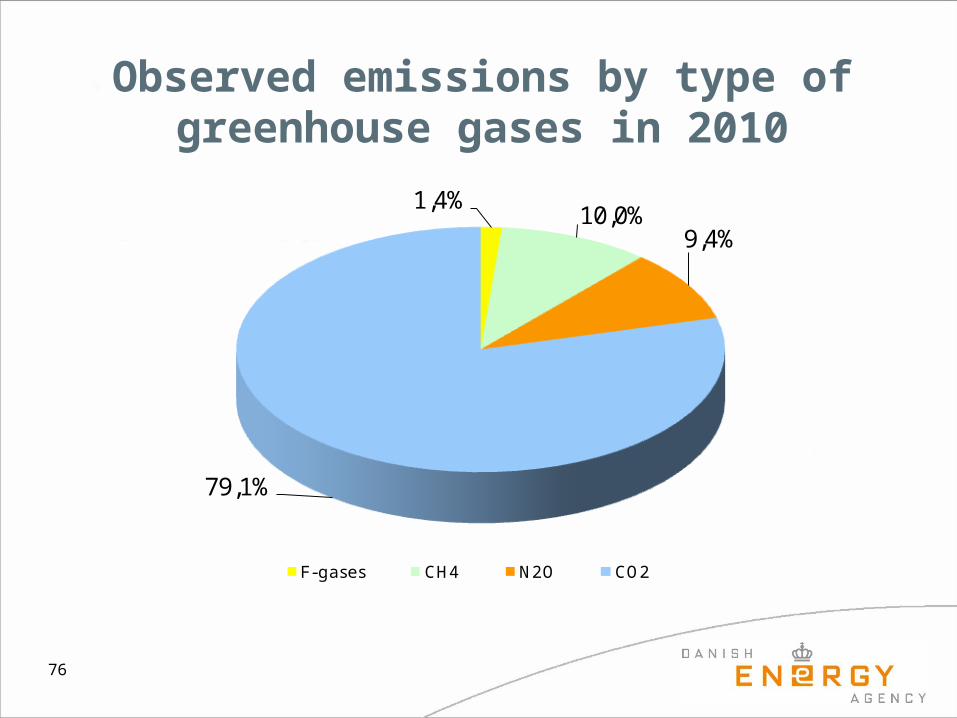
76
1,4%10,0%
9,4%
79,1%
F-gases CH4 N2O CO2
Observed emissions by type of greenhouse gases in 2010
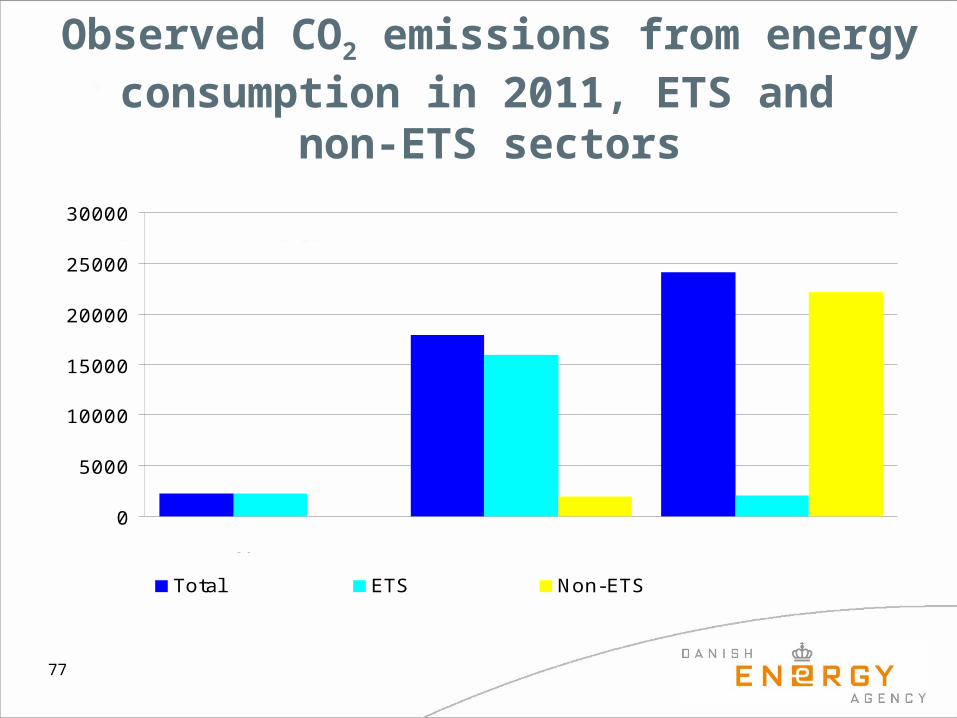
77
0
5000
10000
15000
20000
25000
30000
Total ETS Non-ETS
Transformation sectorFinal energy consumption
Energy sector
1000 Tonnes
Observed CO2 emissions from energy consumption in 2011, ETS and
non-ETS sectors

78
0
50
100
150
200
1990 '95 '00 '05 '10
Households Agriculture and industry
Energy and water supply Commercial and public services
Billion DKK, current prices
Energy expenditure by industry and households
Source: Statistics Denmark
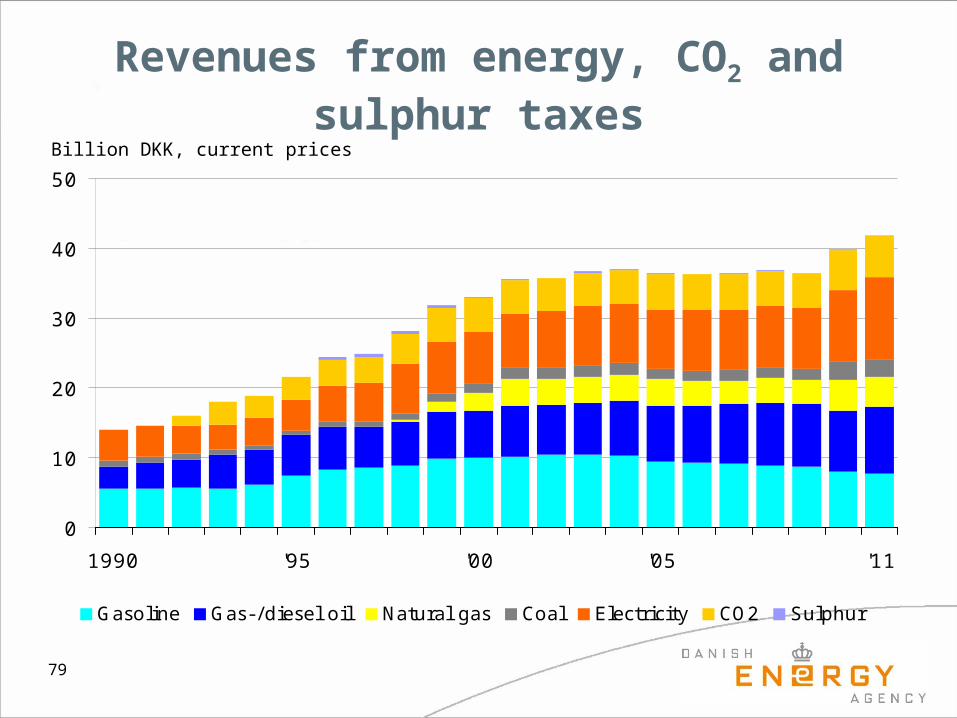
79
Billion DKK, current prices
0
10
20
30
40
50
1990 '95 '00 '05 '11
Gasoline Gas-/diesel oil Natural gas Coal Electricity CO2 Sulphur
Revenues from energy, CO2 and sulphur taxes
80
0
1
2
3
4
5
'01 '02 '03 '04 '05 '06 '07 '08 '09 '10 '11
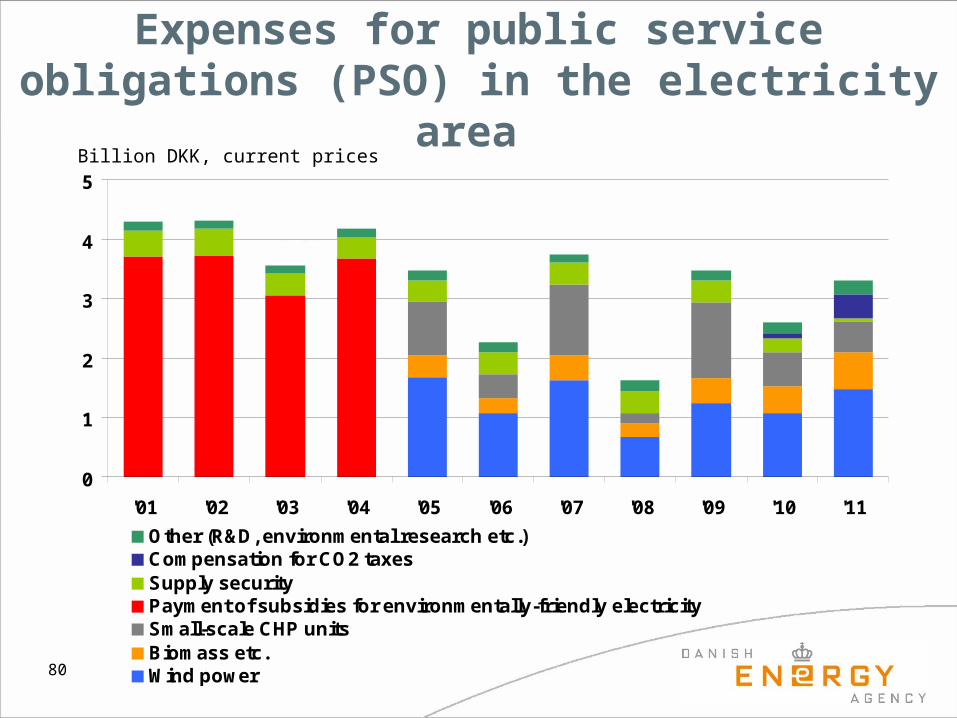
Other (R&D, environmental research etc.)Compensation for CO2 taxesSupply securityPayment of subsidies for environmentally-friendly electricity Small-scale CHP unitsBiomass etc.Wind power
Billion DKK, current prices
Expenses for public service obligations (PSO) in the electricity
area

81
Billion DKK, current prices
Net currency revenues from energy products
Source: Statistics Denmark
-10
0
10
20
30
40
1990 '95 '00 '05 '11
Total Oil Natural gas Coal Electricity Biomass

82
0
10
20
30
40
50
60
70
1990 '95 '00 '05 '11
Crude oil Natural gas
Billion DKK, current prices
Value of crude oil and natural gas production

83
0
10
20
30
40
50
60
70
1996 '00 '05 '11
0%
5%
10%
15%
20%
Exports of energy technology and equipment
Share of Denmark´s total exports of commodities, %
Billion DKK, current prices
Exports of energy technology and equipment

84
USD per Barrel
0
20
40
60
80
100
120
1970 '75 '80 '85 '90 '95 '00 '05 '10 '12
Brent, USD per barrel Brent, USD per barrel (2011 prices)
Prices for 2012 cover only the first six months.
Spot market prices of crude oil
1999
2010
20092004
2005
2006
2007
2008
2001
2000
2002
2003
2011
0
10
20
30
40
50
60
70
1999'00 '01 '02 '03 '04 '05 '06 '07 '08 '09 '10 '11 '12
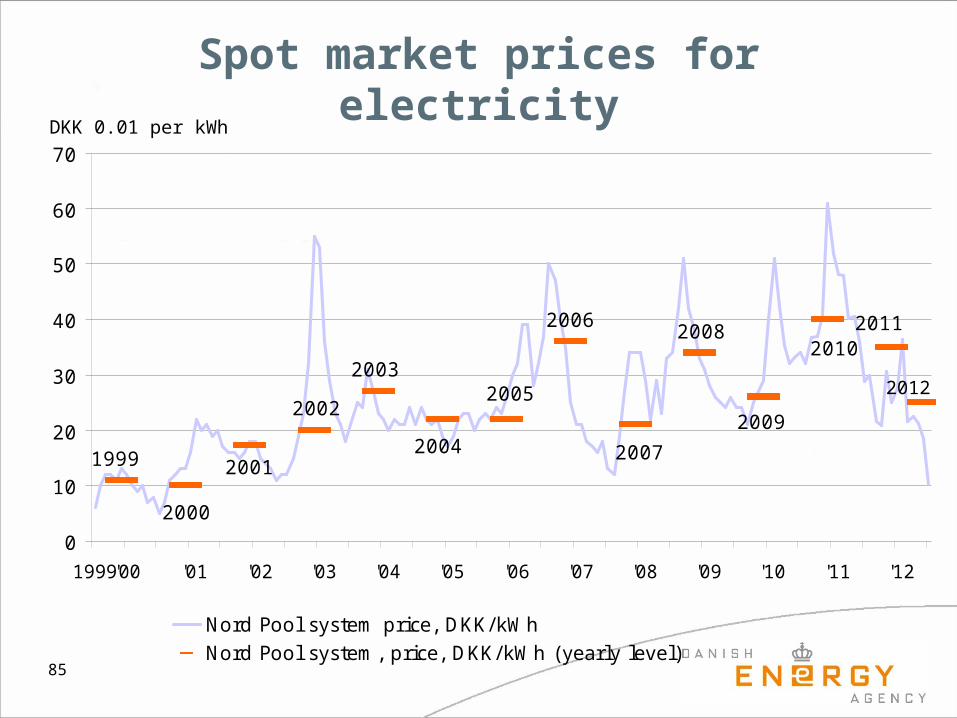
Nord Pool system price, DKK/kWh Nord Pool system, price, DKK/kWh (yearly level)
85
DKK 0.01 per kWh
Spot market prices for electricity
2012

86
DKK 0.01 per kWh
Electricity prices for households 1997-2012 (as at 1 January)
0
50
100
150
200
250
1997 '98 '99 '00 '01 '02 '03 '04 '05 '06 '07 '08 '09 '10 '11 '12
Subscription EnergyElectricity tax Electricity distribution taxElectricity save contribution CO2 taxSO2 tax Total VAT
Source: Danish Energy Association

87
0
2
4
6
8
10
12
14
1990 '95 '00 '05 '11
Motor gasoline per litre Heating oil per litre
Natural gas per Nm3 Eletricity per kWh
DKK, in current prices
Energy prices for households

88
0
2
4
6
8
10
12
14
16
1990 '95 '00 '05 '11
Motor gasoline per litre Heating oil per litre
Natural gas per Nm3 Electricity per kWh
DKK, fixed 2011 prices
Energy prices for households

89
0%
20%
40%
60%
80%
100%G
aso
line
Heati
ng
oil
Ele
ctri
city
Gaso
line
Heati
ng
oil
Ele
ctri
city
Gaso
line
Heati
ng
oil
Ele
ctri
city
Gaso
line
Heati
ng
oil
Ele
ctri
city
Price, excl. taxes and VAT Energy and taxes CO2 VAT
1980 1990 2000 2011
Composition of energy prices for households

90
0,0
0,2
0,4
0,6
0,8
1,0
BG
R
ES
T
FR FI
RO
NO SE
NL
SV
N
GR Pl
DE
EU
27
PT
DK
HN
G ES
UK
BE IE
LV
A
CZ
LTU
SV
K
2010 2011
DKK per KWh
Electricity prices, excl. VAT and taxes for industrial customers
annual consumption: 2 GWh

91
DKK per m3
0
1
2
3
4
RO
UK
NL
ES
T
ES
BG
R
LVA IT BE
CZ
EU
27
HN
G Pl DK FR FI PT IE
SV
K
LTU
DE
SV
N SE
2010 2011
Natural gas prices, excl. VAT and taxes for industrial customers

92
Motor gasoline pricesDKK per liters
0
2
4
6
8
10
12
14
PL RO ES
HU LT
SV
N LV AT
EU
-27 IE FR BE FI PT DE
UK
SE
DK
GR
NL IT
2011 2012
93
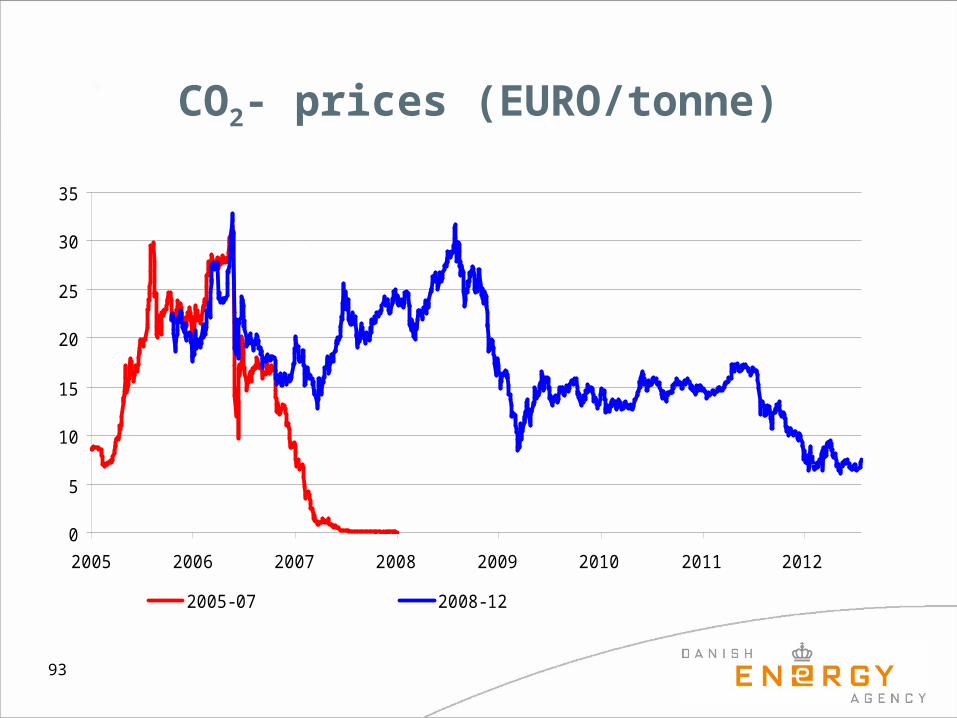
CO2- prices (EURO/tonne)
0
5
10
15
20
25
30
35
2005 2006 2007 2008 2009 2010 2011 2012
2005- 07 2008- 12

94
North America217
South and Central America
325
Europe and Euroasia141
Africa132
MiddleEast795 Asia and
Pacific41
Proven oil reserves at end 2011 billion barrels

95
0
20
40
60
80
100
1990 '95 '00 '05 '11
North America South and Central AmericaEurope and Euroasia Middle EastAfrica Asia and Pacific
Million barrels per day
Oil consumption by region

96
0
2000
4000
6000
8000
10000
12000
14000
1990 '95 '00 '05 '11
North America South and Central America
Europe and Euroasia Middle East
Africa Asia and Pacific
Million toe
Energy consumption by region