energy consumption uk
TRANSCRIPT
ENERGYCONSUMPTIONIN THE UNITED KINGDOM
> CONTENTS
ECUK 16/7/02 9:35 AM Page 1

ECUK 16/7/02 9:35 AM Page 2

ENERGYCONSUMPTIONIN THE UNITED KINGDOM
ECUK 16/7/02 9:35 AM Page 3

ECUK 16/7/02 9:35 AM Page 4
ENERGY CONSUMPTION IN THE UK 5
List of charts.........................................................................................................................................................6
Introduction .........................................................................................................................................................7
Chapter 1: Overall energy consumption...........................................................................8
Overall energy consumption ..............................................................................................................................8
Factors affecting overall energy consumption:.......................................................................................12
Energy intensity................................................................................................................................................12
Chapter 2: Transport energy consumption .................................................................14
Transport energy consumption ......................................................................................................................14
Factors affecting transport energy consumption: .................................................................................15
Increased demand for travel ......................................................................................................................17
Changes in energy efficiency.....................................................................................................................20
Gross Domestic Product and income.....................................................................................................22
Chapter 3: Domestic energy consumption .................................................................23
Domestic energy consumption.......................................................................................................................23
Factors affecting domestic energy consumption:.................................................................................25
The number of households, population and income ....................................................................25
Temperature.......................................................................................................................................................26
Growth in number of appliances..............................................................................................................26
Cooking.................................................................................................................................................................28
Insulation .............................................................................................................................................................28
Chapter 4: Industrial energy consumption..................................................................30
Industrial energy consumption.......................................................................................................................30
Factors affecting industrial energy consumption:.................................................................................32
Changes in structure ......................................................................................................................................33
Changes in output...........................................................................................................................................34
Changes in efficiency.....................................................................................................................................34
Chapter 5: Service sector energy consumption.....................................................36
Service sector energy consumption .............................................................................................................36
Factors affecting service sector consumption: .......................................................................................39
Output ...................................................................................................................................................................39
Floor space ..........................................................................................................................................................40
Annex.......................................................................................................................................................................41
List of tables available on the internet ..............................................................................45
Contents
ECUK 16/7/02 9:35 AM Page 5
ENERGY CONSUMPTION IN THE UK6
Chapter 11.1 Total primary energy consumption, 1970 to 2001 .....................................................................................................8
1.2 Primary energy consumption by fuel, 1990 and 2001 ...............................................................................................9
1.3 Final energy consumption, by sector, in primary energy equivalents, 1990 and 2001..............................................9
1.4 Final energy consumption, by fuel, 1970 to 2001 ....................................................................................................10
1.5 Percentage sector shares in total energy consumption, 1990 and 2001..................................................................11
1.6 Final energy consumption by end use, 1990 and 2000............................................................................................11
1.7 Factors affecting changes in final delivered energy by sector between 1990 and 2000 ..........................................12
1.8 Sectoral energy intensity indicators, 1970 to 2001 ..................................................................................................13
Chapter 22.1 Transport energy consumption by type of transport, 1970, 1980, 1990 and 2001..................................................14
2.2 Road transport energy consumption by type of road vehicle, 2000 ........................................................................15
2.3 Transport energy consumption reallocated to the domestic, industrial and service sectors, 1990 to 2000............16
2.4 Factors affecting changes in transport energy use between 1990 and 2000 ...........................................................16
2.5 Passenger numbers between the UK and abroad, 1990 to 2000..............................................................................17
2.6 Freight transport by mode, 1970 to 2000 ................................................................................................................18
2.7 Passenger kilometres by bus, motorcycle, cycle, rail and air, 1970 to 2000.............................................................18
2.8 Car use per person, 1970 to 2000.............................................................................................................................19
2.9 Energy intensities for road passenger, road freight and air transport, 1970 to 2000...............................................21
Chapter 33.1 Domestic energy consumption by end use, 1970 to 2000.......................................................................................23
3.2 Electricity consumption by household domestic appliances by broad type, 1970 to 2000.....................................24
3.3 Domestic energy consumption per person, per household and per unit of household income, 1970 to 2000......25
3.4 Percentage of households that own household domestic appliances, 1970 to 2000 ..............................................27
3.5 Energy consumption of new cold appliances, 1990 to 2000....................................................................................28
3.6 Savings due to better insulation and heating efficiency, 1970 to 2000....................................................................29
Chapter 44.1 Total industrial energy consumption, 1970 to 2001.................................................................................................30
4.2 Industrial energy consumption by sub-sector, 2001 ................................................................................................31
4.3 Industrial energy consumption by fuel, 2001...........................................................................................................31
4.4 Industrial energy consumption by type of use, 1999...............................................................................................32
4.5 Output and intensity effects on industrial energy consumption between 1990 and 2000 .....................................33
4.6 Energy intensity changes in manufacturing industry, 1990 to 1999........................................................................34
4.7 Industrial energy intensities for selected industrial groups, 1990 to 2001 ..............................................................35
Chapter 55.1 Service sector energy consumption, 1970 to 2001 ..................................................................................................36
5.2 Service sector energy consumption by sub-sector, 2000 ........................................................................................37
5.3 Service sector electricity consumption by end use, 2000 ........................................................................................38
5.4 Energy consumption for service sector buildings by end use, 2000 .......................................................................38
5.5 Factors affecting changes in service sector energy consumption between 1990 and 2000....................................39
5.6 Energy intensities for the whole service, private commercial and public sectors, 1970 to 2001.............................40
List of charts
ECUK 16/7/02 9:35 AM Page 6
ENERGY CONSUMPTION IN THE UK 7
Energy forms a key part of our everyday lives. We need energy to switch on our lights, drive our cars,
make the products we use and keep warm in winter in our homes and workplaces. As our economy
grows, demand for energy increases as the number of appliances we own increases and we demand
more functionality from new products. We need good quality statistics to understand the underlying
trends in energy consumption since our energy use has a big impact on our environment.
This publication looks at energy consumption and how it has changed over the last 30 years, with a
focus on changes over the last ten years. It considers some of the drivers that have influenced energy
consumption, updating some of the data that were published in Energy Paper 66, ‘Energy
Consumption in the United Kingdom’ in 1997. This booklet provides an overview of the key trends
and factors affecting energy consumption in five short chapters. Chapter 1 looks at overall energy
consumption, while Chapters 2 to 5 look at each of the transport, domestic, industrial and service
sectors respectively. Detailed tables containing more information about energy consumption can be
found on the DTI website.
The main purpose of this publication is to provide data on energy consumption patterns. It contains
data that are published in the annual Digest of UK Energy Statistics alongside information from other
organisations that help us to understand some of the more detailed trends within the totals. Some of
the data contained in this publication are analyses that have been carried out by the DTI and
methodological notes detailing how these calculations were made can be found in the
methodological annex at the end of this publication.
It is intended that the data that appears on the internet will be updated on an annual basis, while the
paper publication will appear every few years.
If you have any queries or comments that you would like to make about this publication, then please
contact us at:
Energy Publications,
Department of Trade and Industry,
Bay 1108,
1 Victoria Street,
London SW1H 0ET.
E-mail: [email protected]
Telephone: 020 7215 2698
Enquirers with hearing difficulties can contact the Department on the DTI Textphone: 020 7215 6740.
Introduction
ECUK 16/7/02 9:35 AM Page 7
150
160
170
180
190
200
210
220
230
240
250
1970 1975 1980 1985 1990 1995
Mill
ion
to
nn
es o
f o
il eq
uiv
alen
t
Energy consumptionTemperature corrected energy consumption
20010
ENERGY CONSUMPTION IN THE UK8
Overall energy consumption
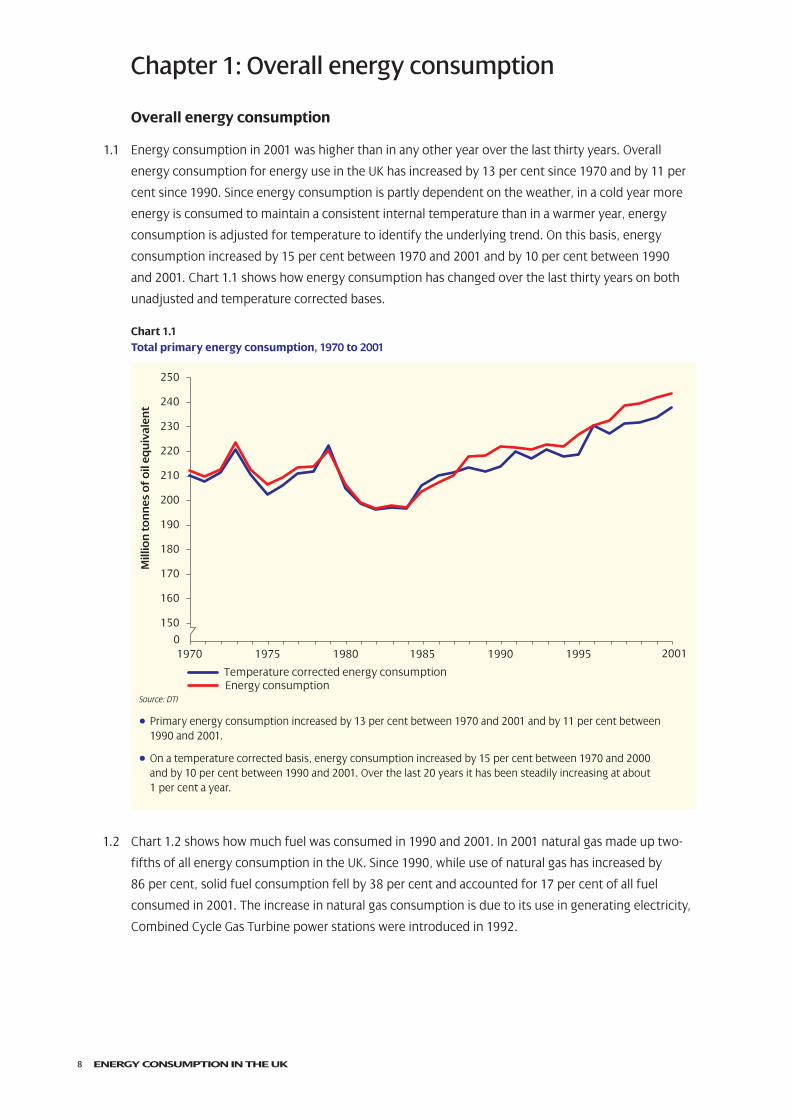
1.1 Energy consumption in 2001 was higher than in any other year over the last thirty years. Overall
energy consumption for energy use in the UK has increased by 13 per cent since 1970 and by 11 per
cent since 1990. Since energy consumption is partly dependent on the weather, in a cold year more
energy is consumed to maintain a consistent internal temperature than in a warmer year, energy
consumption is adjusted for temperature to identify the underlying trend. On this basis, energy
consumption increased by 15 per cent between 1970 and 2001 and by 10 per cent between 1990
and 2001. Chart 1.1 shows how energy consumption has changed over the last thirty years on both
unadjusted and temperature corrected bases.
Chart 1.1Total primary energy consumption, 1970 to 2001
Source: DTI
• Primary energy consumption increased by 13 per cent between 1970 and 2001 and by 11 per cent between 1990 and 2001.
• On a temperature corrected basis, energy consumption increased by 15 per cent between 1970 and 2000 and by 10 per cent between 1990 and 2001. Over the last 20 years it has been steadily increasing at about 1 per cent a year.
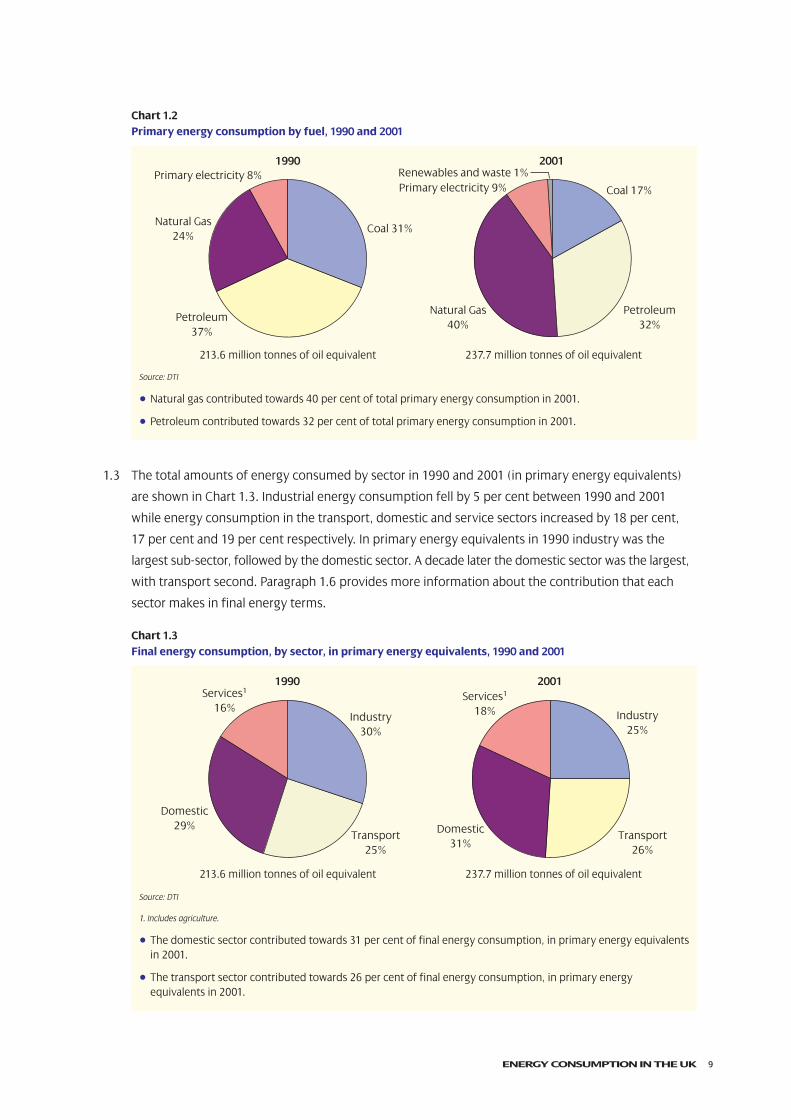
1.2 Chart 1.2 shows how much fuel was consumed in 1990 and 2001. In 2001 natural gas made up two-
fifths of all energy consumption in the UK. Since 1990, while use of natural gas has increased by
86 per cent, solid fuel consumption fell by 38 per cent and accounted for 17 per cent of all fuel
consumed in 2001. The increase in natural gas consumption is due to its use in generating electricity,
Combined Cycle Gas Turbine power stations were introduced in 1992.
Chapter 1: Overall energy consumption
ECUK 16/7/02 9:35 AM Page 8
1990 2001
Transport 25%
Transport 26%
Industry 25%
Industry 30%
Services1 16%
Services1 18%
Domestic 29% Domestic
31%
1990 2001
Petroleum 32%
Petroleum 37%
Natural Gas 40%
Natural Gas 24%
Primary electricity 8%Primary electricity 9%Renewables and waste 1%
Coal 17%
Coal 31%
ENERGY CONSUMPTION IN THE UK 9
Chart 1.2Primary energy consumption by fuel, 1990 and 2001
Source: DTI
• Natural gas contributed towards 40 per cent of total primary energy consumption in 2001.
• Petroleum contributed towards 32 per cent of total primary energy consumption in 2001.
1.3 The total amounts of energy consumed by sector in 1990 and 2001 (in primary energy equivalents)
are shown in Chart 1.3. Industrial energy consumption fell by 5 per cent between 1990 and 2001
while energy consumption in the transport, domestic and service sectors increased by 18 per cent,
17 per cent and 19 per cent respectively. In primary energy equivalents in 1990 industry was the
largest sub-sector, followed by the domestic sector. A decade later the domestic sector was the largest,
with transport second. Paragraph 1.6 provides more information about the contribution that each
sector makes in final energy terms.
Chart 1.3Final energy consumption, by sector, in primary energy equivalents, 1990 and 2001
Source: DTI
1. Includes agriculture.
• The domestic sector contributed towards 31 per cent of final energy consumption, in primary energy equivalentsin 2001.
• The transport sector contributed towards 26 per cent of final energy consumption, in primary energyequivalents in 2001.
213.6 million tonnes of oil equivalent 237.7 million tonnes of oil equivalent
213.6 million tonnes of oil equivalent 237.7 million tonnes of oil equivalent
ECUK 16/7/02 9:35 AM Page 9
Mill
ion
to
nn
es o
f o
il eq
uiv
alen
t
0
20
40
60
80
100
120
140
160
180
Oil Gas Electricity Solid Fuels Other1
1970 1975 1980 1985 1990 1995 2001
ENERGY CONSUMPTION IN THE UK10
1.4 Some of the fuel consumed in the UK is transformed into electricity and other manufactured fuels,
which result in energy losses. On average for every 21⁄2 energy units of fuel that goes into power stations,
approximately 1 energy unit of electricity is produced. Since electricity is used for a wide range of
uses and trends in electricity consumption determine the levels of energy required to generate it,
the rest of this chapter focuses on final energy consumption. Final energy consumption covers
the final fuels that are consumed by users so the final amounts of electricity and manufactured solid
fuels are measured rather than the amount of fuel used to generate or manufacture them.
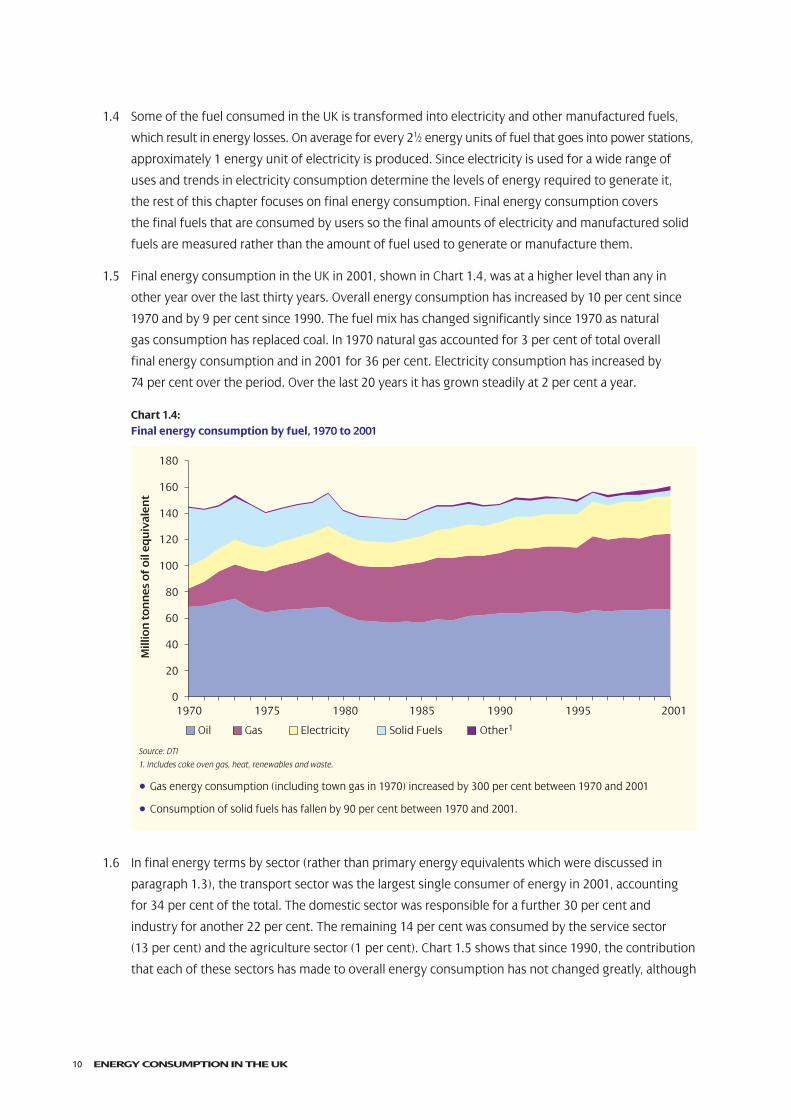
1.5 Final energy consumption in the UK in 2001, shown in Chart 1.4, was at a higher level than any in
other year over the last thirty years. Overall energy consumption has increased by 10 per cent since
1970 and by 9 per cent since 1990. The fuel mix has changed significantly since 1970 as natural
gas consumption has replaced coal. In 1970 natural gas accounted for 3 per cent of total overall
final energy consumption and in 2001 for 36 per cent. Electricity consumption has increased by
74 per cent over the period. Over the last 20 years it has grown steadily at 2 per cent a year.
Chart 1.4:Final energy consumption by fuel, 1970 to 2001
Source: DTI
1. Includes coke oven gas, heat, renewables and waste.
• Gas energy consumption (including town gas in 1970) increased by 300 per cent between 1970 and 2001
• Consumption of solid fuels has fallen by 90 per cent between 1970 and 2001.
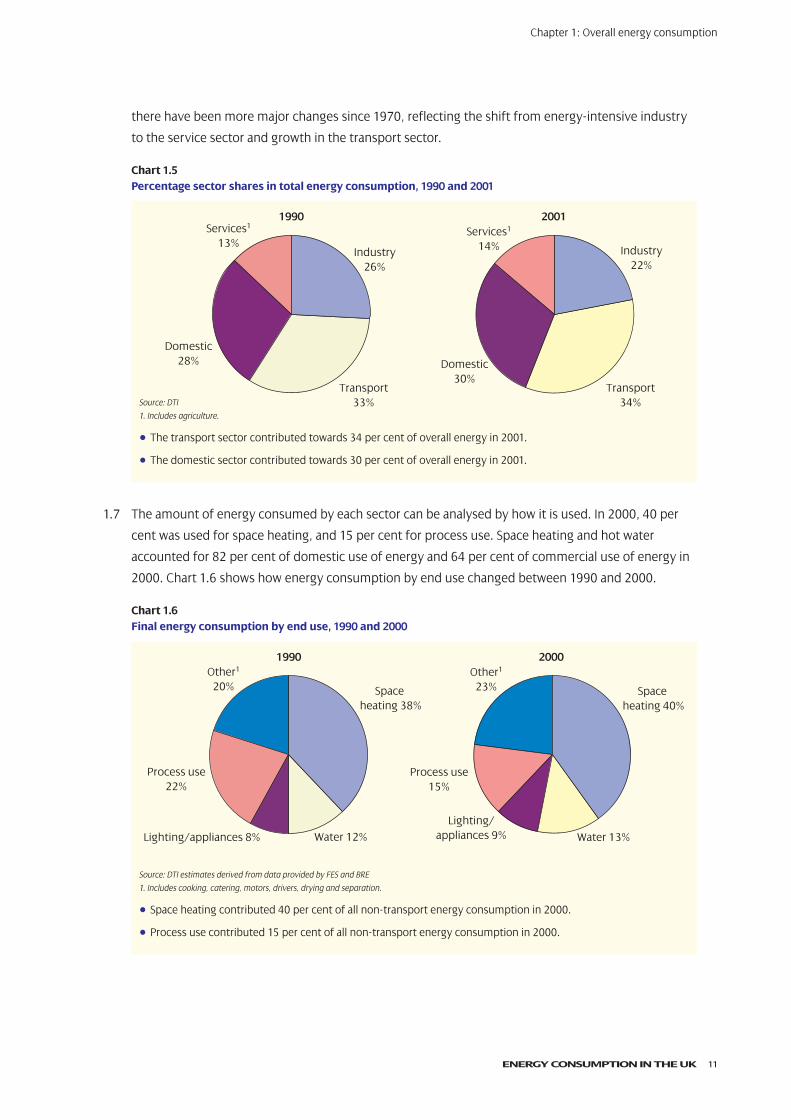
1.6 In final energy terms by sector (rather than primary energy equivalents which were discussed in
paragraph 1.3), the transport sector was the largest single consumer of energy in 2001, accounting
for 34 per cent of the total. The domestic sector was responsible for a further 30 per cent and
industry for another 22 per cent. The remaining 14 per cent was consumed by the service sector
(13 per cent) and the agriculture sector (1 per cent). Chart 1.5 shows that since 1990, the contribution
that each of these sectors has made to overall energy consumption has not changed greatly, although
ECUK 16/7/02 9:35 AM Page 10
1990 2000
Water 13%
Space heating 40%
Other1 23%
Lighting/ appliances 9%
Process use 15%
Water 12%
Space heating 38%
Other1 20%
Lighting/appliances 8%
Process use 22%
1990 2001
Transport 33%
Transport 34%
Industry 22%
Industry 26%
Services1 13%
Services1 14%
Domestic 28% Domestic
30%
ENERGY CONSUMPTION IN THE UK 11
there have been more major changes since 1970, reflecting the shift from energy-intensive industry
to the service sector and growth in the transport sector.
Chart 1.5Percentage sector shares in total energy consumption, 1990 and 2001
Source: DTI
1. Includes agriculture.
• The transport sector contributed towards 34 per cent of overall energy in 2001.
• The domestic sector contributed towards 30 per cent of overall energy in 2001.
1.7 The amount of energy consumed by each sector can be analysed by how it is used. In 2000, 40 per
cent was used for space heating, and 15 per cent for process use. Space heating and hot water
accounted for 82 per cent of domestic use of energy and 64 per cent of commercial use of energy in
2000. Chart 1.6 shows how energy consumption by end use changed between 1990 and 2000.
Chart 1.6Final energy consumption by end use, 1990 and 2000
Source: DTI estimates derived from data provided by FES and BRE
1. Includes cooking, catering, motors, drivers, drying and separation.
• Space heating contributed 40 per cent of all non-transport energy consumption in 2000.
• Process use contributed 15 per cent of all non-transport energy consumption in 2000.
Chapter 1: Overall energy consumption
ECUK 16/7/02 9:35 AM Page 11
-10.0
-5.0
0
5
10
15
20
Mill
ion
to
nn
es o
f o
il eq
uiv
alen
t Output effect Intensity effect Total change
Industry Transport Domestic Services Overall
ENERGY CONSUMPTION IN THE UK12
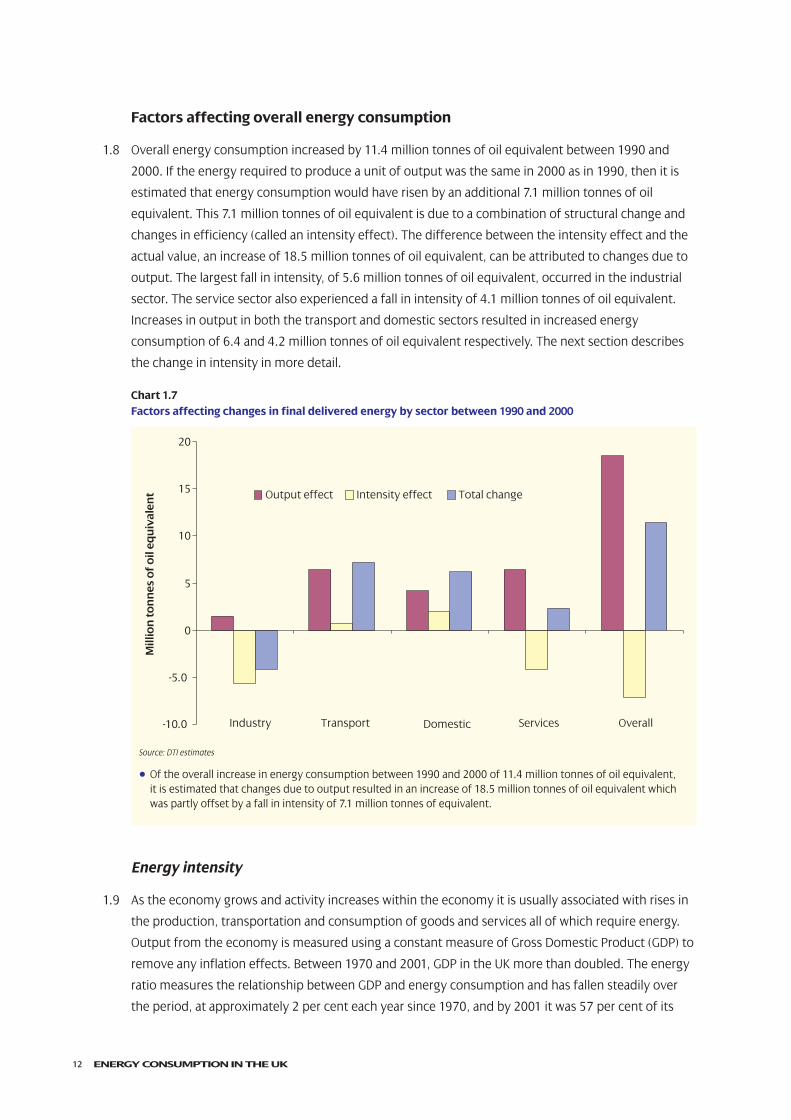
Factors affecting overall energy consumption
1.8 Overall energy consumption increased by 11.4 million tonnes of oil equivalent between 1990 and
2000. If the energy required to produce a unit of output was the same in 2000 as in 1990, then it is
estimated that energy consumption would have risen by an additional 7.1 million tonnes of oil
equivalent. This 7.1 million tonnes of oil equivalent is due to a combination of structural change and
changes in efficiency (called an intensity effect). The difference between the intensity effect and the
actual value, an increase of 18.5 million tonnes of oil equivalent, can be attributed to changes due to
output. The largest fall in intensity, of 5.6 million tonnes of oil equivalent, occurred in the industrial
sector. The service sector also experienced a fall in intensity of 4.1 million tonnes of oil equivalent.
Increases in output in both the transport and domestic sectors resulted in increased energy
consumption of 6.4 and 4.2 million tonnes of oil equivalent respectively. The next section describes
the change in intensity in more detail.
Chart 1.7Factors affecting changes in final delivered energy by sector between 1990 and 2000
Source: DTI estimates
• Of the overall increase in energy consumption between 1990 and 2000 of 11.4 million tonnes of oil equivalent, it is estimated that changes due to output resulted in an increase of 18.5 million tonnes of oil equivalent whichwas partly offset by a fall in intensity of 7.1 million tonnes of equivalent.
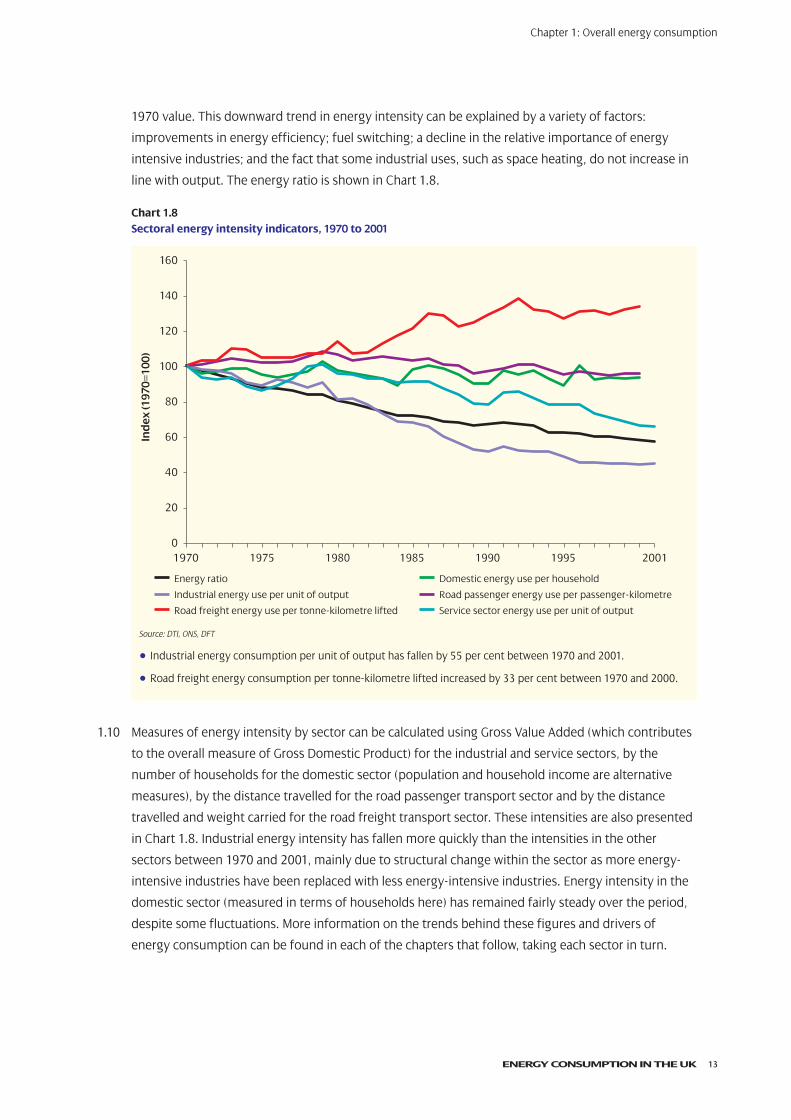
Energy intensity
1.9 As the economy grows and activity increases within the economy it is usually associated with rises in
the production, transportation and consumption of goods and services all of which require energy.
Output from the economy is measured using a constant measure of Gross Domestic Product (GDP) to
remove any inflation effects. Between 1970 and 2001, GDP in the UK more than doubled. The energy
ratio measures the relationship between GDP and energy consumption and has fallen steadily over
the period, at approximately 2 per cent each year since 1970, and by 2001 it was 57 per cent of its
ECUK 16/7/02 9:35 AM Page 12
1970 1975 1980 1985 1990 1995
Ind
ex (1
970=
100)
20010
20
40
60
80
100
120
140
160
Energy ratio
Industrial energy use per unit of output
Road freight energy use per tonne-kilometre lifted
Domestic energy use per household
Road passenger energy use per passenger-kilometre
Service sector energy use per unit of output
ENERGY CONSUMPTION IN THE UK 13
1970 value. This downward trend in energy intensity can be explained by a variety of factors:
improvements in energy efficiency; fuel switching; a decline in the relative importance of energy
intensive industries; and the fact that some industrial uses, such as space heating, do not increase in
line with output. The energy ratio is shown in Chart 1.8.
Chart 1.8Sectoral energy intensity indicators, 1970 to 2001
Source: DTI, ONS, DFT
• Industrial energy consumption per unit of output has fallen by 55 per cent between 1970 and 2001.
• Road freight energy consumption per tonne-kilometre lifted increased by 33 per cent between 1970 and 2000.
1.10 Measures of energy intensity by sector can be calculated using Gross Value Added (which contributes
to the overall measure of Gross Domestic Product) for the industrial and service sectors, by the
number of households for the domestic sector (population and household income are alternative
measures), by the distance travelled for the road passenger transport sector and by the distance
travelled and weight carried for the road freight transport sector. These intensities are also presented
in Chart 1.8. Industrial energy intensity has fallen more quickly than the intensities in the other
sectors between 1970 and 2001, mainly due to structural change within the sector as more energy-
intensive industries have been replaced with less energy-intensive industries. Energy intensity in the
domestic sector (measured in terms of households here) has remained fairly steady over the period,
despite some fluctuations. More information on the trends behind these figures and drivers of
energy consumption can be found in each of the chapters that follow, taking each sector in turn.
Chapter 1: Overall energy consumption
ECUK 16/7/02 9:35 AM Page 13
0
5
10
15
20
25
30
35
40
45
1970 1980 1990 2001
Rail Road Water Air
Mill
ion
to
nn
es o
f o
il eq
uiv
alen
t
ENERGY CONSUMPTION IN THE UK14
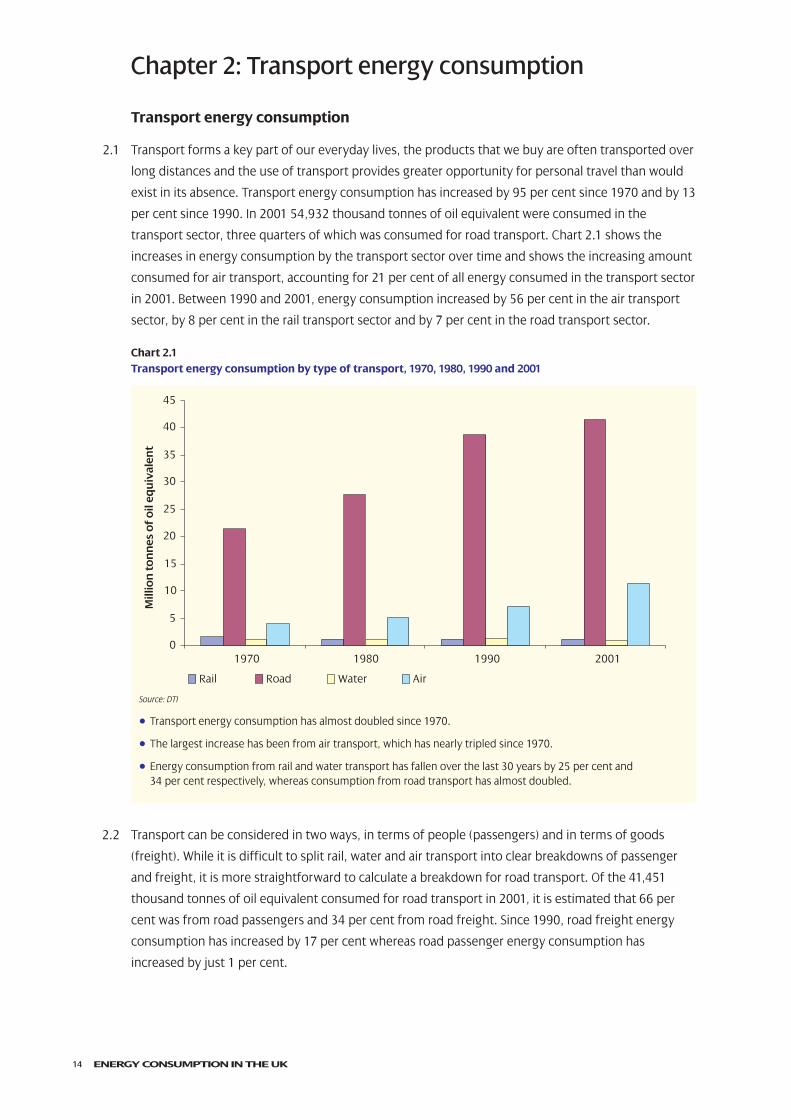
Transport energy consumption
2.1 Transport forms a key part of our everyday lives, the products that we buy are often transported over
long distances and the use of transport provides greater opportunity for personal travel than would
exist in its absence. Transport energy consumption has increased by 95 per cent since 1970 and by 13
per cent since 1990. In 2001 54,932 thousand tonnes of oil equivalent were consumed in the
transport sector, three quarters of which was consumed for road transport. Chart 2.1 shows the
increases in energy consumption by the transport sector over time and shows the increasing amount
consumed for air transport, accounting for 21 per cent of all energy consumed in the transport sector
in 2001. Between 1990 and 2001, energy consumption increased by 56 per cent in the air transport
sector, by 8 per cent in the rail transport sector and by 7 per cent in the road transport sector.
Chart 2.1Transport energy consumption by type of transport, 1970, 1980, 1990 and 2001
Source: DTI
• Transport energy consumption has almost doubled since 1970.
• The largest increase has been from air transport, which has nearly tripled since 1970.
• Energy consumption from rail and water transport has fallen over the last 30 years by 25 per cent and 34 per cent respectively, whereas consumption from road transport has almost doubled.
2.2 Transport can be considered in two ways, in terms of people (passengers) and in terms of goods
(freight). While it is difficult to split rail, water and air transport into clear breakdowns of passenger
and freight, it is more straightforward to calculate a breakdown for road transport. Of the 41,451
thousand tonnes of oil equivalent consumed for road transport in 2001, it is estimated that 66 per
cent was from road passengers and 34 per cent from road freight. Since 1990, road freight energy
consumption has increased by 17 per cent whereas road passenger energy consumption has
increased by just 1 per cent.
Chapter 2: Transport energy consumption
ECUK 16/7/02 9:35 AM Page 14
Cars 62%
HGV 21%
LGV 14%
Buses and motorcycles 3%
ENERGY CONSUMPTION IN THE UK 15
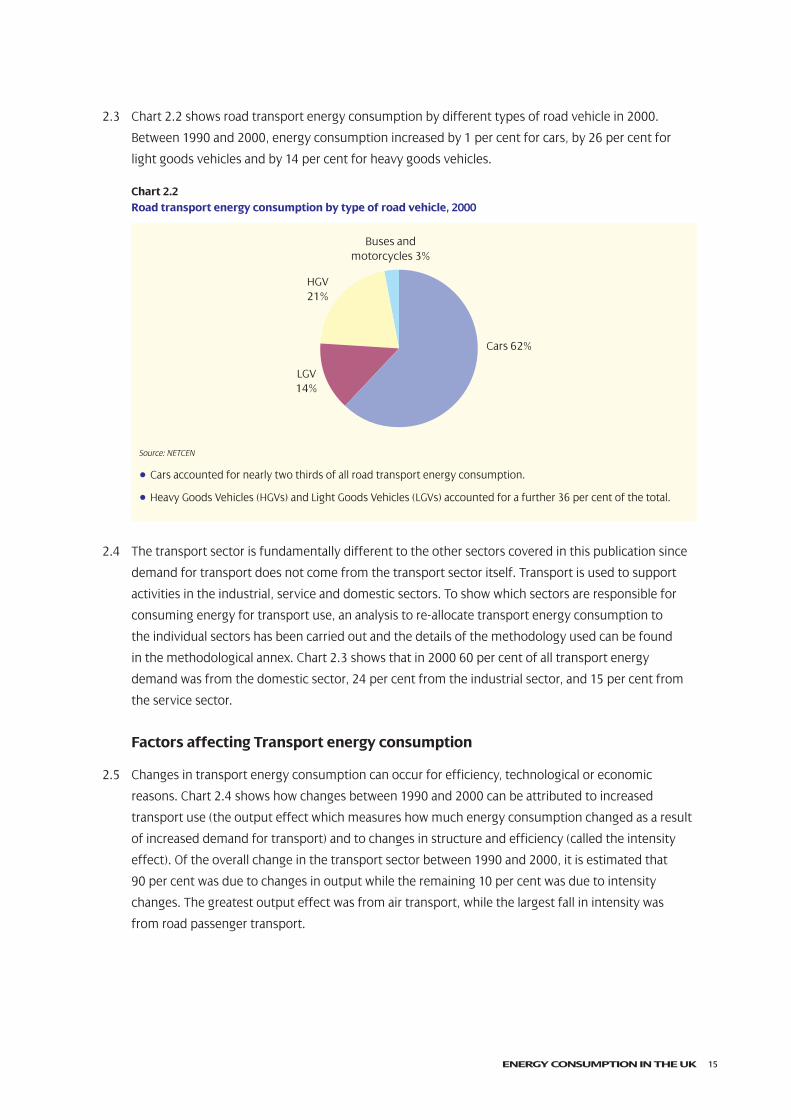
2.3 Chart 2.2 shows road transport energy consumption by different types of road vehicle in 2000.
Between 1990 and 2000, energy consumption increased by 1 per cent for cars, by 26 per cent for
light goods vehicles and by 14 per cent for heavy goods vehicles.
Chart 2.2Road transport energy consumption by type of road vehicle, 2000
Source: NETCEN
• Cars accounted for nearly two thirds of all road transport energy consumption.
• Heavy Goods Vehicles (HGVs) and Light Goods Vehicles (LGVs) accounted for a further 36 per cent of the total.
2.4 The transport sector is fundamentally different to the other sectors covered in this publication since
demand for transport does not come from the transport sector itself. Transport is used to support
activities in the industrial, service and domestic sectors. To show which sectors are responsible for
consuming energy for transport use, an analysis to re-allocate transport energy consumption to
the individual sectors has been carried out and the details of the methodology used can be found
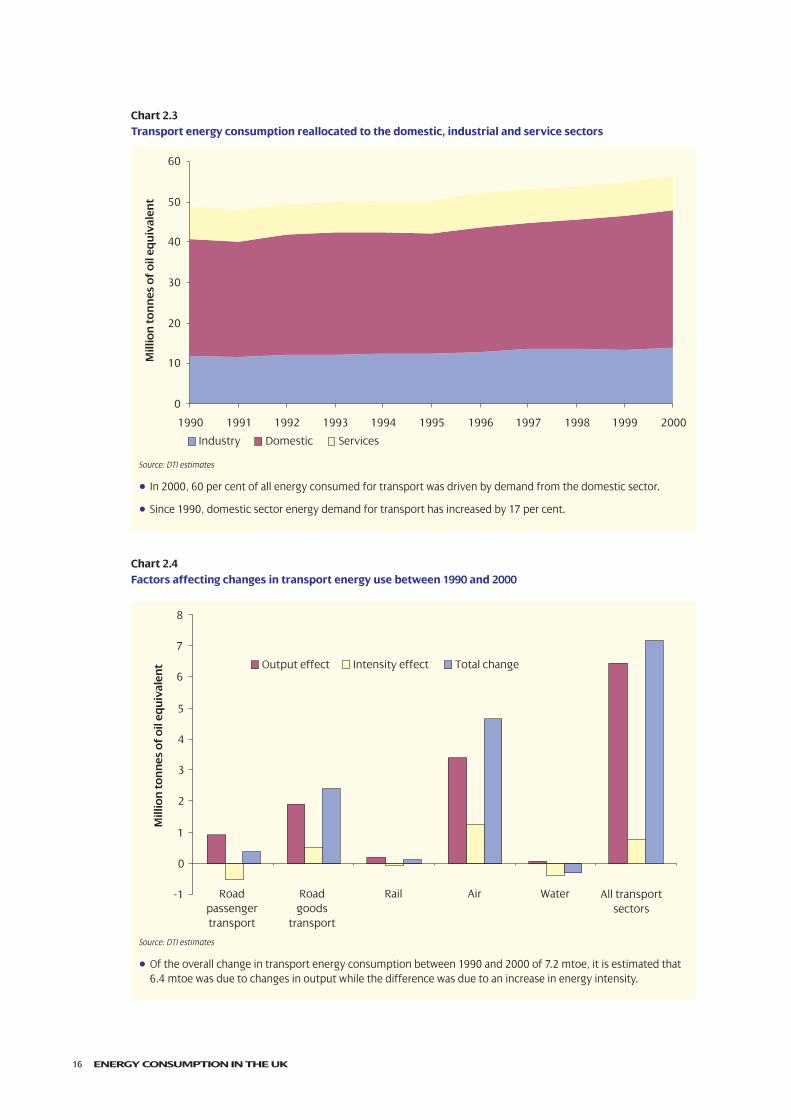
in the methodological annex. Chart 2.3 shows that in 2000 60 per cent of all transport energy
demand was from the domestic sector, 24 per cent from the industrial sector, and 15 per cent from
the service sector.
Factors affecting Transport energy consumption
2.5 Changes in transport energy consumption can occur for efficiency, technological or economic
reasons. Chart 2.4 shows how changes between 1990 and 2000 can be attributed to increased
transport use (the output effect which measures how much energy consumption changed as a result
of increased demand for transport) and to changes in structure and efficiency (called the intensity
effect). Of the overall change in the transport sector between 1990 and 2000, it is estimated that
90 per cent was due to changes in output while the remaining 10 per cent was due to intensity
changes. The greatest output effect was from air transport, while the largest fall in intensity was
from road passenger transport.
ECUK 16/7/02 9:35 AM Page 15
Output effect Intensity effect Total change
-1
0
1
2
3
4
5
6
7
8
Road passenger transport
Road goods
transport
Rail Air Water All transport sectors
Mill
ion
to
nn
es o
f o
il eq
uiv
alen
t
0
10
20
30
40
50
60
1990 1991 1992 1993 1994 1995 1996 1997 1998 1999 2000
Industry Domestic Services
Mill
ion
to
nn
es o
f o
il eq
uiv
alen
t
ENERGY CONSUMPTION IN THE UK16
Chart 2.3Transport energy consumption reallocated to the domestic, industrial and service sectors
Source: DTI estimates
• In 2000, 60 per cent of all energy consumed for transport was driven by demand from the domestic sector.
• Since 1990, domestic sector energy demand for transport has increased by 17 per cent.
Chart 2.4Factors affecting changes in transport energy use between 1990 and 2000
Source: DTI estimates
• Of the overall change in transport energy consumption between 1990 and 2000 of 7.2 mtoe, it is estimated that6.4 mtoe was due to changes in output while the difference was due to an increase in energy intensity.
ECUK 16/7/02 9:35 AM Page 16

Mill
ion
s
0
20
40
60
80
100
120
1990 1991 1992 1993 1994 1995 1996 1997 1998 1999 2000
ENERGY CONSUMPTION IN THE UK 17
Increased demand for travel
2.6 Energy consumption by air transport has increased due to improvements in airline design and
technology, the continued growth of trade, and the rise in leisure travel over the last thirty years, as
shown in Chart 2.5. There has been a 73 per cent growth between 1990 and 2000 in total passengers
lifted by United Kingdom airlines, while total air transport movements, combining take-offs and
landings, by United Kingdom airlines have increased by 40 per cent. The average distance travelled
on UK airlines on international flights was 2,564 kilometres per air traveller in 1990 and 2,959
kilometres per air traveller in 2000, a rise of 15 per cent. Although larger, more efficient aircraft are
now used, occupancy rates have remained between 74 and 79 per cent since 1990.
Chart 2.5Passenger numbers between the UK and abroad
Source: DFT
• Passenger numbers increased by 73 per cent between 1990 and 2000.
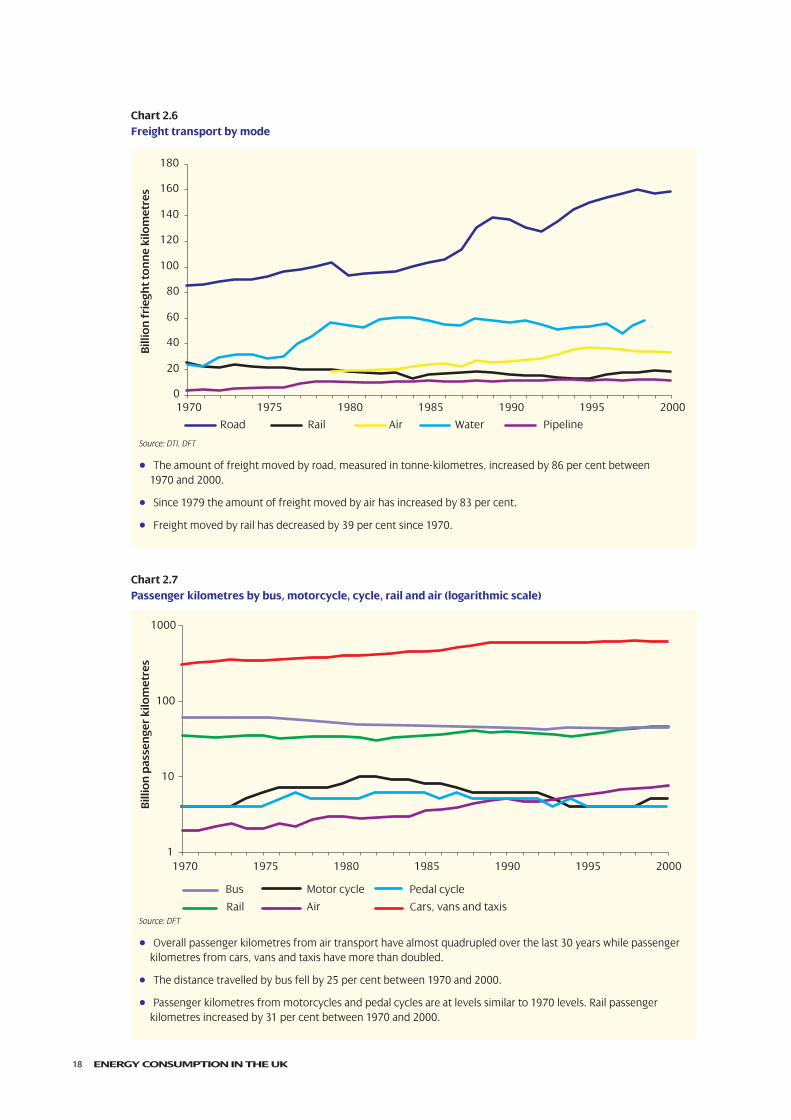
2.7 The change in the amount of freight moved, measured in tonne-kilometres, is shown in Chart 2.6.
A total of 220 billion tonne-kilometres of freight were moved by road, rail, air and pipeline in 2000,
half of which were met by road. Between 1970 and 2000 the amount of freight moved by road rose
by 86 per cent. The increase has been driven by increased economic activity (GDP rose by 98 per cent
between 1970 and 2000), and has been enabled by an improved road network that can accommodate
larger and heavier vehicles. The number of articulated trucks over 33 tonnes rose from 63,000 in
1991 to 91,000 in 2001.
2.8 Chart 2.7 shows passenger kilometres by different types of transport. In 2000, 721 billion passenger
kilometres were travelled in Great Britain. This corresponds to 12 thousand kilometres per person.
Passenger kilometres from air and rail have increased since 1970, whereas passenger kilometres from
buses have fallen over the same time period.
Chapter 2: Transport energy consumption
ECUK 16/7/02 9:35 AM Page 17
0
20
40
60
80
100
120
140
160
180
1970 1975 1980 1985 1990 1995 2000
Bill
ion
fri
egh
t to
nn
e ki
lom
etre
s
Road Rail Air Water Pipeline
1970 1975 1980 1985 1990 1995 20001
10
100
1000
Bill
ion
pas
sen
ger
kilo
met
res
Bus Motor cycle Pedal cycle
Rail Air Cars, vans and taxis
ENERGY CONSUMPTION IN THE UK18
Chart 2.6Freight transport by mode
Source: DTI, DFT
• The amount of freight moved by road, measured in tonne-kilometres, increased by 86 per cent between 1970 and 2000.
• Since 1979 the amount of freight moved by air has increased by 83 per cent.
• Freight moved by rail has decreased by 39 per cent since 1970.
Chart 2.7Passenger kilometres by bus, motorcycle, cycle, rail and air (logarithmic scale)
Source: DFT
• Overall passenger kilometres from air transport have almost quadrupled over the last 30 years while passengerkilometres from cars, vans and taxis have more than doubled.
• The distance travelled by bus fell by 25 per cent between 1970 and 2000.
• Passenger kilometres from motorcycles and pedal cycles are at levels similar to 1970 levels. Rail passengerkilometres increased by 31 per cent between 1970 and 2000.
ECUK 16/7/02 9:35 AM Page 18
0
2
4
6
8
10
12
1970 1975 1980 1985 1990 1995 2000
Th
ou
san
d k
ilom
etre
s p
er p
erso
n
ENERGY CONSUMPTION IN THE UK 19
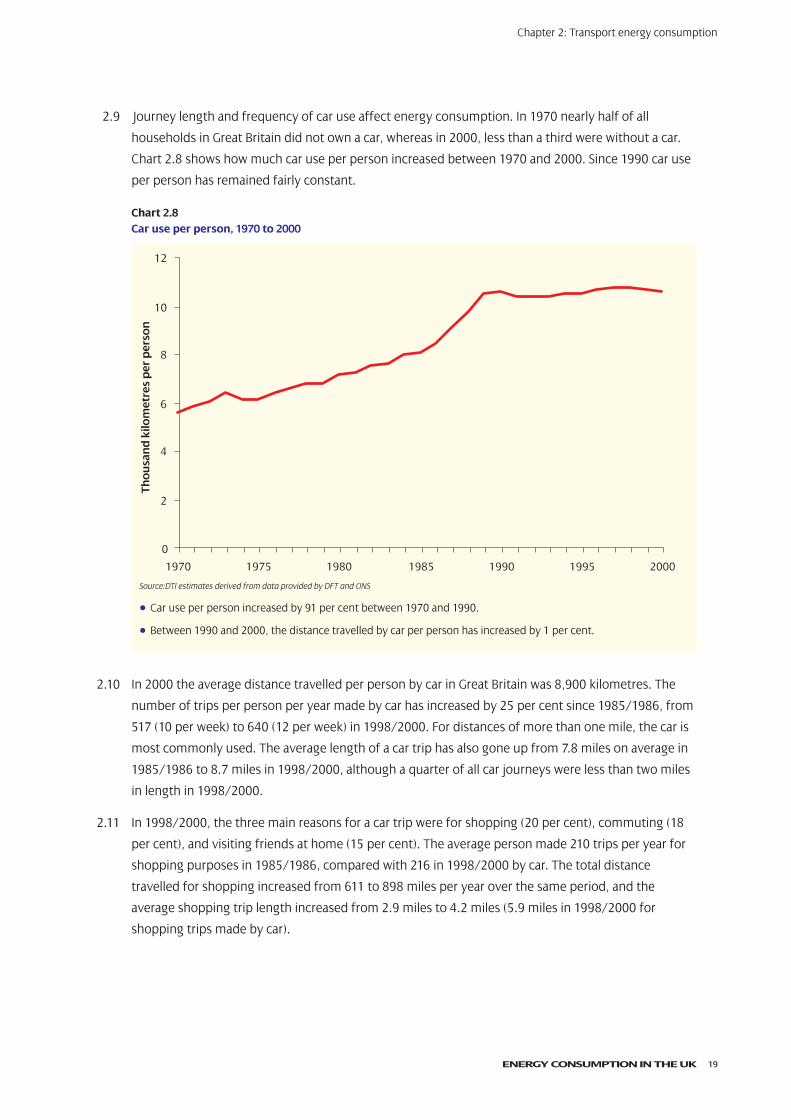
2.9 Journey length and frequency of car use affect energy consumption. In 1970 nearly half of all
households in Great Britain did not own a car, whereas in 2000, less than a third were without a car.
Chart 2.8 shows how much car use per person increased between 1970 and 2000. Since 1990 car use
per person has remained fairly constant.
Chart 2.8Car use per person, 1970 to 2000
Source:DTI estimates derived from data provided by DFT and ONS
• Car use per person increased by 91 per cent between 1970 and 1990.
• Between 1990 and 2000, the distance travelled by car per person has increased by 1 per cent.
2.10 In 2000 the average distance travelled per person by car in Great Britain was 8,900 kilometres. The
number of trips per person per year made by car has increased by 25 per cent since 1985/1986, from
517 (10 per week) to 640 (12 per week) in 1998/2000. For distances of more than one mile, the car is
most commonly used. The average length of a car trip has also gone up from 7.8 miles on average in
1985/1986 to 8.7 miles in 1998/2000, although a quarter of all car journeys were less than two miles
in length in 1998/2000.
2.11 In 1998/2000, the three main reasons for a car trip were for shopping (20 per cent), commuting (18
per cent), and visiting friends at home (15 per cent). The average person made 210 trips per year for
shopping purposes in 1985/1986, compared with 216 in 1998/2000 by car. The total distance
travelled for shopping increased from 611 to 898 miles per year over the same period, and the
average shopping trip length increased from 2.9 miles to 4.2 miles (5.9 miles in 1998/2000 for
shopping trips made by car).
Chapter 2: Transport energy consumption
ECUK 16/7/02 9:35 AM Page 19
ENERGY CONSUMPTION IN THE UK20
2.12 In autumn 2001, around 17 million people (70 per cent of those working) usually travelled to work by
car, compared with around 14 million people (68 per cent of those working) in autumn 1992. The
average distance between home and work increased, from 7.2 miles in 1989/1991 to 8.4 miles in
1998/2000. Car commuting averaged 9.4 miles per trip in 1998/2000, compared with 5.1 miles for
bus and 19.5 miles for rail. Car occupancy rates for commuting and business related journeys are low,
at an average of between 1.1 and 1.2 people per car. Average occupancy rates in 1998/2000 for
family holidays were 2.2 people per car, for education 2.1, and 1.9 for leisure.
2.13 A change in the way that transport is used is for the school run, accompanying children to and from
schools and after-school activities on a regular basis. In 1985/1986, 59 per cent of children aged
between 5 and 16 walked to school, compared with 49 per cent in 1998/2000, whereas the
proportion travelling by car increased from 16 per cent to 27 per cent over the same period. For
primary school children 56 per cent walked to school in 1998/2000 while 36 per cent were driven by
car whereas for secondary school children, 43 per cent walked while 19 per cent travelled by car.
After taking children to school in the morning, over three quarters of ‘escorts’ return straight home.
Between 8am and 9am during term time, about one car in ten on the road in urban areas was on the
school run in 1998/2000.
2.14 Congestion arises when the volume of traffic exceeds road capacity, although the actual causes are
complex. The capacity of the road network has increased at a lower rate than actual traffic; lane
kilometres have increased by about a third since 1960, while traffic has roughly quadrupled.
Congestion has proved not to be a deterrent for people choosing to travel by car.
Changes in energy intensity
2.15 Energy consumption can be measured in relation to distance travelled and load carried to provide a
measure of energy intensity. For road transport this would be measured as energy consumption per
passenger-kilometre or freight tonne-kilometre. Road freight needs to be treated differently to road
passenger travel since the weight carried will have an impact on the amount of energy consumed.
Since it is difficult to weight the two measures together they are considered separately. Air transport
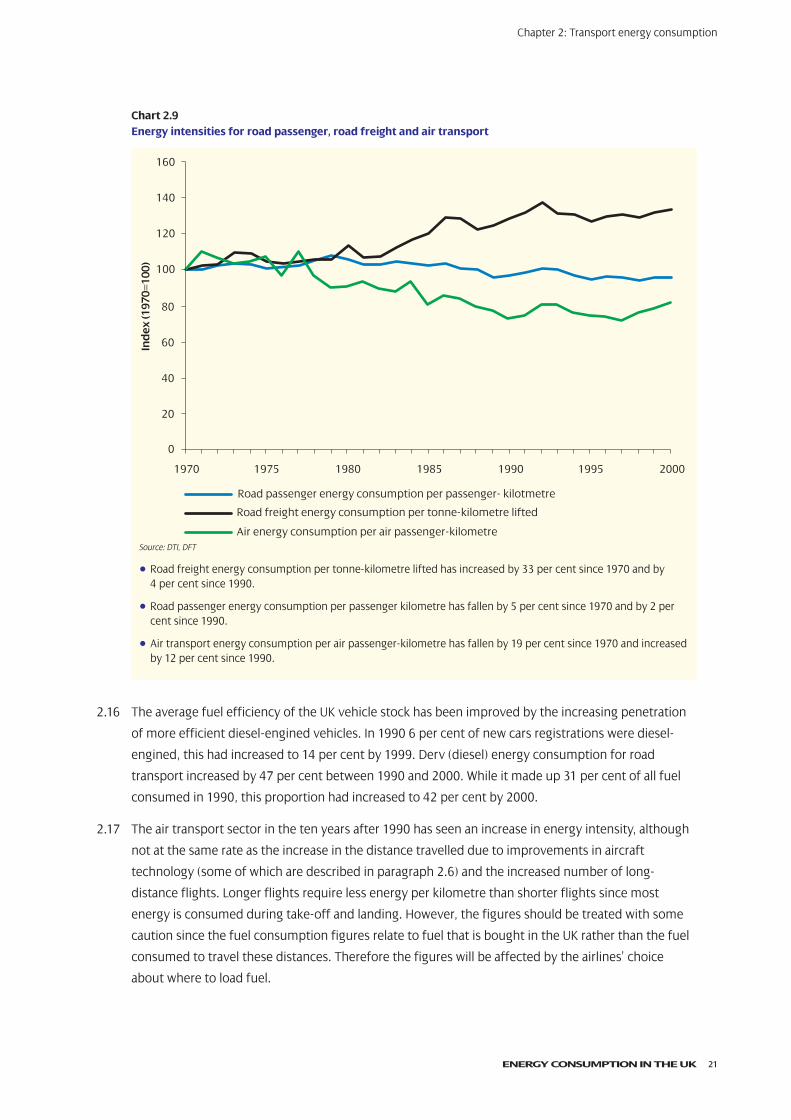
energy intensity can be measured as energy consumption per air passenger-kilometre. Chart 2.9
shows how road passenger, road freight and air transport energy intensities have changed since
1970. While the largest increase has been for road freight, most of the increase mainly occurred
during the 1980s when energy consumption increased at a higher rate than the number of freight-
tonne kilometres travelled. Road freight energy intensity has increased by 4 per cent since 1990.
Energy intensity in the road passenger sub-sector has fallen by 2 per cent since 1990, as energy
consumption has not increased in line with distances travelled due to improvements in fuel
efficiencies and vehicle technology, despite demand for improved safety features, power steering
and air conditioning that have resulted in heavier vehicles.
ECUK 16/7/02 9:35 AM Page 20
0
20
40
60
80
100
120
140
160
1970 1975 1980 1985 1990 1995 2000
Ind
ex (1
970=
100)
Road passenger energy consumption per passenger- kilotmetre
Road freight energy consumption per tonne-kilometre lifted
Air energy consumption per air passenger-kilometre
ENERGY CONSUMPTION IN THE UK 21
Chart 2.9Energy intensities for road passenger, road freight and air transport
Source: DTI, DFT
• Road freight energy consumption per tonne-kilometre lifted has increased by 33 per cent since 1970 and by 4 per cent since 1990.
• Road passenger energy consumption per passenger kilometre has fallen by 5 per cent since 1970 and by 2 percent since 1990.
• Air transport energy consumption per air passenger-kilometre has fallen by 19 per cent since 1970 and increasedby 12 per cent since 1990.
2.16 The average fuel efficiency of the UK vehicle stock has been improved by the increasing penetration
of more efficient diesel-engined vehicles. In 1990 6 per cent of new cars registrations were diesel-
engined, this had increased to 14 per cent by 1999. Derv (diesel) energy consumption for road
transport increased by 47 per cent between 1990 and 2000. While it made up 31 per cent of all fuel
consumed in 1990, this proportion had increased to 42 per cent by 2000.
2.17 The air transport sector in the ten years after 1990 has seen an increase in energy intensity, although
not at the same rate as the increase in the distance travelled due to improvements in aircraft
technology (some of which are described in paragraph 2.6) and the increased number of long-
distance flights. Longer flights require less energy per kilometre than shorter flights since most
energy is consumed during take-off and landing. However, the figures should be treated with some
caution since the fuel consumption figures relate to fuel that is bought in the UK rather than the fuel
consumed to travel these distances. Therefore the figures will be affected by the airlines’ choice
about where to load fuel.
Chapter 2: Transport energy consumption
ECUK 16/7/02 9:35 AM Page 21
ENERGY CONSUMPTION IN THE UK22
Gross Domestic Product and Income
2.18 As the economy grows and activity increases within the economy, there is increased demand for
transport as higher disposable incomes enable more people to travel over longer distances and
demand for products increases requiring a higher level of freight transportation. Between 1970 and
2001, Gross Domestic Product (GDP) in the UK rose by 102 per cent, and between 1990 and 2001 by
28 per cent.
2.19 Income also has an impact on how transport is used. Net national disposable income has increased by
30 per cent between 1990 and 2000. However, those in low-income groups are less likely to own a car,
and are more likely to travel in larger groups. In Great Britain in 1998/2000 65 per cent of households
in the lowest income quintile did not have a car, and only 4 per cent had two or more. Average car
occupancy for this income quintile was 2.1 people compared with 1.4 people in the highest
household income quintile. The higher the level of occupancy, the less energy consumed per person.
2.20 Car travel increases with income. Those in low-income groups make fewer trips than those in high-
income groups. On average, people living in households in the lowest income quintile made 317 car
trips a year in 1998/2000 while the average individual made 640 trips. People living in households in
the highest income quintile group make the highest use of cars, at 850 trips a year. The majority of
trips by those with low incomes are made as passengers whereas the majority of trips made by those
with high incomes are made as drivers. In addition, the average length of car trips also varies by
income, from 7.0 miles for trips made by people in the lowest income quintile group, to 10.6 miles
for those in the highest group.
ECUK 16/7/02 9:35 AM Page 22
0
10
20
30
40
50
60
1970 1975 1980 1985 1990 1995 2000
Mill
ion
to
nn
es o
f o
il eq
uiv
alen
t
Space heating Water
Cooking Lighting and appliances
Total
ENERGY CONSUMPTION IN THE UK 23
Domestic energy consumption
3.1 Domestic energy consumption has increased by 32 per cent since 1970 and by 19 per cent since
1990. Since 1990 the number of households has increased by 10 per cent, population has increased
by 4 per cent and household disposable income has increased by 30 per cent. Energy efficiency
improvements, such as increased levels of insulation and the introduction of more efficient electrical
appliances, have meant that domestic energy consumption has not increased at a greater rate. This
chapter will look at the purposes for which energy is used in the domestic sector and the drivers of
domestic energy consumption which can potentially lead to more or less energy being consumed.
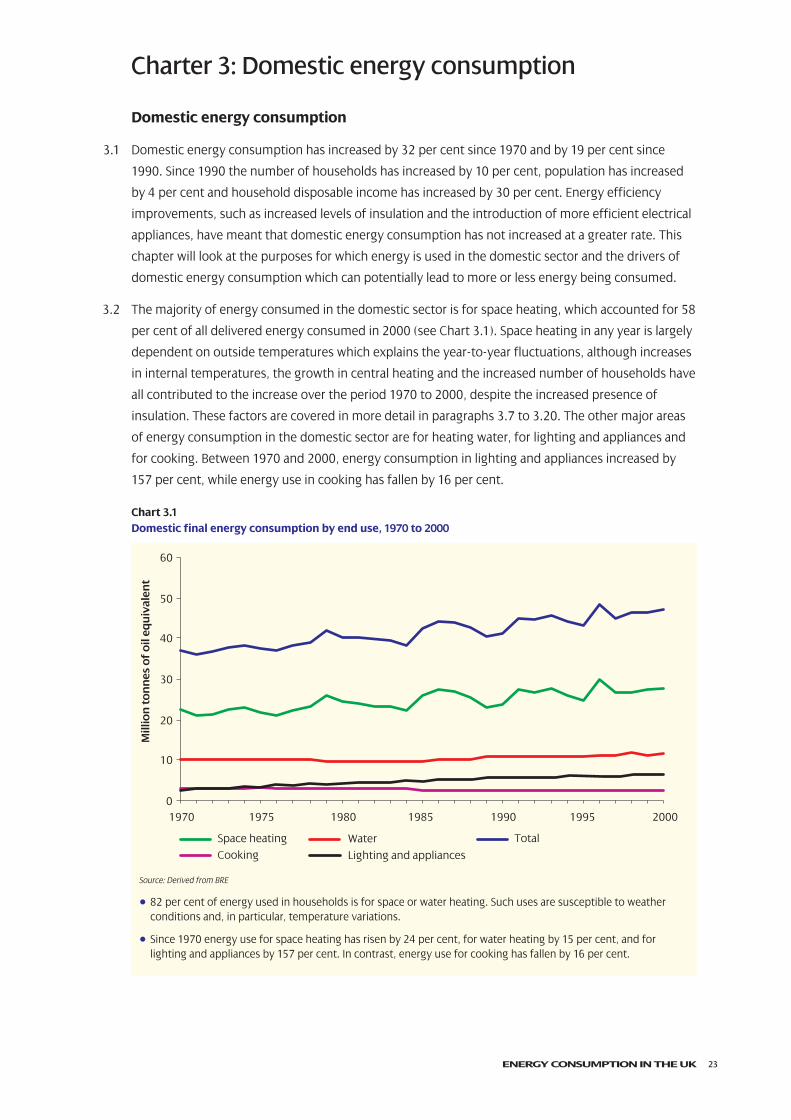
3.2 The majority of energy consumed in the domestic sector is for space heating, which accounted for 58
per cent of all delivered energy consumed in 2000 (see Chart 3.1). Space heating in any year is largely
dependent on outside temperatures which explains the year-to-year fluctuations, although increases
in internal temperatures, the growth in central heating and the increased number of households have
all contributed to the increase over the period 1970 to 2000, despite the increased presence of
insulation. These factors are covered in more detail in paragraphs 3.7 to 3.20. The other major areas
of energy consumption in the domestic sector are for heating water, for lighting and appliances and
for cooking. Between 1970 and 2000, energy consumption in lighting and appliances increased by
157 per cent, while energy use in cooking has fallen by 16 per cent.
Chart 3.1Domestic final energy consumption by end use, 1970 to 2000
Source: Derived from BRE
• 82 per cent of energy used in households is for space or water heating. Such uses are susceptible to weatherconditions and, in particular, temperature variations.
• Since 1970 energy use for space heating has risen by 24 per cent, for water heating by 15 per cent, and forlighting and appliances by 157 per cent. In contrast, energy use for cooking has fallen by 16 per cent.
Charter 3: Domestic energy consumption
ECUK 16/7/02 9:35 AM Page 23
0
200
400
600
800
1,000
1,200
1,400
1,600
1970 1980 1990 2000
Th
ou
san
d t
on
nes
of
oil
equ
ival
ent
Lighting Cold
Cooking Brown
Wet
Miscellaneous
ENERGY CONSUMPTION IN THE UK24
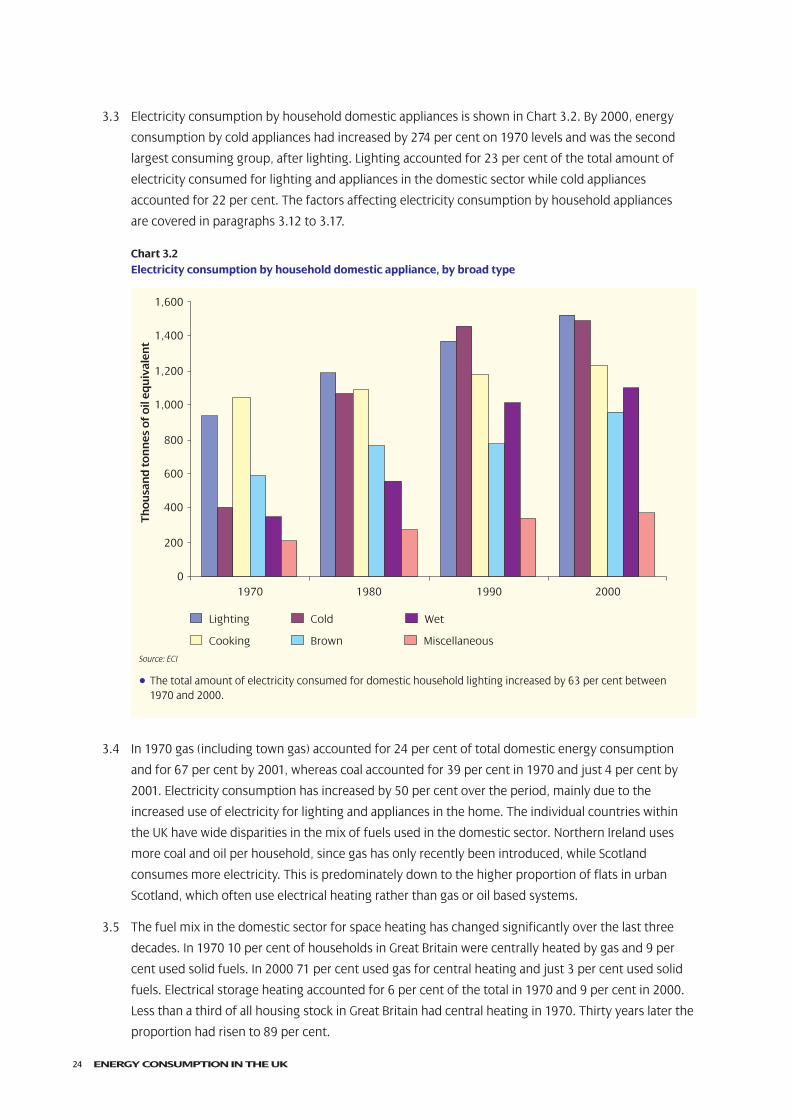
3.3 Electricity consumption by household domestic appliances is shown in Chart 3.2. By 2000, energy
consumption by cold appliances had increased by 274 per cent on 1970 levels and was the second
largest consuming group, after lighting. Lighting accounted for 23 per cent of the total amount of
electricity consumed for lighting and appliances in the domestic sector while cold appliances
accounted for 22 per cent. The factors affecting electricity consumption by household appliances
are covered in paragraphs 3.12 to 3.17.
Chart 3.2Electricity consumption by household domestic appliance, by broad type
Source: ECI
• The total amount of electricity consumed for domestic household lighting increased by 63 per cent between1970 and 2000.
3.4 In 1970 gas (including town gas) accounted for 24 per cent of total domestic energy consumption
and for 67 per cent by 2001, whereas coal accounted for 39 per cent in 1970 and just 4 per cent by
2001. Electricity consumption has increased by 50 per cent over the period, mainly due to the
increased use of electricity for lighting and appliances in the home. The individual countries within
the UK have wide disparities in the mix of fuels used in the domestic sector. Northern Ireland uses
more coal and oil per household, since gas has only recently been introduced, while Scotland
consumes more electricity. This is predominately down to the higher proportion of flats in urban
Scotland, which often use electrical heating rather than gas or oil based systems.
3.5 The fuel mix in the domestic sector for space heating has changed significantly over the last three
decades. In 1970 10 per cent of households in Great Britain were centrally heated by gas and 9 per
cent used solid fuels. In 2000 71 per cent used gas for central heating and just 3 per cent used solid
fuels. Electrical storage heating accounted for 6 per cent of the total in 1970 and 9 per cent in 2000.
Less than a third of all housing stock in Great Britain had central heating in 1970. Thirty years later the
proportion had risen to 89 per cent.
ECUK 16/7/02 9:35 AM Page 24
40
50
60
70
80
90
100
110
120
130
1970 1975 1980 1985 1990 1995 2000
Ind
ex (1
970=
100)
Energy use per person
Energy use per household
Energy use per unit of household disposable income
0
ENERGY CONSUMPTION IN THE UK 25
Factors affecting domestic energy consumption
The number of households, population and income
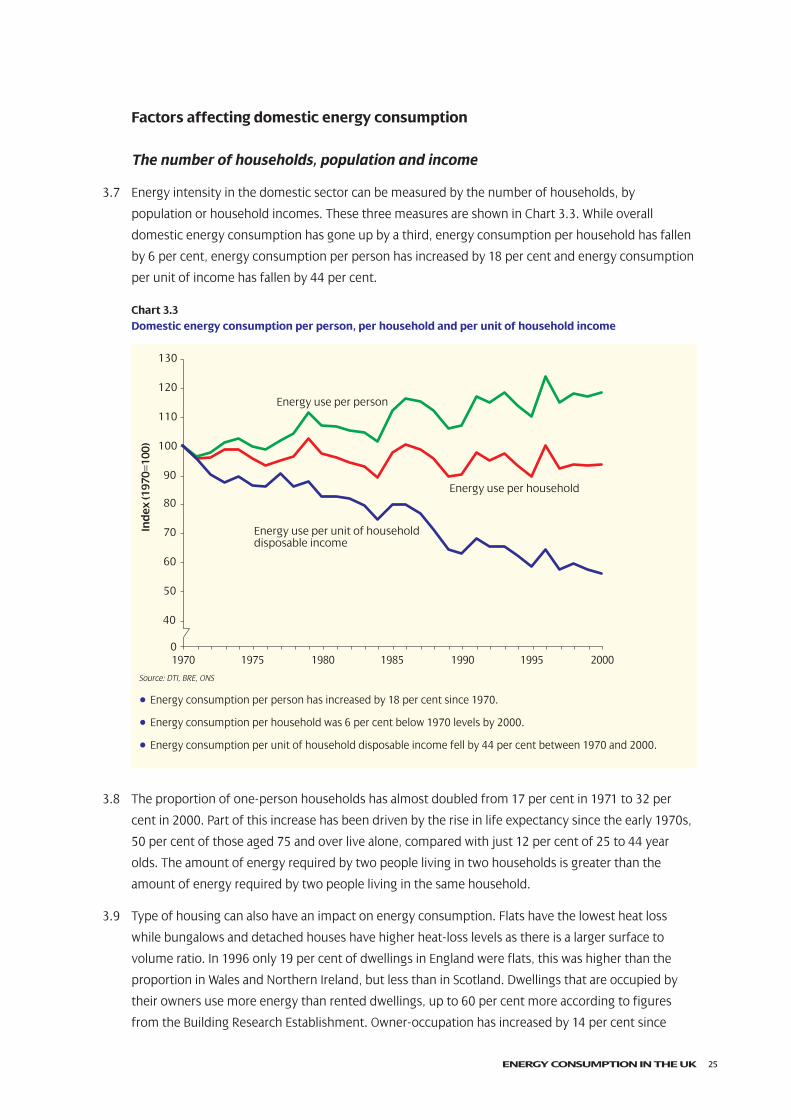
3.7 Energy intensity in the domestic sector can be measured by the number of households, by
population or household incomes. These three measures are shown in Chart 3.3. While overall
domestic energy consumption has gone up by a third, energy consumption per household has fallen
by 6 per cent, energy consumption per person has increased by 18 per cent and energy consumption
per unit of income has fallen by 44 per cent.
Chart 3.3Domestic energy consumption per person, per household and per unit of household income
Source: DTI, BRE, ONS
• Energy consumption per person has increased by 18 per cent since 1970.
• Energy consumption per household was 6 per cent below 1970 levels by 2000.
• Energy consumption per unit of household disposable income fell by 44 per cent between 1970 and 2000.
3.8 The proportion of one-person households has almost doubled from 17 per cent in 1971 to 32 per
cent in 2000. Part of this increase has been driven by the rise in life expectancy since the early 1970s,
50 per cent of those aged 75 and over live alone, compared with just 12 per cent of 25 to 44 year
olds. The amount of energy required by two people living in two households is greater than the
amount of energy required by two people living in the same household.
3.9 Type of housing can also have an impact on energy consumption. Flats have the lowest heat loss
while bungalows and detached houses have higher heat-loss levels as there is a larger surface to
volume ratio. In 1996 only 19 per cent of dwellings in England were flats, this was higher than the
proportion in Wales and Northern Ireland, but less than in Scotland. Dwellings that are occupied by
their owners use more energy than rented dwellings, up to 60 per cent more according to figures
from the Building Research Establishment. Owner-occupation has increased by 14 per cent since
ECUK 16/7/02 9:35 AM Page 25
ENERGY CONSUMPTION IN THE UK26
1979. However, much of the difference between buildings is due to differences between dwelling
types and ages in the different tenures.
3.10 In Great Britain 40 per cent of the housing stock was built before 1945, 46 per cent between 1945 and
1984, and 14 per cent after 1984. Newer houses have to conform to much higher energy efficiency
standards than previous building stock. However, considerable improvements in insulation standards
in existing homes have offset some of the energy losses that would have otherwise been incurred.
Temperature
3.11 When it is cold outside, more energy is used in the domestic sector for space heating. While the
average external temperature was 5.8ºC in 1970, it had risen to 7.2ºC by 2000. Households are also
kept warmer than they were in 1970 and more households have central heating which has made
internal temperatures easier to manage. In 1970 5.6 million homes were centrally heated, this had
increased to 21.7 million by 2000, accounting for nearly 90 per cent of all households in Great Britain.
Average internal temperatures increased from 13ºC in 1970 to 18ºC in 2000.
Growth in number of appliances
3.12 The amount of energy used by appliances has increased by 9 per cent since 1990, which has been
a result of increases in the total number of appliances bought and used by households as well as the
increase in the number of households. Net national disposable income in the UK has increased by
30 per cent since 1990. The higher the income, the higher the level of appliances owned by
households. In 2000, 45 per cent of households with a gross weekly income of over £500 owned
a dishwasher, compared with only 12 per cent of households with an income of £100 or less.
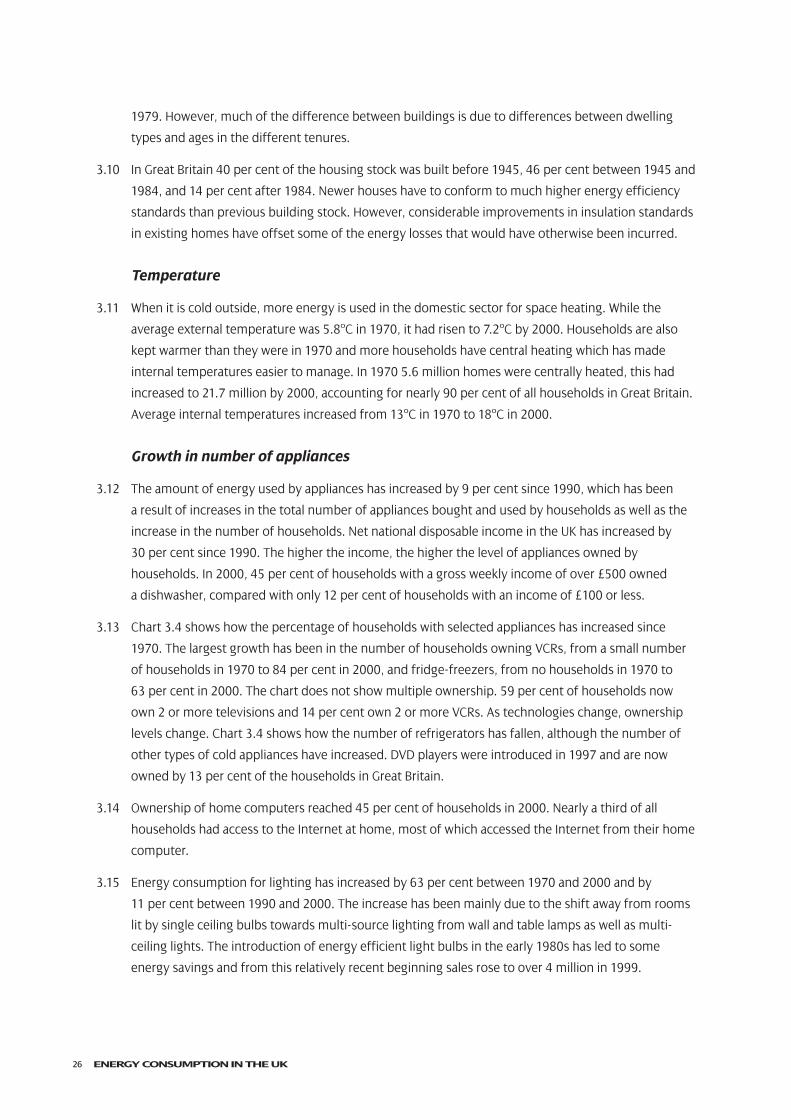
3.13 Chart 3.4 shows how the percentage of households with selected appliances has increased since
1970. The largest growth has been in the number of households owning VCRs, from a small number
of households in 1970 to 84 per cent in 2000, and fridge-freezers, from no households in 1970 to
63 per cent in 2000. The chart does not show multiple ownership. 59 per cent of households now
own 2 or more televisions and 14 per cent own 2 or more VCRs. As technologies change, ownership
levels change. Chart 3.4 shows how the number of refrigerators has fallen, although the number of
other types of cold appliances have increased. DVD players were introduced in 1997 and are now
owned by 13 per cent of the households in Great Britain.
3.14 Ownership of home computers reached 45 per cent of households in 2000. Nearly a third of all
households had access to the Internet at home, most of which accessed the Internet from their home
computer.
3.15 Energy consumption for lighting has increased by 63 per cent between 1970 and 2000 and by
11 per cent between 1990 and 2000. The increase has been mainly due to the shift away from rooms
lit by single ceiling bulbs towards multi-source lighting from wall and table lamps as well as multi-
ceiling lights. The introduction of energy efficient light bulbs in the early 1980s has led to some
energy savings and from this relatively recent beginning sales rose to over 4 million in 1999.
ECUK 16/7/02 9:35 AM Page 26
0
10
20
30
40
50
60
70
80
90
Fridge freezer Refrigerator Washing Machine Tumble dryer
Dish washer VCR Microwave
Per
cen
t
1970 1975 1980 1985 1990 1995 2000
ENERGY CONSUMPTION IN THE UK 27
Chart 3.4Percentage of households that own household domestic appliances
Source: ECI
• Ownership of at least one VCR had risen to 84 per cent of households by 2000.
• In 2000 92 per cent of households could wash their clothes with automatic machines.
• Just over 70 per cent of households owned a microwave oven in 2000.
3.16 The introduction of the standby facility on some electronic goods has also affected energy
consumption and is responsible for an estimated 1 per cent of the UK’s total domestic energy
consumption, equivalent to 6 per cent of domestic electricity consumption.
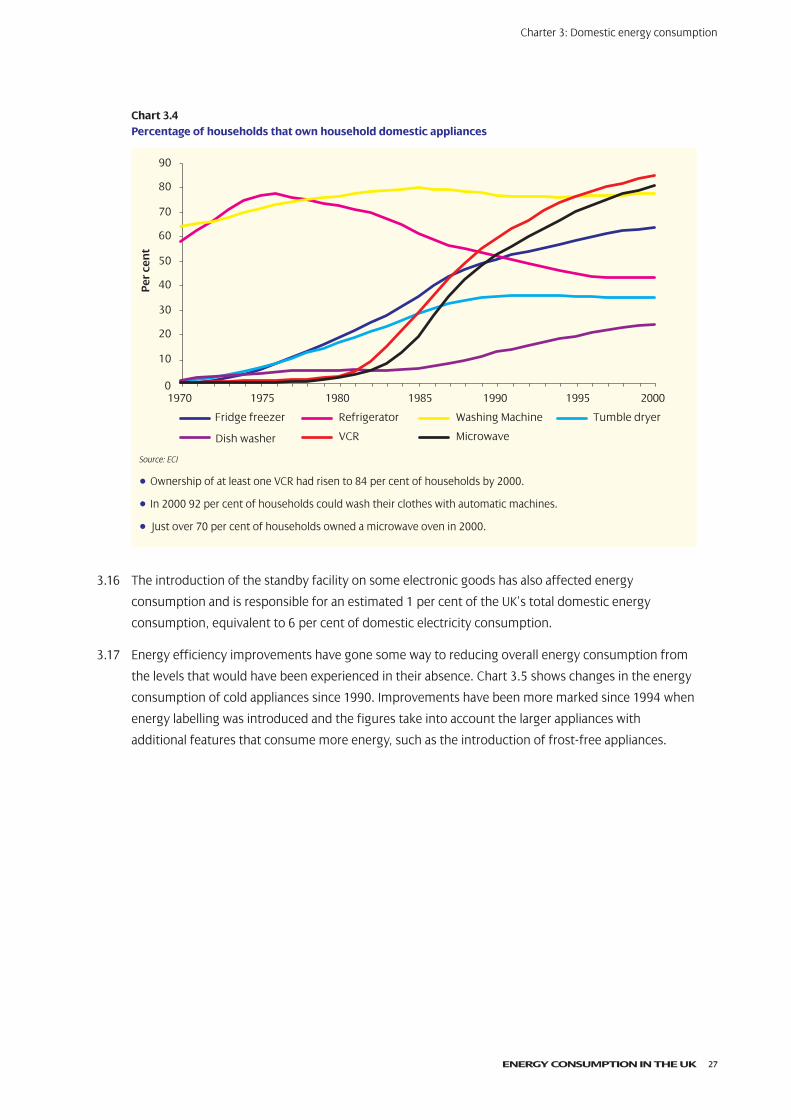
3.17 Energy efficiency improvements have gone some way to reducing overall energy consumption from
the levels that would have been experienced in their absence. Chart 3.5 shows changes in the energy
consumption of cold appliances since 1990. Improvements have been more marked since 1994 when
energy labelling was introduced and the figures take into account the larger appliances with
additional features that consume more energy, such as the introduction of frost-free appliances.
Charter 3: Domestic energy consumption
ECUK 16/7/02 9:35 AM Page 27
60
65
70
75
80
85
90
95
100
105
110
1990 1991 1992 1993 1994 1995 1996 1997 1998 1999 2000
Ind
ex (1
990=
100)
Refrigerator Fridge-freezer
Chest Freezer Upright Freezer
0
ENERGY CONSUMPTION IN THE UK28
Chart 3.5Energy consumption of new cold appliances, 1990 to 2000
Source: ECI
• Energy efficiency for new cold appliances improved most for refrigerators which consumed 27 per cent lesselectricity in 2000 than they did in 1990.
Cooking
3.18 The fall in energy consumption in cooking is partly explained by a change in lifestyle. More
convenience foods are now consumed and people eat out more frequently than in the past. The
average person in 2000 spent £7.36 per person per week on food and drink consumed out of the
house. Excluding alcoholic drink, expenditure on eating out increased by 13 per cent in real terms
since 1994, whilst household food and non-alcoholic drink purchases fell by 2 per cent. However,
small cooking appliances such as toasters and kettles are excluded from the definition of cooking
used in Chart 3.1.
Insulation
3.19 The main types of insulation in the UK are loft insulation, cavity wall insulation, double glazing and
hot water tank insulation. In 2000, 72 per cent of all houses in Great Britain had loft insulation,
19 per cent had some form of cavity wall insulation installed (cavity wall dwellings account for 69 per
cent of the housing stock with the remainder being largely accounted for by solid wall dwellings),
39 per cent of houses in Great Britain had more than 80 per cent of their windows treated with
double glazing and most houses with hot water tanks have hot water tank insulation since it is a low
cost, easy maintenance form of insulation.
ECUK 16/7/02 9:35 AM Page 28
0
10
20
30
40
50
60
70
1970 1975 1980 1985 1990 1995 2000
Mill
ion
ton
nes
of
oil
equ
ival
ent Heating efficiency saving
Insulating saving
Space heating energy consumption
ENERGY CONSUMPTION IN THE UK 29
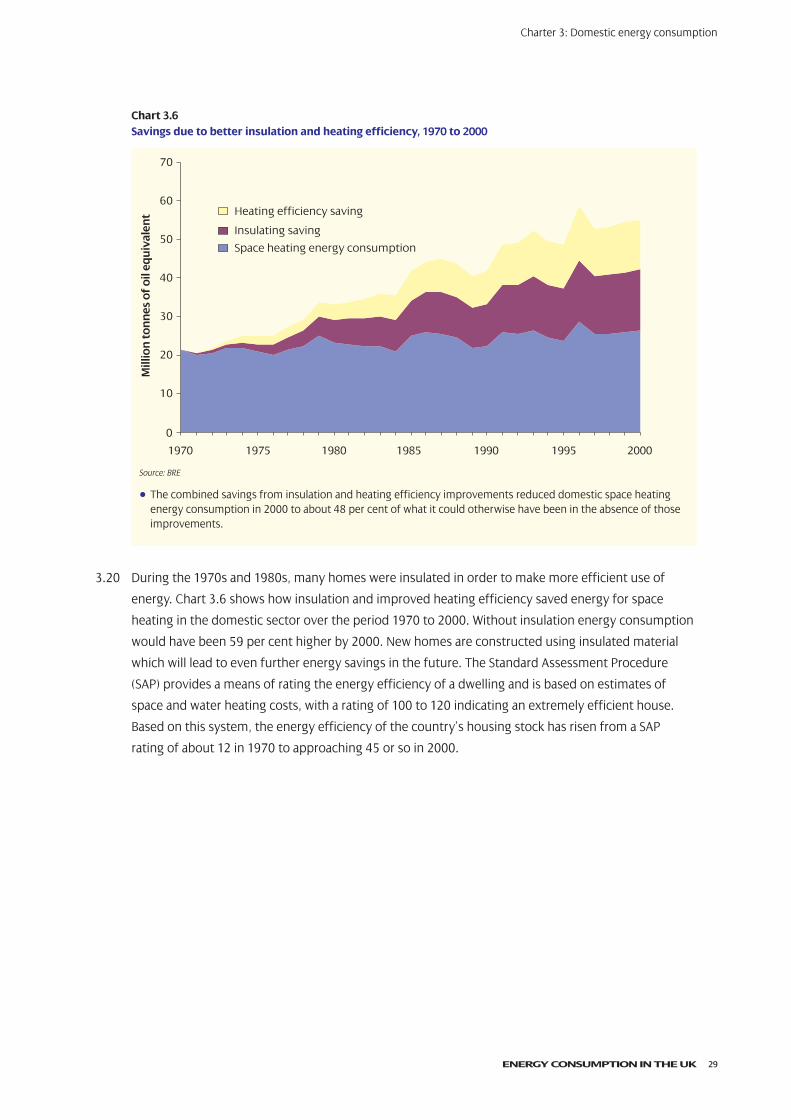
Chart 3.6Savings due to better insulation and heating efficiency, 1970 to 2000
Source: BRE
• The combined savings from insulation and heating efficiency improvements reduced domestic space heatingenergy consumption in 2000 to about 48 per cent of what it could otherwise have been in the absence of thoseimprovements.
3.20 During the 1970s and 1980s, many homes were insulated in order to make more efficient use of
energy. Chart 3.6 shows how insulation and improved heating efficiency saved energy for space
heating in the domestic sector over the period 1970 to 2000. Without insulation energy consumption
would have been 59 per cent higher by 2000. New homes are constructed using insulated material
which will lead to even further energy savings in the future. The Standard Assessment Procedure
(SAP) provides a means of rating the energy efficiency of a dwelling and is based on estimates of
space and water heating costs, with a rating of 100 to 120 indicating an extremely efficient house.
Based on this system, the energy efficiency of the country’s housing stock has risen from a SAP
rating of about 12 in 1970 to approaching 45 or so in 2000.
Charter 3: Domestic energy consumption
ECUK 16/7/02 9:35 AM Page 29
0
10,000
20,000
30,000
40,000
50,000
60,000
70,000
1970 1975 1980 1985 1990 1995
Th
ou
san
d t
on
nes
of
oil
equ
ival
ent
2001
ENERGY CONSUMPTION IN THE UK30
Industrial energy consumption
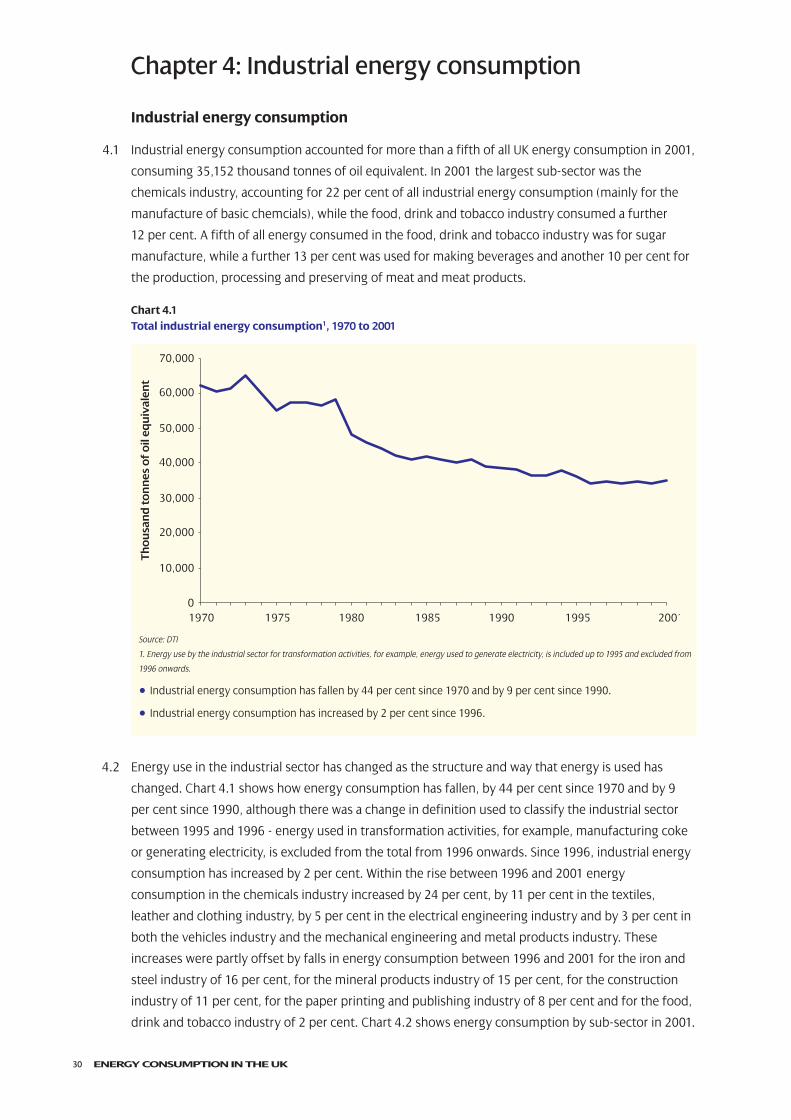
4.1 Industrial energy consumption accounted for more than a fifth of all UK energy consumption in 2001,
consuming 35,152 thousand tonnes of oil equivalent. In 2001 the largest sub-sector was the
chemicals industry, accounting for 22 per cent of all industrial energy consumption (mainly for the
manufacture of basic chemcials), while the food, drink and tobacco industry consumed a further
12 per cent. A fifth of all energy consumed in the food, drink and tobacco industry was for sugar
manufacture, while a further 13 per cent was used for making beverages and another 10 per cent for
the production, processing and preserving of meat and meat products.
Chart 4.1Total industrial energy consumption1, 1970 to 2001
Source: DTI
1. Energy use by the industrial sector for transformation activities, for example, energy used to generate electricity, is included up to 1995 and excluded from
1996 onwards.
• Industrial energy consumption has fallen by 44 per cent since 1970 and by 9 per cent since 1990.
• Industrial energy consumption has increased by 2 per cent since 1996.
4.2 Energy use in the industrial sector has changed as the structure and way that energy is used has
changed. Chart 4.1 shows how energy consumption has fallen, by 44 per cent since 1970 and by 9
per cent since 1990, although there was a change in definition used to classify the industrial sector
between 1995 and 1996 - energy used in transformation activities, for example, manufacturing coke
or generating electricity, is excluded from the total from 1996 onwards. Since 1996, industrial energy
consumption has increased by 2 per cent. Within the rise between 1996 and 2001 energy
consumption in the chemicals industry increased by 24 per cent, by 11 per cent in the textiles,
leather and clothing industry, by 5 per cent in the electrical engineering industry and by 3 per cent in
both the vehicles industry and the mechanical engineering and metal products industry. These
increases were partly offset by falls in energy consumption between 1996 and 2001 for the iron and
steel industry of 16 per cent, for the mineral products industry of 15 per cent, for the construction
industry of 11 per cent, for the paper printing and publishing industry of 8 per cent and for the food,
drink and tobacco industry of 2 per cent. Chart 4.2 shows energy consumption by sub-sector in 2001.
Chapter 4: Industrial energy consumption
ECUK 16/7/02 9:35 AM Page 30
Food beverages and
tobacco 12%
Chemicals 22% Other industry
33%
Vehicles 5%
Mechanical engineering 5%
Paper, printing and publishing 6%
Iron and steel 10%
Mineral products 7%
Oil 19%
Solid fuels 6%
Electricity 28%
Natural gas 44%
Other1 3%
ENERGY CONSUMPTION IN THE UK 31
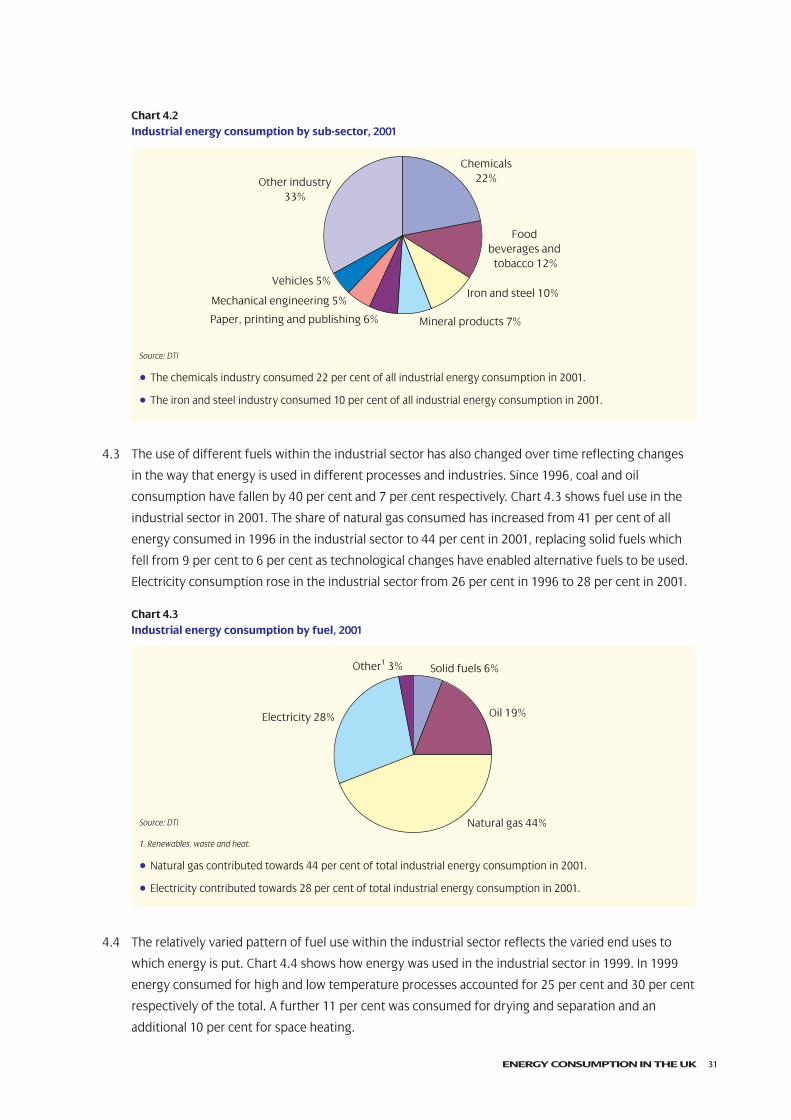
Chart 4.2Industrial energy consumption by sub-sector, 2001
Source: DTI
• The chemicals industry consumed 22 per cent of all industrial energy consumption in 2001.
• The iron and steel industry consumed 10 per cent of all industrial energy consumption in 2001.
4.3 The use of different fuels within the industrial sector has also changed over time reflecting changes
in the way that energy is used in different processes and industries. Since 1996, coal and oil
consumption have fallen by 40 per cent and 7 per cent respectively. Chart 4.3 shows fuel use in the
industrial sector in 2001. The share of natural gas consumed has increased from 41 per cent of all
energy consumed in 1996 in the industrial sector to 44 per cent in 2001, replacing solid fuels which
fell from 9 per cent to 6 per cent as technological changes have enabled alternative fuels to be used.
Electricity consumption rose in the industrial sector from 26 per cent in 1996 to 28 per cent in 2001.
Chart 4.3Industrial energy consumption by fuel, 2001
Source: DTI
1. Renewables, waste and heat.
• Natural gas contributed towards 44 per cent of total industrial energy consumption in 2001.
• Electricity contributed towards 28 per cent of total industrial energy consumption in 2001.
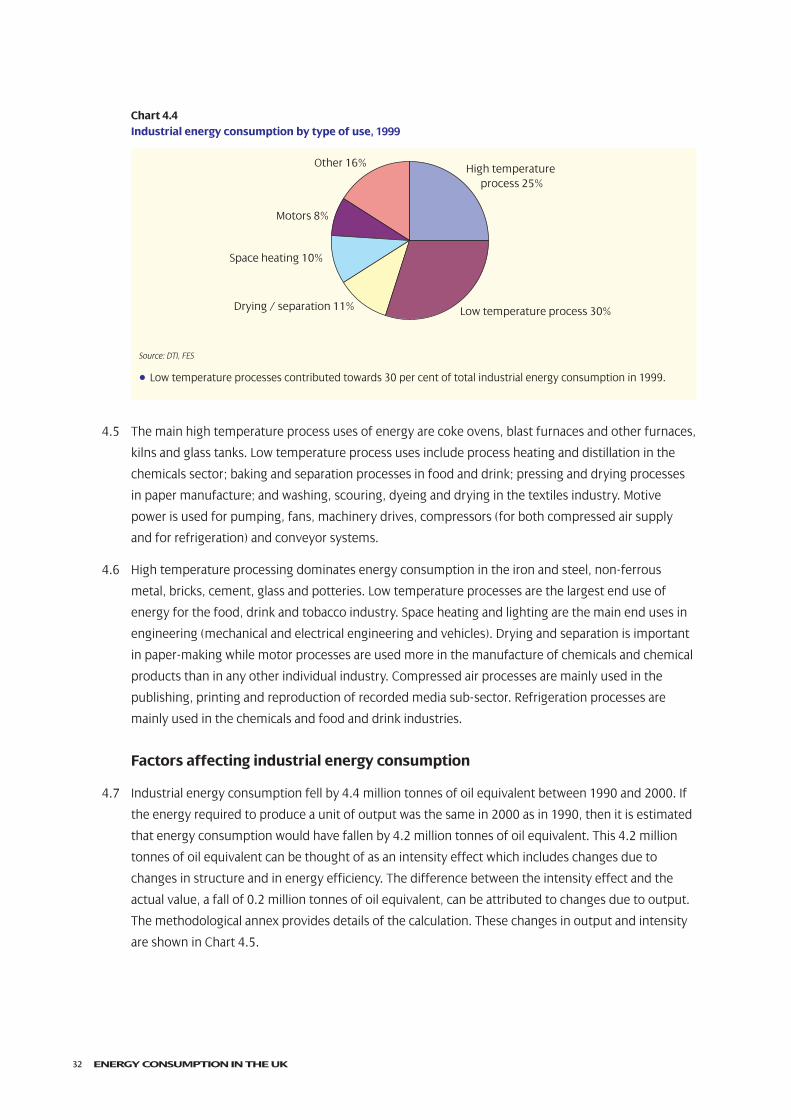
4.4 The relatively varied pattern of fuel use within the industrial sector reflects the varied end uses to
which energy is put. Chart 4.4 shows how energy was used in the industrial sector in 1999. In 1999
energy consumed for high and low temperature processes accounted for 25 per cent and 30 per cent
respectively of the total. A further 11 per cent was consumed for drying and separation and an
additional 10 per cent for space heating.
ECUK 16/7/02 9:35 AM Page 31
High temperature process 25%
Other 16%
Motors 8%
Space heating 10%
Drying / separation 11% Low temperature process 30%
ENERGY CONSUMPTION IN THE UK32
Chart 4.4Industrial energy consumption by type of use, 1999
Source: DTI, FES
• Low temperature processes contributed towards 30 per cent of total industrial energy consumption in 1999.
4.5 The main high temperature process uses of energy are coke ovens, blast furnaces and other furnaces,
kilns and glass tanks. Low temperature process uses include process heating and distillation in the
chemicals sector; baking and separation processes in food and drink; pressing and drying processes
in paper manufacture; and washing, scouring, dyeing and drying in the textiles industry. Motive
power is used for pumping, fans, machinery drives, compressors (for both compressed air supply
and for refrigeration) and conveyor systems.
4.6 High temperature processing dominates energy consumption in the iron and steel, non-ferrous
metal, bricks, cement, glass and potteries. Low temperature processes are the largest end use of
energy for the food, drink and tobacco industry. Space heating and lighting are the main end uses in
engineering (mechanical and electrical engineering and vehicles). Drying and separation is important
in paper-making while motor processes are used more in the manufacture of chemicals and chemical
products than in any other individual industry. Compressed air processes are mainly used in the
publishing, printing and reproduction of recorded media sub-sector. Refrigeration processes are
mainly used in the chemicals and food and drink industries.
Factors affecting industrial energy consumption
4.7 Industrial energy consumption fell by 4.4 million tonnes of oil equivalent between 1990 and 2000. If
the energy required to produce a unit of output was the same in 2000 as in 1990, then it is estimated
that energy consumption would have fallen by 4.2 million tonnes of oil equivalent. This 4.2 million
tonnes of oil equivalent can be thought of as an intensity effect which includes changes due to
changes in structure and in energy efficiency. The difference between the intensity effect and the
actual value, a fall of 0.2 million tonnes of oil equivalent, can be attributed to changes due to output.
The methodological annex provides details of the calculation. These changes in output and intensity
are shown in Chart 4.5.
ECUK 16/7/02 9:35 AM Page 32
-5
-4
-3
-2
-1
0
1
2
3
4
5
Mineral products
Chemicals
Electricalengineering
Food, drink &tobacco
Paper, printing,publishing
TOTAL
Mill
ion
to
nn
es o
f o
il eq
uiv
alen
t
Output effect Intensity effect Total change
ENERGY CONSUMPTION IN THE UK 33
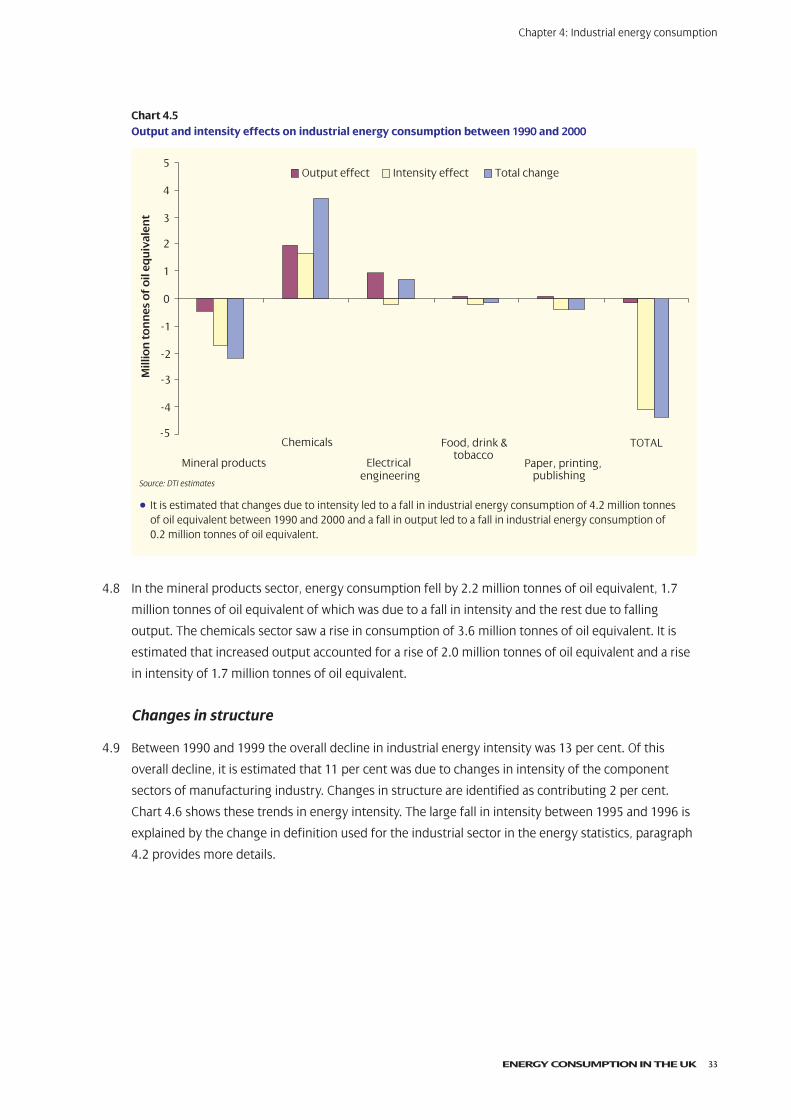
Chart 4.5Output and intensity effects on industrial energy consumption between 1990 and 2000
Source: DTI estimates
• It is estimated that changes due to intensity led to a fall in industrial energy consumption of 4.2 million tonnes of oil equivalent between 1990 and 2000 and a fall in output led to a fall in industrial energy consumption of 0.2 million tonnes of oil equivalent.
4.8 In the mineral products sector, energy consumption fell by 2.2 million tonnes of oil equivalent, 1.7
million tonnes of oil equivalent of which was due to a fall in intensity and the rest due to falling
output. The chemicals sector saw a rise in consumption of 3.6 million tonnes of oil equivalent. It is
estimated that increased output accounted for a rise of 2.0 million tonnes of oil equivalent and a rise
in intensity of 1.7 million tonnes of oil equivalent.
Changes in structure
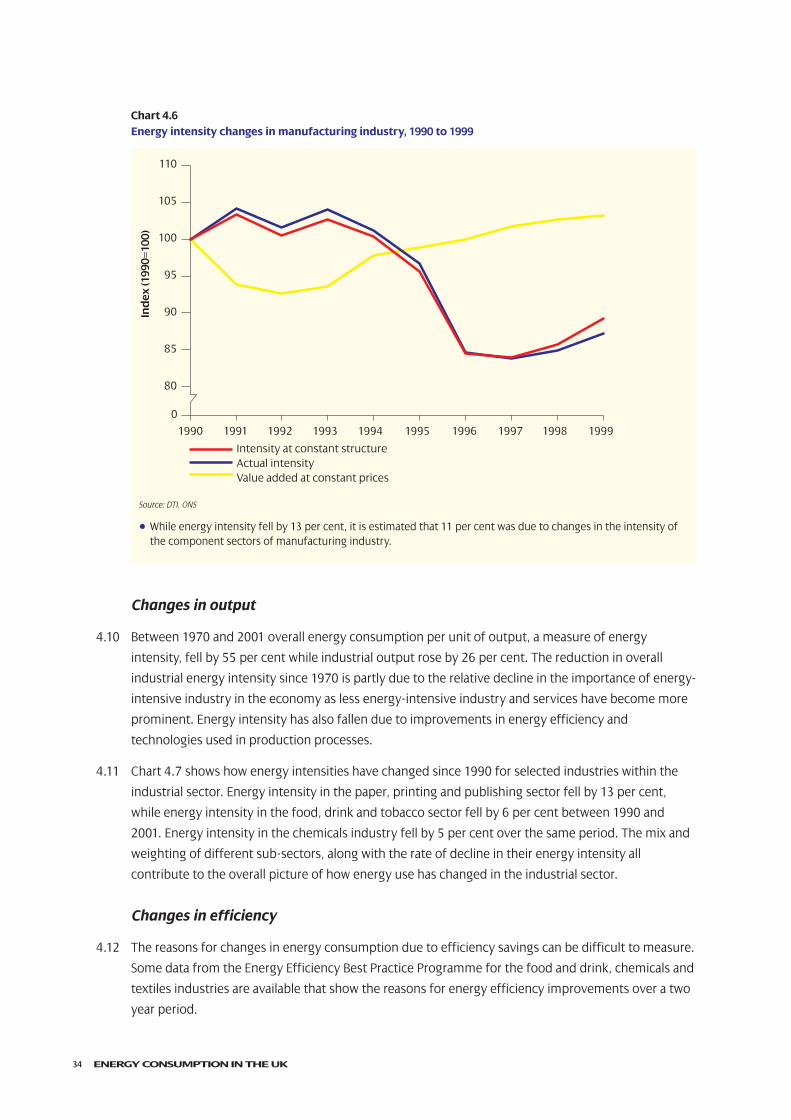
4.9 Between 1990 and 1999 the overall decline in industrial energy intensity was 13 per cent. Of this
overall decline, it is estimated that 11 per cent was due to changes in intensity of the component
sectors of manufacturing industry. Changes in structure are identified as contributing 2 per cent.
Chart 4.6 shows these trends in energy intensity. The large fall in intensity between 1995 and 1996 is
explained by the change in definition used for the industrial sector in the energy statistics, paragraph
4.2 provides more details.
Chapter 4: Industrial energy consumption
ECUK 16/7/02 9:35 AM Page 33
80
85
90
95
100
105
110
1990 1991 1992 1993 1994 1995 1996 1997 1998 1999
Ind
ex (1
990=
100)
Intensity at constant structureActual intensity Value added at constant prices
0
ENERGY CONSUMPTION IN THE UK34
Chart 4.6Energy intensity changes in manufacturing industry, 1990 to 1999
Source: DTI, ONS
• While energy intensity fell by 13 per cent, it is estimated that 11 per cent was due to changes in the intensity ofthe component sectors of manufacturing industry.
Changes in output
4.10 Between 1970 and 2001 overall energy consumption per unit of output, a measure of energy
intensity, fell by 55 per cent while industrial output rose by 26 per cent. The reduction in overall
industrial energy intensity since 1970 is partly due to the relative decline in the importance of energy-
intensive industry in the economy as less energy-intensive industry and services have become more
prominent. Energy intensity has also fallen due to improvements in energy efficiency and
technologies used in production processes.
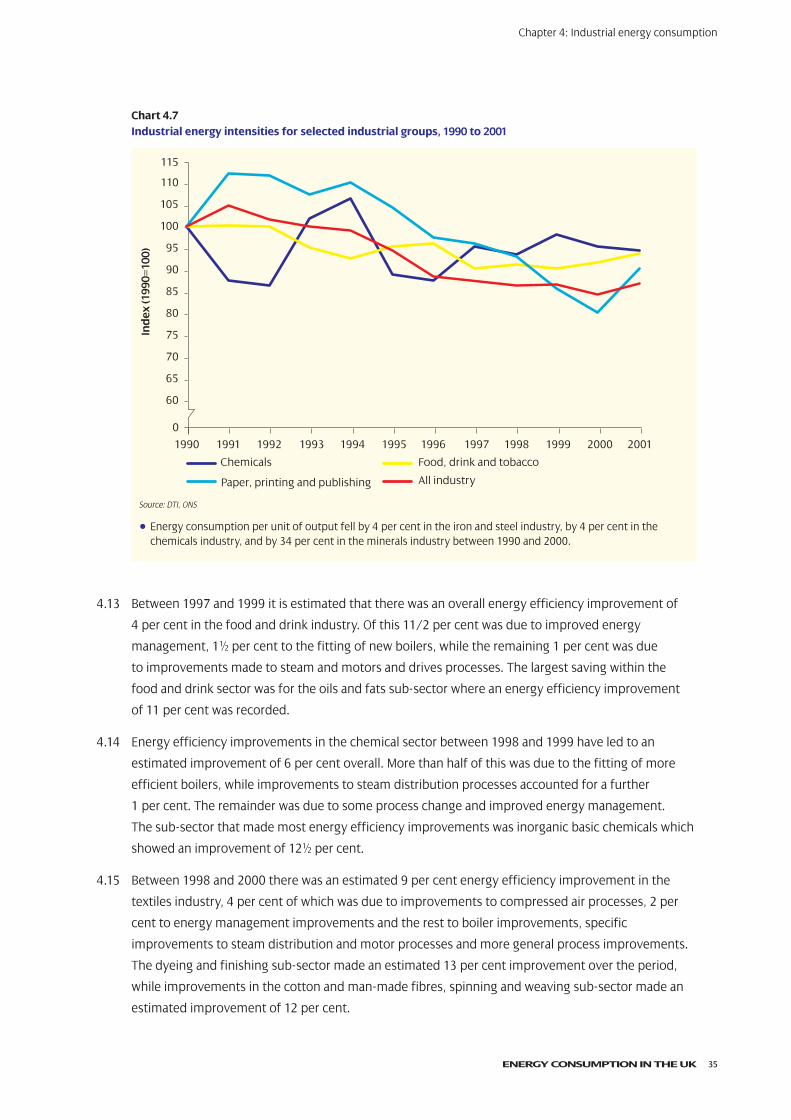
4.11 Chart 4.7 shows how energy intensities have changed since 1990 for selected industries within the
industrial sector. Energy intensity in the paper, printing and publishing sector fell by 13 per cent,
while energy intensity in the food, drink and tobacco sector fell by 6 per cent between 1990 and
2001. Energy intensity in the chemicals industry fell by 5 per cent over the same period. The mix and
weighting of different sub-sectors, along with the rate of decline in their energy intensity all
contribute to the overall picture of how energy use has changed in the industrial sector.
Changes in efficiency
4.12 The reasons for changes in energy consumption due to efficiency savings can be difficult to measure.
Some data from the Energy Efficiency Best Practice Programme for the food and drink, chemicals and
textiles industries are available that show the reasons for energy efficiency improvements over a two
year period.
ECUK 16/7/02 9:35 AM Page 34
1990 1991 1992 1993 1994 1995 1996 1997 1998 1999 2000 2001
Ind
ex (1
990=
100)
Chemicals Food, drink and tobacco
Paper, printing and publishing All industry
60
65
70
75
80
85
90
95
100
105
110
0
115
ENERGY CONSUMPTION IN THE UK 35
Chart 4.7Industrial energy intensities for selected industrial groups, 1990 to 2001
Source: DTI, ONS
• Energy consumption per unit of output fell by 4 per cent in the iron and steel industry, by 4 per cent in thechemicals industry, and by 34 per cent in the minerals industry between 1990 and 2000.
4.13 Between 1997 and 1999 it is estimated that there was an overall energy efficiency improvement of
4 per cent in the food and drink industry. Of this 11/2 per cent was due to improved energy
management, 11⁄2 per cent to the fitting of new boilers, while the remaining 1 per cent was due
to improvements made to steam and motors and drives processes. The largest saving within the
food and drink sector was for the oils and fats sub-sector where an energy efficiency improvement
of 11 per cent was recorded.
4.14 Energy efficiency improvements in the chemical sector between 1998 and 1999 have led to an
estimated improvement of 6 per cent overall. More than half of this was due to the fitting of more
efficient boilers, while improvements to steam distribution processes accounted for a further
1 per cent. The remainder was due to some process change and improved energy management.
The sub-sector that made most energy efficiency improvements was inorganic basic chemicals which
showed an improvement of 121⁄2 per cent.
4.15 Between 1998 and 2000 there was an estimated 9 per cent energy efficiency improvement in the
textiles industry, 4 per cent of which was due to improvements to compressed air processes, 2 per
cent to energy management improvements and the rest to boiler improvements, specific
improvements to steam distribution and motor processes and more general process improvements.
The dyeing and finishing sub-sector made an estimated 13 per cent improvement over the period,
while improvements in the cotton and man-made fibres, spinning and weaving sub-sector made an
estimated improvement of 12 per cent.
Chapter 4: Industrial energy consumption
ECUK 16/7/02 9:35 AM Page 35
1970 1975 1980 1985 1990 1995 2001
0
5,000
10,000
15,000
20,000
25,000
Th
ou
san
d t
on
nes
of
oil
equ
ival
ent
Public sector Private commercial
ENERGY CONSUMPTION IN THE UK36
Service sector energy consumption
5.1 Service sector energy consumption (excluding agriculture) accounted for 13 per cent of all final
energy consumed for energy purposes in 2001. The service sector can be split into two main
components: public administration which covers government activities, education and health and
private commercial which covers retail, hotels, financial, real estate and computer activities. In 2001
energy consumed in the public administration sub-sector accounted for 39 per cent of all service
sector energy consumption, while the private commercial sector accounted for the remaining 61 per
cent.
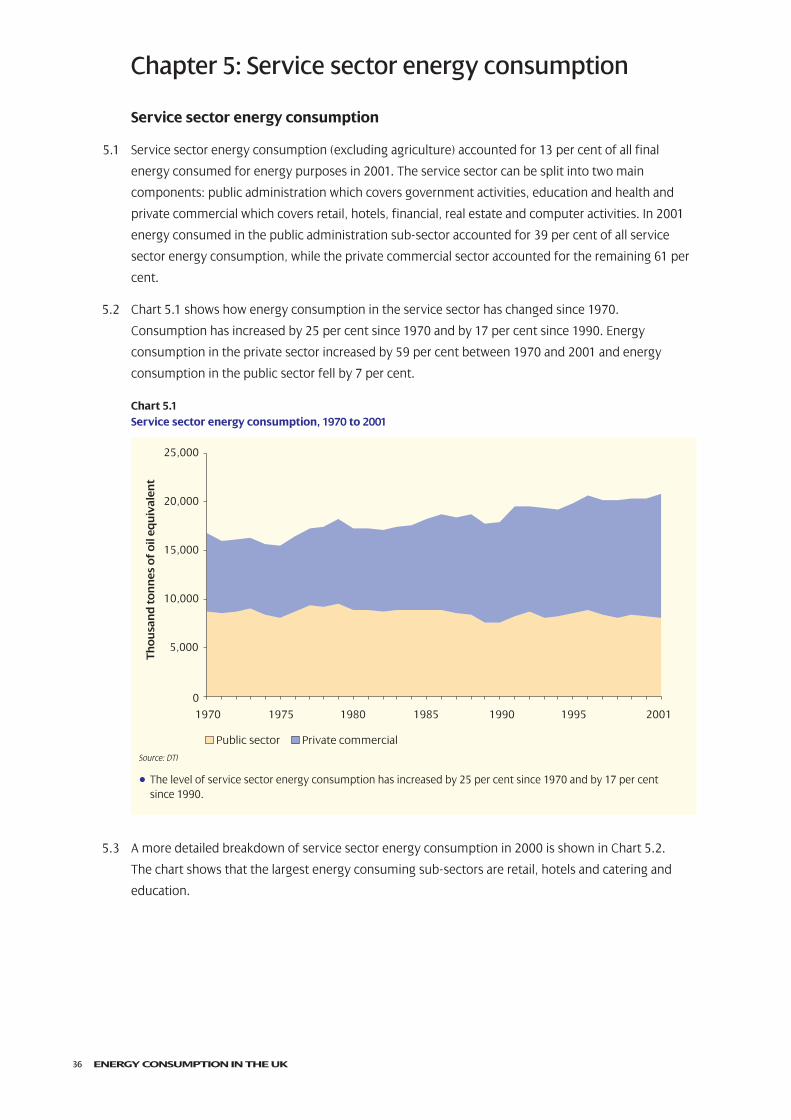
5.2 Chart 5.1 shows how energy consumption in the service sector has changed since 1970.
Consumption has increased by 25 per cent since 1970 and by 17 per cent since 1990. Energy
consumption in the private sector increased by 59 per cent between 1970 and 2001 and energy
consumption in the public sector fell by 7 per cent.
Chart 5.1Service sector energy consumption, 1970 to 2001
Source: DTI
• The level of service sector energy consumption has increased by 25 per cent since 1970 and by 17 per cent since 1990.
5.3 A more detailed breakdown of service sector energy consumption in 2000 is shown in Chart 5.2.
The chart shows that the largest energy consuming sub-sectors are retail, hotels and catering and
education.
Chapter 5: Service sector energy consumption
ECUK 16/7/02 9:35 AM Page 36
ENERGY CONSUMPTION IN THE UK 37
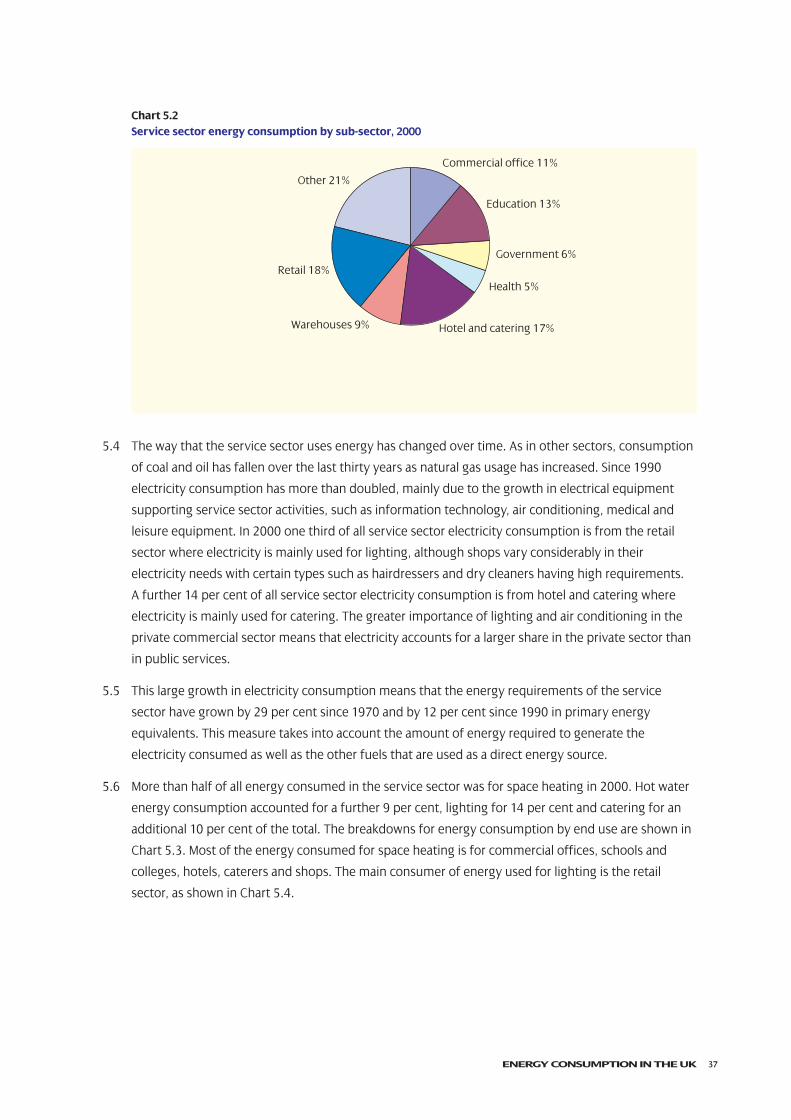
Chart 5.2Service sector energy consumption by sub-sector, 2000
Source: BRE
• Hotel and catering and the retail sector accounted for 36 per cent of total service sector energy consumptionin 2000.
5.4 The way that the service sector uses energy has changed over time. As in other sectors, consumption
of coal and oil has fallen over the last thirty years as natural gas usage has increased. Since 1990
electricity consumption has more than doubled, mainly due to the growth in electrical equipment
supporting service sector activities, such as information technology, air conditioning, medical and
leisure equipment. In 2000 one third of all service sector electricity consumption is from the retail
sector where electricity is mainly used for lighting, although shops vary considerably in their
electricity needs with certain types such as hairdressers and dry cleaners having high requirements.
A further 14 per cent of all service sector electricity consumption is from hotel and catering where
electricity is mainly used for catering. The greater importance of lighting and air conditioning in the
private commercial sector means that electricity accounts for a larger share in the private sector than
in public services.
5.5 This large growth in electricity consumption means that the energy requirements of the service
sector have grown by 29 per cent since 1970 and by 12 per cent since 1990 in primary energy
equivalents. This measure takes into account the amount of energy required to generate the
electricity consumed as well as the other fuels that are used as a direct energy source.
5.6 More than half of all energy consumed in the service sector was for space heating in 2000. Hot water
energy consumption accounted for a further 9 per cent, lighting for 14 per cent and catering for an
additional 10 per cent of the total. The breakdowns for energy consumption by end use are shown in
Chart 5.3. Most of the energy consumed for space heating is for commercial offices, schools and
colleges, hotels, caterers and shops. The main consumer of energy used for lighting is the retail
sector, as shown in Chart 5.4.
Government 6%
Education 13%
Other 21%
Retail 18%
Warehouses 9%
Health 5%
Hotel and catering 17%
Commercial office 11%
ECUK 16/7/02 9:35 AM Page 37
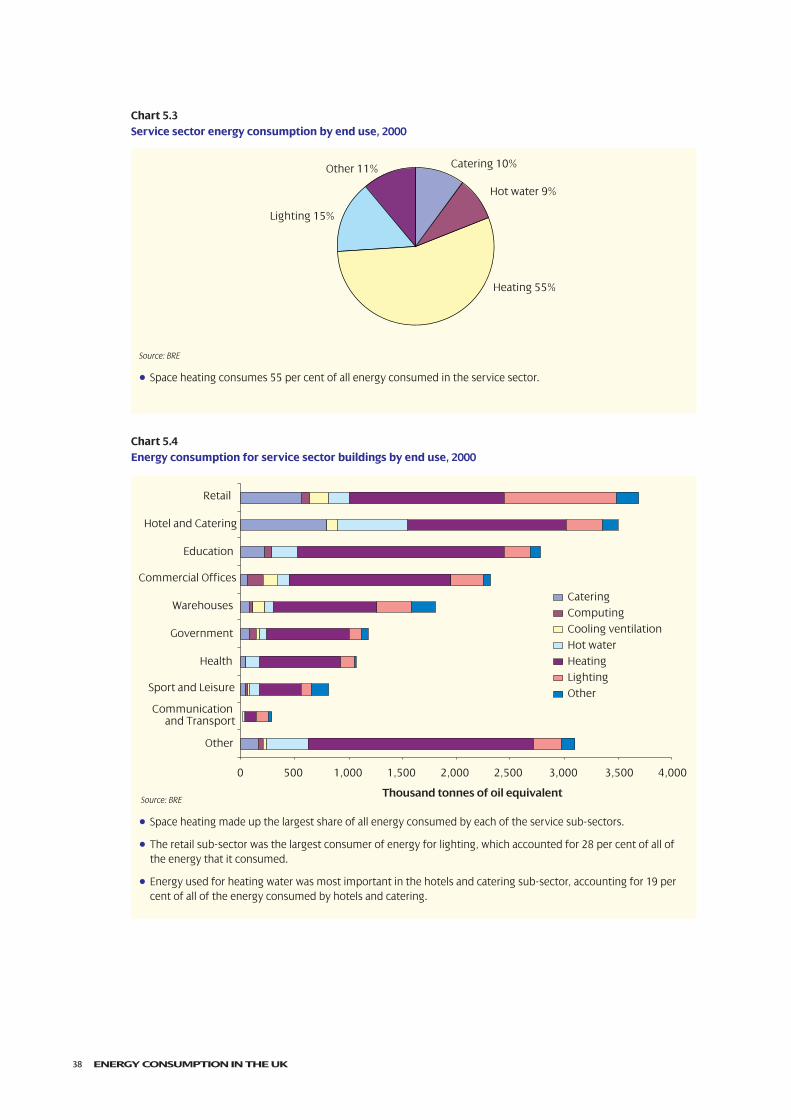
0 500 1,000 1,500 2,000 2,500 3,000 3,500 4,000
Other
Communication and Transport
Sport and Leisure
Health
Government
Warehouses
Commercial Offices
Education
Hotel and Catering
Retail
Thousand tonnes of oil equivalent
CateringComputingCooling ventilationHot waterHeatingLightingOther
Hot water 9%
Other 11%
Lighting 15%
Heating 55%
Catering 10%
ENERGY CONSUMPTION IN THE UK38
Chart 5.3Service sector energy consumption by end use, 2000
Source: BRE
• Space heating consumes 55 per cent of all energy consumed in the service sector.
Chart 5.4Energy consumption for service sector buildings by end use, 2000
Source: BRE
• Space heating made up the largest share of all energy consumed by each of the service sub-sectors.
• The retail sub-sector was the largest consumer of energy for lighting, which accounted for 28 per cent of all ofthe energy that it consumed.
• Energy used for heating water was most important in the hotels and catering sub-sector, accounting for 19 percent of all of the energy consumed by hotels and catering.
ECUK 16/7/02 9:35 AM Page 38
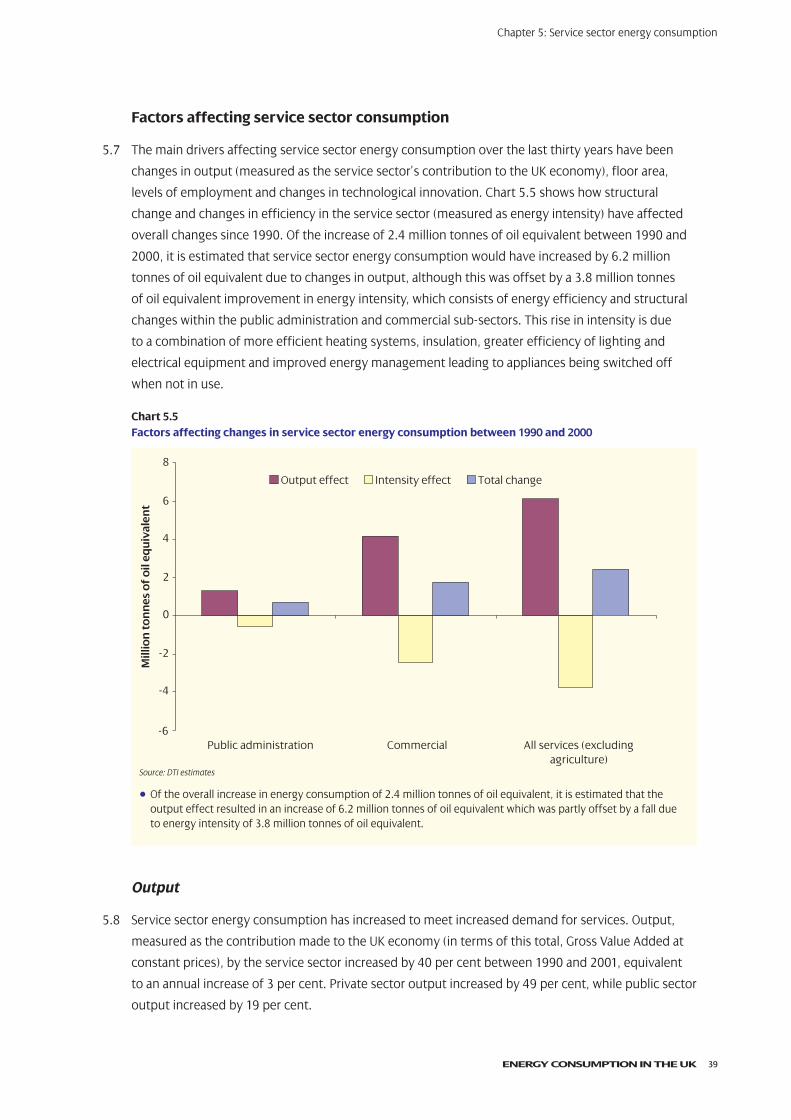
-6
-4
-2
0
2
4
6
8
Public administration Commercial All services (excludingagriculture)
Mill
ion
to
nn
es o
f o
il eq
uiv
alen
t
Output effect Intensity effect Total change
ENERGY CONSUMPTION IN THE UK 39
Factors affecting service sector consumption
5.7 The main drivers affecting service sector energy consumption over the last thirty years have been
changes in output (measured as the service sector’s contribution to the UK economy), floor area,
levels of employment and changes in technological innovation. Chart 5.5 shows how structural
change and changes in efficiency in the service sector (measured as energy intensity) have affected
overall changes since 1990. Of the increase of 2.4 million tonnes of oil equivalent between 1990 and
2000, it is estimated that service sector energy consumption would have increased by 6.2 million
tonnes of oil equivalent due to changes in output, although this was offset by a 3.8 million tonnes
of oil equivalent improvement in energy intensity, which consists of energy efficiency and structural
changes within the public administration and commercial sub-sectors. This rise in intensity is due
to a combination of more efficient heating systems, insulation, greater efficiency of lighting and
electrical equipment and improved energy management leading to appliances being switched off
when not in use.
Chart 5.5Factors affecting changes in service sector energy consumption between 1990 and 2000
Source: DTI estimates
• Of the overall increase in energy consumption of 2.4 million tonnes of oil equivalent, it is estimated that theoutput effect resulted in an increase of 6.2 million tonnes of oil equivalent which was partly offset by a fall dueto energy intensity of 3.8 million tonnes of oil equivalent.
Output
5.8 Service sector energy consumption has increased to meet increased demand for services. Output,
measured as the contribution made to the UK economy (in terms of this total, Gross Value Added at
constant prices), by the service sector increased by 40 per cent between 1990 and 2001, equivalent
to an annual increase of 3 per cent. Private sector output increased by 49 per cent, while public sector
output increased by 19 per cent.
Chapter 5: Service sector energy consumption
ECUK 16/7/02 9:35 AM Page 39
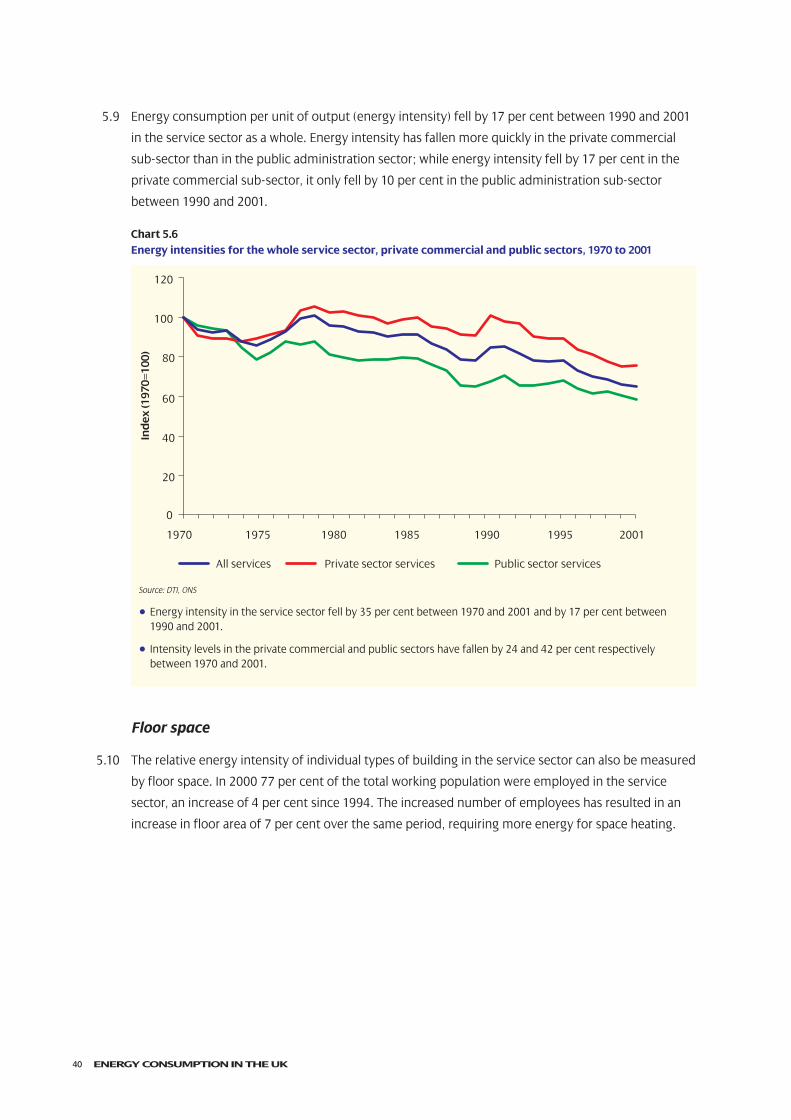
0
20
40
60
80
100
120
1970 1975 1980 1985 1990 1995 2001
All services Private sector services Public sector services
Ind
ex (1
970=
100)
ENERGY CONSUMPTION IN THE UK40
5.9 Energy consumption per unit of output (energy intensity) fell by 17 per cent between 1990 and 2001
in the service sector as a whole. Energy intensity has fallen more quickly in the private commercial
sub-sector than in the public administration sector; while energy intensity fell by 17 per cent in the
private commercial sub-sector, it only fell by 10 per cent in the public administration sub-sector
between 1990 and 2001.
Chart 5.6Energy intensities for the whole service sector, private commercial and public sectors, 1970 to 2001
Source: DTI, ONS
• Energy intensity in the service sector fell by 35 per cent between 1970 and 2001 and by 17 per cent between1990 and 2001.
• Intensity levels in the private commercial and public sectors have fallen by 24 and 42 per cent respectivelybetween 1970 and 2001.
Floor space
5.10 The relative energy intensity of individual types of building in the service sector can also be measured
by floor space. In 2000 77 per cent of the total working population were employed in the service
sector, an increase of 4 per cent since 1994. The increased number of employees has resulted in an
increase in floor area of 7 per cent over the same period, requiring more energy for space heating.
ECUK 16/7/02 9:35 AM Page 40
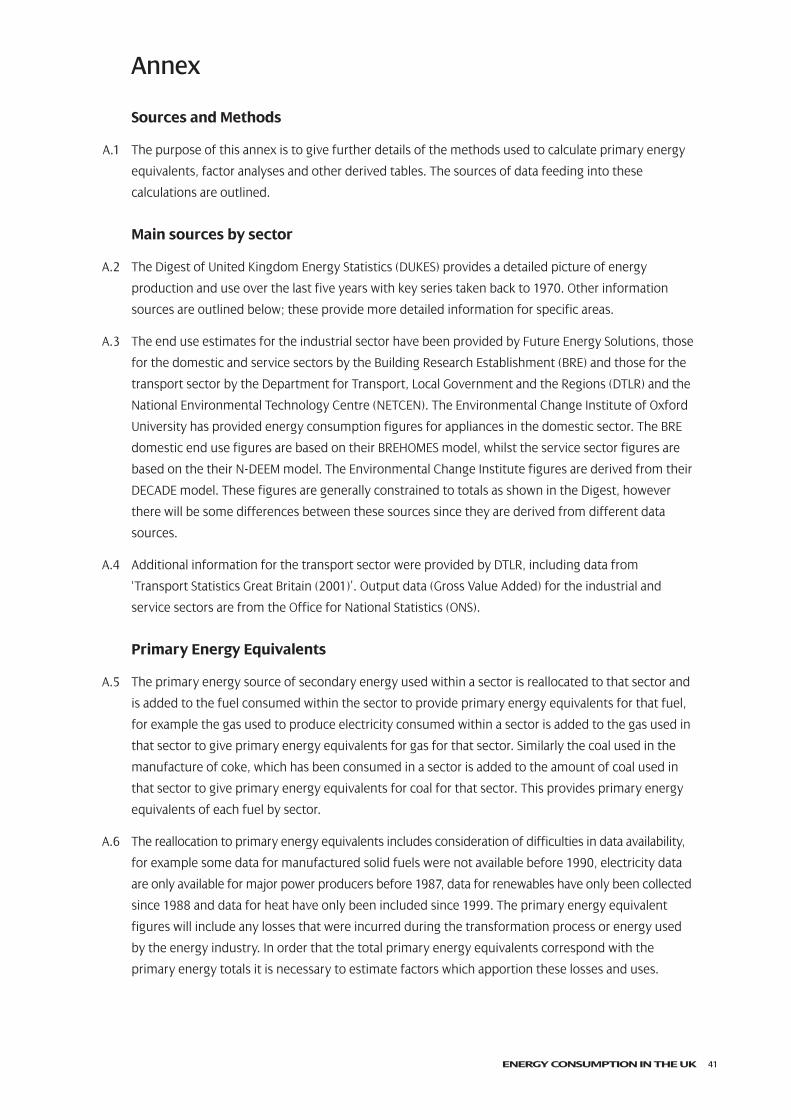
ENERGY CONSUMPTION IN THE UK 41
Sources and Methods
A.1 The purpose of this annex is to give further details of the methods used to calculate primary energy
equivalents, factor analyses and other derived tables. The sources of data feeding into these
calculations are outlined.
Main sources by sector
A.2 The Digest of United Kingdom Energy Statistics (DUKES) provides a detailed picture of energy
production and use over the last five years with key series taken back to 1970. Other information
sources are outlined below; these provide more detailed information for specific areas.
A.3 The end use estimates for the industrial sector have been provided by Future Energy Solutions, those
for the domestic and service sectors by the Building Research Establishment (BRE) and those for the
transport sector by the Department for Transport, Local Government and the Regions (DTLR) and the
National Environmental Technology Centre (NETCEN). The Environmental Change Institute of Oxford
University has provided energy consumption figures for appliances in the domestic sector. The BRE
domestic end use figures are based on their BREHOMES model, whilst the service sector figures are
based on the their N-DEEM model. The Environmental Change Institute figures are derived from their
DECADE model. These figures are generally constrained to totals as shown in the Digest, however
there will be some differences between these sources since they are derived from different data
sources.
A.4 Additional information for the transport sector were provided by DTLR, including data from
‘Transport Statistics Great Britain (2001)’. Output data (Gross Value Added) for the industrial and
service sectors are from the Office for National Statistics (ONS).
Primary Energy Equivalents
A.5 The primary energy source of secondary energy used within a sector is reallocated to that sector and
is added to the fuel consumed within the sector to provide primary energy equivalents for that fuel,
for example the gas used to produce electricity consumed within a sector is added to the gas used in
that sector to give primary energy equivalents for gas for that sector. Similarly the coal used in the
manufacture of coke, which has been consumed in a sector is added to the amount of coal used in
that sector to give primary energy equivalents for coal for that sector. This provides primary energy
equivalents of each fuel by sector.
A.6 The reallocation to primary energy equivalents includes consideration of difficulties in data availability,
for example some data for manufactured solid fuels were not available before 1990, electricity data
are only available for major power producers before 1987, data for renewables have only been collected
since 1988 and data for heat have only been included since 1999. The primary energy equivalent
figures will include any losses that were incurred during the transformation process or energy used
by the energy industry. In order that the total primary energy equivalents correspond with the
primary energy totals it is necessary to estimate factors which apportion these losses and uses.
Annex
ECUK 16/7/02 9:35 AM Page 41
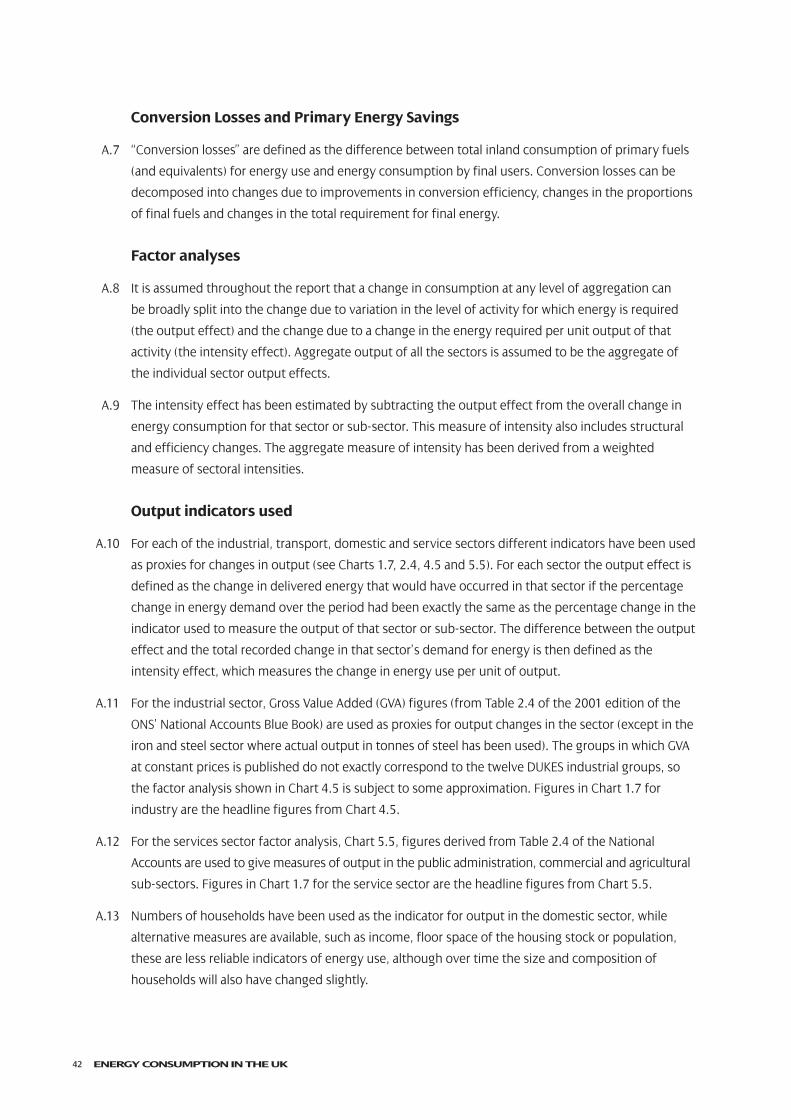
ENERGY CONSUMPTION IN THE UK42
Conversion Losses and Primary Energy Savings
A.7 “Conversion losses” are defined as the difference between total inland consumption of primary fuels
(and equivalents) for energy use and energy consumption by final users. Conversion losses can be
decomposed into changes due to improvements in conversion efficiency, changes in the proportions
of final fuels and changes in the total requirement for final energy.
Factor analyses
A.8 It is assumed throughout the report that a change in consumption at any level of aggregation can
be broadly split into the change due to variation in the level of activity for which energy is required
(the output effect) and the change due to a change in the energy required per unit output of that
activity (the intensity effect). Aggregate output of all the sectors is assumed to be the aggregate of
the individual sector output effects.
A.9 The intensity effect has been estimated by subtracting the output effect from the overall change in
energy consumption for that sector or sub-sector. This measure of intensity also includes structural
and efficiency changes. The aggregate measure of intensity has been derived from a weighted
measure of sectoral intensities.
Output indicators used
A.10 For each of the industrial, transport, domestic and service sectors different indicators have been used
as proxies for changes in output (see Charts 1.7, 2.4, 4.5 and 5.5). For each sector the output effect is
defined as the change in delivered energy that would have occurred in that sector if the percentage
change in energy demand over the period had been exactly the same as the percentage change in the
indicator used to measure the output of that sector or sub-sector. The difference between the output
effect and the total recorded change in that sector’s demand for energy is then defined as the
intensity effect, which measures the change in energy use per unit of output.
A.11 For the industrial sector, Gross Value Added (GVA) figures (from Table 2.4 of the 2001 edition of the
ONS’ National Accounts Blue Book) are used as proxies for output changes in the sector (except in the
iron and steel sector where actual output in tonnes of steel has been used). The groups in which GVA
at constant prices is published do not exactly correspond to the twelve DUKES industrial groups, so
the factor analysis shown in Chart 4.5 is subject to some approximation. Figures in Chart 1.7 for
industry are the headline figures from Chart 4.5.
A.12 For the services sector factor analysis, Chart 5.5, figures derived from Table 2.4 of the National
Accounts are used to give measures of output in the public administration, commercial and agricultural
sub-sectors. Figures in Chart 1.7 for the service sector are the headline figures from Chart 5.5.
A.13 Numbers of households have been used as the indicator for output in the domestic sector, while
alternative measures are available, such as income, floor space of the housing stock or population,
these are less reliable indicators of energy use, although over time the size and composition of
households will also have changed slightly.
ECUK 16/7/02 9:35 AM Page 42
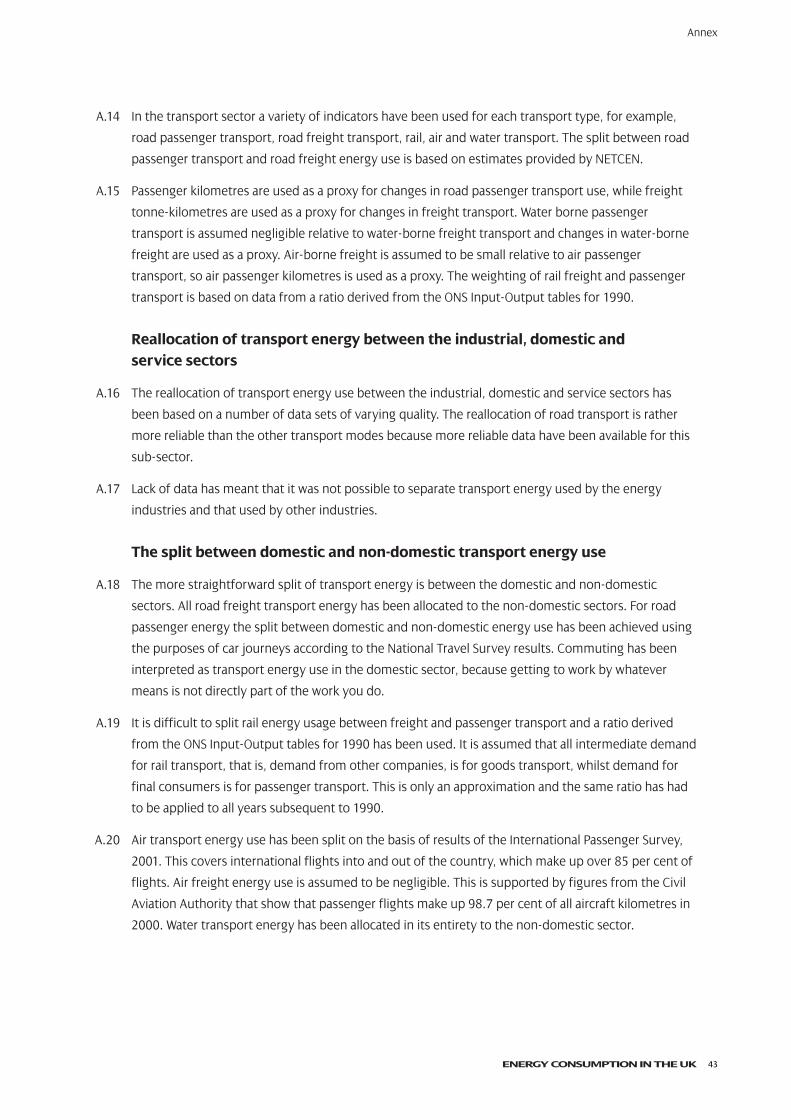
ENERGY CONSUMPTION IN THE UK 43
A.14 In the transport sector a variety of indicators have been used for each transport type, for example,
road passenger transport, road freight transport, rail, air and water transport. The split between road
passenger transport and road freight energy use is based on estimates provided by NETCEN.
A.15 Passenger kilometres are used as a proxy for changes in road passenger transport use, while freight
tonne-kilometres are used as a proxy for changes in freight transport. Water borne passenger
transport is assumed negligible relative to water-borne freight transport and changes in water-borne
freight are used as a proxy. Air-borne freight is assumed to be small relative to air passenger
transport, so air passenger kilometres is used as a proxy. The weighting of rail freight and passenger
transport is based on data from a ratio derived from the ONS Input-Output tables for 1990.
Reallocation of transport energy between the industrial, domestic and service sectors
A.16 The reallocation of transport energy use between the industrial, domestic and service sectors has
been based on a number of data sets of varying quality. The reallocation of road transport is rather
more reliable than the other transport modes because more reliable data have been available for this
sub-sector.
A.17 Lack of data has meant that it was not possible to separate transport energy used by the energy
industries and that used by other industries.
The split between domestic and non-domestic transport energy use
A.18 The more straightforward split of transport energy is between the domestic and non-domestic
sectors. All road freight transport energy has been allocated to the non-domestic sectors. For road
passenger energy the split between domestic and non-domestic energy use has been achieved using
the purposes of car journeys according to the National Travel Survey results. Commuting has been
interpreted as transport energy use in the domestic sector, because getting to work by whatever
means is not directly part of the work you do.
A.19 It is difficult to split rail energy usage between freight and passenger transport and a ratio derived
from the ONS Input-Output tables for 1990 has been used. It is assumed that all intermediate demand
for rail transport, that is, demand from other companies, is for goods transport, whilst demand for
final consumers is for passenger transport. This is only an approximation and the same ratio has had
to be applied to all years subsequent to 1990.
A.20 Air transport energy use has been split on the basis of results of the International Passenger Survey,
2001. This covers international flights into and out of the country, which make up over 85 per cent of
flights. Air freight energy use is assumed to be negligible. This is supported by figures from the Civil
Aviation Authority that show that passenger flights make up 98.7 per cent of all aircraft kilometres in
2000. Water transport energy has been allocated in its entirety to the non-domestic sector.
Annex
ECUK 16/7/02 9:35 AM Page 43
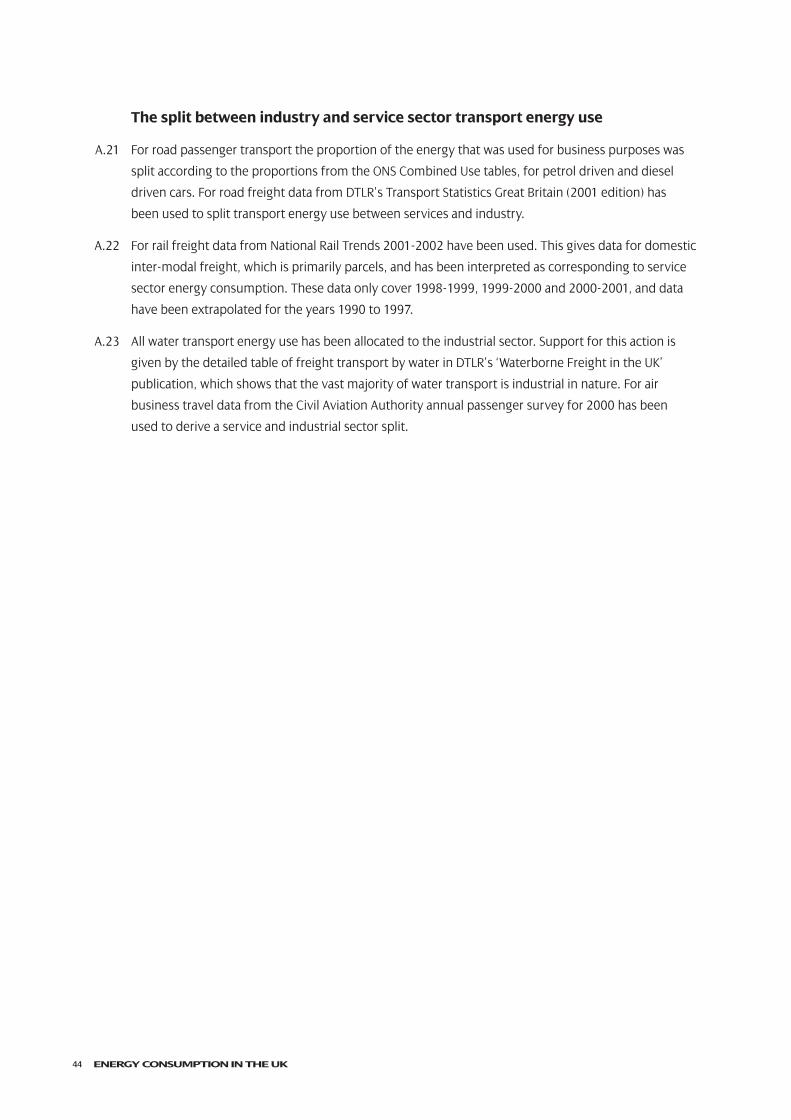
ENERGY CONSUMPTION IN THE UK44
The split between industry and service sector transport energy use
A.21 For road passenger transport the proportion of the energy that was used for business purposes was
split according to the proportions from the ONS Combined Use tables, for petrol driven and diesel
driven cars. For road freight data from DTLR’s Transport Statistics Great Britain (2001 edition) has
been used to split transport energy use between services and industry.
A.22 For rail freight data from National Rail Trends 2001-2002 have been used. This gives data for domestic
inter-modal freight, which is primarily parcels, and has been interpreted as corresponding to service
sector energy consumption. These data only cover 1998-1999, 1999-2000 and 2000-2001, and data
have been extrapolated for the years 1990 to 1997.
A.23 All water transport energy use has been allocated to the industrial sector. Support for this action is
given by the detailed table of freight transport by water in DTLR’s ‘Waterborne Freight in the UK’
publication, which shows that the vast majority of water transport is industrial in nature. For air
business travel data from the Civil Aviation Authority annual passenger survey for 2000 has been
used to derive a service and industrial sector split.
ECUK 16/7/02 9:35 AM Page 44
ENERGY CONSUMPTION IN THE UK 45
Overall energy consumption
Table 1.1 Total primary energy consumption by fuel, unadjusted and temperature corrected, 1970 to 2001
Table 1.2 Non-transport energy consumption by end use, 1990 and 2000
Table 1.3 Factors affecting the change in energy consumption, 1970 to 2001
Table 1.4 Final energy consumption by final user 1970 to 2001
Table 1.5 Final energy consumption, by fuel, 1970 to 2001
Table 1.6 The Energy Ratio, 1950 to 2001
Table 1.7 Final Energy Consumption by sector, by fuel, in primary energy equivalents, 1970 to 2001
Table 1.8 Factors affecting the change in delivered energy between 1990 and 2000
Table 1.9 Factors affecting the overall change in primary energy demand, 1990 to 2000
Table 1.10 Factors affecting conversion losses between 1990 and 2000
Table 1.11 Primary energy saving from 1 toe reduction in final energy demand, 1970 to 2000
Transport energy consumption
Table: 2.1 Transport energy consumption by type of transport and fuel, 1970 to 2001
Table 2.2 Passenger kilometres by bus, rail, air, motorcycle, pedal cycle, 1970 to 2000
Table 2.3 Reasons why people travel by distance travelled per person per year by main mode of road transport
Table 2.4 Freight tonne-kilometres by road, rail, air, water and pipeline (on a ‘goods moved basis’), 1970 to 2000
Table: 2.5 Energy intensities by road passenger and road freight and air transport, 1970 to 2000
Table 2.6 Road transport energy use by vehicle type, split by Derv and petrol, 1970 to 2000
Table 2.7 Car use per person and car occupancy rates 1970 to 2000
Table 2.8 Fuel consumption factors for cars and lorries
Table 2.9 Passenger numbers and seat occupancy rates for UK airlines, 1990 to 2000
Table 2.10 Factors affecting changes in transport energy use between 1990 and 2000
Table 2.11 Transport energy consumption re-allocated to domestic, industrial and service sectors, 1990 to 2000
Domestic energy consumption
Table 3.1 Domestic energy consumption by fuel, unadjusted 1970 to 2000
Table 3.2 Domestic energy consumption in terms of primary equivalents, by fuel, 1970 to 2000
Table 3.3 Drivers of energy consumption
Table 3.4 Domestic energy intensity, 1970 to 2000
Table 3.5 SAP rating, 1970 to 2000
Table 3.6 Domestic energy consumption by end use, 1970 to 2000
List of tables available on the Internet
ECUK 16/7/02 9:35 AM Page 45
ENERGY CONSUMPTION IN THE UK46
Table 3.7 Domestic energy consumption by end use and fuel, 1990 to 2000
Table 3.8 Domestic energy consumption by end and fuel, in primary energy terms, 1970 to 2000
Table 3.10 Total electricity consumption by household domestic appliances
Table 3.11 Number of appliances owned by households in the UK
Table 3.12 Percentage of households owning household domestic appliances, 1970 to 2000
Table 3.13 Energy efficiency of new cold appliances, 1990 to 2000
Table 3.14 Ownership of central heating by type in Great Britain 1970 to 2000
Table 3.15 Ownership of loft insulation, cavity wall insulation, double glazing and hot water tankinsulation in Great Britain
Table 3.16 Internal and external temperatures
Table 3.17 Time use by category and activity1, 1995 and 2000
Table 3.18 Energy savings due to insulation and heating efficiency improvements
Industrial energy consumption
Table 4.1 Industrial energy consumption by fuel, 1970 to 2001
Table 4.2: Industrial energy demand in primary energy equivalents, by fuel, 1970 to 2001
Table 4.3 Industrial energy consumption by main industrial consuming group, 1990 to 2001
Table 4.4 Factors that affect industrial energy consumption
Table 4.5 Energy consumption per unit of output by main industrial group 1970 to 2001
Table 4.6 Detailed industrial energy consumption, by fuel, 1990 to 1999
Table 4.7 Industrial energy consumption by end use (different processes), 1999
Table 4.8 Factors affecting changes in industrial energy use between 1990 and 2000
Service sector energy consumption
Table 5.1 Service sector energy consumption by fuel, 1970 to 2001
Table 5.2 Service sector energy consumption by fuel, in primary energy equivalents, 1970 to 2001
Table 5.3 Factors affecting service sector energy consumption
Table 5.4 Energy intensity for the service sector, including the private commercial sector and public administration sector, 1970 to 2001
Table 5.5 Detailed service sector energy consumption by sub-sector and end use by fuel, 2000
Table 5.6 Detailed service sector energy consumption by sub-sector and end use by fuel, in primary energy equivalents, 2000.
Table 5.7 Final energy consumption in the service sector by sub-sector and end use, 2000
Table 5.8 Average energy consumption per unit floor area for service sector buildings, 1994, 1997 and 2000
Table 5.9 Factors affecting service sector energy consumption between 1990 and 2000
ECUK 16/7/02 9:35 AM Page 46
ENERGY CONSUMPTION in the United Kingdom, brings
together statistics from a variety of sources to produce a comprehensive
review of energy consumption in the UK since the 1970s. This booklet
describes the key trends in energy consumption in the UK since 1970
with a particular focus on trends since 1990. It includes an analysis
of the factors driving the changes in energy consumption, the impact
of increasing activity, increased efficiency, and structural change
in the economy, while detailed tables can be found on the internet.
The information is presented in five sections covering firstly overall
energy consumption, then energy consumption in the transport,
domestic, industrial and service sectors.
Department of Trade and Industry, Bay 1108, 1 Victoria Street, London,
SW1H 0ET, tel. 020-7215 2697/2698
© Crown Copyright. Reproduction of information contained herein is prohibited without prior written permission.The Department of Trade & Industry reserves the right to alter or discontinue the text of or any table in this bulletin without further notice.
Prepared and published by the Department of Trade and Industry.Printed in the UK. DTI/Pub ????/1.5k/7/02/AR. URN 02/1049
UK Energy in Brief
Available free from the DTI
(020 7215 2698)
http://www.dti.gov.uk/energy/inform/energy_in_brief/
Digest of UK Energy Statistics 2002
Available from The Stationery
Office (0870 600 5522)
http://www.dti.gov.uk/energy/inform/dukes/
ENERGYCONSUMPTIONIN THE UNITED KINGDOM
Quarterly Energy Prices and Energy Trends
Available from the DTI
(020 7215 2698)
Price - £35p/a UK
http://www.dti.gov.uk/energy/inform/energy_trends/
http://www.dti.gov.uk/energy/inform/energy_prices/
ECUK 16/7/02 9:35 AM Page 48