modeling amphibian energetics, habitat suitability, and - amazon s3
TRANSCRIPT

Mt
Pa
b
c
a
ARRAA
KHPCWABMC
1
tatL2du2t
pc
(
0d
Ecological Modelling 221 (2010) 2675–2686
Contents lists available at ScienceDirect
Ecological Modelling
journa l homepage: www.e lsev ier .com/ locate /eco lmodel
odeling amphibian energetics, habitat suitability, and movements of westernoads, Anaxyrus (=Bufo) boreas, across present and future landscapes
aul E. Bartelt a,∗, Robert W. Klaverb, Warren P. Porterc
Dept. of Biology, Waldorf College, Forest City, IA 50436, USAU.S. Geological Survey, Earth Resources Observation and Science Center, 47914 252nd Street, Sioux Falls, SD 57198-0001, USA207 Zoology Research, 250N. Mills Street, University of Wisconsin-Madison, Madison, WI 53706, USA
r t i c l e i n f o
rticle history:eceived 24 November 2009eceived in revised form 15 July 2010ccepted 19 July 2010vailable online 24 August 2010
eywords:abitat modelinghysiological modelingost surfacesestern toads
naxyrus boreasufo boreasovement corridors
a b s t r a c t
Effective conservation of amphibian populations requires the prediction of how amphibians use and movethrough a landscape. Amphibians are closely coupled to their physical environment. Thus an approachthat uses the physiological attributes of amphibians, together with knowledge of their natural history,should be helpful. We used Niche MapperTM to model the known movements and habitat use patternsof a population of Western toads (Anaxyrus (=Bufo) boreas) occupying forested habitats in southeasternIdaho. Niche Mapper uses first principles of environmental biophysics to combine features of topography,climate, land cover, and animal features to model microclimates and animal physiology and behavioracross landscapes. Niche Mapper reproduced core body temperatures (Tc) and evaporation rates of livetoads with average errors of 1.6 ± 0.4 ◦C and 0.8 ± 0.2 g/h, respectively. For four different habitat types, itreproduced similar mid-summer daily temperature patterns as those measured in the field and calculatedevaporation rates (g/h) with an average error rate of 7.2 ± 5.5%. Sensitivity analyses indicate these errorsdo not significantly affect estimates of food consumption or activity. Using Niche Mapper we predicted
limate warmingthe daily habitats used by free-ranging toads; our accuracy for female toads was greater than for maletoads (74.2 ± 6.8% and 53.6 ± 15.8%, respectively), reflecting the stronger patterns of habitat selectionamong females. Using these changing to construct a cost surface, we also reconstructed movement pathsthat were consistent with field observations. The effect of climate warming on toads depends on theinteraction of temperature and atmospheric moisture. If climate change occurs as predicted, results from
at clads i
Niche Mapper suggests thlimiting the activity for to
. Introduction
Amphibians are high-profile elements of the sixth mass extinc-ion (Wake and Vrendenburg, 2008; Rohr et al., 2008), and loss,lteration, or fragmentation of both breeding and terrestrial habi-at are leading causes of declines (Green, 1997; Stuart et al., 2004;annoo, 2005; Funk et al., 2005; Muths et al., 2006; Harper et al.,008). Long-term historical climate change has facilitated geneticivergence of amphibian species through range alteration or pop-lation isolation (e.g., Goebel et al., 2009; Shepard and Burbrin,009). In contrast, rapid environmental change could contribute
o amphibian population declines.Amphibians are wet-skinned ectotherms that are closely cou-led to their physical environment; factors that contribute to theirore body temperature include dynamic, complex interactions of
∗ Corresponding author. Tel.: +1 641 585 8236; fax: +1 641 585 8194.E-mail addresses: [email protected] (P.E. Bartelt), [email protected]
R.W. Klaver), [email protected] (W.P. Porter).
304-3800/$ – see front matter © 2010 Elsevier B.V. All rights reserved.oi:10.1016/j.ecolmodel.2010.07.009
imate warming will increase the physiological cost of landscapes therebyn different habitats.
© 2010 Elsevier B.V. All rights reserved.
heat energy fluxes and evaporation (Tracy, 1976). The amount ofenergy absorbed by a terrestrial amphibian depends on physicalfeatures of the animal (e.g., shape, color, and behavior) and weatherconditions as modified by habitat structure (Fig. 1). The potentialphysiological states (e.g., core temperature) experienced by the ani-mal then reflect the net energy absorbed, plus the cooling effect ofevaporation. The animal’s actual physiological states will be sub-sets of the potential states and influenced by factors such as foodavailability, predator avoidance, and the animal’s hydration state(i.e., the more water it is storing, the more evaporation it can tol-erate). Finally, the actual physiological state of the animal directlyaffects its behavior, growth, and other functions. Hence, habitatsselected by an amphibian can have direct physiological and func-tional consequences (Huey, 1991), and the rapid climate change weare experiencing could exacerbate effects of habitat loss (Pilliod
et al., 2002; Semlitsch and Bodie, 2003; Bartelt et al., 2004). Wewant to know how climate change might affect the microenviron-ments of amphibian terrestrial habitats. Predicting the movementcorridors and distribution of amphibians across a landscape andhow habitat changes might affect them is critical for developing
2676 P.E. Bartelt et al. / Ecological Modelling 221 (2010) 2675–2686
Fig. 1. Factors that affect amphibian body temperatures and physiology, and that are modeled by Niche Mapper. Environmental variables interact with intrinsic character-istics of amphibians to create a mosaic of microsite conditions for them. The microsite chosen by an amphibian will determine its body temperature and hydration state,a at altet
ee
rgmeaimmatpm
nd this can affect its physiology, growth, and behavior. Environmental change themperatures.
ffective conservation strategies, especially in light of a changingnvironment.
Recent advances in computer technology, the development ofemote sensing to create landscape datasets, and efficient Geo-raphic Information Systems (GIS) make possible the ability toodel animal energetics and behavior across entire landscapes. For
xample, Ray et al. (2002) used landscape data layers of estimatedmphibian suitability within a GIS to estimate the ease of amphib-ans to move through landscapes. Boone et al. (2006) used diffusion
odels with remotely sensed data to test factors affecting move-
ents of wood frogs (Rana sylvatica) among ponds in Minnesota,nd Kearney et al. (2008) calculated present and future distribu-ion limits of the cane toad in Australia. We used Niche Mapper, arocess-driven mechanistic model (Porter and Mitchell, 2006), toodel energetics and behavior in the context of detailed knowledge
rs either habitat structure or weather conditions also can affect amphibian body
of four highly divergent vegetation types (closed canopy forest,open canopy forest, dense shrub, and clearcut forest). To model toadenergetics and movements and evaluate effects of climate changeon these predictions we used three approaches. First, to test theaccuracy of our approach, we made direct comparisons betweenfield and laboratory measurements of toads and physical models(Bartelt and Peterson, 2005) against results calculated by NicheMapper using identical environmental data. Second, we appliedthe results of Niche Mapper to a landscape where habitat use andmovement and patterns of Western toads (Anaxyrus (=Bufo) boreas)
were previously measured (Bartelt, 2000; Bartelt et al., 2004) andtested its ability to map these patterns. Third, we ran Niche Map-per on this landscape under different weather conditions to test theeffects of a warming climate on altering the habitat conditions onthis landscape and its potential effects on toads.
Modelling 221 (2010) 2675–2686 2677
2
2
neai“
2
Ddeoatatasiwv
2
ie(aef
Q
B1AcetQ
m
wcw�tPt
(rcdaQamm
m
P.E. Bartelt et al. / Ecological
. Methods
.1. The Niche Mapper models
Niche Mapper is a patented collection of three mecha-istic models that include a broadly applicable microclimate,ctotherm and endotherm model of heat and mass transfer andnimal behavior. More details of these models can be foundn Porter et al. (1973), Porter and Mitchell (2006), and athttp://www.zoology.wisc.edu/faculty/Por/Por.html.”
.1.1. Microclimate modelThe microclimate model translates coarse spatial data, such as
igital Elevation Models (DEMs), vegetation data, weather stationata and spatially interpolated climate records, into microclimaticnvironmental variables relevant to the thermal and hydric ecol-gy of organisms. It includes a one-dimensional finite differencelgorithm that simultaneously solves heat and mass balance equa-ions for the ground surface and specified depths below. It includessubroutine for computing clear sky solar radiation given a specific
ime, latitude, longitude, elevation, slope and aspect (McCulloughnd Porter, 1971). The microclimate model requires climate (2 mhade air temperature, wind speed, humidity and cloud cover) max-mum and minimum data for arbitrary time intervals, e.g., monthly,
eekly or daily, and physical properties of the soil as major inputariables.
.1.2. Ectotherm modelWe modeled hourly core body temperatures (Tc) of toads by
terative solving for Tc in a steady-state heat (Q) energy balancequation containing terms representing solar (Qsolar), incomingQIRin) and outgoing (QIRout) thermal infrared radiation (IR), gener-ted metabolic heat (Qgen), respiratory (Qresp) and cutaneous (Qcut)vaporation, convective (Qconv) and conductive (Qcond) heat trans-er:
solar + QIRin + Qgen = Qresp + Qcut + QIRout + Qconv + Qcond (1)
asic elements of the model have been described elsewhere (Porter,989; Porter and Gates, 1969; Porter et al., 1973, 1994, Appendix; Porter and Mitchell, 2006). A critical aspect of the model in theontext of a wet-skinned amphibian is heat exchange via cutaneousvaporation. Qcut, is determined by the latent heat of vaporiza-ion, �, of water together with the rate of mass transfer such that,cut = m·�. The rate of mass transfer is defined as
= hD · A · (�w,skin − rh · �w,air) (2)
here m is the rate of mass transfer, hD is the mass transfer coeffi-ient, A is the area of the skin that acts as a free water surface acrosshich mass exchange occurs, rh is the local relative humidity, and
w,skin and �w,air are the densities of water vapor at saturation athe temperature of the animal surface and air, respectively. Seeorter and Mitchell (2006) and Tracy (1976) for further details onhe calculation of mass transfer rates.
The distributed metabolic heat generation term, Qgen, in Eq.1) was taken from Lillywhite et al. (1973) data for A. boreas,egressed to yield O2 in ml/(g/h) = 0.00861 × Tc − 0.06128; andonverted to J/s assuming a protein diet (4.5 kcal/L O2). Qgen
efines skin temperature, Ts for current environmental conditions,(spherical) geometry and a given iterative guess of Tc, since
gen = 6kV(Tc − Ts)/R2 (Porter et al., 1994; p. 156, Eq. (2)), where Vnd R are animal volume and radius and k is the effective flesh ther-
al conductivity (0.5 W/mC). Qgen also determines the requisiteass that must be absorbed from the gut, mabs in Eq. (3).Mass (molar) balance (g/d)in = mabs + mout (3)
Fig. 2. Location of Stamp Meadows study area in southeastern Idaho, USA.
defines molar balances for the respiratory and digestive system,where min is the rate of mass entering the imaginary surface acrossthe entrance to the system, mout is the rate of mass exiting throughthe imaginary surface across the exit of the system and mabs isthe mass crossing the internal surface of the system (the gut wallor the respiratory surface (lungs and skin)) (Fig. 2 in Porter et al.,2006). The metabolic processes of the body require that a specifiedmass of daily fuel and oxygen be available. Thus mass that mustbe absorbed daily, mabs, from the gut can be calculated from Qgen
requirements. Daily food intake required to maintain body weightis computed using the digestive efficiency of a particular diet com-position. The daily mass balance of the gut can be determined frombasic principles of environmental biophysics, since calculating therequired intake and the absorbed mass allows by difference themass out of the animal’s gut. Similarly, a molar balance on the res-piratory system allows calculation of the mass of oxygen that mustflow through the respiratory system on a daily basis to meet thedemands of metabolism. Niche Mapper used an assumed oxygenextraction efficiency of 12% for amphibians. This was based on workby Withers and Hillman (1983) that reports an extraction efficiencyfor two species of forced exercised anurans as 18%. Kalliokoski etal. (2001) report oxygen extraction efficiency for exercising humanmuscle at 49% compared to resting efficiency of 29%. This suggeststhat resting oxygen consumption is approximately 59% of activeefficiencies or for an 18% active anuran efficiency, a resting anu-ran efficiency of 11%. An additional 1% was added for cutaneousfunctions.
2.2. Testing the models
We tested the models at multiple scales. At the finest scale, wetested the ability of Niche Mapper to predict Tc and rates of evap-orative water loss (EWL) of individual animals under controlledlaboratory conditions. We then tested its ability to reproduce dailypatterns of operative temperature, Te (Bakken, 1989; Porter et al.,1973) and rates of EWL among four different habitats measured byphysical models (Bartelt and Peterson, 2005). At the largest scale,
we applied Niche Mapper to an 8 km2 landscape to test its abilityto predict known movements and habitat use patterns of West-ern toads in a forested area in southeastern Idaho, on the southernslopes of the Centennial Mountains (Fig. 2; Bartelt et al., 2004).
2 Mode
2
lrwea
2
tvd
2
vtifNWYddim
aCOcRlld
%
ws0
2
E1ffscmttNa
2
I
678 P.E. Bartelt et al. / Ecological
.3. Predicting Tc and rates of EWL
Bartelt and Peterson (2005) used a wind tunnel under controlledaboratory conditions to compare rates of heating and cooling andates of EWL of physical models to those of live toads. We enteredeather values for these conditions into Niche Mapper to calculate
xpected Tc and EWL rates under the same controlled conditionsnd compared these results against the actual Tc and EWL rates.
.4. Comparing patterns of Te and EWL among habitats
Before applying Niche Mapper to a landscape, we modifiedhe shade calculations to correct for solar zenith angle effects onegetation specific shade patterns and effects of different foliageensities on daily variations of relative humidity.
.4.1. Modifying Niche MapperTo improve the ability of the microclimate model to predict
ariations in temperature and humidity in different habitats acrosshe landscape we collected additional environmental information,ncluding measures of solar absorptivity and the percent of the sur-ace that is wet for different habitat types in nearby Yellowstoneational Park (D. Anderson, USDA Forest Service, unpubl. data).e also used a sling psychrometer and sets of physical models in
ellowstone National Park to measure daily differences in vaporensities (≤20 cm above ground) among vegetation cover typesuring summer and used these data to adjust the vapor density
nputs at 2 m height for corresponding habitats into the microcli-ate model.We collected data on percent shade of different vegetation types
t different solar altitudes in the Big Horn Crags of the Frankhurch Wilderness with four separate MicroWeather Stations fromnset Computer Corp (Pocasett, MA). The canopy cover values werealculated with a GAP Light Analyzer (Simon Frazier University,EM Department, 1999) using image data collected with a fish-eye
ens (Nikon Fisheye Converter FC-E8, 35 mm focal length equiva-ent, 183◦ angle) and camera (Nikon, 4500 Coolpix). The equationescribing these results we used was:
shade reduction from vertical sun values
= 0.0973122 − 0.9297X + 0.0286672X2 − 0.00021071X3
+ 334.216Y − 835.91Y2 + 1072.99Y3 − 468.996Y4
here X is the zenith angle (◦) and Y is the % cover/100. The regres-ion includes data over the range of 0.7–70.2% cover with an R2 of.797.
.4.2. Comparing Niche Mapper to field dataTo test the ability of Niche Mapper to predict Te and rates of
WL in particular habitats, we used field data collected on 25 July,995 with replicates of physical models placed within four differentorested habitats (Bartelt, 2000). These habitats included matureorest (canopy cover = 67%), thinned forest (canopy cover = 25%),hrub (tree canopy cover = 5% and shrub canopy cover = 80%), andlearcut (canopy cover = 2%). By placing these stationary physicalodels in exposed and shaded microsites, we were able to bound
he extremes of conditions available to free-ranging toads amonghese habitats. Using data from an on-site weather station, we raniche Mapper to calculate hourly values of operative temperaturend EWL for these habitats.
.5. Using Niche Mapper to map the landscape for toad suitability
We applied Niche Mapper to an 8 km2 study site in southeasterndaho (Stamp Meadows) to test its ability to accurately map daily
lling 221 (2010) 2675–2686
habitats for Western toads and estimate movement patterns. Wecompared these results to known patterns of toad movements andhabitat use (Bartelt et al., 2004). Although Western toads are con-sidered habitat generalists (Muths and Nanjappa, 2005), field datashow that microenvironmental variation among habitats affecttheir activity and habitat selection (Bartelt, 2000; Bartelt et al.,2004).
2.5.1. Study areaStamp Meadows is located on the Targhee National Forest in
southeastern Idaho. It is a grassy meadow surrounded by a mosaicof coniferous habitats (Pinus, Picea, and Abies spp.) that have beenmodified by logging. In spring of normal to wet years, watercollects to form a large (10–15 ha) pond, bordered by willows(Salix spp.), aspen (Populus tremuloides), and lodgepole pine (Pinuscontorta). Toads bred in this filled pond from late May throughmid-June.
2.5.2. Input dataWe compiled all geospatial information as raster data at 30-
m cell size. We used a Digital Elevation Model (DEM; Geschet al., 2002) to acquire topographic data (elevation, slope, andaspect) and DayMet weather model (Thornton et al., 1997;http://www.daymet.org) to acquire maximum and minimum tem-peratures and vapor densities. Because the weather data werecompiled at 1-km resolution, we resampled the data to 30-m cellsize and adiabatically adjusted temperature (−5.5 ◦C/km) for eachcell according to changes in elevation relative to the elevation forthe 1 km cell. Habitat data (cover types and percent canopy cover)were acquired from previous field measurements (Bartelt et al.,2004). Because these field measurements were collected for eachof two years (1993 and 1995), we ran Niche Mapper twice, once foreach year.
2.5.3. Derived variables for the suitability indexIn addition to the standard output variables computed by Niche
Mapper (e.g., daily evaporation, maximum core body temperature),we derived additional data related to the biology of Western toads.Lillywhite et al. (1973) found that 27.3 ◦C was an optimal Tc for anumber of physiological functions; hence, we counted the num-ber of hours that Tc ≥ 27 ◦C (Tc27). We counted the number ofhours that air temperature (Ta) < 8 ◦C (Tc8), because toads gener-ally moved least during cool night-time air temperatures (Ta ≤ 8 ◦Cin Bartelt et al., 2004; Ta < 5 ◦C in Sullivan et al., 2008). We alsocounted the number of hours that Tc ranged between 15 and 27 ◦C(Tc20) to estimate the daytime hours available for toads to forage,etc. Basking toads shuttled between sunlight and the moist sub-strate of shade, apparently balancing their thermal and moistureneeds. In drying habitats, hydroregulation can be costly to toadsbecause lower body water content constrains their activity. Themaximum water that toads would voluntarily lose before seekingshade was about 7.5 g (∼14% of body weight; Bartelt, 2000). In morehumid habitats, this was not a problem; but in drier conditionstoads showed reduced basking and/or foraging times and coolerTcs. Cooler body temperatures can reduce growth rates (Lillywhiteet al., 1973), sprint speeds (Tracy et al., 1993), and have cumula-tive physiological consequences (Huey, 1991). To estimate the costof hydroregulation to toads (i.e., potential hours of basking andsolar heating constrained by evaporation), we divided the calcu-lated evaporation by 7.5 and reduced the values of Tc27 by thisproportion.
Finally, we wanted to create a single, composite and unitlessmeasure that would capture the totality of a habitat’s suitabilityfor toads (similar to an approach used by Karr, 1981). We created aunitless overall “suitability index” through a linear combination ofthe derived variables described above. Toads were most active and

P.E. Bartelt et al. / Ecological Mode
Table 1The set of seven a priori models used to predict the daily habitats used by Westerntoads in the Stamp Meadows area, southeastern Idaho. For each of 13 toads, 80% ofthe field data were used to build logistic regression models and 20% reserve data tovalidate the best models.
Model # Predictor variables
1 Suitability2 Evaporation3 Tc27
maf
S
2
idapctlduneocroito
mhtefatc(tusli
TTmt
4 Evaporation + Tc275 Evaporation + suitability6 Evaporation + Tc27 + Tc20 + suitability7 (Evaporation × Tc27) + Tc20 + suitability
ade long-distance movements during the months of June, July,nd August; hence, this “suitability index” used data calculated onlyor these months:
uitability = Tc20 +(
Tc27 −(
daytime evap7.5
))− Tc8 (4)
.6. Predicting habitat use and movements
At the Stamp Meadows site, toads selected daily retreat sitesn habitats where they could hydroregulate and thermoregulateuring daytime activities, such as foraging, basking (Bartelt, 2000),nd making shorter (≤50 m) movements. We used Niche Map-er to test the hypothesis that toads selected sites that were lessostly. To map the distribution of these sites (a measure of habi-at selection), we used a Geographic Information System (GIS) andogistic regression models with data layers for each of several stan-ard and derived Niche Mapper output variables. For each toad, wesed the coordinates of its retreat sites, coordinates from an equalumber of randomly selected sites, and sampled the data layer forach of the variables. We used Niche Mapper results from 1993r 1995, depending which year the toad was studied. Eighty per-ent of the data were used to build the logit models, reserving theemaining 20% for validation. For each toad, we tested an a pri-ri set of models (Table 1) and selected the best model with annformation–theoretic approach (Burnham and Anderson, 2002),hen validated its accuracy.For each toad, we tested an a priori setf models (Table 1) and selected
By restricting their long-distance (>100 m) dispersal move-ents primarily at night, these toads avoided the higher
ydroregulatory costs of drier daytime conditions. By connectinghe sequential coordinates of daily retreat sites, Bartelt et al. (2004)stimated the seasonal paths followed by toads. They found thatemale toads traveled longer distances from their breeding pondnd selected daily habitats with warmer and more humid condi-ions. We used Niche Mapper and cost-surface analysis to calculateumulative costs and replicate patterns of movement. Cost-surfaceor friction surface) functions are fundamental operations of the GIS
oolbox (Berry and Tomlin, 1982; Berry, 1987; Douglas, 1994). Wesed the GIS (ArcMap v. 9.2) function “COSTPATH” to calculate twoets of ideal least-cost paths for each of six toads that traveled theongest distances; one set was created using the “overall suitabilityndex” and the second with calculated amounts of daily EWL. Weable 2hree different scenarios of climate change for the Stamp Meadows area tested with Nichinimum temperature (Tmin), and relative humidity (RH; estimated from predicted chan
emperatures.
Scenario # �Tmax (◦C) �Tmin (◦C)
June July Aug June
1 +2 +2 +1 +0.52 +4 +4 +3 +23 +6 +5 +5 +4
lling 221 (2010) 2675–2686 2679
compared the cost of paths used by toads to those of straight linesconnecting the beginning and ending points of travel (the shortestEuclidian distance), and some randomly generated paths for eachtoad. Cost-surface analysis uses two input maps: a map of habitatpatches that function as sources and a map of the cost of mov-ing among patches. The output mapped locations with the leastaccumulated cost (i.e., the summated cost of sequential cells) for atoad to reach it from the source habitat patches. The locations maybe interpreted as a species-specific connectivity measure that isweighted by the intervening matrix. We used Niche Mapper resultsfor 1993 for toads #25 and 31, and 1995 results for toads #4, 72,73, and 78.
2.7. Testing scenarios of environmental change
We used Niche Mapper to estimate how a warming climatemight affect conditions of the habitats used by toads in StampMeadows. We based this test on long-term (1937–2008) averageweather conditions collected at the Island Park weather station(∼10 km from Stamp Meadows and similar elevation), becausethese data show that monthly summer temperatures for 1993 werecooler than average (0.5–7.1 ◦C for maximum temperatures and0.2–2.9 ◦C for minimum temperatures); because precipitation forthe summer of 1993 was greater by only 0.5 cm, we used 1993 val-ues for moisture. A number of climate scenarios predict a range ofwarmer temperatures, from a minimum of about 2 ◦C to a maxi-mum of 6 ◦C (IPCC, 2007) and increased precipitation. Therefore,we tested three different warming scenarios (Table 2) with NicheMapper.
3. Results
3.1. Predicting Tc and rates of EWL
Niche Mapper reproduced toad Tc with an average error of1.6 ± 0.4 ◦C over the temperature range of 8–29 ◦C (Fig. 3A). It repro-duced rates of EWL with an average error of 0.8 ± 0.2 g/h over a totalEWL range of 0.2–6.7 g/h (Fig. 3B).
3.2. Comparing patterns of Te and EWL among habitats
In some habitats, daily variations of Te recorded by physicalmodels included the effect of shading and sun flecks as they movedacross the ground (Fig. 4). While Niche Mapper did not capturethese short-term temporal variations, its general predictions oftoad Tc showed similar maxima and minima as Te for the differ-ent habitats and a similar number of hours that Tc and Te occurswithin certain temperature ranges (Table 3). The average error was1.4 ± 0.2 h. This was expected given that the time step in the animalcalculations was hourly and rounding error could account for mostof these differences.
Under similar weather conditions, Niche Mapper calculatedgreater amounts of EWL for habitats with less cover (Fig. 5A).The average error in predicting amounts of EWL was 2.4 ± 1.7 g/d(7.2 ± 5.5% of that measured by the physical models; Fig. 5A). Aver-age daily Ta increased from May to July and then decreased to
e Mapper. Each scenario is described by a change in maximum temperature (Tmax),ges in precipitation). These values were added to long-term (1937–2008) average
�RH
July Aug June July Aug
+0.5 0 ×1.05 ×1.05 ×1.05+2 +1 ×1.1 ×1.1 ×1.1+4 +6 ×1.15 ×1.15 ×1.15

2680 P.E. Bartelt et al. / Ecological Modelling 221 (2010) 2675–2686
Table 3Number of hours within selected temperature ranges.
Habitat <8 ◦C 8–15 ◦C 15–27 ◦C >27 ◦C
Physical models (Te) Closed Canopy 7 10 6 1Open canopy 9 7 5 3Shrub 9 4 5 6Clearcut 10 5 3 6
Niche Mapper (Tc) Closed Canopy 6 11 5 2Open canopy 10 6 3 5Shrub 10 5 3 6Clearcut 7 8 2 7
Sdfaod
3
wh
Flbtafteh
Difference Closed Canopy 1Open canopy −1Shrub −1Clearcut 3
eptember, and average daily RH varied inversely (Fig. 5B). As pre-icted by Niche Mapper, monthly rates of EWL generally increasedrom May to July, then decreased to September. However, themount of change varied among the habitats, with less variationccurring in habitats with greater amounts of shade and foliageensity.
.3. Using Niche Mapper to reclassify a landscape
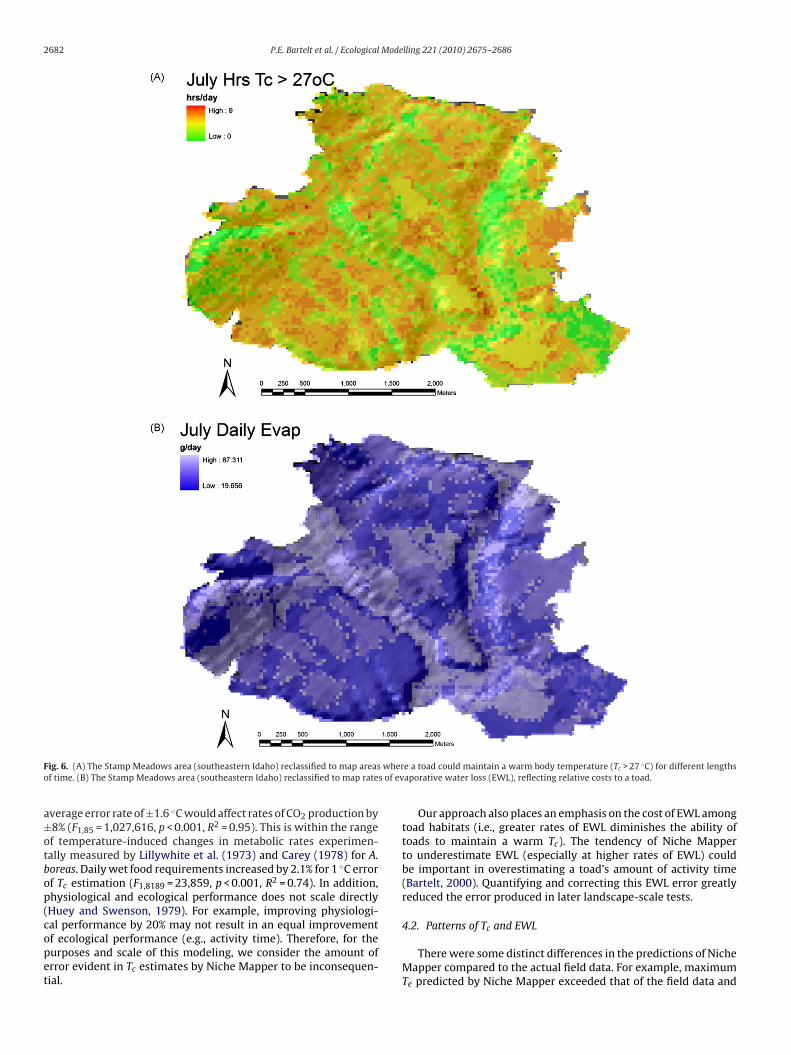
Results from Niche Mapper generated a patchy landscapehere, for example, toads could maintain a Tc of ≥27 ◦C for differentours in a day (Fig. 6A), or the amount of water toads would lose
ig. 3. Comparison of actual toad body temperatures and rates of evaporative wateross to those calculated by Niche Mapper. Bartelt and Peterson (2005) compared theehavior of physical models to live toads under 10 separate trials of controlled condi-ions. We entered these same experimental conditions into Niche Mapper to test itsbility to reproduce the Tc and EWL rates of live toads. (A) Body temperatures. Exceptor two points, Niche Mapper temperatures were within 1.5 ◦C of actual tempera-ures. The two points of larger differences may have resulted from measurementrror. (B) Evaporative water loss (EWL). Niche Mapper tended to underestimateigher rates of EWL.
−1 1 −11 2 −2
−1 3 0−3 1 −1
through evaporation during the day (Fig. 6B). The patterns of thesemaps reflect the patterns of vegetation and cover on this landscape(Fig. S1).
3.3.1. Predicting habitat use and movement pathsIn predicting daily habitats, models that used a combination of
warmer body temperatures and “suitability”, constrained by evapo-ration, scored highest (Table 4). Maps of daily habitats produced bythese models (Fig. S2) were consistent with differences observedin patterns of habitat selection between male and female toads(Bartelt et al., 2004). That is, the models had weak or no predictivepower for males and better predictive power for females, reflectingstronger patterns of habitat selection among females. Limiting testsof validation to toads with at least six observations in the reservedata, predictive accuracy for seven males averaged 53.6 ± 15.8%,
and that for six females averaged 74.2 ± 6.8%.Daily amounts of EWL provided the best results for cost-analysisand produced idealized least-cost paths that best replicated pathsused by toads (Fig. 7). In all cases, accumulated costs for least-cost paths were substantially less than costs for either used or
Fig. 4. (A) Daily variation of operative temperature (Te) in the Stamp Meadows area(southeastern Idaho) recorded by physical models on 25 July 1995. (B) Variation incore body temperature (Tc) of Western toads as predicted by Niche Mapper usingweather conditions recorded for the same area on the same day.

P.E. Bartelt et al. / Ecological Mode
Fmev
sca
3
m
TSw
ig. 5. (A) Total amounts of water lost for 25 July 1995 as recorded by physicalodels and predicted by Niche Mapper for the Stamp Meadows area (southeast-
rn Idaho). (B) Monthly variation of EWL predicted by Niche Mapper, compared toariation in Ta and RH.
traight-line paths (Fig. 8). With one exception, the accumulatedost difference between used and straight-line paths diminished
s the total distance traveled decreased..3.2. Testing scenarios of environmental changeIgnoring the need for hydroregulation, toads could theoretically
aintain a warmer body temperature (Tc ≥ 27 ◦C) under the sce-
able 4ummary of ability of logit models to predict daily habitat use by Western toads in the Sere used for this analysis.
Toad # n Best model
Male toads5 6 7
50 6 661 6 763 8 465 8 667 12 671 8 6Average = 53.6 ± 15.8%
Female toads4 12 4
22 6 431 8 646 6 772 8 678 12 6Average = 74.2 ± 6.8%
lling 221 (2010) 2675–2686 2681
nario of a warmer climate (Fig. 9A). Evaporation rates, however,also increased over a large percentage of the landscape (Fig. 9B);thereby, constraining the number of hours a toad could maintain awarm body temperature by its need for hydroregulation. The effectof all three warming scenarios was similar: compared to averageconditions, a smaller proportion of the landscape would providetoads the ability to maintain a warm body temperature withoutdehydrating (Fig. 10). Furthermore, this proportion decreased withincreased warming.
4. Discussion
4.1. Predicting Tc and EWL
Niche Mapper was able to predict Tc of live toads under con-trolled conditions with an average error of 1.6 ± 0.4 ◦C. Among thetotal 10 trials, it overestimated Tc in trials #4 and 9 by 4.2 and3.3 ◦C, respectively; a difference up to 10 times greater than theerror for other trials. Excluding these two data points reduced theaverage error to 1.1 ± 0.2 ◦C. Niche Mapper underestimated ratesof EWL in four trials with peaks of evaporation rates. The overallerror was 0.92 g/h; excluding these four trials reduced the error to0.44 ± 0.1 g/h.
Cause for these large errors is uncertain. It could have resultedfrom potential measurement error reported in Bartelt and Peterson(2005), or Niche Mapper may simply be under-calculating higherrates of EWL. The trials where Tc was overestimated were also twoof the four where evaporation was underestimated. This patternof error would be consistent with the physiology of amphibianswhere, within steady-state conditions, reduced rates of evap-oration would translate into higher Tc (Tracy, 1976; Campbelland Norman, 1998). If so, this discrepancy can be adjusted: toadEWL = (Niche Mapper × 1.3925) + 0.0541; R2 = 0.932, F1,9 = 124.6,p < 0.001.
The practical effect of these errors would be to incorrectlyestimate animal metabolism and activity, because physiologicalperformance in amphibians is markedly temperature dependent(Carey, 1978). However, because their physiological performancelacks broad plateaus of thermal independence (Carey, 1978) andchange in metabolic rate diminishes at warmer temperatures
(Lillywhite et al., 1973; Carey, 1978) when toads are more active,the amount of error will change with Tc and may be relativelysmall. For example, using calculations of hourly CO2 consumption(mol/h) and wet food requirements (g/d) from Niche Mapper (fit-ted to linear regression models), at temperatures of Tc ≥ 20 ◦C thetamp Meadows area, southeastern Idaho. Only toads with reserve data sets of ≥6
AICw ROC Prediction accuracy (%)
0.310 0.708 500.898 0.878 1000.854 0.844 1000.208 0.647 00.754 0.694 500.305 0.593 00.530 0.781 75
0.537 0.715 700.594 0.728 670.501 0.750 500.648 0.853 1000.953 0.901 750.646 0.814 83
2682 P.E. Bartelt et al. / Ecological Modelling 221 (2010) 2675–2686
F whero s of ev
a±otbop(copet
ig. 6. (A) The Stamp Meadows area (southeastern Idaho) reclassified to map areasf time. (B) The Stamp Meadows area (southeastern Idaho) reclassified to map rate
verage error rate of ±1.6 ◦C would affect rates of CO2 production by8% (F1,85 = 1,027,616, p < 0.001, R2 = 0.95). This is within the rangef temperature-induced changes in metabolic rates experimen-ally measured by Lillywhite et al. (1973) and Carey (1978) for A.oreas. Daily wet food requirements increased by 2.1% for 1 ◦C errorf Tc estimation (F1,8189 = 23,859, p < 0.001, R2 = 0.74). In addition,hysiological and ecological performance does not scale directlyHuey and Swenson, 1979). For example, improving physiologi-
al performance by 20% may not result in an equal improvementf ecological performance (e.g., activity time). Therefore, for theurposes and scale of this modeling, we consider the amount ofrror evident in Tc estimates by Niche Mapper to be inconsequen-ial.e a toad could maintain a warm body temperature (Tc > 27 ◦C) for different lengthsaporative water loss (EWL), reflecting relative costs to a toad.
Our approach also places an emphasis on the cost of EWL amongtoad habitats (i.e., greater rates of EWL diminishes the ability oftoads to maintain a warm Tc). The tendency of Niche Mapperto underestimate EWL (especially at higher rates of EWL) couldbe important in overestimating a toad’s amount of activity time(Bartelt, 2000). Quantifying and correcting this EWL error greatlyreduced the error produced in later landscape-scale tests.
4.2. Patterns of Tc and EWL
There were some distinct differences in the predictions of NicheMapper compared to the actual field data. For example, maximumTe predicted by Niche Mapper exceeded that of the field data and

P.E. Bartelt et al. / Ecological Mode
Fig. 7. (A) Using rates of EWL and cost-analysis to predict the movement of toad#31 across the Stamp Meadows landscape. (B) Using rates of EWL and cost-analysisto predict the movement path of toad #78 across the Stamp Meadows landscape.
Fig. 8. Differences in relative costs of paths across the Stamp Meadows landscape.Because total distances traveled by toads were different, the costs of paths for eachtoad were standardized by the cost for its least-cost path to allow comparisons.Except for toad #78, as the total distance traveled by a toad decreased, so did thedifferences in cost between the three paths. From location to location, the careemployed by toads to select lower cost travel paths may be small, but this differencebecomes more important over longer distances.
lling 221 (2010) 2675–2686 2683
briefly entered the range of the critical thermal maximum for A.boreas (Brattstrom, 1968). Why the mid-day Te for the shrub habitatdipped briefly is unclear to us.
Computer models cannot capture the totality of natural vari-ation. Comparing the Te data recorded in the field among varioushabitats for a day to that calculated by Niche Mapper using weatherdata collected on the same day, Niche Mapper did not replicate theexact shading pattern of different habitats. For example, it did notreplicate the periodic sun flecks as they moved across the physicalmodels, briefly warming them. With the broader goal of model-ing conditions across a landscape, however, capturing such minutedetails as periodic sun flecks may be less important than character-izing daily conditions available to amphibians in different habitats.Comparing the number of hours Te was within different tempera-ture ranges, Niche Mapper was within 1 h of the actual field data in69% (11 out of 16) of the measurements. Because of our modifica-tion of correcting for shade change due to angle for this particularstudy site, the calculated estimates of EWL were very close to themeasured field data.
4.3. Reclassifying the landscape
4.3.1. Habitat useComparing our results to those of Bartelt et al. (2004), we con-
sider Niche Mapper to be a robust approach for modeling thedistribution of suitable toad daily habitats across this landscape,because our modeling results closely reflect the actual patternsobserved in these toads. For example, clear habitat selection pat-terns were discernable for female toads, but not male toads,because male toads remained within the vicinity of the breedingpond and this probably released them from the need to carefullyconserve their body water. In Bartelt et al. (2004) and this study, thepredictive models for females were stronger than those for males.
4.3.2. MovementsUsing cost-analysis to predict the dispersal movements of these
toads may have only limited value, because they moved primar-ily at night when temperatures were cooler and relative humiditywas higher (Bartelt et al., 2004; Sullivan et al., 2008). Connectingsequential locations with straight lines very likely excludes muchdetail in their movement paths. In addition, the pattern evidentin Fig. 8 (diminishing differences between used and straight-linepaths as the total difference decreased) suggests that the cost ofthe path used by toads is more a function of distance traveled,rather than any discerning behavior of the toads. On the other hand,these differences also may suggest that while the toads did selectsites with lesser costs, the differences, while real, were small andaccumulated over longer distances. Regardless, given that a 60 g,free-ranging toad does not have the same total landscape perspec-tive as does a computer, the spatial distribution of the idealized,least-cost paths compared to the paths used by toads suggests thatthis approach holds value. For example, although the path followedby toad #78 (Fig. 7B) did not closely follow the least-cost path, itdoes follow a least-cost corridor. Exceptions (i.e., near the west endof the path) occurred on rainy days when daytime activity costswere reduced.
4.3.3. Global climate change: an applicationLike any other taxon, amphibians do not tolerate habitat mod-
ification/change well. Habitat loss and fragmentation is credited
for being a principle (if not the most important) factor contribut-ing to amphibian population declines (Green, 1997; Noss et al.,1997), and Gallant et al. (2007) suggests that continued trends ofhuman population growth and resource use will continue the lossof habitat.
2684 P.E. Bartelt et al. / Ecological Modelling 221 (2010) 2675–2686
F or toai n a wal
titSbaMm
Ffotma
ig. 9. The estimated effect of global warming on the Stamp Meadows landscape fncrease in the percentage of the landscape where toads could achieve and maintaiarger proportion of the landscape.
While the loss of habitat is an extreme change, what might behe effect of subtle changes (such as climate warming) in seeminglyntact habitats on amphibians? The answer, of course, depends onhe extent of change, but results from this study suggest that the
tamp Meadows landscape would become less friendly to toadsy making it more difficult for them to balance their thermalnd hydrological needs. Although a greater proportion of Stampeadows would support warmer body temperatures under cli-ate warming (Fig. 9A), a greater proportion also would experienceig. 10. The estimated effect of global warming on the Stamp Meadows landscapeor toads. These results suggest that, because of increased rates of evaporation, lessf the landscape would facilitate a toad’s ability to maintain a warm body tempera-ure (Tc > 27). Such an effect could reduce the connectivity of the landscape for toad
ovements, and/or reduce the amount of a toad’s daytime activity (e.g., foragingnd basking).
ds, expressed as a percentage of the total landscape. (A) Niche Mapper predicts anrm body temperature (Tc > 27). (B) The rate of evaporation also will increase over a
greater amounts of EWL (Fig. 9B). When combined, a toad wouldbe more constrained in maintaining warmer body temperaturesand suitable hydration levels (Fig. 10); this would translate intoreduced activity hours that could impact growth and reproductivepotential for both individuals and populations. Constraining theamount of time that toads could maintain warm body temperatureswould reduce their amounts of time for activities such as bask-ing and foraging, which could also reduce physiological functionincluding growth rates or the ability to produce eggs. For example,juvenile toads allowed access 5 h/d grew (snout-vent-length; SVL)four times faster over eight weeks than those allowed access toheat for only 1 h (Lillywhite et al., 1973). Similarly, P.S. Corn (pers.commun., 2007) measured growth (SVL) of brown morph leopardfrog (Rana pipiens) metamorphs in Colorado as a function of degree-days. He estimated that a 20% change in degree-days would resultin a 25% change in growth. Our study suggests a reduction by upto 40% for the amount of time that toads could effectively maintaina body temperature ≥27 ◦C (in effect, reducing its degree-days).Using the measurements of Lillywhite et al. (1973) and Corn, thiscould translate into a reduction in growth of up to 50%. While wedon’t know if adult toads would experience this much reduction, itseems clear their growth rates could be negatively affected underglobal warming.
The vulnerability of amphibians to certain diseases may also beexacerbated by climate change. A warming climate might affect the
spread and incidence of Batrachochytrium dendrobatidis, a majorand deadly pathogen of amphibians (Voyles et al., 2009). Our mod-eling approach may help address this relationship (e.g., Pilliod etal., 2010).
Mode
ammec(ihtmbc
estfamrOpwi
5
appowNbp
etataba2TcpptcioeZ(sawolAaea
P.E. Bartelt et al. / Ecological
Increasing the physiological cost of a landscape could alsoffect amphibian populations by affecting dispersal patterns andetapopulation structure. Because frogs and toads may travel kilo-eters overland to reach other ponds, foraging areas, hibernacula,
tc. (e.g., Pilliod et al., 2002; Muths, 2003), habitat fragmentationould be an important factor in amphibian population declinesLaan and Verboom, 1990; Funk et al., 2005). Before climate warm-ng affects plants directly and alters the physical structure ofabitats, results from this study suggest that microenvironmen-al conditions could be altered sufficiently to increase the cost of
ovements or diurnal activities such as foraging. Habitats may note physically fragmented, but from an amphibian perspective, theyould be “thermally fragmented.”
A different set of results could be produced under a differ-nt set of assumptions. Because the long-term Island Park datahowed a very small difference in rainfall compared to, 1993 condi-ions, we assumed negligible differences in atmospheric moistureor the climate scenario tests. If rainfall increases proportion-lly to increases in temperature, then the resulting warming andore humid microenvironmental conditions of habitats might
educe the physiological cost of amphibian terrestrial habitats.n the other hand, in areas where rainfall and moisture isredicted to decrease (e.g., large portions of western and south-estern U.S.), the physiological cost of landscapes could greatly
ncrease.
. Conclusions
A careful comparison of laboratory and field experimental datagainst Niche Mapper shows that robust estimates of body tem-erature, water loss rates, and likely movement and habitat useatterns of A. boreas on the landscape can be obtained knowingnly measurable landscape and animal properties. We are workingith other populations in other areas (central Idaho, Yellowstoneational Park, northern Midwest) to begin assessing the applica-ility of these results to this and other species (Rana luteiventris, R.ipiens, Anaxyrus americanus).
The effect of a warming climate on these wet-skinnedctotherms depends also on changes in atmospheric moisture pat-erns. Under the assumptions of this study, relatively constanttmospheric moisture could accentuate drying conditions and fur-her stress amphibians. A warmer climate with greater amounts oftmospheric moisture could benefit these wet-skinned ectothermsy reducing physiological costs. The resulting warmer Tcs mightlso reduce the incidence of chytridiomycosis (Woodhams et al.,003; Rohr et al., 2008), although a connection between warmercs and chytridiomycosis is uncertain (Pilliod et al., 2010). A. boreasan adapt to habitat change (e.g., fire; Hossack and Corn, 2007),rovided water sources (Hossack and Corn, 2008) or adequaterotective cover (Bartelt et al., 2004) are available. Our mechanis-ic modeling suggests that projections of consequences of climatehange for toads and their climate constrained distribution limitsn the future can be assessed reliably within the confidence limitsf global climate simulations that drive these mechanistic mod-ls. Analogous calculations for Tuataras on coastal islands of Newealand (Mitchell et al., 2008), Hawaiian honeycreepers on MauiPorter et al., 2006), the endangered Japanese Serow deer on Hon-hu (Natori and Porter, 2007), cane toad and the mosquito, Aedesegypti in Australia (Kearney et al., 2008, 2009) using the same soft-are package suggest that this approach is robust for simulations
f animals’ energetics, behavior and distribution limits in the geo-
ogical past, current climatic conditions and future climate events.s these calculations have also shown, different critical variablespply to different species depending on their properties, the prop-rties of the landscapes that harbor them and the questions beingsked.lling 221 (2010) 2675–2686 2685
Acknowledgements
C.R. Peterson, A.L. Gallant, and D.S. Pilliod participated in theearly development of the ideas presented in this paper. D.S. Pilliodalso provided field assistance. S. Searcy assisted with analysis ofthe relationship between solar zenith and shade patterns. P.S. Cornand D.S. Pilliod reviewed an earlier draft of this manuscript. Theinitial work presented here was completed at the USGS EROS DataCenter where PEB held a National Research Council Research Asso-ciateship Award. Any mention of trade, product, or firm names isfor descriptive purposes only, and does not imply endorsement bythe US Government.
Appendix A. Supplementary data
Supplementary data associated with this article can be found, inthe online version, at doi:10.1016/j.ecolmodel.2010.07.009.
References
Bakken, G.S., 1989. Influence of arboreal perch properties on the operative temper-ature experienced by small lizards. Ecology 70, 922–930.
Bartelt, P.E., 2000. A biophysical analysis of habitat selection in Western toads(Anaxyrus boreas) in southeastern Idaho. Ph.D. Dissertation. Idaho State Uni-versity. Pocatello, ID, USA, 112 pp.
Bartelt, P.E., Peterson, C.R., 2005. Physically modeling operative temperatures andevaporation rates in amphibians. J. Therm. Biol. 30, 92–102.
Bartelt, P.E., Peterson, C.R., Klaver, R.W., 2004. Sexual differences in the post-breeding movements and habitats selected by Western toads (Anaxyrus boreas)in southeastern Idaho. Herpetologica 60, 455–467.
Berry, J.K., 1987. Fundamental operations in computer-assisted map analysis. Int. J.Geogr. Inform. Syst. 1, 119–136.
Berry, J.K., Tomlin, C.D., 1982. Cartographic modeling: computer-assisted analysis ofeffective distance. Proc. Symp. Mach. Process. Remot. Sensed Data 8, 503–510.
Boone, R.B., Johnson, C.M., Johnson, L.B., 2006. Simulating wood frog movement incentral Minnesota, USA, using a diffusion model. Ecol. Model. 198, 255–262.
Brattstrom, B.H., 1968. Thermal acclimation in anuran amphibians as a function oflatitude and altitude. Comp. Biochem. Phys. B 24, 93–111.
Burnham, K.P., Anderson, D.A., 2002. Model selection and multimodel inference: apractical information–theoretic approach, 2nd ed. Springer, New York, NY, USA,488 pp.
Campbell, G.S., Norman, J.M., 1998. An Introduction to Environmental Biophysics,2nd ed. Spring-Verlag, New York, NY, USA, 286 pp.
Carey, C.C., 1978. Factors affecting body temperatures of toads. Oecologia 35,197–219.
Douglas, D.H., 1994. Least-cost path in GIS using an accumulated cost surface andslopelines. Cartographica 31, 37–51.
Funk, W.C., Greene, A.E., Corn, P.S., Allendorf, F.W., 2005. High dispersal in a frogspecies suggests that it is vulnerable to habitat fragmentation. Biol. Lett. 1,13–16.
Gallant, A.L., Klaver, R.W., Casper, G.S., Lannoo, M.J., 2007. Global rates of habitat lossand implications for amphibian conservation. Copeia 2007, 967–979.
Gesch, D., Oimoen, M., Greenlee, S., Nelson, C., Steuck, M., Tyler, D., 2002. The nationalelevation dataset. Photogramm. Eng. Remot. Sen. 68, 5–11.
Goebel, A.M., Ranker, T.A., Corn, P.S., Olmstead, R.C., 2009. Mitochondrial DNA evo-lution in the Anaxyrus boreas species group. Mol. Phylogenet. Evol. 50, 209–225.
Green, D.M., 1997. Perspectives on amphibian population declines – defining theproblem and searching for answers. In: Green, D.M. (Ed.), Amphibians in Decline:Canadian Studies of a Global Problem, Herpetological Conservation, NumberOne. Society for the Study of Amphibians and Reptiles, St. Louis, MO, USA, pp.291–308.
Harper, E.B., Rittenhouse, T.A.G., Semlitsch, R.D., 2008. Demographic consequencesof terestrial habitat loss for pool-breeding amphibians: predicting extinc-tion risks associated with inadequate size of buffer zones. Conserv. Biol. 22,1205–1215.
Hossack, B.R., Corn, P.S., 2007. Responses of pond-breeding amphibians to wildlife:short-term patterns in occupancy and colonization. Ecol. Appl. 17, 1403–1410.
Hossack, B.R., Corn, P.S., 2008. Wildlife effects on water temperature and selectionof breeding sites by the boreal toad (Anaxyrus boreas) in seasonal wetlands.Herpetol. Conserv. Biol. 3, 46–54.
Huey, R.B., 1991. Physiological consequences of habitat selection. Am. Nat. 137,S91–S115.
Huey, R.B., Swenson, R.D., 1979. Integrating thermal physiology and ecology of eco-totherms: a discussion of approaches. American Zoologist 19, 357–366.
IPCC, 2007. An assessment of the Intergovernmental Panel on Climate Change: Syn-thesis Report. Valencia, Spain, 52 pp.
Kalliokoski, K.K., Oikonen, V., Takala, T., Sipila, O., Knuuti, H., Nuutila, J.P., 2001.Enhanced oxygen extraction and reduced flow heterogeneity in exercisingmuscle in endurance-trained men. Am. J. Physiol. Endocrinol. Metab. 280 (6),E1015–E1021.

2 Mode
K
K
K
L
L
L
M
M
M
M
M
N
N
P
P
P
P
P
(Suppl. 1), 11466–11473.Withers, P., Hillman, S., 1983. The effects of hypoxia on pulmonary function and max-
686 P.E. Bartelt et al. / Ecological
arr, J.R., 1981. Assessment of biotic integrity using fish communities. Fisheries 6,21–27.
earney, M., Phillips, B.L., Tracy, C.R., Christian, K.A., Betts, G., Porter, W.P., 2008.Predicting a species’ future distribution without using its present distribution:climate change and the invasive cane toad. Ecography, doi:10.1111/j.2008.0906-7590-05457.x.
earney, M., Porter, W.P., Williams, C., Ritchie, S., Hoffman, A.A., 2009. Integrat-ing biophysical models and evolutionary theory to predict climatic impacts onspecies’ ranges: the dengue mosquito Aedes aegypti in Australia. Funct. Ecol.,doi:10.1111/j.1365-2435.2008.01538.x.
aan, R., Verboom, B., 1990. Effects of pool size and isolation on amphibian commu-nities. Biol. Conserv. 54, 251–262.
annoo, M., 2005. Amphibian Declines: The Conservation and Status of United StatesSpecies. University of California Press, Berkley, CA, USA, 1094 pp.
illywhite, H.B., Licht, P., Chelgren, P., 1973. The role of behavioral thermoregulationin the growth energetics of the toad Anaxyrus boreas. Ecology 54, 375–383.
cCullough, E.M., Porter, W.P., 1971. Computing clear day solar spectra for theterrestrial ecological environment. Ecology 52, 1008–1015.
itchell, N.J., Kearney, M.R., Kearney, Nelson, N.J., Porter, W.P., 2008. Predictingthe fate of a living fossil: how will global warming affect embryonic devel-opment, sex determination and hatching phenology in tuatara? Proc R Soc B,doi:10.1098/rspb.2008.0438.
uths, E., 2003. Home range and movements of boreal toads in undisturbed habitat.Copeia 2003, 161–165.
uths, E., Nanjappa, P., 2005. Species accounts: Anaxyrus boreas. In: Lannoo, M.(Ed.), Amphibian Declines: The Conservation Status of United States Species.University of California Press, Berkeley, CA, USA, pp. 392–396.
uths, E., Gallant, A.L. Grant, E.H.C., Battaglin, W.A., Green, D.E., Staiger, J.S.,Walls, S.C., Gunzburger, M.S., Kearney, R.F., 2006. The Amphibian Research andMonitoring Initiative (ARMI): 5-Year Report. U.S. Geological Survey ScientificInvestigations Report 2006-5224, 77 pp.
atori, Y., Porter, W.P., 2007. Model of Japanese Serow (Capricornis crispus) energet-ics predicts distribution on Honshu. Jpn. Ecol. Appl. 17, 1441–1459.
oss, R.F., O’Connell, M.A., Muprhy, D.D., 1997. The Science of Conservation Planning.Island Press, Washington, D.C, 246 pp.
illiod, D.S., Peterson, C.R., Ritson, P.I., 2002. Seasonal migration of Columbia spottedfrogs (Rana luteiventris) among complementary resources in a high mountainbasin. Can. J. Zool. 80, 1849–1862.
illiod, D.S., Muths, E., Scherer, R.D., Bartelt, P.E., Corn, P.S., Hossack, B.R., Lam-bert, B.A., McCaffery, R., Gaughan, C., 2010. Effects of amphibian chytridfungus on individual survival probability in wild boreal toads. Conserv. Biol.,doi:10.1111/j.1523-1739.2010.01506.x.
orter, W.P., 1989. New animal models and experiments for calculating growth
potential at different elevations. Physiol. Zool. 62, 286–313.orter, W.P., Gates, D.M., 1969. Thermodynamic equilibria of animals with environ-ment. Ecol. Monogr. 39, 227–244.
orter, W.P., Munger, J.C., Stewart, W.E., Budaraju, S., Jaeger, J., 1994. Endothermenergetics: from a scalable individual-based model to ecological applications.Aust. J. Zool. 42, 125–162.
lling 221 (2010) 2675–2686
Porter, W.P., Mitchell, J.W., 2006. Method and system for calculating thespatial–temporal effects of climate and other environmental conditions onanimals. In: Office, U.P. (Ed.), Wisconsin Alumni Research Foundation, Bhttp://www.patentstorm.us/patents/7155377-fulltext.html.
Porter, W.P., Vakharia, N.P., Klousie, W.D., Duffy, D., 2006. Po’ouli landscape bioin-formatics models predict energetics, behavior, diets and distribution on Maui.Int. Comp. Biol. 46, 1143–1158.
Porter, W.P., Mitchell, J.W., Beckman, W.A., DeWitt, C.B., 1973. Behavioral impli-cations of mechanistic ecology: thermal and behavioral modeling of desertectotherms and their microenvironment. Oecologia 13, 1–54.
Ray, N., Lehmann, A., Joy, P., 2002. Modeling spatial distribution of amphibian popu-lations: a GIS approach based on habitat matrix permeability. Biodivers. Conserv.11, 2143–2165.
Rohr, J.R., Raffel, T.R., Romansic, J.M., McCallum, H., Hudson, P.J., 2008. Evaluatingthe links between climate, disease spread, and amphibian declines. Proc. Natl.Acad. Sci. U.S.A. 105, 17436–17441.
Semlitsch, R.D., Bodie, J.R., 2003. Biological criteria for buffer zones around wetlandsand riparian habitats for amphibians and reptiles. Conserv. Biol. 17, 1219–1228.
Shepard, D.B., Burbrin, F.T., 2009. Phylogenetic and demographic effects of Pleis-tocene climate fluctuations in a montane salamander, Plethodon fourchensis. Mol.Ecol. 18, 2243–2262.
Stuart, S.N., Chanson, J.S., Cox, N.A., Young, B.E., Rodrigues, A.S.L., Fischman, D.L.,Waller, R.W., 2004. Status and trends of amphibian declines and extinctionsworldwide. Science 306, 1783–1786.
Sullivan, S.R., Bartelt, P.E., Peterson, C.R., 2008. Midsummer ground surface activitypatterns of Western toads (Anaxyrus boreas) in southeast Idaho. Herpetol. Rev.39, 35–40.
Thornton, P.E., Running, S.W., White, M.A., 1997. Generating surfaces of daily mete-orology variables over large regions of complex terrain. J. Hydrol. 190, 214–251.
Tracy, C.R., 1976. A model of the dynamic changes of water and energybetween a terrestrial amphibian and its environment. Ecol. Monogr. 46,293–326.
Tracy, C.R., Christian, K.A., O’Connor, M.P., Tracy, C.R., 1993. Behavioral thermoreg-ulation by Anaxyrus americanus: The importance of the hydric environment.Herpetology 49 (3), 375–382.
Voyles, J., Young, S., Berger, L., Campbell, C., Voyles, W.F., Dinudom, A., Cook,D., Webb, R., Alford, R.A., Skerratt, L.F., Speare, R., 2009. Pathogenesis ofchytridiomycosis, a cause of catastrophic amphibian declines. Science 326,582–585.
Wake, D.B., Vrendenburg, V.T., 2008. Are we in the midst of the sixth mass extinc-tion? A view from the world of amphibians. Proc. Natl. Acad. Sci. U.S.A. 105
imal rates of oxygen consumption in two anuran amphibians. J. Comp. Physiol.B: Biochem. Syst. Environ. Physiol. 152 (1), 125–129.
Woodhams, D.C., Alford, R.A., Marantelli, G., 2003. Emerging disease of amphibianscured by elevated body temperature. Dis. Aquat. Org. 55, 65–67.