model-based optimisation of deferoxamine chelation therapy · model-based optimisation of...
TRANSCRIPT

RESEARCH PAPER
Model-Based Optimisation of Deferoxamine Chelation Therapy
Francesco Bellanti1 & Giovanni C. Del Vecchio4& Maria C. Putti5 & Carlo Cosmi6 & Ilaria Fotzi6 & Suruchi D. Bakshi1 & Meindert Danhof1 &
Oscar Della Pasqua1,2,3
Received: 6 July 2015 /Accepted: 2 October 2015 /Published online: 10 November 2015# The Author(s) 2015. This article is published with open access at SpringerLink.com
ABSTRACTPurpose Here we show how amodel-based approach may beused to provide further insight into the role of clinical anddemographic covariates on the progression of iron overload.The therapeutic effect of deferoxamine is used to illustrate theapplication of disease modelling as a means to characterisingtreatment response in individual patients.Methods Serum ferritin, demographic characteristics and in-dividual treatment data from clinical routine practice on 27patients affected by β-thalassaemia major were used for thepurposes of this analysis. The time course of serum ferritin wasdescribed by a hierarchical nonlinear mixed effects model, inwhich compliance was parameterised as a covariate factor.Modelling and simulation procedures were implemented inNONMEM (7.2.0).Results A turnover model best described serum ferritinchanges over time, with the effect of blood transfusions
introduced on the ferritin conversion rate and the effect ofdeferoxamine on the elimination parameter (Kout) in a pro-portional manner. The results of the simulations showedthat poor quality of execution is preferable over drugholidays; and that independently of the compliance pat-tern, the therapeutic intervention is not effective if>60% of the doses are missed.Conclusions Modelling of ferritin response enables character-isation of the dynamics of iron overload due to chronic trans-fusion. The approach can be used to support decision makingin clinical practice, including personalisation of the dose forexisting and novel chelating agents.
KEY WORDS adherence . deferoxamine . diseasemodelling . dose rationale . iron overload . PKPDmodelling
ABBREVIATIONSALT Alanine aminotransferaseAST Aspartate aminotransferaseCMPL Treatment complianceCss Steady state concentrationDFO DeferoxamineFT4 Free T4IIV Inter-individual variabilityIOV Inter-occasion variabilityM&S Modelling and simulationsNPDE Normalised predictive distribution errorNTBI Non-transferrin bound ironOFV Objective function valuePKPD Pharmacokinetic-pharmacodynamicPRED Population predictionRBC Red blood cellsTSH Thyroid-stimulating hormoneVPC Visual predictive check
Electronic supplementary material The online version of this article(doi:10.1007/s11095-015-1805-0) contains supplementary material, which isavailable to authorised users.
* Oscar Della [email protected]
1 Division of Pharmacology, Leiden Academic Centre for Drug ResearchLeiden, The Netherlands
2 Clinical Pharmacology & Therapeutics, University College London BMAHouse, Tavistock Square, WC1H 9JP London, UK
3 Clinical Pharmacology Modelling & Simulation, GlaxoSmithKline StockleyPark, Uxbridge, UK
4 Azienda Ospedaliera Universitaria Consorziale, Policlinico di BariBari, Italy
5 Azienda Ospedaliera di Padova, Clinica di Oncoematologia PediatricaPadova, Italy
6 Azienda Ospedaliera Universitaria, Policlinico di Sassari, Sassari, Italy
Pharm Res (2016) 33:498–509DOI 10.1007/s11095-015-1805-0

INTRODUCTION
Transfusional Iron Overload
Beta-thalassaemia major is a hereditary blood disorder andpatients affected by this disease require regular red blood cell(RBC) transfusions to survive (1–7).Without the chronic trans-fusion regimen, patients would die before the third decade oflife (2,4,5,7,8). Even though a significant improvement hasbeen achieved in the management of the chronic transfusionregimen in the past decades, the therapy will eventually lead toa series of complications. Iron overload is the most commonand relevant one and it is associated with several co-morbidities such as cardiac dysfunction, liver fibrosis,hypogonadism, hypothyroidism, hypoparathyroidism and di-abetes mellitus (6,9,10). Cardiac disease caused by myocardialsiderosis is the most relevant complication, causing deathin 71% of the patients affected by transfusion-dependentdiseases (11).
For a complex process such as iron overload, understand-ing of the dynamics of the disease and its progression is crucialto adequately evaluate the impact of a therapeutic interven-tion. This complexity is characterised also by the fact that thebiomarker ferritin does not provide a direct link between totalbody or tissue iron accumulation at specific time points. Theabsence of such a relationship is partly explained by the influ-ence of other pathological mechanisms (e.g., inflammatorydisorders, and/or liver status) which can affect the iron inter-change between organs and the circulatory system (2,12–14).On the other hand, changes in ferritin levels are still helpful forthe management of the disease and maintaining serum ferritinbelow a threshold of about 2500 μg/L is a widely acceptedtherapeutic goal (2,3,5–7). Nonetheless, several clinical ques-tions are not yet fully explored, e.g., howmuch time is requiredin order to observe a true response, or in order to reach clin-ically safe serum ferritin levels.
Iron Chelation Therapy with Deferoxamine
Given that the ability of our body to remove the excess of ironis limited to a maximum of 1–2 mg/day (e.g., loss of intestinalcells), treatment with iron chelators is vital to prevent its accu-mulation and related complications (15–18). In this analysiswe are mainly interested in the iron chelating agent deferox-amine. Deferoxamine was the first iron chelator approved forhuman use and has been available for the treatment of ironoverload for more than 35 years (2,6,15–19). It is anexadentate chelator that binds iron in a 1:1 ratio. The drugis rapidly absorbed after intramuscular and subcutaneous ad-ministration, but it cannot be absorbed orally. Several dosingregimens and routes of administration have been proposedand used in the past for deferoxamine in patients affected bytransfusion-dependent haemoglobinopathies but in the
majority of cases it is given as an 8 to 12 h nightly subcutane-ous infusion (5 to 7 days a week) (2,19–21). The serum proteinbinding is less than 10% and the drug undergoes the followingmetabolic reactions: transamination and oxidation; beta-oxidation; decarboxylation and N-hydroxylation. The aver-age recommended daily dose lies between 20 and 60 mg/kgand in patients with haemochromatosis the drug has an half-life of 5.6 h (20–22).
Deferoxamine binds free iron by preventing the uptake ofNTBI (Non-Transferrin Bound Iron) into organs but it alsoacts within the cell where it enters by endocytosis, stimulatesthe degradation of ferritin via the lysosomes and subsequentlybinds the realeased iron. The iron bound to deferoxamine isthen excreted in urine and feces (2,6,21,23).
Despite the availability of new oral iron chelators and severallimitations regarding the use of deferoxamine, such as compli-ance issues due to the parenteral administration, inadequatecardiac iron removal and auditory, ocular and neurologicaltoxicities (6,16,18,19,24), deferoxamine is still the most com-mon used therapy for the treatment of iron overload.
The current investigation focuses on the use of a model-based approach to gain insight into key factors that play a rolein iron overload, with the objective of quantifying the thera-peutic effect of deferoxamine and characterising the role ofrelevant covariates on the underlying disease progression. Fur-thermore, we show how modelling and simulation (M&S) canbe applied to support decision making in clinical practice pro-viding a framework to predict changes in the disease status andthe evaluate the impact of predefined therapeutic regimens.
METHODS
Data
The data analysis was performed using retrospective clinicaldata from three different Italian centres: A.O. UniversitariaConsorziale Policlinico di Bari U.O. Pediatria FedericoVecchio; A.O. Universitaria Policlinico di Sassari ClinicaPediatrica, ASL 1 D.H. Per Talassemia; A.O. di PadovaClinica di Oncoematologia Pediatrica. The study has beenconducted in full conformance with the principles of the Dec-laration of Helsinki and with the local laws and regulationsconcerning clinical trials. The protocol and the informed con-sent documents have been formally approved by the relevantresearch ethics committee of each clinical site.
Clinical data were collected retrospectively for a maximum of10 years from 27 patients affected by transfusion-dependent dis-eases, receiving deferoxamine asmonotherapy for iron chelation.Patients were followed according to standard clinical practice,which includes case specific dose adjustments. Modifications tothe dosing regimen were recorded and transcribed into the anal-ysis dataset; the most prevalent dose was 40 mg/kg. Baseline
Optimisation of DFX chelation therapy 499

characteristics of the patient population are provided in Table I.Serum ferritin was the main endpoint of interest and was mea-sured every 2 to 3 months; patients contributed with 40.2 obser-vations on average (sd: 17), with a minimum of 4 samples peryear.
PK Model of Deferoxamine
A two compartment pharmacokinetic model with zero-orderabsorption (8 h subcutaneous infusion) and first-order elimina-tion processes was used to describe the time course of deferox-amine in plasma and subsequently derive the average steadystate concentration (CssAV) for the population of interest. De-feroxamine plasma levels were based on the dosing regimeninformation collected from the patients' medical history at theclinical centres. The model was built using literature data (25)by fitting a mean pharmacokinetic profile in adult patientsaffected by transfusion-dependent haemoglobinopathies re-ceiving a 40 mg/kg dose of deferoxamine as an 8 h subcuta-neous infusion. The final PK parameters obtained as input forthe data analysis included apparent clearance (19.3 L/h),intercompartmental clearance (17.6 L/h), apparent volumeof distribution (77.4 L) and apparent peripheral volume ofdistribution (238.0 L). Subsequently fixed allometric scaling(exponent of 0.75 on apparent clearances and 1.00 on theapparent volumes of distribution) was used to extrapolateCssAV in adolescents and children. Population prediction(PRED) were used to generate CssAV values in the populationof interest. The fitting of the model is shown in Fig. 1.
Disease Model of Iron Overload
A disease model of iron overload in patients affected bytransfusion-dependent diseases was used to account for theeffect of blood transfusions on serum ferritin levels. It consisted
of an indirect response model where the basal turnover offerritin is depicted by a zero-order production rate (Kin) anda first-order degradation rate (Kout) and the parameter de-scribing the disease component is represented by an additiveproduction rate (CRT) triggered by the transfusion regimen,which was found to be non-linearly correlated to the diseasestatus (actual ferritin levels).
dFERRITIN
dt¼ Kin þ CRT−Kout � FERRITIN ð1Þ
CRT ¼ SCL � e−SHP�FERRITIN ð2Þwhere SCL is a scaling factor and SHP is the shape factor ofthe correlation between the disease status and the productionrate (CRT). The population parameters of the disease modelwere kept fixed when performing the retrospective PKPDanalysis of the clinical data.
PKPD Modelling of Deferoxamine
The software R (v.2.14.0) (26) was used for statistical summariesas well as data manipulation and preparation for modelling pur-poses. Nonlinear mixed effects modelling was performed inNONMEM version 7.2 (Icon Development Solutions, USA).
Model building criteria included: (i) successful minimisation,(ii) standard error of estimates, (iii) number of significant digits,(iv) termination of the covariance step, (v) correlation betweenmodel parameters and (vi) acceptable gradients at the last itera-tion. Comparison of nested hierarchical models was based on thelikelihood ratio test (LRT). Goodness of fit was assessed by graph-ical methods, including population and individual predicted vs.
observed concentrations, conditional weighted residuals vs.
Table I Baseline Characteristics of the Patient Population (n=27) Includedin the Analysis
Units Median Range
Age Years 14.6 6.8–19.9
Weight kg 46 17.5–71
Height cm 154 111–173
TSH mIU/L 2.34 0.58–83.2
FT4 ng/dL 1.05 0.73–1.43
AST U/L 33 7–159
ALT U/L 56 9–372
Glucose mg/dL 91 52–444
Creatinine mg/dL 0.6 0.2–1.12
Ejection fraction % 64 35–77
Ferritin μg/L 2260 393–8500
Fig. 1 Predicted and observed pharmacokinetic profile of deferoxamine.The circles represent the mean deferoxamine concentrations reported inliterature (25). The solid line represents the population model prediction.
500 Bellanti et al.

observed concentrations and time, correlation matrix for fixed vs.random effects, correlation matrix between parameters and co-variates and normalised predictive distribution error (NPDE) (27).
Fixed and random effects were introduced into the modelin a stepwise manner. Inter-individual variability and interoccasion variability (IOV) in the model parameters was as-sumed to be log-normally distributed. A parameter value ofan individual i (post hoc value) is therefore given by the fol-lowing equation:
θi ¼ θTV*e ηiþIOVið Þ
in which θTV is the typical value of the parameter in thepopulation and ηi and IOVi are assumed to be random vari-ables with zero mean and variance ω2. Residual variability,which comprises measurement and model error, was de-scribed by a proportional error model. This means that forthe jth observed concentration of the ith individual, the follow-ing relation applies:
Yi j ¼ Fi j þ εi j*W
where Fij is the predicted concentration, εij is a random vari-able with mean zero and variance σ2, andW is a proportionalweighing factor for ε.
Different concentration-effect relationships (e.g., Emaxmodel, linear model, etc.) were tested on the disease modelpresented in Eq. 1 to characterise the effect of deferoxamineon serum ferritin levels. Deferoxamine average steady-stateconcentrations (CssAV) generated with the PK model de-scribed above were used as a measure of drug exposure.The effect of deferoxamine (DFO) was introduced in a pro-portional way on the degradation rate (Kout) of ferritin asshown in Eq. 3 which is derived from Eq. 1.
dFERRITIN
dt¼ Kin þ CRT−Kout � FERRITIN
� 1þ DFOð Þ ð3ÞDFO ¼ SLP � SCssAV ð4ÞwhereDFO is the effect of deferoxamine on the degradation rate(Kout) of the disease model, SLP is the slope parameter of theconcentration-effect relationship, and SCssAV are the steady stateconcentrations simulated with the deferoxamine PK model.
In addition, two disease model parameters, namely, thescaling (SCL) and the shape (SHP) factors presented in Eq. 2were found to be non-linearly correlated with the actual dis-ease status according to the following relationships:
SCLi ¼ SCLre f � FERRITIN
FERRITIN med
� �θx
ð5Þ
SHPi ¼ SHPre f � FERRITIN
FERRITIN med
� �θx
ð6Þ
where SCLref and SHPref are the reference parameters in thepopulation of interest, SCLi and SHPi are the individual param-eters, FERRITINmed is the median ferritin value in the popula-tion of interest and θx is the estimated exponent of therelationship.
The validation of the final model was based on graphical andstatistical methods, including visual predictive checks (28). Boot-strap (1000 samples) was used to identify bias, stability and accu-racy of the parameter estimates (standard errors and confidenceintervals). The bootstrap procedures were performed in PsNv3.5.3 (University of Uppsala, Sweden) (29), which automaticallygenerates a series of new data sets by sampling individuals withreplacement from the original data pool, fitting the model toeach new data set.
Evaluation of the Role of Compliance
At an early stage of the model building phase modelmisspecification was observed, as the model could not appropri-ately describe the data (See supplemental material, Figure 1S)based on the assumption that the population under investigationas one single population. In fact, two different ferritin profileswere identified and patients were initially considered as re-sponders and non-responders. The responders showed very sta-ble profiles around 2500 μg/L serum ferritin, whereas the non-responders showed very steep increases in ferritin levels and ap-peared not to be able to return to a less severe state of the disease.A mixture model improved the quality of the fitting but wouldstill not allow an adequate characterisation of the individual pro-files. Demographic factors were compared among the two sub-populations and no significant differences were identified thatcould justify the difference in response to treatment.
We have therefore decided to investigate the possible mecha-nisms responsible for the different response profiles using theinformation available in the literature. Treatment compliancewas found to be the major cause of these differences. In thepapers byGabutti et al. (30) andGalanello et al. (31) serum ferritinprofiles are quite stable over the observational period (See Fig. 1and supplemental material Figure 2S) as in our responder groupand compliance is in both cases higher than 95%. In other in-vestigations (20,30,32) Kaplan-Meier analyses show the relation-ship between survival and treatment compliance, providingevidence of the fact that poor adherence has a major impacton response. In particular the work by Olivieri et al. (32) showshow survival can directly be linked to the observed ferritin levels.
The absence of quantitative data on treatment compliance inour retrospective study did not allow us to directly use this vari-able to account for such differences and was a clear obstacle forthe analysis. To overcome this limitation we used the workcarried out by Olivieri et al. (32) as a reference and derived anew variable (CMPL) based on the percentage of observationsfor each patient above the threshold of 2500 μg/L ferritin.CMPL had a median value of 21% (range of 0–100) and mean
Optimisation of DFX chelation therapy 501
of 32% (95% CI: 0.9–98%) in the population under investiga-tion. The new variable (CMPL)was introduced into themodel asfollows:
DFO ¼ SLP � TCAVss ð7Þ
TCAVss ¼ SCAV
ss � 1−CMPLð Þ ð8Þ
where DFO is the effect of deferoxamine, SLP is the slope pa-rameter of the concentration-effect relationship, and TCssAV isthe “true” steady state concentration after accounting for theimpact of treatment compliance (CMPL). TCssAV values arederived from the simulated steady state concentrations (SCssAV)corrected for treatment compliance as shown in Eq. 7.
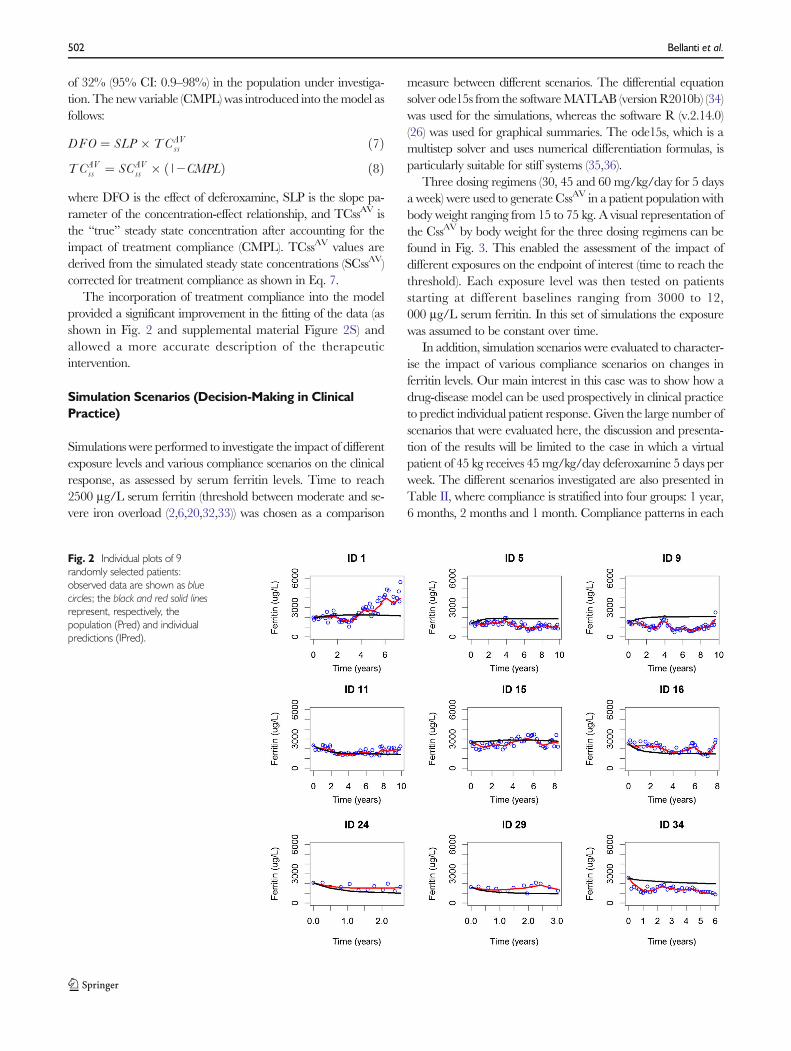
The incorporation of treatment compliance into the modelprovided a significant improvement in the fitting of the data (asshown in Fig. 2 and supplemental material Figure 2S) andallowed a more accurate description of the therapeuticintervention.
Simulation Scenarios (Decision-Making in ClinicalPractice)
Simulations were performed to investigate the impact of differentexposure levels and various compliance scenarios on the clinicalresponse, as assessed by serum ferritin levels. Time to reach2500 μg/L serum ferritin (threshold between moderate and se-vere iron overload (2,6,20,32,33)) was chosen as a comparison
measure between different scenarios. The differential equationsolver ode15s from the softwareMATLAB (versionR2010b) (34)was used for the simulations, whereas the software R (v.2.14.0)(26) was used for graphical summaries. The ode15s, which is amultistep solver and uses numerical differentiation formulas, isparticularly suitable for stiff systems (35,36).
Three dosing regimens (30, 45 and 60 mg/kg/day for 5 daysa week) were used to generate CssAV in a patient population withbody weight ranging from 15 to 75 kg. A visual representation ofthe CssAV by body weight for the three dosing regimens can befound in Fig. 3. This enabled the assessment of the impact ofdifferent exposures on the endpoint of interest (time to reach thethreshold). Each exposure level was then tested on patientsstarting at different baselines ranging from 3000 to 12,000 μg/L serum ferritin. In this set of simulations the exposurewas assumed to be constant over time.
In addition, simulation scenarios were evaluated to character-ise the impact of various compliance scenarios on changes inferritin levels. Our main interest in this case was to show how adrug-disease model can be used prospectively in clinical practiceto predict individual patient response. Given the large number ofscenarios that were evaluated here, the discussion and presenta-tion of the results will be limited to the case in which a virtualpatient of 45 kg receives 45mg/kg/day deferoxamine 5 days perweek. The different scenarios investigated are also presented inTable II, where compliance is stratified into four groups: 1 year,6 months, 2 months and 1 month. Compliance patterns in each
Fig. 2 Individual plots of 9randomly selected patients:observed data are shown as bluecircles; the black and red solid linesrepresent, respectively, thepopulation (Pred) and individualpredictions (IPred).
502 Bellanti et al.

group were further clustered into two categories, namely 1) poorquality of execution, i.e., missed single doses at random, and 2)drug holidays, i.e., doses that are missed consecutively during agiven period of time. For example, in the poor quality of execu-tion scenario, missing 40% of the doses at random means that100 single doses were missed randomly over a period of 1 year;whereas in the drug holidays scenario, missing 40% of the dosesmeans missing 100 consecutive doses over a period of 1 year (i.e.,
the first 100 doses are missed and the remaining 150 are taken).The iterations were stopped if more than 5 years were needed toreach the threshold of 2500 μg/L serum ferritin. Five years wereconsidered as a clinically relevant time limit for the purposes ofthe analysis. Patients reaching the predefined ferritin threshold inmore than 5 years do not influence the results of the analysis orthe comparison of the treatment response for the different dosingregimens and compliance patterns.
Fig. 3 Average steady stateconcentration by body weight for 7typical individuals receiving threedifferent deferoxamine doses: 30(- - -), 45 (....) and 60 (-.-.-) mg/kg/day.
Table II Simulation Scenarios for the Evaluation of Different Compliance Levels. Full Adherence is Equivalent to 250 Doses Per Year
% of missed doses Number of missed doses during the stratification period
Missed single doses at random Missed consecutive doses (i.e., drug holidays)
Stratification
1 year 1 year 6 months 2 months 1 month
Scenario 1 10% 25 25 / 5 /
Scenario 2 20% 50 50 25 10 5
Scenario 3 30% 75 75 / 15 /
Scenario 4 40% 100 100 50 20 10
Scenario 5 50% 125 125 / 25 /
Scenario 6 60% 150 150 75 30 15
Scenario 7 70% 175 175 / 35 /
Scenario 8 80% 200 200 100 40 20
Scenario 9 90% 225 225 / 45 /
Optimisation of DFX chelation therapy 503

RESULTS
Disease Model
As described in the methods a disease model was previouslydeveloped for iron overload [unpublished results] and its perfor-mance in describing the impact of blood transfusions on serumferritin was confirmed in this analysis. The effect of blood trans-fusions was introduced as a conversion rate on the productionrate of ferritin, which was found to be inversely correlated withthe disease status, as shown in Eqs. 1 and 2. In addition, twodisease model parameters, namely, the scaling (SCL) and theshape (SHP) factors presented in Eq. 2 were found to be non-linearly correlated with the actual disease status. Their inclusionin the model provided a significant decrease in the objectivefunction value (OFV) and allowed a better description of thedata. Further improvement was obtained after the inclusion ofinter-occasion variability (IOV=57.4%) on the conversion rate,which resulted in a significant drop in the OFV (Δ 443) allowinga better description of the individual profiles.
Drug Model
The effect of deferoxamine (DFO) was introduced in a propor-tional way on the degradation rate (Kout) of ferritin. A linearmodel was preferred to a non-linear model (i.e., Emax) given thefact that it accurately described the changes in ferritin observedclinically. The limited range of doses and number of patients didnot provide sufficient information to support the characterisationof a non-linearmodel. Furthermore, the implementation of treat-ment compliance as a factor on the exposure of deferoxamineimproved considerably the quality of the fitting and the modelperformance. The inclusion of inter-individual variability (IIV)on the slope parameter also reduced significantly the OFV andimproved goodness of fit and visual predictive check (VPC) di-agnostics. An overview of the final model parameters and boot-strap results is presented in Table III.
Internal model validation diagnostics were satisfactory. In-dividual predicted profiles and goodness-of-fit plots, as shownin Fig. 2 and supplemental material figures 2S along withVPC results (Fig. 4) reveal that the model provides an ade-quate and unbiased description of the data. In addition,NPDE summaries (figure 3S) show that the discrepancy be-tween predicted and observed values can be assumed to benormally distributed.
Simulation Scenarios (Decision-Making in ClinicalPractice)
The impact of different exposure levels and varying compli-ance levels on the clinical response, as assessed by serum fer-ritin levels was evaluated through model simulations. A sum-mary of the results stratified by body weight and ferritin levels
at the start of treatment is presented in Fig. 5 for the followingdosing regimens: 30, 45 and 60 mg/kg/day for 5 days a week.Results clearly show that an appropriate clinical response can-not be achieved without adequate exposure to the chelatingagent. The model also provides the opportunity to evaluate apriori the most suitable dosing regimen to achieve a desiredtherapeutic goal.
Finally, we have investigated the impact of different com-pliance patterns on the time to reach the threshold of2500 μg/L serum ferritin. Whereas simulations refer to onevirtual patient of 45 kg receiving 45mg/kg/day deferoxamine5 days per week, several conclusions can be derived from theseresults: 1) a better and faster response is achieved if single dosesare missed at random (reflecting poor quality of execution)(Fig. 6—scenario 1) as compared to doses missed consecutive-ly (drug holidays) (Fig. 6—scenario 2) over a period of 1 year;2) if doses aremissed consecutively over a given period of time,the shorter the period the better the clinical response (asshown in Fig. 6—scenarios 2 to 5); 3) in all the scenarios, ifmore than 60% of the doses are missed (treatment complianceis lower than 40%) the therapeutic intervention is not effective;and finally 4) a reduction in treatment compliance, especiallywhen moving from 30 to 60% of missed doses clearly leads toa significantly slower response. These findings indicate thateven if the desired therapeutic outcome can be achieved thetime to reach the proposed threshold might not be sustainablefor the patient.
DISCUSSION
A model-based approach is proposed here as a tool for theevaluation of the impact of disease-, patient- and drug specificfactors on iron chelation therapy in patients affected bytransfusion-dependent haemoglobinopathies. The complexity
Table III Parameter Estimates of the PKPD Model of Deferoxamine
Parameter Estimate Bootstrap (mean) CV (%)
Kin (μg/h) 0.0002 (FIX) / /
Kout (h−1) 0.0000045 (FIX) / /
SHP (h−1) 0.00026 (FIX) / /
SCL (μg/h) 0.383 (FIX) / /
Slope (μg/conc) 4.81 5.16 15.7
Error proportional −0.173 −0.17 6.5
DIS exp on SHP 1.29 1.08 57.4
DIS exp on SCL 0.845 0.67 51.9
IIV on Slope 0.082 0.105 80.9
IOV on CRT 0.252 0.29 43.1
CRT production rate due to transfusion regimen, SHP shape factor, SCL scalingfactor, DIS disease status, IIV interindividual variability, IOV inter-occasion vari-ability, CV coefficient of variation, Bootstrap 1000 samples
504 Bellanti et al.

of iron homeostasis and more specifically the ferritin responseto chelation therapy requires an integrated approach that al-lows exploring the dynamics of iron overload and its progres-sion. A drug-disease model was successfully developed andvalidated as shown in Table III and supplemental figures 2Sand 3S. The analysis reveals a strong effect of the disease statuson the overall iron/ferritin conversion rate, and highlights therole of treatment (drug exposure and compliance patterns) onthe overall response and disease progression.
Simulation scenarios were used to investigate the impact ofdifferent exposure levels as well as the effect of varying pat-terns of compliance on serum ferritin levels. Results show thatinadequate iron chelation therapy with sub-therapeutic expo-sure (Fig. 5) as well as poor adherence to the assigned dosingregimen (Fig. 6) significantly increase the time required toachieve a desired clinical response, and in some cases (e.g., withtreatment compliance lower than 40%) the therapeutic goalcannot be achieved at all. Even though these results mightseem rather obvious, we are aware that clinically relevantchanges in serum ferritin levels take place over a somewhatlong period of time, and often crucial decisions have to bemade before the clinical evidence is available. Our approachoffers an opportunity to explore different scenarios beforemedical decisions have to be made. For example, the use ofsimulation scenarios may provide insight into whether lower-ing the dose (i.e., a trade-off for a possible reduction in acuteside effects) and an increased time to achieve the therapeuticgoal would be sustainable for the patient. In the same way,
given the importance of treatment compliance for a drugsuch as deferoxamine, the evaluation of simulation sce-narios allows a more quantitative evaluation of the im-pact of different compliance patterns. This informationcan be used to support the decision making and to opti-mise the therapeutic intervention.
Limitations
Some limitations must be considered in the context ofthis analysis. First of all, we developed a PK model basedon literature data, which allowed us to use fixed allome-tric scaling, including mean population data and individ-ual information. A more structured analysis of the PK ofdeferoxamine would reduce the uncertainty around thesimulated exposure and explain part of the variability inPK that propagates into the pharmacodynamic parame-ter estimates. On the other hand, the proposed approachallowed us to characterise differences in the pharmacoki-netics that could not have been evaluated based only oninformation about the dosing regimen; e.g., changes insize are accounted for by allometric scaling.
A second aspect is the role of treatment compliance.The lack of quantitative data on adherence in the pop-ulation under investigation was a clear impediment forthe analysis. To overcome this issue we used the ob-served data to generate a variable that captures differ-ences in compliance. This decision was supported by the
Fig. 4 Visual predictive check:observed data are depicted by greycircles; the red and blue solid linerepresent, respectively, the medianand the 5th and 95th percentiles ofthe observed data. The red and blueshaded area represent, respectively,the 95th CI of the median and the95th CI of the 5th and 95thpercentiles of the simulated data.
Optimisation of DFX chelation therapy 505

information available in the literature; we found clearevidence that high compliance leads to stable ferritinleve l s over t ime and that poor adherence todeferoxamine therapy is strongly correlated with poorclinical outcome, as nicely depicted in the work byGabutti et al. (30) (Kaplan-Meier analysis presented inFig. 2). This was confirmed by a few other publications(20,31,32,37) and gave us the confidence that the ap-proach taken here would be robust enough for the
purposes of this analysis. In addition, we should empha-sise that whilst not all levels of compliance have beentested, linear interpolation between scenarios does notaffect the overall conclusions that can be drawn fromthe simulation results. For instance, the impact of 50%compliance can be inferred from data showing responsefor patients with 40 and 60% missed doses (see Fig. 6).Of course, additional simulations would need to be per-formed to obtain accurate figures for this scenario.
Fig. 5 Time to reach a serumferritin threshold of 2500 ug/L forvarying exposure levels in patientswith different body weights (15 to75 kg). The panels show threescenarios where 30, 45 and60 mg/kg dosing regimen wereevaluated. Each line represents adifferent starting baseline ferritinlevel (darker to lighter shows anincrease in the starting baselinelevels). Square, circle, triangle withpoint up, plus, cross, diamond,triangle with point down, square cross,star and diamond plus representstarting baseline ferritin values,respectively of 3000, 4000, 5000,6000, 7000, 8000, 9000, 10,000,11,000 and 12,000 ug/L. Thedashed horizontal lines representindicative thresholds at 6 months, 1,2, 3, 4 and 5 years.
506 Bellanti et al.

Optimisation of DFX chelation therapy 507
CONCLUSION
In conclusion, modelling of ferritin response enables charac-terisation of the dynamics of iron overload in patients receiv-ing chronic blood transfusions. Of note is the possibility topredict the time to achieve clinically safe levels of ferritin inindividual patients. The approach can be used to supportdecision making in clinical practice, including personalisationof the dose for existing and novel chelating agents. Bearing inmind the limitations discussed above and the relative level ofuncertainty, this model can be expanded to other transfusion-dependent haemoglobinopathies.
ACKNOWLEDGMENTS AND DISCLOSURES
This contribution is part of the DEferiprone Evaluation inPaediatrics (DEEP) consortium, supported by the FP7 Frame-work Research Program “HEALTH-2010.4.2-1: Off-patentmedicines for children”. The authors would like to thank Prof.G. Derks and Dr. V. Rottschäfer for their constructive inputfor this work. All authors have completed the Unified Com-peting Interest form at www.icmje.org/coi_disclosure.pdf(available on request from the corresponding author) anddeclare: F.B. had financial support from the DEEPconsortium (sponsored by the European Union); no financialrelationships with any organizations that might have aninterest in the submitted work in the previous 3 years; noother relationships or activities that could appear to haveinfluenced the submitted work.
OpenAccessThis article is distributed under the terms of theCreative Commons Attribution 4.0 International License(http://creativecommons.org/licenses/by/4.0/), which per-mits unrestricted use, distribution, and reproduction in anymedium, provided you give appropriate credit to the originalauthor(s) and the source, provide a link to the Creative Com-mons license, and indicate if changes were made.
REFERENCES
1. Gibbons R, Higgs DR, Old JM, Olivieri NF, Swee Lay T,Wood WG. The thalassaemia syndromes. 4th edn. BlackwellSci; 2001.
2. Galanello R, Origa R. Beta-thalassemia. Orphanet J Rare Dis.2010;5:11.
3. Ginzburg Y, Rivella S. Β-thalassemia: a model for elucidating thedynamic regulation of ineffective erythropoiesis and iron metabo-lism. Blood. 2011;118(16):4321–30.
4. Rebulla P. Blood transfusion in beta thalassaemia major. TransfusMed. 1995;5(4):247–58.
5. Rebulla P, Modell B. Transfusion requirements and effects in pa-tients with thalassaemia major. Lancet. 1991;337:277–80.
6. Rund D, Rachmilewitz E. Beta-thalassemia. N Engl J Med.2005;353:1135–46.
7. TIF. Guidelines for the clinical management of thalassaemia. 2008.8. Porter J, Huehns E. Transfusion and exchange transfusion in sckle
cell anaemias, with particular reference to iron metabolism. ActaHaematol. 1987;78:198–205.
9. Cunningham MJ, Macklin EA, Neufeld EJ, Cohen AR.Complications of beta-thalassemia major in North America.Blood. 2004;104(1):34–9.
10. Borgna-Pignatti C, Rugolotto S, De Stefano P, Zhao H, CappelliniMD, Del Vecchio G, et al. Survival and complications in patientswith thalassemia major treated with transfusion and deferoxamine.Haematologica. 2004;89(10):1187–93.
11. Borgna-Pignatti C, Cappellini MD, De Stefano P, DelVecchio GC, Forni GL, Gamberini MR, et al. Survivaland complications in thalassemia. Ann N Y Acad Sci.2005;1054:40–7.
12. Brittenham GM, Cohen AR, McLaren CE, Martin MB, GriffithPM, Nienhuis AW, et al. Hepatic iron stores and plasma ferritinconcentration in patients with sickle cell anemia and thalassemiamajor. Am J Hematol. 1993;42(1):81–5.
13. Lipschitz D, Cook J, Finch C. A clinical evaluation of serum ferritinas an inndex of iron stores. N Engl J Med. 1974;290(22):1213–6.
14. Puliyel M, Sposto R, Berdoukas VA, Hofstra TC, Nord A, CarsonS, et al. Ferritin trends do not predict changes in total body iron inpatients with transfusional iron overload. Am J Hematol.2014;89(4):391–4.
15. Cappellini MD, Pattoneri P. Oral iron chelators. Annu Rev Med.2009;60:25–38.
16. Kwiatkowski JL. Oral iron chelators. Pediatr Clin N Am.2008;55(2):461–82.
17. Musallam KM, Taher AT. Iron chelation therapy for transfusionaliron overload: a swift evolution. Hemoglobin. 2011;35(5–6):565–73.
18. Shander A, Sweeney J. Overview of current treatment regimens iniron chelation therapy. US Hematol. 2009;2(1):56–9.
19. Fisher S, Brunskill S, Doree C, Gooding S, Chowdhury O, RobertsD. Desferrioxamine mesylate for managing transfusional iron over-load in people with transfusion-dependent thalassaemia (Review).Cochrane Libr. 2013;(8).
20. Brittenham G, Griffith P, Nienhuis A, McLaren C, Young N,Tucker E, et al. Efficacy of deferoxamine in preventing complica-tions of iron overload in patients with thalassemia major. N Engl JMed. 1994;331(9):567–73.
21. Novartis Pharmaceuticals UK. Deferoxamine summary of productcharacteristics. Available from: http://www.medicines.org.uk/emc/medicine/2666.
22. Porter J. Deferoxamine pharmacokinetics. Semin Hematol.2001;38(1 Suppl 1):63–8.
23. Theil EC. Mining ferritin iron: 2 pathways. Blood. 2009;114(20):4325–6.
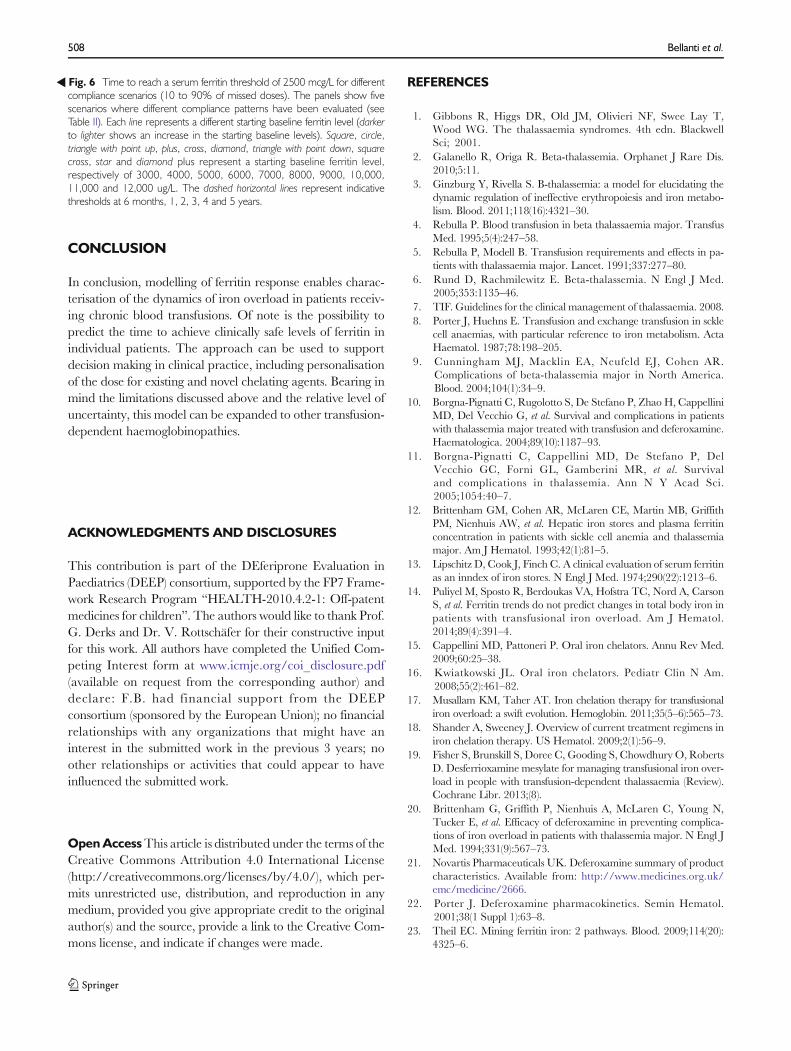
�Fig. 6 Time to reach a serum ferritin threshold of 2500 mcg/L for differentcompliance scenarios (10 to 90% of missed doses). The panels show fivescenarios where different compliance patterns have been evaluated (seeTable II). Each line represents a different starting baseline ferritin level (darkerto lighter shows an increase in the starting baseline levels). Square, circle,triangle with point up, plus, cross, diamond, triangle with point down, squarecross, star and diamond plus represent a starting baseline ferritin level,respectively of 3000, 4000, 5000, 6000, 7000, 8000, 9000, 10,000,11,000 and 12,000 ug/L. The dashed horizontal lines represent indicativethresholds at 6 months, 1, 2, 3, 4 and 5 years.
508 Bellanti et al.

24. Bentur Y, Koren G, Tesoro A, Carley H, Olivieri N, FreedmanMH. Comparison of deferoxamine pharmacokinetics betweenasymptomatic thalassemic children and those exhibiting severe neu-rotoxicity. Clin Pharmacol Ther. 1990;47(4):478–82.
25. Porter JB, Rafique R, Srichairatanakool S, Davis BA, Shah FT,Hair T, et al. Recent insights into interactions of deferoxamine withcellular and plasma iron pools: implications for clinical use. Ann NY Acad Sci. 2005;1054:155–68.
26. R Core Team. R: a language and environment for statistical com-puting. 2014.
27. Comets E, Brendel K,Mentré F. Computing normalised predictiondistribution errors to evaluate nonlinear mixed-effect models: thenpde add-on package for R. Comput Methods Prog Biomed.2008;90(2):154–66.
28. Hooker AC, Staatz CE, Karlsson MO. Conditional weighted re-siduals (CWRES): a model diagnostic for the FOCE method.Pharm Res. 2007;24(12):2187–97.
29. Lindbom L, Ribbing J, Jonsson EN. Perl-speaks-NONMEM(PsN)–a Perl module for NONMEM related programming.Comput Methods Prog Biomed. 2004;75(2):85–94.
30. Gabutti V, Piga A. Results of long-term iron-chelating therapy.Acta Haematol. 1996;95:26–36.
31. Galanello R, Kattamis A, Piga A, Fischer R, Leoni G, Ladis V, et al.A prospective randomized controlled trial on the safety and efficacyof alternating deferoxamine and deferiprone in the treatment ofiron overload in patients with thalassemia. Haematologica.2006;91:1241–3.
32. Olivieri N, Nathan D, MacMillan J, Wayne A, Liu P, McGee A,et al. Survival in medically treated patients with homozygous β-thalassemia. N Engl J Med. 1994;331:574–8.
33. Modell B, Khan M, Darlison M. Survival in β-thalassaemia majorin the UK: data from the UK Thalassaemia Register. Lancet.2000;355(9220):2051–2.
34. MathWorks T. MATLAB and statistics toolbox release 2010b.Massachusetts: Natick; 2010.
35. Shampine L, Reichelt M. The MATLAB ODE suite. SIAM J SciComput. 1997;18:1–22.
36. Shampine L, Reichelt M, Kierzenka J. Solving index-1 DAEs inMATLAB and simulink. SIAM Rev. 1999;41:538–52.
37. Kattamis A, Dinopoulos A, Ladis V, Berdousi H, Kattamis C.Variations of ferritin levels over a period of 15 years as a compli-ance chelation index in thalassemic patients. Am J Hematol.2001;68(4):221–4.
Optimisation of DFX chelation therapy 509