millard creek rearing channel - youthecology.ca
TRANSCRIPT
Millard Creek Rearing Channel Fish Habitat & Channel Productivity Report 2018
REPORT PREPARED BY
Esther Guimond, RPBio, Courtenay, BC
and
Wendy Kotilla, RNSDip., Youth and Ecological Restoration, Courtenay, BC
November 2018
ii
Contents
Contents ........................................................................................................................................................ ii
Figures ........................................................................................................................................................... ii
Tables ........................................................................................................................................................... iii
Photos .......................................................................................................................................................... iii
Acknowledgements ..................................................................................................................................... iiv
Introduction .................................................................................................................................................. 1
Study Location ............................................................................................................................................... 2
Methods ........................................................................................................................................................ 3
Water Quality ............................................................................................................................................ 3
Stream Discharge ...................................................................................................................................... 3
Juvenile Population Estimate .................................................................................................................... 4
Results and Discussion .................................................................................................................................. 5
Water Quality ............................................................................................................................................ 5
Stream Discharge ...................................................................................................................................... 6
Juvenile Rearing ........................................................................................................................................ 8
Habitat Attributes ................................................................................................................................... 11
Juvenile Population Estimate .................................................................................................................. 12
Community outreach .................................................................................................................................. 13
Recommendations ...................................................................................................................................... 14
Summary ..................................................................................................................................................... 14
References .................................................................................................................................................. 15
Appendix 1. Fish captures in the upper Millard Creek rearing channel August 22-24, 2018. .................... 16
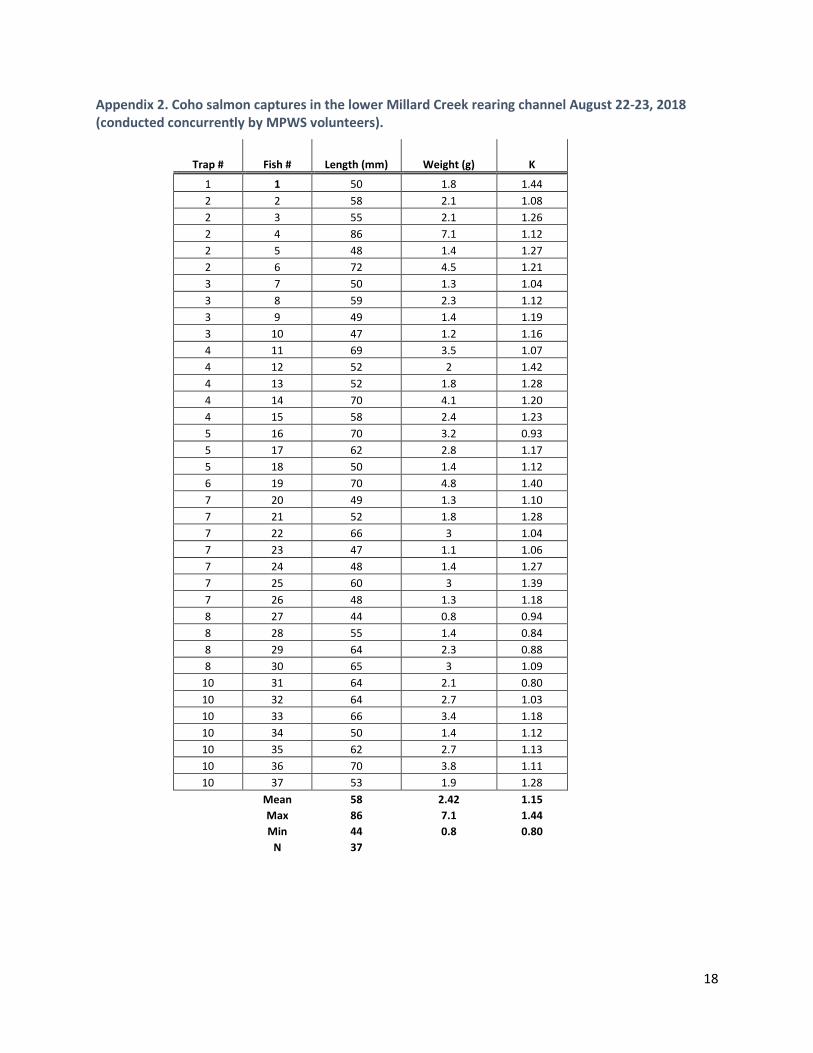
Appendix 2. Coho salmon captures in the lower Millard Creek rearing channel August 22-23, 2018
(conducted concurrently by MPWS volunteers). ........................................................................................ 18
Figures
Figure 1. Location of the juvenile rearing survey and Gee trapping locations in the Millard Creek rearing
channel, 22-24 August 2018. ........................................................................................................................ 2
Figure 2. Length frequency histograms for coho salmon and cutthroat trout captured in the Millard
Creek rearing channel, 23-24 August 2018. ................................................................................................ 10
iii
Tables
Table 1. Water quality measurements in the Millard Creek rearing channel – August 22-24, 2018. Results
from previous surveys for comparison (Moul and Kotilla 2012). ................................................................. 6
Table 2. Stream discharge calculations in the Millard Creek rearing channel, and Millard Creek mainstem,
using a floating object method. .................................................................................................................... 7
Table 3. Comparison of average discharge in the Millard Creek rearing channel in the 4 years of surveys.
Discharge data from 2008-2012 reported in Moul and Kotilla 2012. ........................................................... 8
Table 4. Results from Gee-trap mark-recapture survey in the Millard Creek rearing channel from 22-24
August. .......................................................................................................................................................... 8
Table 5. Comparison of fish sampling statistics in the Millard Creek rearing channel, 2008-2018. ............. 9
Table 6. Summary of habitat measurements at Gee trap locations in the rearing channel, August 23,
2018. ........................................................................................................................................................... 11
Table 7. Catch per unit effort (CPUE) for coho and cutthroat in the Millard Creek rearing channel, 2011-
2018. ........................................................................................................................................................... 12
Table 8. Comparison of population estimates in the Millard Creek rearing channel. ................................ 13
Photos
Photo (cover). Heidi Morfitt shows tour participants a coho salmon smolt.
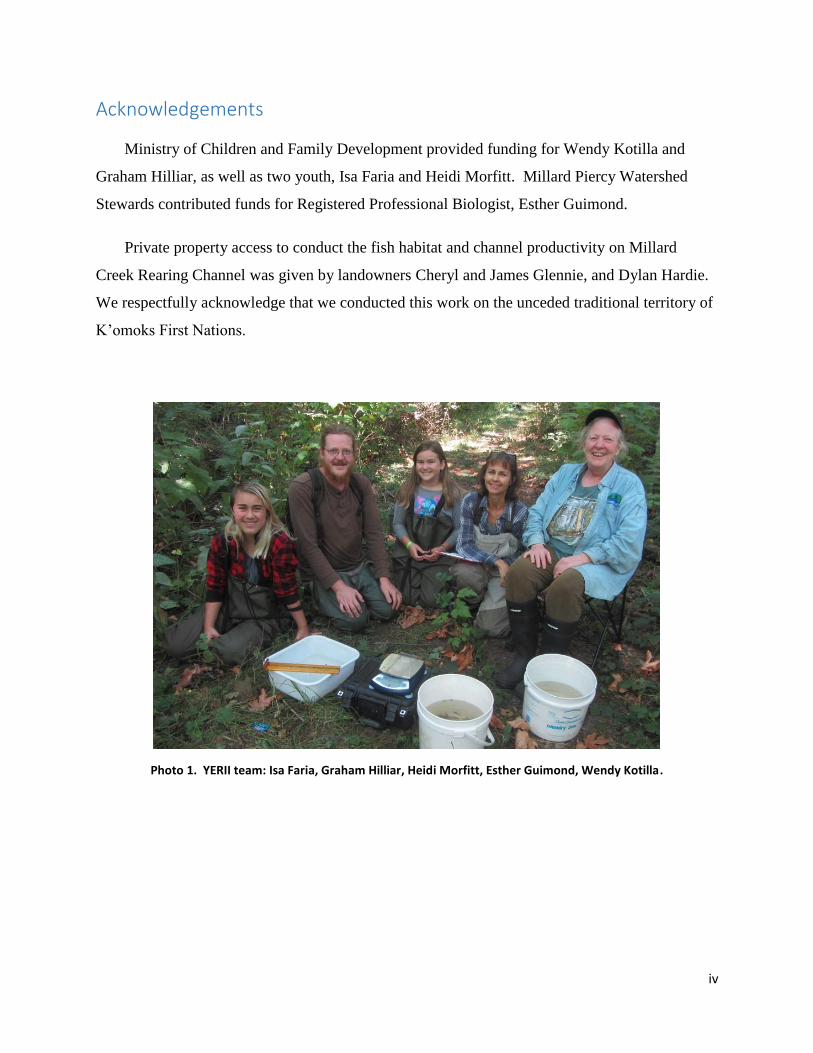
Photo 1. YERII team: Isa Faria, Graham Hilliar, Heidi Morfitt, Esther Guimond, Wendy Kotilla. ................ iv
Photo 2. Conducting stream discharge and water quality measurements. ................................................. 3
Photo 3. Setting up stop nets for the marked recapture study. ................................................................... 5
Photo 4. Sampling juvenile fish populations in Millard Creek rearing channel. ......................................... 10
Photo 5. Isa Faria and Heidi Morfitt co-facilitate a public tour of the YERII study ..................................... 13
iv
Acknowledgements
Ministry of Children and Family Development provided funding for Wendy Kotilla and
Graham Hilliar, as well as two youth, Isa Faria and Heidi Morfitt. Millard Piercy Watershed
Stewards contributed funds for Registered Professional Biologist, Esther Guimond.
Private property access to conduct the fish habitat and channel productivity on Millard
Creek Rearing Channel was given by landowners Cheryl and James Glennie, and Dylan Hardie.
We respectfully acknowledge that we conducted this work on the unceded traditional territory of
K’omoks First Nations.
Photo 1. YERII team: Isa Faria, Graham Hilliar, Heidi Morfitt, Esther Guimond, Wendy Kotilla.
1
Introduction
The purpose of the Youth and Ecological Restoration, Phase II (YERII) project in the
Millard Creek rearing channel was to:
1. Provide vulnerable youth with work experience and support while conducting
scientific research in the natural ecosystem.
2. Complete a fisheries and habitat assessment of the Millard Creek rearing channel.
This study was conducted to assess Millard Creek rearing channel fish productivity and
stream habitat. It was done in partnership with Millard Piercy Watershed Stewards (MPWS) and
Youth and Ecological Restoration (YER). The rearing channel has had three previous fish
assessment reports in 2012, 2011 and 2008, which are available at
http://youthecology.ca/ecological-reports/.
Millard Creek rearing channel was constructed about 1996 (Moul and Kotilla, 2012). In the
past, the intake valve has had issues with being filled with gravel, which has resulted in lower
stream flows to the rearing channel. In early 2018, the intake valve was again plugged with
gravel, which was emptied with some effort using a high pressure pump. Lower rearing channel
flows have resulted in some concerns about fish productivity.
For this 2018 study MPWS and YER formed the fourth partnership to involve vulnerable
youth with fisheries research in the rearing channel. This was a YER, Phase II project that
involved three adults working with two youth: Biologist, Esther Guimond; YER Coordinator,
Wendy Kotilla; YER Contractor, Graham Hilliar; and two youth, Isa Faria and Heidi Morfitt.
YER is a program that involves vulnerable youth aged twelve to eighteen with community
members to restore Comox Valley watersheds. It provides youth with work experience through
ecological restoration methods, ecotherapy practices and mentoring support. In YERI, youth
work one-on-one with the YER Coordinator and several different environmental groups. In
YERII, youth work with an environmental professional on a specific project for advanced
learning about ecology, research and communication (YER 2018).
2
YERII has a five day format, consisting of three days of research and two days for
preparation and delivery of a public tour, which is co-facilitated by the two youth on the final
day. This YERII project was conducted from August 22nd to 26th, 2018.
Study Location
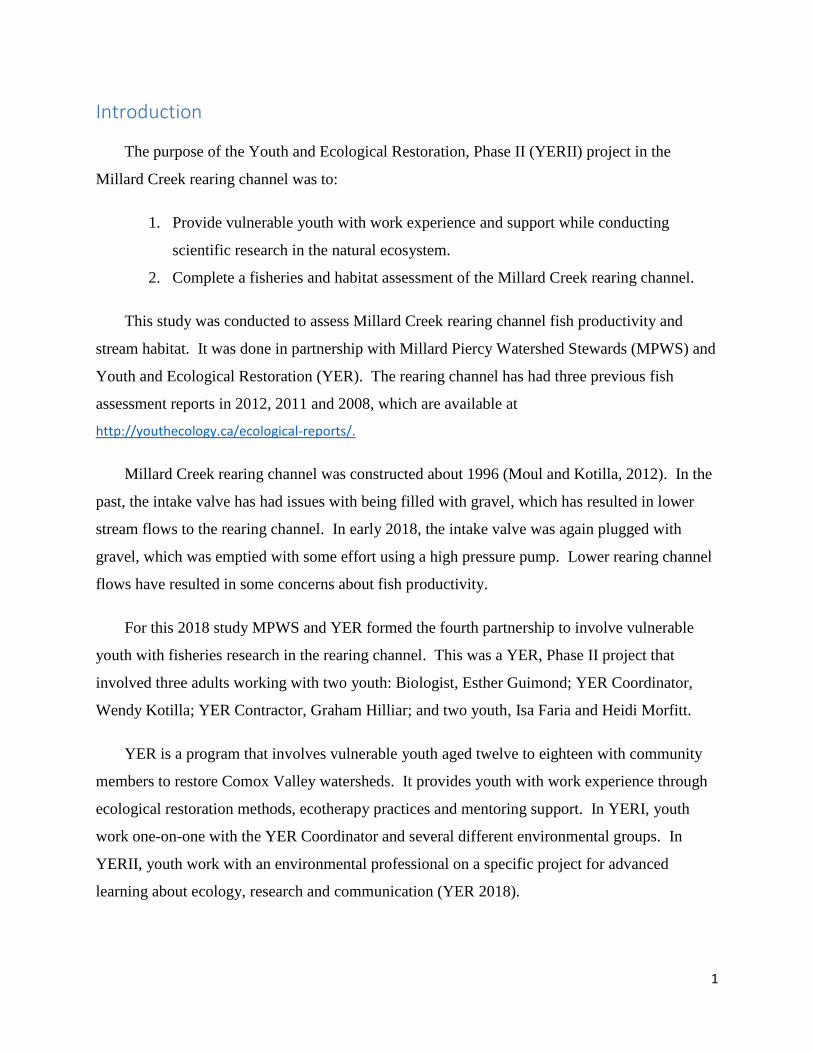
Millard Creek originates from springs and wetlands near Cumberland Road, and flows for
approximately 4.2 km into the east side of the K’omoks Estuary. It is a low gradient stream with
dependable year-round flow. The juvenile rearing survey was located in the upper portion of the
Millard Creek rearing channel (Figure1).
Figure 1. Location of the juvenile rearing survey and Gee trapping locations in the Millard Creek rearing channel, 22-24 August 2018.
3
Methods
Water Quality
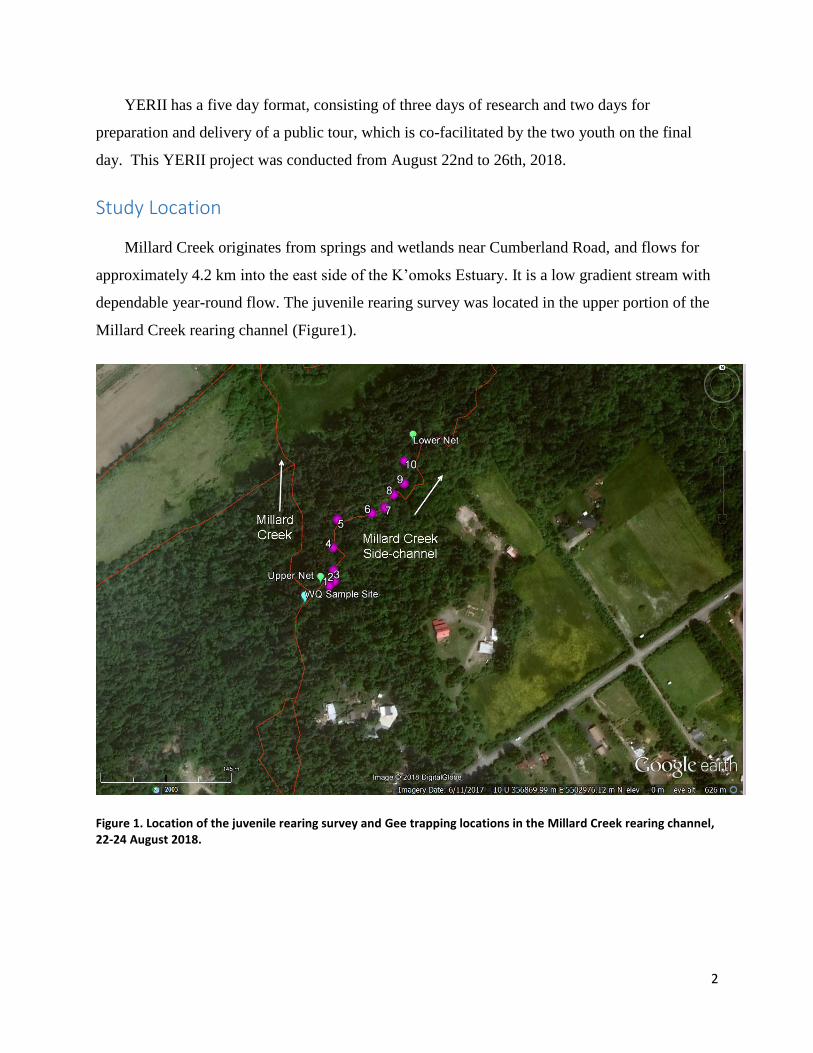
Environmental and water quality variables measured included water and air temperature,
dissolved oxygen, pH, total dissolved solids and conductivity. Water quality indicators were
measured using a HANNA Instruments HI98129 pH/EC/TDS/Temperature with Only One
Tester, and an OxyGuard Handy Beta Portable DO Meter H01B at the upstream end of the
rearing channel. Water quality was measured just upstream of the discharge sampling site, where
the intake valve discharges into the rearing channel (Figure 1).
Photo 2. Conducting stream discharge and water quality measurements.
Stream Discharge
Stream discharge is a function of water volume and velocity, and was measured using the
floating object method, as described in the Streamkeepers Handbook (Taccogna and Munro
1995). A 5 m length of channel with suitable laminar flow was marked with flagging tape. This

4
was the same location used in previous surveys in the rearing channel and was located
approximately 2 m downstream of the rearing channel inlet valve and the water quality sampling
site (Figure 1). A cross sectional area was measured at both the start and finish of the 5m channel
using a measuring tape and meter stick. The cross sectional area of the stream is the product of
stream width multiplied by the average water depth, from measurements collected at 5 intervals
across the channel. Stream velocity was measured with a small piece of wood, noting the time
required to travel the 5 m channel length on 5 individual trials.
Juvenile Population Estimate
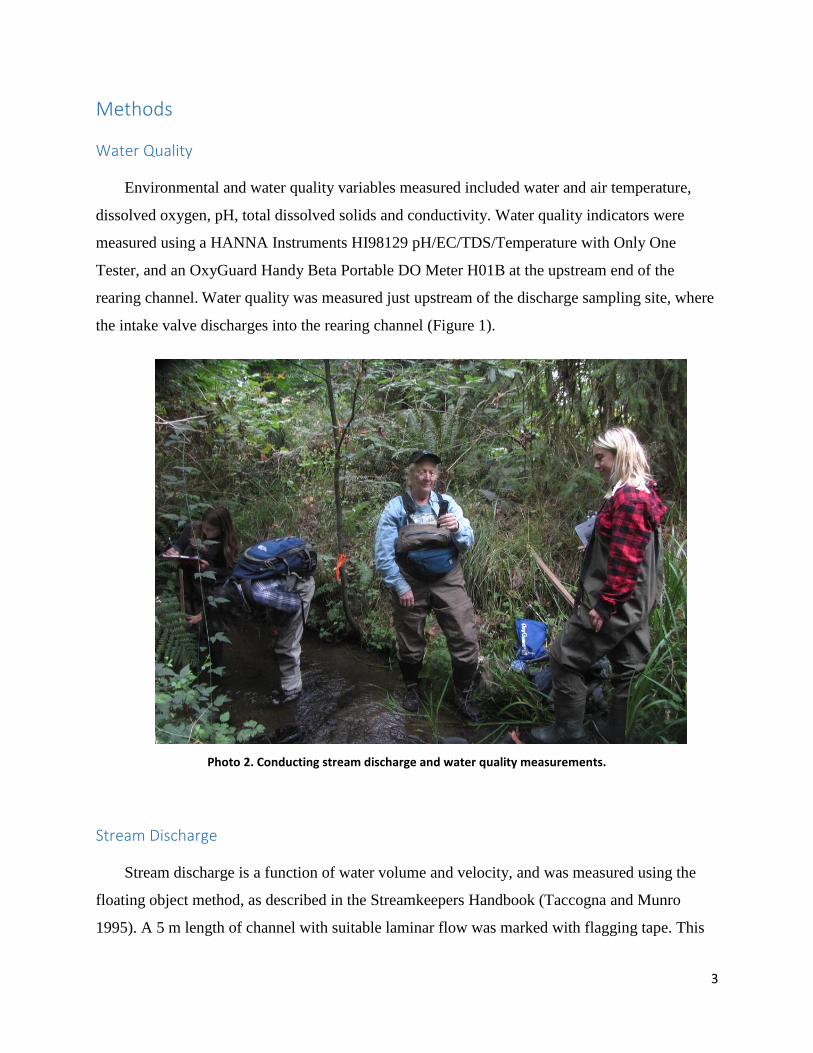
A mark-recapture survey was conducted in the Millard Creek rearing channel to determine
summer rearing usage by coho and trout and estimate their abundance. Two stop nets were used
in the upper section of the rearing channel to isolate a 250 m length of channel for the mark-
recapture survey. A total of ten Gee traps were baited with salmon roe and placed in locations
with sufficient water depth to cover the trap, and oriented to the direction of the water flow. Gee
traps consisted of ¼ inch galvanized mesh with cone shaped funnels on each end. Traps have two
parts that hinge and connect together at the center. The traps were checked the following day and
all species (salmonids and non-salmonids) were recorded. The catch from each trap was sedated
using Alka-Seltzer™ tablets in a bucket of stream water. Fork length measurements (tip of the
snout to the fork of the tail) were recorded to the nearest mm on a measuring board. Wet weight
was measured to the nearest 0.1 gram using an Ohaus electronic balance (Scout® Pro). All coho
and cutthroat trout were fin clipped (upper lobe of caudal fin squared off using clipping scissors).
After marking and sampling, fish were allowed to recover in a bucket of freshwater and the catch
was released back to the site of capture. Traps were then re-set in the same location and left to
soak for another 24 hours. On the final day of recovery, all fish caught were recorded, noting the
number of marked and unmarked coho and trout in each trap.
5
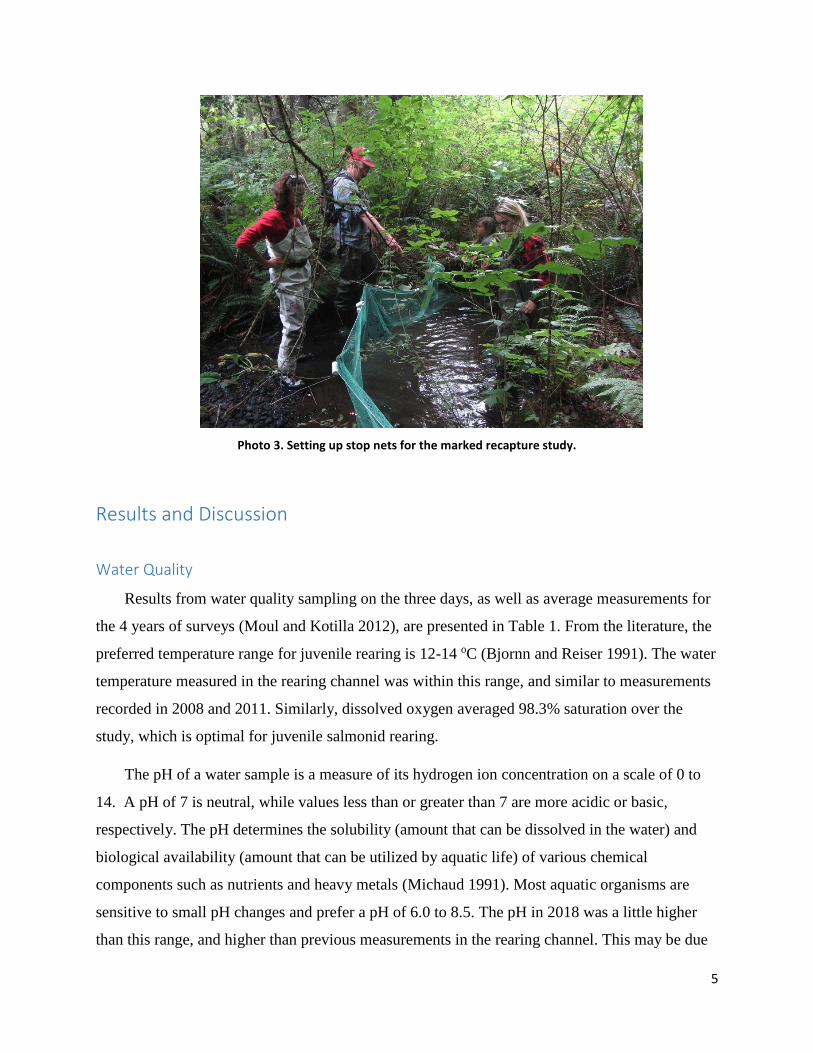
Photo 3. Setting up stop nets for the marked recapture study.
Results and Discussion
Water Quality
Results from water quality sampling on the three days, as well as average measurements for
the 4 years of surveys (Moul and Kotilla 2012), are presented in Table 1. From the literature, the
preferred temperature range for juvenile rearing is 12-14 oC (Bjornn and Reiser 1991). The water
temperature measured in the rearing channel was within this range, and similar to measurements
recorded in 2008 and 2011. Similarly, dissolved oxygen averaged 98.3% saturation over the
study, which is optimal for juvenile salmonid rearing.
The pH of a water sample is a measure of its hydrogen ion concentration on a scale of 0 to
14. A pH of 7 is neutral, while values less than or greater than 7 are more acidic or basic,
respectively. The pH determines the solubility (amount that can be dissolved in the water) and
biological availability (amount that can be utilized by aquatic life) of various chemical
components such as nutrients and heavy metals (Michaud 1991). Most aquatic organisms are
sensitive to small pH changes and prefer a pH of 6.0 to 8.5. The pH in 2018 was a little higher
than this range, and higher than previous measurements in the rearing channel. This may be due
6
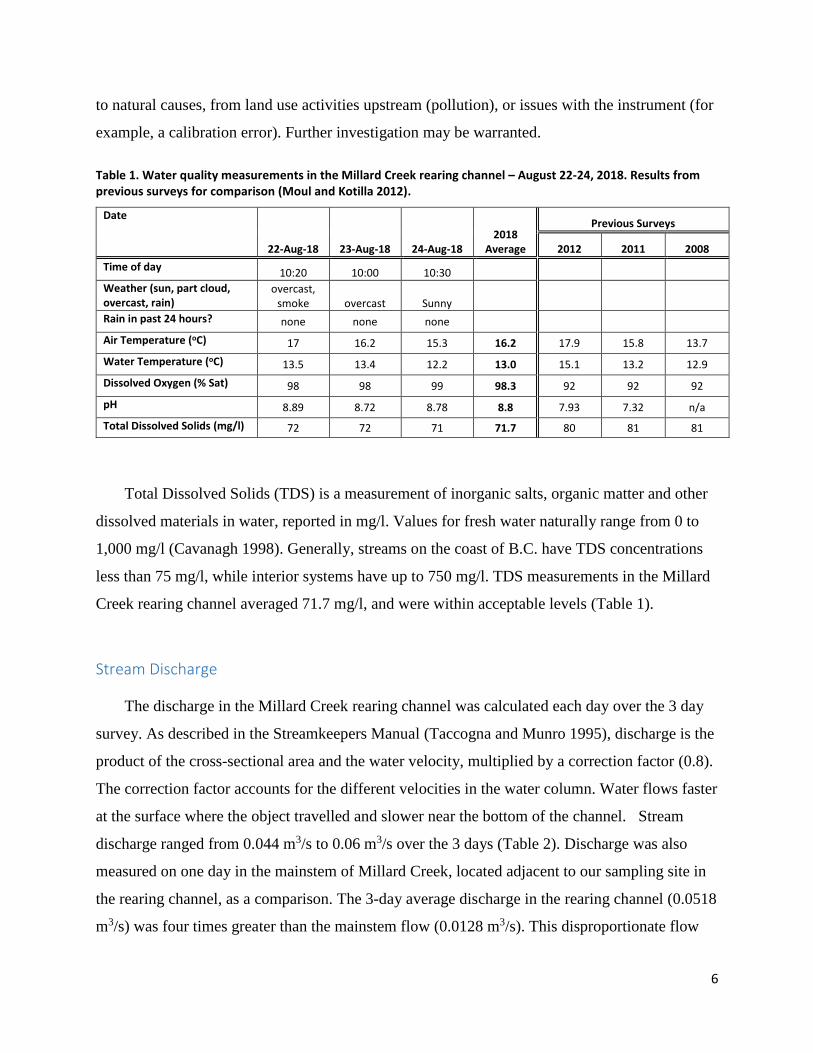
to natural causes, from land use activities upstream (pollution), or issues with the instrument (for
example, a calibration error). Further investigation may be warranted.
Table 1. Water quality measurements in the Millard Creek rearing channel – August 22-24, 2018. Results from previous surveys for comparison (Moul and Kotilla 2012).
Date
22-Aug-18 23-Aug-18 24-Aug-18 2018
Average
Previous Surveys
2012 2011 2008
Time of day 10:20 10:00 10:30
Weather (sun, part cloud, overcast, rain)
overcast, smoke overcast Sunny
Rain in past 24 hours? none none none
Air Temperature (oC) 17 16.2 15.3 16.2 17.9 15.8 13.7
Water Temperature (oC) 13.5 13.4 12.2 13.0 15.1 13.2 12.9
Dissolved Oxygen (% Sat) 98 98 99 98.3 92 92 92
pH 8.89 8.72 8.78 8.8 7.93 7.32 n/a
Total Dissolved Solids (mg/l) 72 72 71 71.7 80 81 81
Total Dissolved Solids (TDS) is a measurement of inorganic salts, organic matter and other
dissolved materials in water, reported in mg/l. Values for fresh water naturally range from 0 to
1,000 mg/l (Cavanagh 1998). Generally, streams on the coast of B.C. have TDS concentrations
less than 75 mg/l, while interior systems have up to 750 mg/l. TDS measurements in the Millard
Creek rearing channel averaged 71.7 mg/l, and were within acceptable levels (Table 1).
Stream Discharge
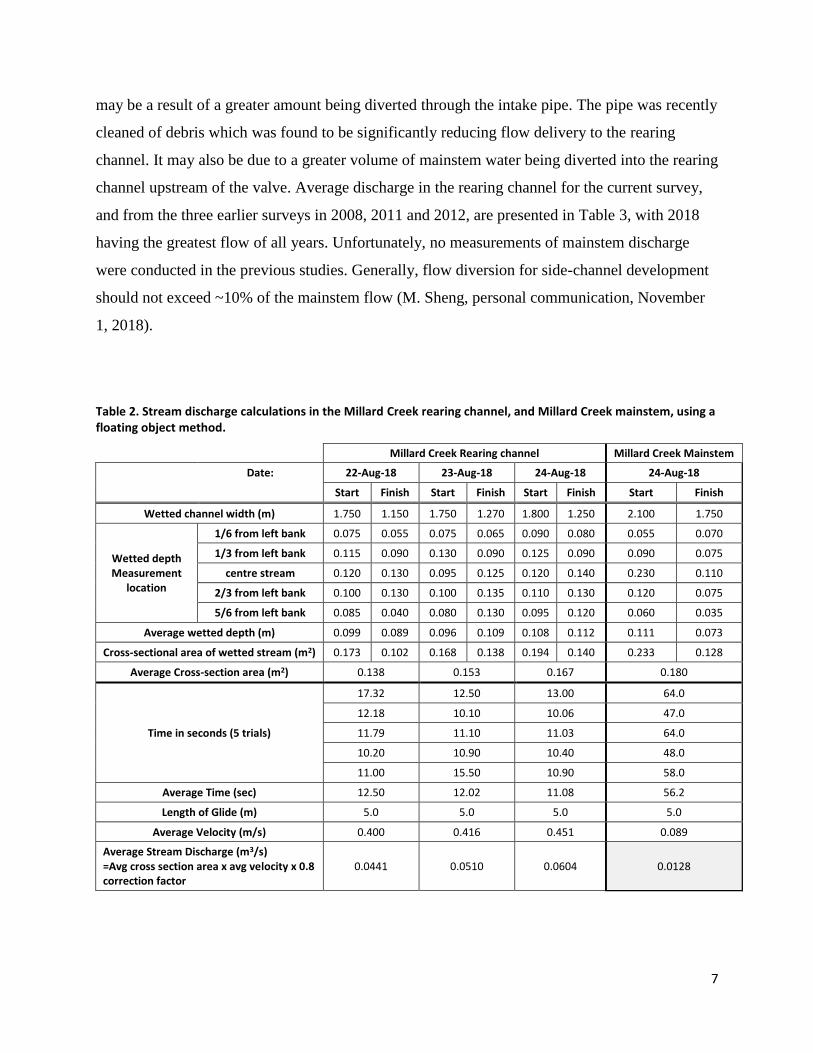
The discharge in the Millard Creek rearing channel was calculated each day over the 3 day
survey. As described in the Streamkeepers Manual (Taccogna and Munro 1995), discharge is the
product of the cross-sectional area and the water velocity, multiplied by a correction factor (0.8).
The correction factor accounts for the different velocities in the water column. Water flows faster
at the surface where the object travelled and slower near the bottom of the channel. Stream
discharge ranged from 0.044 m3/s to 0.06 m3/s over the 3 days (Table 2). Discharge was also
measured on one day in the mainstem of Millard Creek, located adjacent to our sampling site in
the rearing channel, as a comparison. The 3-day average discharge in the rearing channel (0.0518
m3/s) was four times greater than the mainstem flow (0.0128 m3/s). This disproportionate flow
7
may be a result of a greater amount being diverted through the intake pipe. The pipe was recently
cleaned of debris which was found to be significantly reducing flow delivery to the rearing
channel. It may also be due to a greater volume of mainstem water being diverted into the rearing
channel upstream of the valve. Average discharge in the rearing channel for the current survey,
and from the three earlier surveys in 2008, 2011 and 2012, are presented in Table 3, with 2018
having the greatest flow of all years. Unfortunately, no measurements of mainstem discharge
were conducted in the previous studies. Generally, flow diversion for side-channel development
should not exceed ~10% of the mainstem flow (M. Sheng, personal communication, November
1, 2018).
Table 2. Stream discharge calculations in the Millard Creek rearing channel, and Millard Creek mainstem, using a floating object method.
Millard Creek Rearing channel Millard Creek Mainstem
Date: 22-Aug-18 23-Aug-18 24-Aug-18 24-Aug-18
Start Finish Start Finish Start Finish Start Finish
Wetted channel width (m) 1.750 1.150 1.750 1.270 1.800 1.250 2.100 1.750
Wetted depth Measurement
location
1/6 from left bank 0.075 0.055 0.075 0.065 0.090 0.080 0.055 0.070
1/3 from left bank 0.115 0.090 0.130 0.090 0.125 0.090 0.090 0.075
centre stream 0.120 0.130 0.095 0.125 0.120 0.140 0.230 0.110
2/3 from left bank 0.100 0.130 0.100 0.135 0.110 0.130 0.120 0.075
5/6 from left bank 0.085 0.040 0.080 0.130 0.095 0.120 0.060 0.035
Average wetted depth (m) 0.099 0.089 0.096 0.109 0.108 0.112 0.111 0.073
Cross-sectional area of wetted stream (m2) 0.173 0.102 0.168 0.138 0.194 0.140 0.233 0.128
Average Cross-section area (m2) 0.138 0.153 0.167 0.180
Time in seconds (5 trials)
17.32 12.50 13.00 64.0
12.18 10.10 10.06 47.0
11.79 11.10 11.03 64.0
10.20 10.90 10.40 48.0
11.00 15.50 10.90 58.0
Average Time (sec) 12.50 12.02 11.08 56.2
Length of Glide (m) 5.0 5.0 5.0 5.0
Average Velocity (m/s) 0.400 0.416 0.451 0.089
Average Stream Discharge (m3/s) =Avg cross section area x avg velocity x 0.8 correction factor
0.0441 0.0510 0.0604 0.0128
8
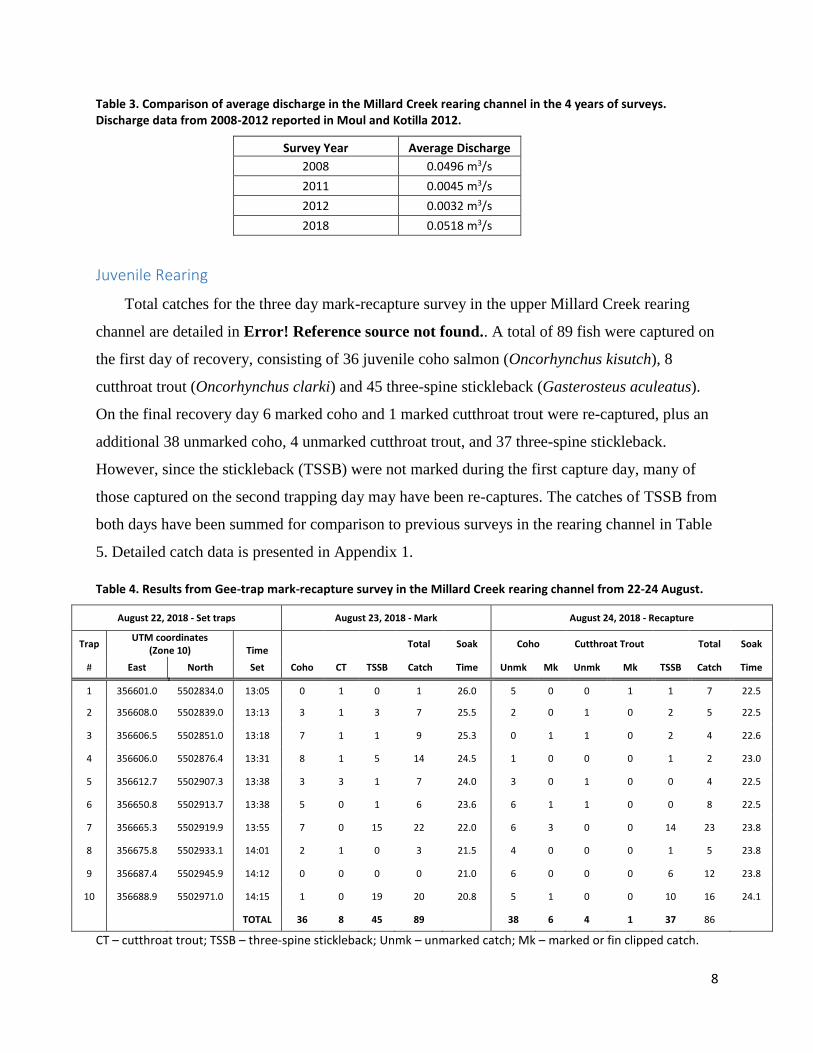
Table 3. Comparison of average discharge in the Millard Creek rearing channel in the 4 years of surveys. Discharge data from 2008-2012 reported in Moul and Kotilla 2012.
Survey Year Average Discharge
2008 0.0496 m3/s
2011 0.0045 m3/s
2012 0.0032 m3/s
2018 0.0518 m3/s
Juvenile Rearing
Total catches for the three day mark-recapture survey in the upper Millard Creek rearing
channel are detailed in Error! Reference source not found.. A total of 89 fish were captured on
the first day of recovery, consisting of 36 juvenile coho salmon (Oncorhynchus kisutch), 8
cutthroat trout (Oncorhynchus clarki) and 45 three-spine stickleback (Gasterosteus aculeatus).
On the final recovery day 6 marked coho and 1 marked cutthroat trout were re-captured, plus an
additional 38 unmarked coho, 4 unmarked cutthroat trout, and 37 three-spine stickleback.
However, since the stickleback (TSSB) were not marked during the first capture day, many of
those captured on the second trapping day may have been re-captures. The catches of TSSB from
both days have been summed for comparison to previous surveys in the rearing channel in Table
5. Detailed catch data is presented in Appendix 1.
Table 4. Results from Gee-trap mark-recapture survey in the Millard Creek rearing channel from 22-24 August.
August 22, 2018 - Set traps August 23, 2018 - Mark August 24, 2018 - Recapture
Trap UTM coordinates
(Zone 10) Time Total Soak Coho Cutthroat Trout Total Soak
# East North Set Coho CT TSSB Catch Time Unmk Mk Unmk Mk TSSB Catch Time
1 356601.0 5502834.0 13:05 0 1 0 1 26.0 5 0 0 1 1 7 22.5
2 356608.0 5502839.0 13:13 3 1 3 7 25.5 2 0 1 0 2 5 22.5
3 356606.5 5502851.0 13:18 7 1 1 9 25.3 0 1 1 0 2 4 22.6
4 356606.0 5502876.4 13:31 8 1 5 14 24.5 1 0 0 0 1 2 23.0
5 356612.7 5502907.3 13:38 3 3 1 7 24.0 3 0 1 0 0 4 22.5
6 356650.8 5502913.7 13:38 5 0 1 6 23.6 6 1 1 0 0 8 22.5
7 356665.3 5502919.9 13:55 7 0 15 22 22.0 6 3 0 0 14 23 23.8
8 356675.8 5502933.1 14:01 2 1 0 3 21.5 4 0 0 0 1 5 23.8
9 356687.4 5502945.9 14:12 0 0 0 0 21.0 6 0 0 0 6 12 23.8
10 356688.9 5502971.0 14:15 1 0 19 20 20.8 5 1 0 0 10 16 24.1
TOTAL 36 8 45 89 38 6 4 1 37 86
CT – cutthroat trout; TSSB – three-spine stickleback; Unmk – unmarked catch; Mk – marked or fin clipped catch.
9
Concurrent to the mark-recapture study in the upper rearing channel, the MMPWS
conducted presence/absence Gee trapping in the lower section of the rearing channel to collect
information on juvenile coho salmon distribution. No effort was made to conduct mark-recapture
population estimation. Catch data for the lower trapping is detailed in Appendix 2.
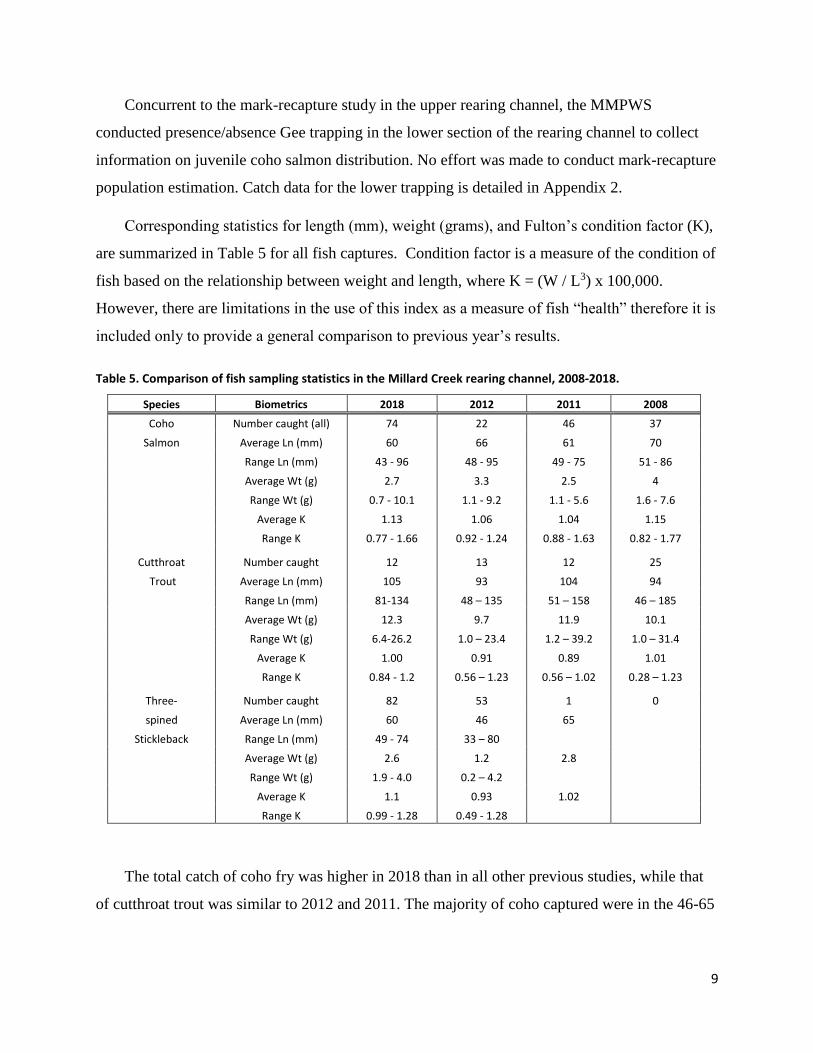
Corresponding statistics for length (mm), weight (grams), and Fulton’s condition factor (K),
are summarized in Table 5 for all fish captures. Condition factor is a measure of the condition of
fish based on the relationship between weight and length, where K = (W / L3) x 100,000.
However, there are limitations in the use of this index as a measure of fish “health” therefore it is
included only to provide a general comparison to previous year’s results.
Table 5. Comparison of fish sampling statistics in the Millard Creek rearing channel, 2008-2018.
Species Biometrics 2018 2012 2011 2008
Coho Number caught (all) 74 22 46 37
Salmon Average Ln (mm) 60 66 61 70
Range Ln (mm) 43 - 96 48 - 95 49 - 75 51 - 86
Average Wt (g) 2.7 3.3 2.5 4
Range Wt (g) 0.7 - 10.1 1.1 - 9.2 1.1 - 5.6 1.6 - 7.6
Average K 1.13 1.06 1.04 1.15
Range K 0.77 - 1.66 0.92 - 1.24 0.88 - 1.63 0.82 - 1.77
Cutthroat Number caught 12 13 12 25
Trout Average Ln (mm) 105 93 104 94
Range Ln (mm) 81-134 48 – 135 51 – 158 46 – 185
Average Wt (g) 12.3 9.7 11.9 10.1
Range Wt (g) 6.4-26.2 1.0 – 23.4 1.2 – 39.2 1.0 – 31.4
Average K 1.00 0.91 0.89 1.01
Range K 0.84 - 1.2 0.56 – 1.23 0.56 – 1.02 0.28 – 1.23
Three- Number caught 82 53 1 0
spined Average Ln (mm) 60 46 65
Stickleback Range Ln (mm) 49 - 74 33 – 80
Average Wt (g) 2.6 1.2 2.8
Range Wt (g) 1.9 - 4.0 0.2 – 4.2
Average K 1.1 0.93 1.02
Range K 0.99 - 1.28 0.49 - 1.28
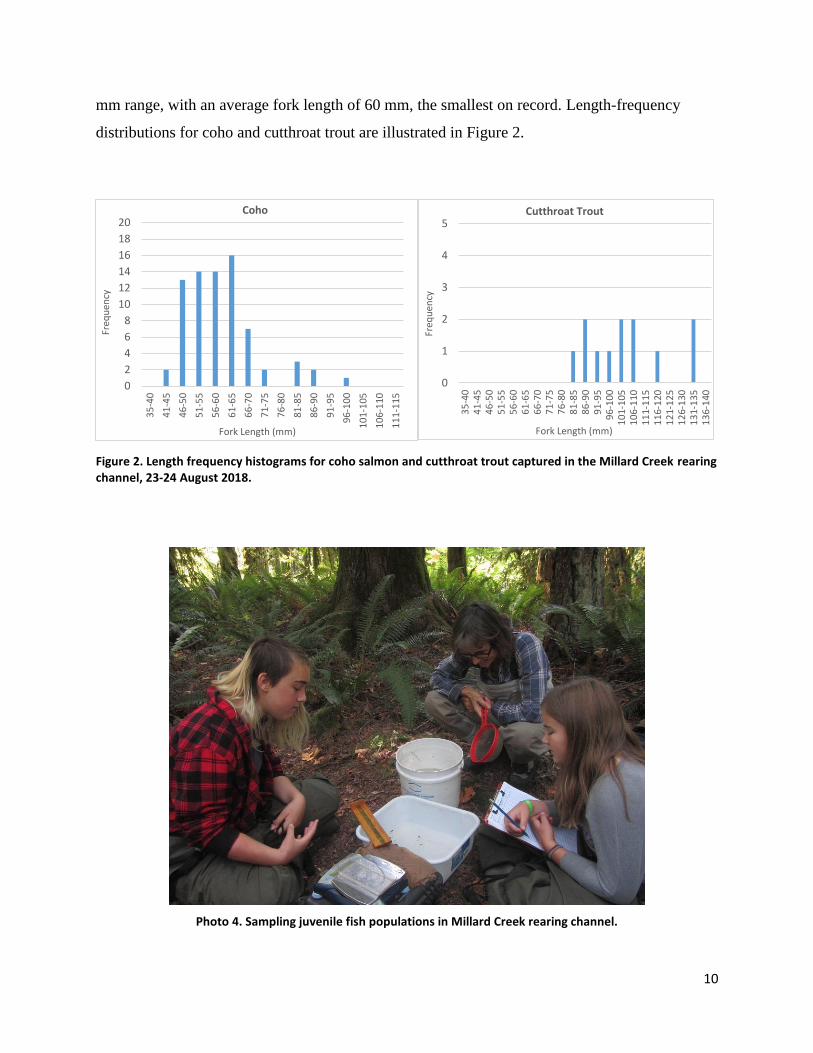
The total catch of coho fry was higher in 2018 than in all other previous studies, while that
of cutthroat trout was similar to 2012 and 2011. The majority of coho captured were in the 46-65
10
mm range, with an average fork length of 60 mm, the smallest on record. Length-frequency
distributions for coho and cutthroat trout are illustrated in Figure 2.
Figure 2. Length frequency histograms for coho salmon and cutthroat trout captured in the Millard Creek rearing channel, 23-24 August 2018.
Photo 4. Sampling juvenile fish populations in Millard Creek rearing channel.
0
2
4
6
8
10
12
14
16
18
20
35
-40
41
-45
46
-50
51
-55
56
-60
61
-65
66
-70
71
-75
76
-80
81
-85
86
-90
91
-95
96
-10
0
10
1-1
05
10
6-1
10
11
1-1
15
Freq
uen
cy
Fork Length (mm)
Coho
0
1
2
3
4
5
35
-40
41
-45
46
-50
51
-55
56
-60
61
-65
66
-70
71
-75
76
-80
81
-85
86
-90
91
-95
96
-10
01
01-
105
10
6-1
101
11-
115
11
6-1
201
21-
125
12
6-1
301
31-
135
13
6-1
40
Freq
uen
cyFork Length (mm)
Cutthroat Trout
11
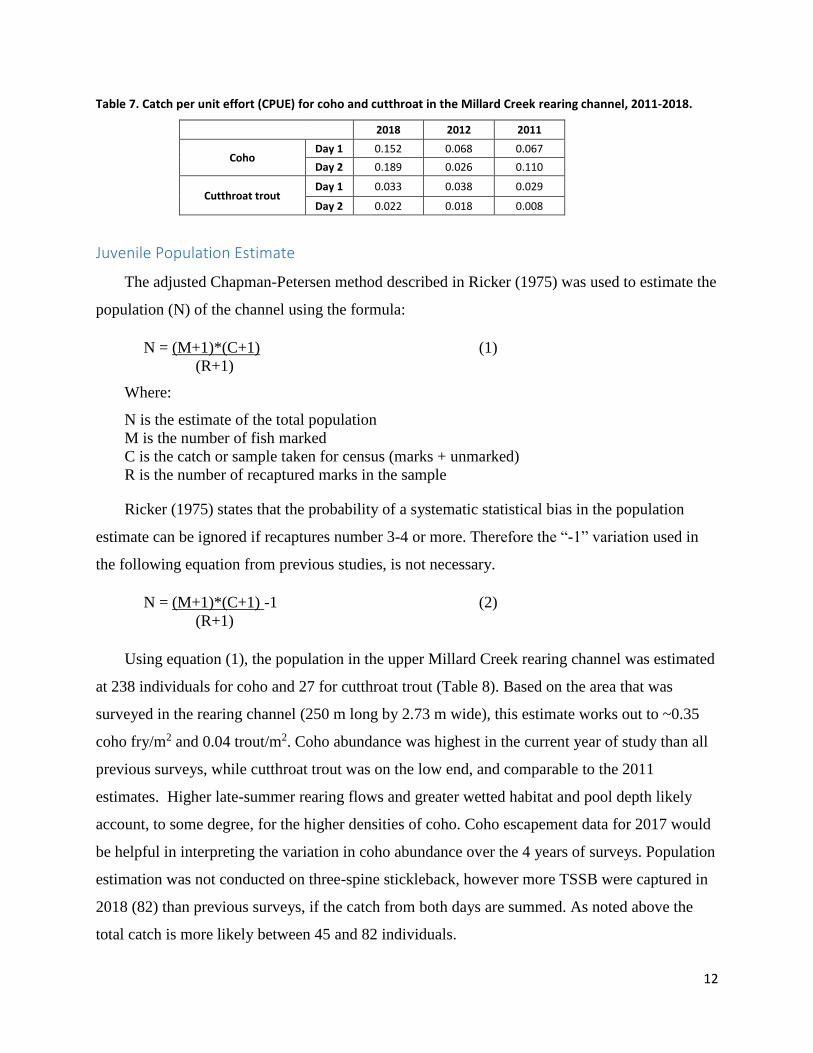
Habitat Attributes
Measurements of the physical characteristics of the reach where the Gee trapping survey
was conducted followed methods in Moul and Kotilla, 2012, and was focused mainly in pool
habitat of the ten trapping sites. The average pool depth for the 10 trap sites ranged from 0.17 m
to 0.39 m (Table 6) with an overall average pool depth for the surveyed reach of 0.26 m.
Unsurprisingly, the average pool depth over the surveyed reach in 2012 was only 0.16 m due to
the lower flows observed in that year.
In addition to the instream salmonid habitat, the riparian corridor of the Millard Creek
rearing channel was observed to provide habitat for a variety of other wildlife species, including
red-legged frogs, Pacific tree frogs, Pacific sideband snails, and many bird species.
Table 6. Summary of habitat measurements at Gee trap locations in the rearing channel, August 23, 2018.
Trap Water depth at trap location (m) Wetted Channel Bankful Pool Tail
# D1 D2 D3 D4 D5 Average
Depth (m) Width (m) Width (m) Depth (m) Crest Depth
(m)
1 0.13 0.16 0.26 0.27 0.14 0.19 3.35 4.40 0.30 0.10
2 0.25 0.29 0.30 0.32 0.09 0.25 2.05 2.40 0.30 0.14
3 0.10 0.18 0.29 0.23 0.21 0.20 1.98 2.20 0.29 0.13
4 0.17 0.20 0.28 0.27 0.26 0.24 1.97 1.60 0.44 0.09
5 0.19 0.26 0.19 0.26 0.32 0.24 3.00 3.00 0.25 0.05
6 0.22 0.25 0.20 0.12 0.07 0.17 2.32 1.90 0.23 0.07
7 0.16 0.27 0.35 0.37 0.39 0.31 2.55 2.65 0.09 0.05
8 0.15 0.34 0.49 0.40 0.22 0.32 4.50 4.50 0.22 0.06
9 0.26 0.35 0.43 0.45 0.45 0.39 2.10 2.30 0.14 0.07
10 0.10 0.50 0.43 0.32 0.14 0.30 3.50 3.20 0.56 0.15
Reach Average 0.26 2.73 2.82 0.28 0.09
The catch per unit effort (CPUE) is an indirect measure of the abundance of a target species
and expressed as the number of fish captured per hour of fishing time. CPUE for coho and
cutthroat trout is summarized in Table 6, and was slightly higher on Day 2 than Day 1 for coho.
Overall, the 2018 CPUE for coho was over double than previous years, while CPUE for cutthroat
trout was more comparable to the previous surveys.
12
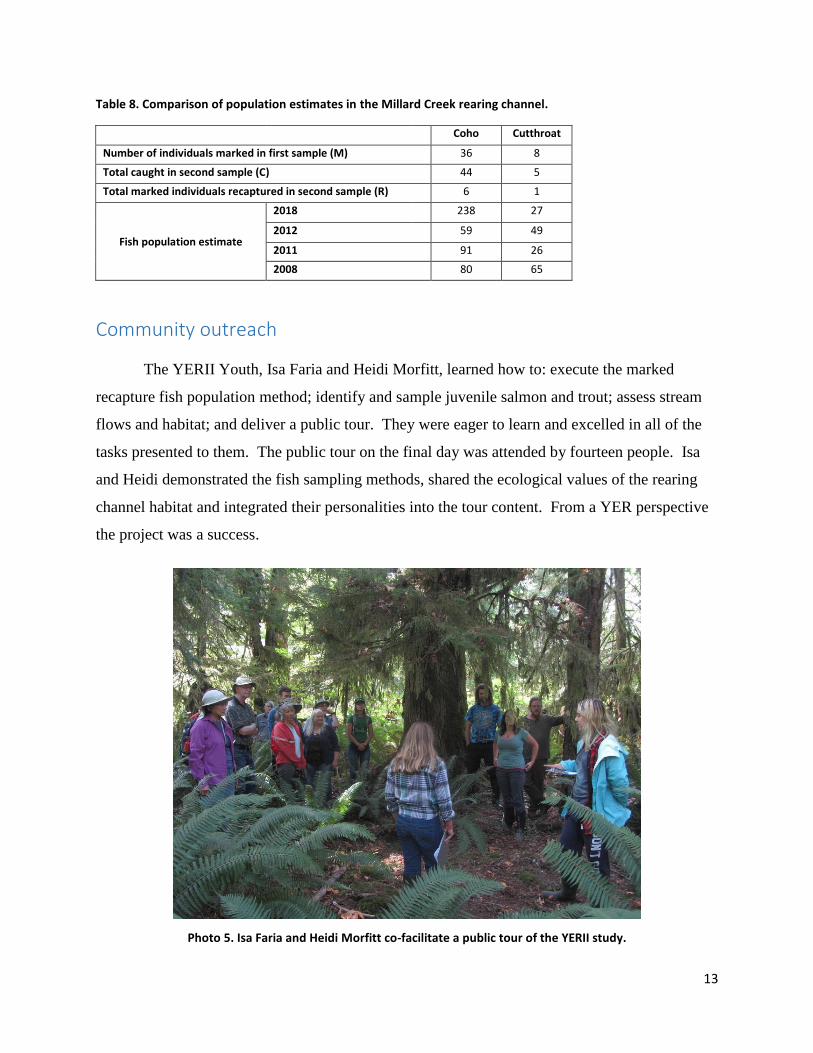
Table 7. Catch per unit effort (CPUE) for coho and cutthroat in the Millard Creek rearing channel, 2011-2018.
2018 2012 2011
Coho Day 1 0.152 0.068 0.067
Day 2 0.189 0.026 0.110
Cutthroat trout Day 1 0.033 0.038 0.029
Day 2 0.022 0.018 0.008
Juvenile Population Estimate
The adjusted Chapman-Petersen method described in Ricker (1975) was used to estimate the
population (N) of the channel using the formula:
N = (M+1)*(C+1) (1)
(R+1)
Where:
N is the estimate of the total population
M is the number of fish marked
C is the catch or sample taken for census (marks + unmarked)
R is the number of recaptured marks in the sample
Ricker (1975) states that the probability of a systematic statistical bias in the population
estimate can be ignored if recaptures number 3-4 or more. Therefore the “-1” variation used in
the following equation from previous studies, is not necessary.
N = (M+1)*(C+1) -1 (2)
(R+1)
Using equation (1), the population in the upper Millard Creek rearing channel was estimated
at 238 individuals for coho and 27 for cutthroat trout (Table 8). Based on the area that was
surveyed in the rearing channel (250 m long by 2.73 m wide), this estimate works out to ~0.35
coho fry/m2 and 0.04 trout/m2. Coho abundance was highest in the current year of study than all
previous surveys, while cutthroat trout was on the low end, and comparable to the 2011
estimates. Higher late-summer rearing flows and greater wetted habitat and pool depth likely
account, to some degree, for the higher densities of coho. Coho escapement data for 2017 would
be helpful in interpreting the variation in coho abundance over the 4 years of surveys. Population
estimation was not conducted on three-spine stickleback, however more TSSB were captured in
2018 (82) than previous surveys, if the catch from both days are summed. As noted above the
total catch is more likely between 45 and 82 individuals.
13
Table 8. Comparison of population estimates in the Millard Creek rearing channel.
Coho Cutthroat
Number of individuals marked in first sample (M) 36 8
Total caught in second sample (C) 44 5
Total marked individuals recaptured in second sample (R) 6 1
Fish population estimate
2018 238 27
2012 59 49
2011 91 26
2008 80 65
Community outreach
The YERII Youth, Isa Faria and Heidi Morfitt, learned how to: execute the marked
recapture fish population method; identify and sample juvenile salmon and trout; assess stream
flows and habitat; and deliver a public tour. They were eager to learn and excelled in all of the
tasks presented to them. The public tour on the final day was attended by fourteen people. Isa
and Heidi demonstrated the fish sampling methods, shared the ecological values of the rearing
channel habitat and integrated their personalities into the tour content. From a YER perspective
the project was a success.
Photo 5. Isa Faria and Heidi Morfitt co-facilitate a public tour of the YERII study.
14
Recommendations
A routine monitoring and maintenance schedule for the Millard Creek rearing channel
rearing channel intake should be implemented to ensure adequate rearing flows are available,
particularly during critical times of the year. Routine monitoring should also include an
assessment of diversion flows (and other inflows) relative to the Millard Creek mainstem to
ensure optimum flow rates in both channels.
Additional water quality sampling should be conducted to investigate the elevated pH
measurements that were observed in 2018.
A comparison of the coho population estimates to adult spawner counts in Millard Creek
over the years juvenile surveys were completed may provide more insight into the variation in
coho production in the rearing channel.
Summary
The 2018 fish habitat and juvenile population study in the Millard Creek rearing channel has
confirmed that the channel continues to support a healthy salmonid population, and contributes
valuable rearing habitat in the Millard Creek watershed. The 2018 summer rearing coho juvenile
population estimate was the highest recorded in the 4 years of mark-recapture studies in the
channel. Further investigation into the performance of the intake valve and flows into the rearing
channel should be conducted. In addition, the area also provides habitat for a variety of wildlife
species which were observed during the study, including red-legged frogs, Pacific tree frogs,
Pacific sideband snails, and many bird species.
This was a community partnership with Millard Piercy Watershed Stewards and Youth and
Ecological Restoration. It is the fourth YERII project conducted in collaboration with the two
groups on the Millard Creek rearing channel. The two youth advanced their ecological research
and teamwork skills. The public tour they gave on the final day was well received and improved
the knowledge of the participants.
15
References
Cavanagh, N. 1998. Guidelines for interpreting water quality data. Field test Edition Version 1.0.
B.C. Environment, Water quality Branch, Resources Inventory Committee.
Bjornn, T. C., & Reiser, D. W. 1991. Habitat Requirements of Salmonids in Streams. In W.
Meehan (Ed.), Influence of Forest and Rangeland Management of Salmonid Fishes and
Their Habitats (pp. 83–138). Fisheries Society Special Publication 19.
Michaud, J.P. 1991. A citizens’ guide to understanding and monitoring lakes and streams. Puget
Sound Water Quality Authority.
Moul, I. and W. Kotilla. 2012. Millard Creek Rearing Channel Fish Habitat and Productivity
Report 2012. Prepared for Millard Piercy Watershed Stewards, Courtenay B.C.
Ricker, W.E. 1975. Computation and interpretation of biological statistics of fish populations.
Bull. Fish. Res. Board Can. 191, 382 p.
Taccogna, G. and K. Munro (eds). 1995. The Streamkeepers Handbook: a Practical Guide to
Stream and Wetland Care. Salmonid Enhancement Program, Dept. Fisheries and Oceans,
Vancouver, B.C.
Youth and Ecological Restoration Program. 2018. http://youthecology.ca/. Accessed October 22,
2018.
Personal Communication
Mel Sheng Fisheries and Oceans Canada, Habitat Restoration Biologist (retired);
email November 1, 2018.
16
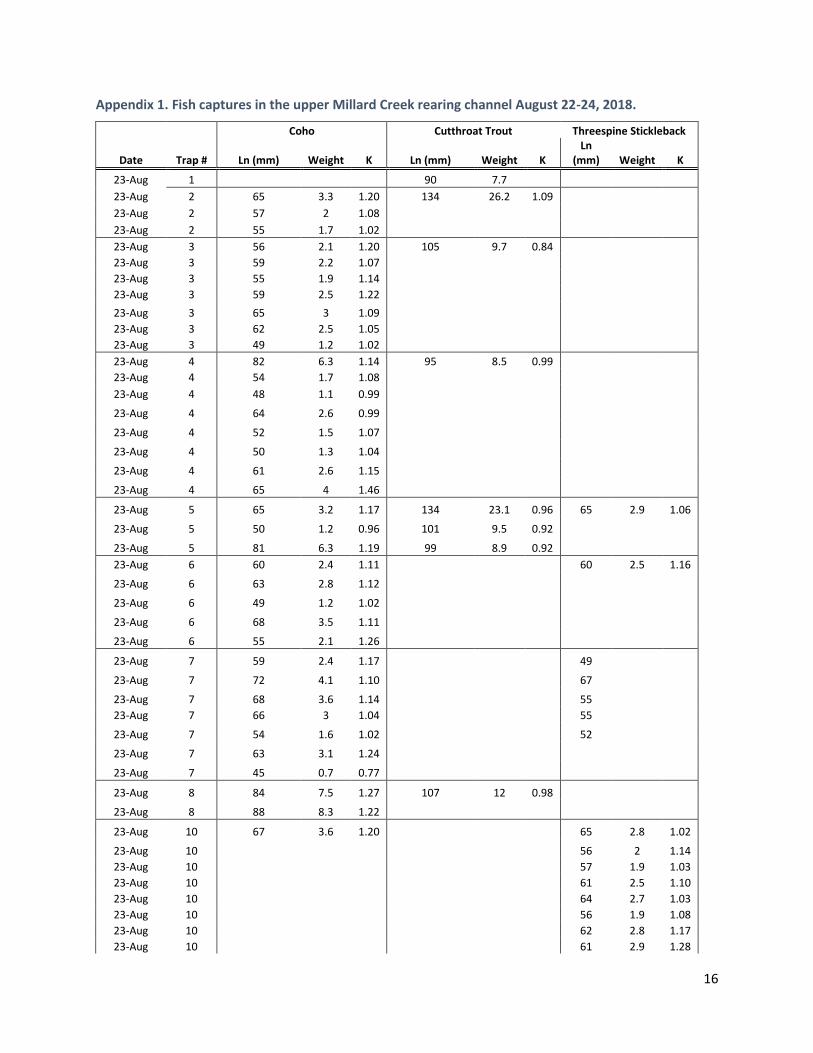
Appendix 1. Fish captures in the upper Millard Creek rearing channel August 22-24, 2018.
Coho Cutthroat Trout Threespine Stickleback
Date Trap # Ln (mm) Weight K Ln (mm) Weight K Ln
(mm) Weight K
23-Aug 1 90 7.7
23-Aug 2 65 3.3 1.20 134 26.2 1.09
23-Aug 2 57 2 1.08
23-Aug 2 55 1.7 1.02
23-Aug 3 56 2.1 1.20 105 9.7 0.84
23-Aug 3 59 2.2 1.07
23-Aug 3 55 1.9 1.14
23-Aug 3 59 2.5 1.22
23-Aug 3 65 3 1.09
23-Aug 3 62 2.5 1.05
23-Aug 3 49 1.2 1.02
23-Aug 4 82 6.3 1.14 95 8.5 0.99
23-Aug 4 54 1.7 1.08
23-Aug 4 48 1.1 0.99
23-Aug 4 64 2.6 0.99
23-Aug 4 52 1.5 1.07
23-Aug 4 50 1.3 1.04
23-Aug 4 61 2.6 1.15
23-Aug 4 65 4 1.46
23-Aug 5 65 3.2 1.17 134 23.1 0.96 65 2.9 1.06
23-Aug 5 50 1.2 0.96 101 9.5 0.92
23-Aug 5 81 6.3 1.19 99 8.9 0.92
23-Aug 6 60 2.4 1.11 60 2.5 1.16
23-Aug 6 63 2.8 1.12
23-Aug 6 49 1.2 1.02
23-Aug 6 68 3.5 1.11
23-Aug 6 55 2.1 1.26
23-Aug 7 59 2.4 1.17 49
23-Aug 7 72 4.1 1.10 67
23-Aug 7 68 3.6 1.14 55
23-Aug 7 66 3 1.04 55
23-Aug 7 54 1.6 1.02 52
23-Aug 7 63 3.1 1.24
23-Aug 7 45 0.7 0.77
23-Aug 8 84 7.5 1.27 107 12 0.98
23-Aug 8 88 8.3 1.22
23-Aug 10 67 3.6 1.20 65 2.8 1.02
23-Aug 10 56 2 1.14
23-Aug 10 57 1.9 1.03
23-Aug 10 61 2.5 1.10
23-Aug 10 64 2.7 1.03
23-Aug 10 56 1.9 1.08
23-Aug 10 62 2.8 1.17
23-Aug 10 61 2.9 1.28
17
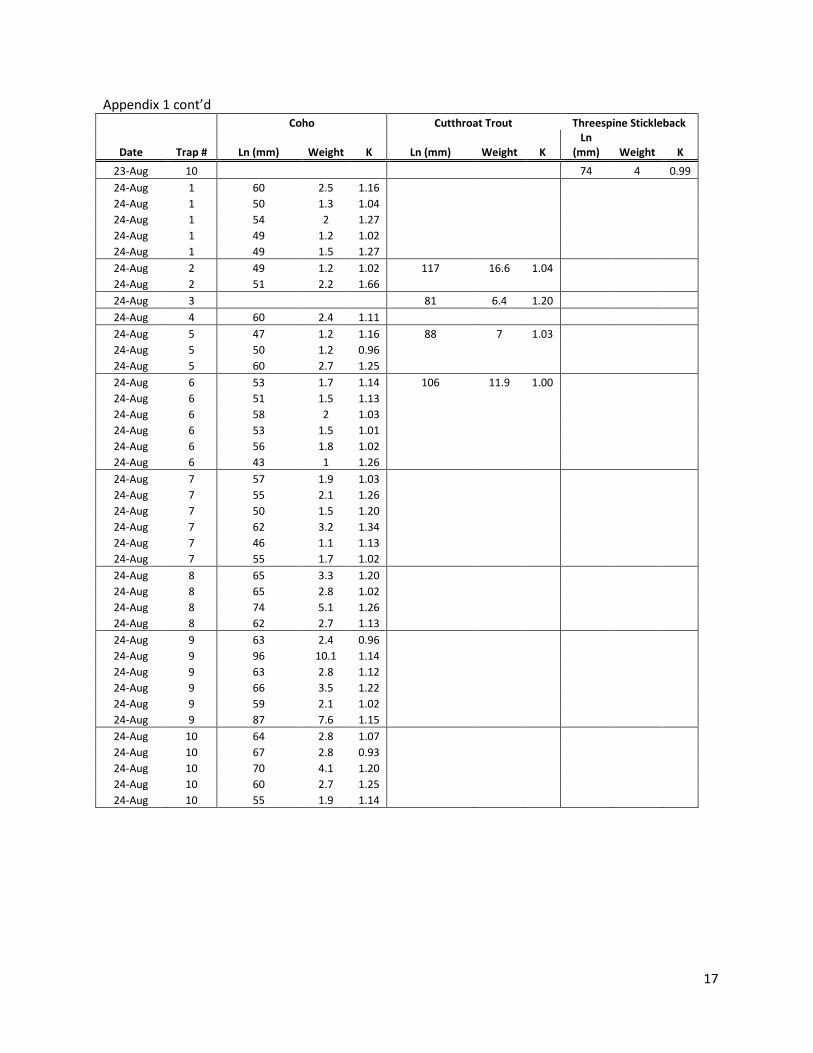
Appendix 1 cont’d
Coho Cutthroat Trout Threespine Stickleback
Date Trap # Ln (mm) Weight K Ln (mm) Weight K Ln
(mm) Weight K
23-Aug 10 74 4 0.99
24-Aug 1 60 2.5 1.16
24-Aug 1 50 1.3 1.04
24-Aug 1 54 2 1.27
24-Aug 1 49 1.2 1.02
24-Aug 1 49 1.5 1.27
24-Aug 2 49 1.2 1.02 117 16.6 1.04
24-Aug 2 51 2.2 1.66
24-Aug 3 81 6.4 1.20
24-Aug 4 60 2.4 1.11
24-Aug 5 47 1.2 1.16 88 7 1.03
24-Aug 5 50 1.2 0.96
24-Aug 5 60 2.7 1.25
24-Aug 6 53 1.7 1.14 106 11.9 1.00
24-Aug 6 51 1.5 1.13
24-Aug 6 58 2 1.03
24-Aug 6 53 1.5 1.01
24-Aug 6 56 1.8 1.02
24-Aug 6 43 1 1.26
24-Aug 7 57 1.9 1.03
24-Aug 7 55 2.1 1.26
24-Aug 7 50 1.5 1.20
24-Aug 7 62 3.2 1.34
24-Aug 7 46 1.1 1.13
24-Aug 7 55 1.7 1.02
24-Aug 8 65 3.3 1.20
24-Aug 8 65 2.8 1.02
24-Aug 8 74 5.1 1.26
24-Aug 8 62 2.7 1.13
24-Aug 9 63 2.4 0.96
24-Aug 9 96 10.1 1.14
24-Aug 9 63 2.8 1.12
24-Aug 9 66 3.5 1.22
24-Aug 9 59 2.1 1.02
24-Aug 9 87 7.6 1.15
24-Aug 10 64 2.8 1.07
24-Aug 10 67 2.8 0.93
24-Aug 10 70 4.1 1.20
24-Aug 10 60 2.7 1.25
24-Aug 10 55 1.9 1.14
18
Appendix 2. Coho salmon captures in the lower Millard Creek rearing channel August 22-23, 2018 (conducted concurrently by MPWS volunteers).
Trap # Fish # Length (mm) Weight (g) K
1 1 50 1.8 1.44
2 2 58 2.1 1.08
2 3 55 2.1 1.26
2 4 86 7.1 1.12
2 5 48 1.4 1.27
2 6 72 4.5 1.21
3 7 50 1.3 1.04
3 8 59 2.3 1.12
3 9 49 1.4 1.19
3 10 47 1.2 1.16
4 11 69 3.5 1.07
4 12 52 2 1.42
4 13 52 1.8 1.28
4 14 70 4.1 1.20
4 15 58 2.4 1.23
5 16 70 3.2 0.93
5 17 62 2.8 1.17
5 18 50 1.4 1.12
6 19 70 4.8 1.40
7 20 49 1.3 1.10
7 21 52 1.8 1.28
7 22 66 3 1.04
7 23 47 1.1 1.06
7 24 48 1.4 1.27
7 25 60 3 1.39
7 26 48 1.3 1.18
8 27 44 0.8 0.94
8 28 55 1.4 0.84
8 29 64 2.3 0.88
8 30 65 3 1.09
10 31 64 2.1 0.80
10 32 64 2.7 1.03
10 33 66 3.4 1.18
10 34 50 1.4 1.12
10 35 62 2.7 1.13
10 36 70 3.8 1.11
10 37 53 1.9 1.28
Mean 58 2.42 1.15
Max 86 7.1 1.44
Min 44 0.8 0.80
N 37