microscopic and ultramicroscopic porosity of an oxisol as determined by image analysis and water...
TRANSCRIPT

Microscopic and Ultramicroscopic Porosity of an Oxisol as Determinedby Image Analysis and Water RetentionE. N. Bui, A. R. Mermut,* and M. C. D. Santos
ABSTRACTDetailed analysis of soil porosity in an Oxisol from Brazil was
performed by image analysis in order to understand the unique waterretention behavior of Oxisols. In addition to pores, the quantificationof skeleton grains and plasma was made by image analysis of thinsection micrographs. Due to the high quantity of skeleton grainsand micro-aggregates, interaggregate pores formed a network of in-terconnected simple and compound packing voids. Interaggregateporosity was an average of 39% for the profile. Micro-aggregates ofabout 50- to lOO-jim in size were impregnated with Spurr's resinand ultrathin sections were made to measure ultramicroscopic pores.Image analysis of the transmission electron microscope (TEM) mi-crographs indicated approximately 9% intra-aggregate pores. Ul-tramicroscopic pores were formed by the arrangement of kaolinite,halloysite and Fe- and Ti-bearing minerals, with an average area of1250 nm2. Their circularity was low, reflecting their irregular outlineand high number of protrusions. The combined use of petrographic,TEM and image analysis techniques can complement other methodsused to determine soil porosity and can provide a better understand-ing of the nature of the porosity of soils because it allows for quan-tification of size and shape of microscopic and ultramicroscopic poresas well as visual appreciation of their spatial arrangement.
OXISOLS SHOW a unique water retention behavior(Sharma and Uehara, 1968). Although they are
fine textured, at high matric potentials, they releasewater rapidly, as do coarser-textured soils, because ofthe presence of micro-aggregates known as 'mi-cropeds' (Chauvel, 1977; Beaudou and Chatelin, 1979;Muller, 1983). At low matric potentials, their watercontent is relatively high. This behavior has been at-tributed to the stability of their aggregates, which pro-motes the formation of interaggregate pores, and tothe presence of ultramicroscopic intra-aggregate pores(Sharma and Uehara, 1968; Tsuji et al., 1975; McCreaand Gilkes, 1987).
Although the size of intra-aggregate pores can beestimated from water retention curves (Childs andCollis-George, 1950; Tsuji et al., 1975) and althoughthese pores have been observed under the scanningelectron microscope (SEM) (Tsuji et al., 1975; McCreaand Gilkes, 1987), until now no data on their size,shape and arrangement have been presented. This pa-per is intended to fill that gap: by using image analysis,it is now possible to obtain direct measurements ofthese pore parameters.
The aim of this work was to investigate the full spec-trum of pores by studying interaggregate pores underthe petrographic microscope and intra-aggregate poresunder the transmission electron microscope (TEM).Jongerius and Bisdom (1981) and Bisdom and Thiel(1981) have demonstrated that backscattered electronDep. of Soil Science, Univ. of Saskatchewan, Saskatoon, SK, Can-ada S7N OWO. Contribution no. R585 from the Saskatchewan Inst.of Pedology. Received 15 June 1988. Corresponding author.
Published in Soil Sci. Soc. Am. J. 53:661-665 (1989).
scanning micrographs could be used for image anal-ysis and it was also one of the objectives of this workto show that TEM micrographs were suitable for thistype of measurement. To evaluate the results of theimage analysis determinations in the context of exist-ing methods, it was decided to compare them to waterretention data. Bullock and Thomasson (1979) havesummarized the advantages and disadvantages of bothmethods.
MATERIALS AND METHODSAn Oxisol near Exu in the Pernambuco state of north-
eastern Brazil was selected for study. Mean annual temper-ature in the area is about 24°C and mean annual precipi-tation is about 750 mm. The soil occurs on a nearly leveltableland called Chapada do Aripiri, at an elevation of 900m and developed in situ from underlying Cretaceous sand-stone. Some characteristics of this soil are presented in Table1. It has a sandy clay loam texture, a weakly developed finegranular structure and is easily crushed between the fingersto fine microaggregates of about 50 to 200 jtm, as sized underthe petrographic microscope. The soil is classified as aXanthic Haplustox, fine-loamy, kaolinitic, isohyperthermicin Soil Taxonomy (Soil Survey Staff, 1987).
Water content (6) at saturation (—0.1 kPa) was estimatedfrom bulk density measurements, assuming a particle den-sity of 2.65 M m"3. Water contents at matric potentials of-10, - 33, - 200, and — 1500 kPa were determined on pres-sure plate apparatus and, at matric potentials less than — 1500kPa, by equilibration above H2SO4 solutions of known con-centrations to control relative humidity (Weast, 1977-1978).
Vertical thin sections (8 by 11 cm) prepared from orientedsamples according to the method of Jongerius and Heintz-berger (1975) were used to study interaggregate porosity. Thesoil blocks had not been impregnated with a fluorescent dyeto enable the distinction of pores from translucent quartzparticles when viewed in transmitted light (Jongerius et al.,1972; Murphy et al., 1977) thus, the thin sections could notbe analyzed directly. Therefore, ten fields of view, chosen atrandom, were photographed from each of these thin sectionsat 52 X magnification under partially cross-polarized lighton a petrographic microscope. Skeleton grains were high-lighted on 8- by 12-cm photographic prints, where necessary,by painting their outline with white; this was done to ac-curately measure their areal coverage in the micrographs.
Video images were acquired from the micrographs with amonochrome RCA TC1005 camera with a plumbicon sen-sor. Measurements on pores were made by digital imageprocessing with a Kontron image analyzer (IBAS 2000 sys-tem, Carl Zeiss, Oberkpchen, West Germany). Skeletongrains and plasma were identified and the porosity was ob-tained by difference imaging. Interaggregate porosity wascalculated, on an areal percentage basis, as the differencebetween the total area of the field of view and the combinedarea of plasma and skeleton grains (s-matrix). The chordlengths intersected by pores for 20 chords per image weredetermined. The shortest chord retained as indicative of amacropore was 10-^m long.
In addition, the size distribution of skeleton grains wasalso determined by image analysis for comparison with thatobtained by sieving after dispersion by ultrasonification. Us-ing the measured nominal diameter (Wadell, 1935) of each
661

662 SOIL SCI. SOC. AM. J., VOL. 53, MAY-JUNE 1989
Table 1. Selected physical and chemical characteristics of the Oxisol studied.
Horizon
AlA2Bl62 1B22
Depth
cm0-12
12-2727-6060-9898-150
pH 3:2.5water
4.14.55.05.55.4
OrganicC
1.050.760.560.430.29
Sand, mm2.0-1.0
5.17.05.45.03.5
1.0-0.5
29.429.925.020.821.2
0.5-0.25
23.722.719.819.019.8
0.25-0.10
14.714.216.414.216.2
0.10-0.05
1.51.12.52.32.5
Totalsilt
34692
Claycoarse
78
141719
fine
1613111316
Bulkdensity
Mgnr3
1.391.461.391.451.47
CEC
cmolc kg~'8.36.35.44.03.2
grain and assuming each had a spherical shape and a densityof 2.65 Mg nr3, the weight of grains was calculated andtabulated into weight frequency classes with size intervalssimilar to those of the sieved sand data.
Micro-aggregates of about 50 to 100 jum of diameter, con-sisting of clay minerals, sesquioxides and organic matter,were hand-picked from the Al and B horizons under a dis-secting scope, and impregnated with Spurr's resin (Spurr,1969). These sections were cut into ultrathin sections (goldcolor under reflected light) with a diamond knife and studiedunder a Philips 300 transmission electron microscope (Phil-ips Corp., Eindhoven 5600 MD, The Netherlands) at anaccelerating voltage of 80 kV. The sections were observedat various magnifications and were photographed at 90 000 Xand 140 000 X. The size and shape of intra-aggregate poreswere measured directly from the negatives (8 by 10 cm) ofthe micrographs by image analysis; therefore, pores wereidentifiable as black objects. The shape was indexed as: 4irper area per perimeter2, also referred to as circularity or cir-cle shape factor (Schwarz, 1980). For a circle, this is = 1;for other shapes, it is <1.
RESULTS AND DISCUSSIONWater Retention and Soil Structure
Moisture characteristic curves for individual hori-zons were similar throughout the profile (Fig. 1A).Plant-available water (6,33kPa — 0-i50okPa) ranged from2 to 4%. At the permanent wilting point, the watercontent of the soil was still about 10%. Not until ma-tric potentials of —32 000 kPa were reached did theultramicroscopic pores lose most of their water. Usingthe method of Childs and Collis-George (1950), thefrequency distribution of pores was estimated fromthe water retention curve data (Fig. IB). A bimodaldistribution was obtained, with one mode correspond-ing to a pore radius around 40 jum and the other cen-tered around a radius of 60 nm. Compared to the Ha-waiian Oxisols studied by Tsuji et al. (1975) which arealso classified as kaolinitic at the family level, thisBrazilian Oxisol has a much lower frequency of intra-aggregate pores; its pore size distribution is consistentwith its lesser clay content and greater bulk density.
It has been suggested that the proportion of mi-cropeds increases with age of Oxisols (Beaudou andChatelin, 1979), and that micropeds are better devel-oped in more weathered materials and in soils occur-ring under ustic rather than udic moisture regimes(Buol and Eswaran, 1978). In Hawaii, however, thesoils data are not consistent with this last hypothesisand better structural development occurs in Oxisolsunder higher rainfall (Tsuji et al., 1975). Although theage of the Brazilian soil studied is great, its texturedoes not reflect extreme weathering, probably becauseof the high initial quartz content of its sandstone par-ent material. Our data are consistent with those fromHawaii in that the relatively low frequency of intra-
aggregate pores of the soil studied, which is a functionof its lesser structural development, reflects the usticmoisture regime.
PorosityDue to the high quantity of skeleton grains with
well-developed micro-aggregates of finer material thatdo not completely fill the interstitial spaces [i.e., theenaulic related distribution of coarse to fine constit-uents (Bullock et al., 1985)], the interaggregate poresformed a network of interconnected simple and com-pound packing voids (Fig. 2).
Because the interaggregate pores were intercon-nected, it was not possible to identify individual poresand therefore an exact size distribution for macro-pores could not be determined for comparison withthat obtained from water retention data. However, thedistribution of chord segments intersected by pores,assumed to be roughly equivalent to pore diameter, isshown in Fig. 3. The average chord length of poreswas 120 Mm in the Al and A2 horizons and 90 fim in
0.50 T
0.40'
0.30
0.20
0.10-
0.00
A1A2B22
g.•5
3-
2-
1
010"
-1O° -101 -102 -10* -10* -1matric potential, h (kPa)
r = 0.1489/h
ID- 10-2 10-3 10-
1/h (cm'1)10-s 10"6 10"
Fig. 1. (A) Volumetric water retention characteristic curves for threesoil horizons. (B) Pore frequency distribution calculated from thewater retention data for the Al horizon using the method of Childsand Collis-George (1950). h is the soil matric head smd/fr) dr isthe frequency.

BUI ET AL.: MICROSCOPIC AND ULTRAMICROSCOPIC POROSITY OF AN OXISOL 663
the B22 horizon. This differs from the average macro-pore diameter of 80 (im calculated from the moisturecharacteristic curve. It must be noted that distributionof chord segments intersected by pores is not normalbut skewed, however. The median chord length ofpores was 70 /mi in the Al, 67 /mi in the A2, and 50>m in the B22 horizon.
The estimated mean diameter of macropores ishighly dependent on water content data correspondingto matric potentials in the 0 to —10 kPa range. Nodata were available for that range (0 to —10 kPa) andit was assumed, on the basis of data presented bySharma and Uehara (1968) and Carneiro da Silva(1984), that rapid drop in water retention occurred ata matric potential of around -1 kPa. Considering theinterconnection between pores of various diametersas seen in Fig. 2, and the fact that the use of the cap-illary rise equation to calculate pore sizes is a simpli-fication, the agreement between the two methods issatisfactory.
Areal percentage measurements can be directly ex-tended to volume percent by the Delesse principle,i.e., areal percentage is an unbiased estimate of vol-ume percentage (Weibel, 1979). Interaggregate poros-ity obtained by image analysis ranged between 50 and23%, 60 and 23%, and 64 and 26% in the Al, A2, and
B22 horizons, respectively. On average, it was 40% inthe Al, 39% in the A2, and 37% in the B22 horizonand was in relatively good accord with macroporosi-ties calculated from volumetric water contents:(0Sat-0-i5oo kPa) was 38% for the Al, 35% for the A2,and 33% for the B22 horizon.
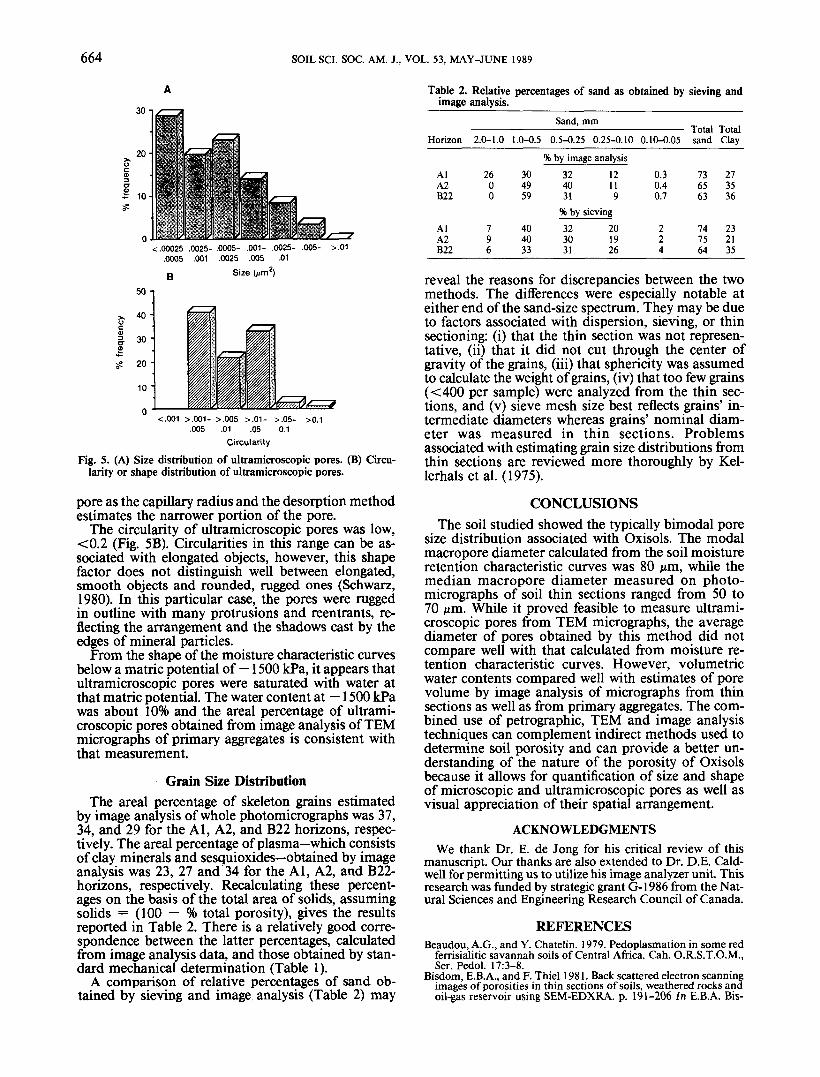
Ultramicroscopic pores were formed by the arrange-ment of clay-size kaolinite, halloysite and Fe- and Ti-bearing minerals (Fig. 4). Image analysis of the TEMmicrographs indicated that intra-aggregate pores oc-cupied 17 to 3% of the area or, on average, approxi-mately 9%. Their average area was 1250 nm2 (Fig. 5A),which corresponds to a diameter of 40 nm. This isthree times smaller than the diameter of 120 nm cal-culated from the moisture characteristic curve. It ap-pears that the range of ultramicroscopic pores ob-served in the micro-aggregates does not correspondwith the range of intra-aggregate pores obtained fromwater retention data. Even the largest ultramicro-scopic pore measured in the TEM micrographs wasonly 160 nm in diameter. There may be several rea-sons for this discrepancy. It is possible that the pri-mary aggregates used were not representative or thattoo few were studied. Hysteresis, inherent in the meth-ods used to determine water retention, is not takeninto account in the estimate of intra-aggregate porediameter. If pores with bottlenecks are present, theadsorption method estimates the wider portion of the
Fig. 2. Thin section micrographs showing interconnected simple andcompound packing voids (interaggregate pores) in partially cross-polarized light. The related distribution of coarse to fine constit-uents is enaulic, i.e, there is a skeleton of coarse grains with micro-aggregates of plasmic material that do not completely fill the in-terstitial spaces (Bullock et al, 1985). q = quartz, c = plasma, p— pore.
30 n
10- 25- 50- 100- 250- 500- >100025 50 100 250 500 1000
Chord width (^m)
Fig. 3. Distribution of chord segments intersected by pores in photo-micrographs of soil thin sections.
Fig. 4. High resolution transmission electron micrographs of pri-mary soil aggregates. The percent porosity in (A) is 9.5% whilethat in (B) is 5.4%. p = pore.
664 SOIL SCI. SOC. AM. J., VOL. 53, MAY-JUNE 1989
Table 2. Relative percentages of sand as obtained by sieving andimage analysis._____________ ___ __
Sand, mm
<.00025 .0025- .0005- .001- .0025- .005- >.01.0005 .001 .0025 .005 .01
Size (/im2)B50 -,
40 -
30 •
20 •
10 '
<.001 >,001- >.005 >.01- >.05-.005 .01 .05 0.1
Circularity
>0.1
Fig. 5. (A) Size distribution of ultramicroscopic pores. (B) Circu-larity or shape distribution of ultramicroscopic pores.
pore as the capillary radius and the desorption methodestimates the narrower portion of the pore.
The circularity of ultramicroscopic pores was low,<0.2 (Fig. 5B). Circularities in this range can be as-sociated with elongated objects, however, this shapefactor does not distinguish well between elongated,smooth objects and rounded, rugged ones (Schwarz,1980). In this particular case, the pores were ruggedin outline with many protrusions and reentrants, re-flecting the arrangement and the shadows cast by theedges of mineral particles.
From the shape of the moisture characteristic curvesbelow a matric potential of — 1500 kPa, it appears thatultramicroscopic pores were saturated with water atthat matric potential. The water content at — 1500 kPawas about 10% and the areal percentage of ultrami-croscopic pores obtained from image analysis of TEMmicrographs of primary aggregates is consistent withthat measurement.
Grain Size DistributionThe areal percentage of skeleton grains estimated
by image analysis of whole photomicrographs was 37,34, and 29 for the Al, A2, and B22 horizons, respec-tively. The areal percentage of plasma—which consistsof clay minerals and sesquioxides—obtained by imageanalysis was 23, 27 and 34 for the Al, A2, and B22-horizons, respectively. Recalculating these percent-ages on the basis of the total area of solids, assumingsolids = (100 — % total porosity), gives the resultsreported in Table 2. There is a relatively good corre-spondence between the latter percentages, calculatedfrom image analysis data, and those obtained by stan-dard mechanical determination (Table 1).
A comparison of relative percentages of sand ob-tained by sieving and image analysis (Table 2) may
——————— Total TotalHorizon 2.0-1.0 1.0-0.5 0.5-0.25 0.25-0.10 0.10-0.05 sand Clay
% by image analysisAlA2B22
AlA2B22
2600
796
304959
404033
324031
%by323031
12119
sieving201926
0.30.40.7
224
736563
747564
273536
232135
reveal the reasons for discrepancies between the twomethods. The differences were especially notable ateither end of the sand-size spectrum. They may be dueto factors associated with dispersion, sieving, or thinsectioning: (i) that the thin section was not represen-tative, (ii) that it did not cut through the center ofgravity of the grains, (iii) that sphericity was assumedto calculate the weight of grains, (iv) that too few grains(<400 per sample) were analyzed from the thin sec-tions, and (v) sieve mesh size best reflects grains' in-termediate diameters whereas grains' nominal diam-eter was measured in thin sections. Problemsassociated with estimating grain size distributions fromthin sections are reviewed more thoroughly by Kel-lerhalsetal. (1975).
CONCLUSIONSThe soil studied showed the typically bimodal pore
size distribution associated with Oxisols. The modalmacropore diameter calculated from the soil moistureretention characteristic curves was 80 pm, while themedian macropore diameter measured on photo-micrographs of soil thin sections ranged from 50 to70 nm. While it proved feasible to measure ultrami-croscopic pores from TEM micrographs, the averagediameter of pores obtained by this method did notcompare well with that calculated from moisture re-tention characteristic curves. However, volumetricwater contents compared well with estimates of porevolume by image analysis of micrographs from thinsections as well as from primary aggregates. The com-bined use of petrographic, TEM and image analysistechniques can complement indirect methods used todetermine soil porosity and can provide a better un-derstanding of the nature of the porosity of Oxisolsbecause it allows for quantification of size and shapeof microscopic and ultramicroscopic pores as well asvisual appreciation of their spatial arrangement.
ACKNOWLEDGMENTSWe thank Dr. E. de Jong for his critical review of this
manuscript. Our thanks are also extended to Dr. D.E. Cald-well for permitting us to utilize his image analyzer unit. Thisresearch was funded by strategic grant G-1986 from the Nat-ural Sciences and Engineering Research Council of Canada.

MESSING: ESTIMATION OF HYDRAULIC CONDUCTIVITY IN CLAY SOILS 665