microarray data analysis - a brief overview r group rongkun shen 2008-02-11
Post on 21-Dec-2015
214 views
TRANSCRIPT

Microarray Data Analysis - A Brief Overview
R Group
Rongkun Shen
2008-02-11
R
• R is an environment and a computer programming language
• R is free, open-source, and runs on UNIX/Linux, Windows and Mac
• R language has a powerful, easy-to-learn syntax with many built-in statistical functions
• R has excellent built-in help system• R has excellent graphing capabilities• R has many user-written packages, e.g. BioC

Affymetrix microarray data analysis-- a simple example
> library(gcrma)
> data.rma = justRMA()Background correcting
Normalizing
Calculating Expression
> head(exprs(data.rma) # view expression
> write.table(exprs(data.rma), file="data.rma.txt", sep='\t') # output to file
Overview
• Introduction to R and Bioconductor
• Affymetrix microarray preprocessing and quality assessment
• Differential expression
• Machine learning
• Gene set enrichment analysis

Intro to R
• Atomic data types:– Numeric – 1, -2, 3, 0.0034, 1.2e-10, etc– Character – ‘AbczyZ’, ‘256’, ‘y8e3.!$^*&’, etc– Complex – 1.2+3i– Logical – TRUE, FALSE

Intro to R – cont’d
• Data Structures– vector - arrays of the same type– list - can contain objects of different types– environment - hashtable– data.frame - table-like– factor - categorical– classes - arbitrary record type– function

Intro to R – cont’d
• Matrix – 2-D array
• Array – multi-D [vector is 1-D array]
• Subsetting– vector, list, matrix, array
• Packages – such as Bioconductor

Intro to R – cont’d
• Get help> ?plot> help.search(“wilcoxon”)
• Graph> plot(1:10)
• Write a function> x.sqr = function (x) { x*x }> x.sqr(2)[1] 4

Overview
• Introduction to R and Bioconductor
• Affymetrix microarray preprocessing and quality assessment
• Differential expression
• Machine learning
• Gene set enrichment analysis

Affymetrix Microarray Preprocessing and Quality Assessment
• Affymetrix Microarray Technology
• Quality Assessment and Quality Control
• Preprocessing– Background correction– Normalization– Summary

DNA microarrays

The experimental process involved in using a DNA microarray

Affy – cont’d
• How to check individual array quality?
– image plot

Affy – cont’d
• Histogram: examine probe intensity behavior between arrays
> affy.data <- ReadAffy()
> hist(affy.data)

Affy – cont’d
• Boxplot: identify differences in the level of raw probe-intensities
> boxplot(affy.data)

Affy – cont’d
• Background adjustment– RMA– gcRMA– MAS 5.0
• Normalization– RMA– gcRMA– vsn (Variance Stabilizing Normalization)

Affy – cont’d
• Summarization– RMA– gcRMA– expresso
• Which method is better? affycomp– http://affycomp.biostat.jhsph.edu/

Affymetrix microarray data analysis-- a gcRMA example
> library(affy)
> library(gcrma)
> affy.data = ReadAffy()
> data.gcrma = gcrma(affy.data)
> head(exprs(data.gcrma)) # view expression
> write.table (exprs(data.gcrma), file="data.gcrma.txt", sep='\t') # output to file

Affymetrix microarray data analysis-- a gcRMA example
Os2a-1.CEL Os2a-2.CEL Os2a-3.CELAFFX-BioB-3_at 8.544361 7.982488 7.948161AFFX-BioB-5_at 8.042751 7.604308 7.737132AFFX-BioB-M_at 8.573045 7.930235 7.999879AFFX-BioC-3_at 10.058982 9.579819 9.839091AFFX-BioC-5_at 9.798856 9.285265 9.418495AFFX-BioDn-3_at 12.626351 12.191611 12.418203

Overview
• Introduction to R and Bioconductor
• Affymetrix microarray preprocessing and quality assessment
• Differential expression
• Machine learning
• Gene set enrichment analysis

Differential Expression
• Goal – find statistically significant associations of biological conditions or phenotypes with gene expression
• Gene-by-gene approach
• Fold change vs. p-value
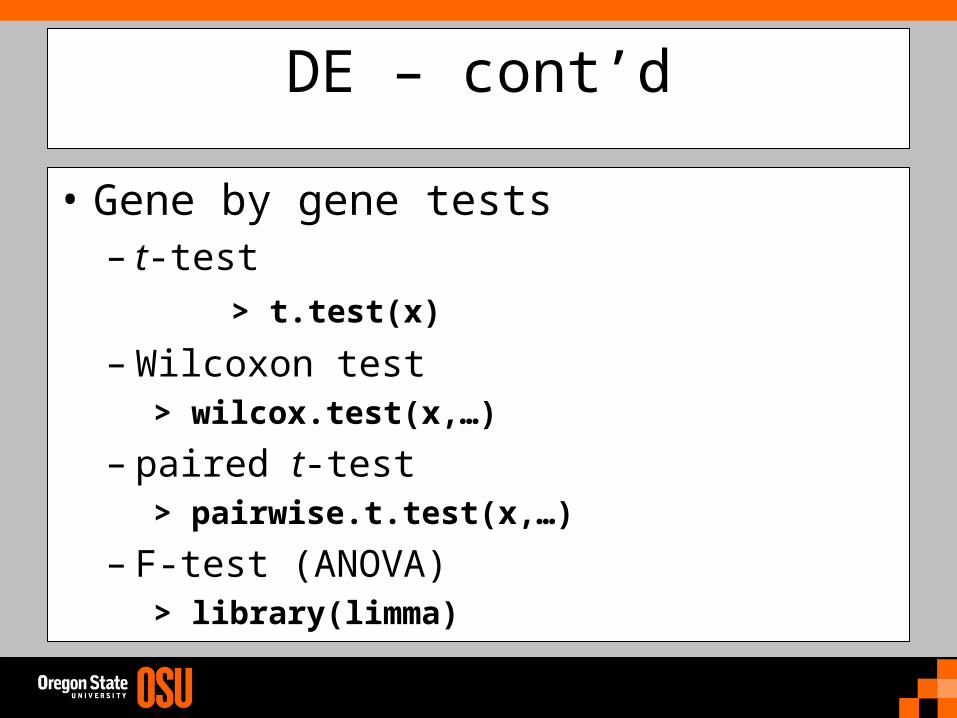
DE – cont’d
• Gene by gene tests– t-test
> t.test(x)
– Wilcoxon test> wilcox.test(x,…)
– paired t-test> pairwise.t.test(x,…)
– F-test (ANOVA) > library(limma)

• p-value adjustment/correction> ?p.adjust"holm", "hochberg", "hommel", "bonferroni", "BH", "BY", "fdr"
• FDR (false discovery rate):
• ROC curve analysis– TP rate vs. FP rate
DE – cont’d
FPEFP+TP

• Data reduction– Genes unexpressed should be filtered– Genes with unchanged expression levels
across conditions
• Top 5 genes?– Select according to p-values
DE – cont’d

Overview
• Introduction to R and Bioconductor
• Affymetrix microarray preprocessing and quality assessment
• Differential expression
• Machine learning
• Gene set enrichment analysis

Machine Learning
• Supervised Learning– classification
• Unsupervised Learning– clustering– class discovery

ML – cont’d
• Features: pick variables or attributes
• Distance: choose method to decide whether 2 samples are similar or different
• Model: how to cluster or classify– kNN, neural nets, hierarchical clustering,
HMM

ML – cont’d
• Get to know your data
• Measure the distance– Phenotype– Time course– Transcription factors

ML – cont’d
• Cross-validation
– Make use of all the data without bias– Leave-one-out CV

Overview
• Introduction to R and Bioconductor
• Affymetrix mciroarray preprocessing and quality assessment
• Differential expression
• Machine learning
• Gene set enrichment analysis

Gene Set Enrichment Analysis
• Which of 1000’s of probes are differentially expressed?
• Interested in genes in a pathway or other biological process?

GSEA cont’d
• Overall approach– Identify a priori biologically interesting sets
• KEGG or GO pathways
– Preprocessing and quality assessment as usual
– Non-specific filtering• Remove probes with no KEGG or GO annotations

GSEA cont’d
• Overall approach– Compute a test statistic (e.g., t-test) for each
probe
– Calculate the average of the test statistic (zk) in each set
– Compare to Normal distribution of zk across sets> qqnorm(z.k)

R/BioC Workshop
Fred Hutchinson Cancer Research CenterSeattle, WA
For more details, visit
http://www.bioconductor.org/workshops/2007

Sequencing vs. Microarray
Will sequencing replace microarray?

Acknowledgement
• Todd Mockler
• Robert Gentleman (Hutch)
• Martin Morgan (Hutch)
• Peter Dolan
• Brian Knaus
• Yi Cao (Hutch)