mhealth elisa system for point-of-care
TRANSCRIPT

University of South Florida University of South Florida
Scholar Commons Scholar Commons
Graduate Theses and Dissertations Graduate School
July 2019
mHealth ELISA System for Point-of-care mHealth ELISA System for Point-of-care
Arsenii Zhdanov University of South Florida, [email protected]
Follow this and additional works at: https://scholarcommons.usf.edu/etd
Part of the Biomedical Engineering and Bioengineering Commons
Scholar Commons Citation Scholar Commons Citation Zhdanov, Arsenii, "mHealth ELISA System for Point-of-care" (2019). Graduate Theses and Dissertations. https://scholarcommons.usf.edu/etd/8426
This Dissertation is brought to you for free and open access by the Graduate School at Scholar Commons. It has been accepted for inclusion in Graduate Theses and Dissertations by an authorized administrator of Scholar Commons. For more information, please contact [email protected].
mHealth ELISA System for Point-of-care
by
Arsenii Zhdanov
A dissertation submitted in partial fulfillment of the requirements for the degree of
Doctor of Philosophy in Biomedical Engineering Department of Medical Engineering
College of Engineering University of South Florida
Major Professor: Anna Pyayt, Ph.D. Rays Jiang, Ph.D.
Sylvia Thomas, Ph.D. Christopher Passaglia, Ph.D.
Yusuf Emirov, Ph.D.
Date of Approval: June 26, 2019
Keywords: Biomedical Testing, Image Processing, Instrumentation, Thermochromic Polymers, Incubators
Copyright © 2019, Arsenii Zhdanov

DEDICATION
To all the replicants working in off-world colonies

ACKNOWLEDGEMENTS
I want to thank the USF students who greatly assisted with this project. Jordan Keefe for
3D design. Luis Franco-Waite for coding. Crystal Schmitt and Joseph Tarriela for mold design.
Cassidy Chen, Tyler Tripp and Chase Miller for help with experimental design. Hao Wang for
help with setups. I want to thank professor Anna Pyayt for advising.

i
TABLE OF CONTENTS
LIST OF TABLES ......................................................................................................................... iii
LIST OF FIGURES ....................................................................................................................... iv
ABSTRACT .................................................................................................................................. vii
CHAPTER 1: INTRODUCTION ....................................................................................................1
CHAPTER 2: STATE OF THE ART ..............................................................................................3 2.1 Use of Mobile Phones in Healthcare .............................................................................3 2.2 Hardware Attachments to the Phones ............................................................................4 2.3 ELISA Samples Incubators ............................................................................................5 2.4 ELISA Testing Systems .................................................................................................5
CHAPTER 3: OPTICAL READOUT DESIGN ..............................................................................8 3.1 Characterization .............................................................................................................8
3.1.1 Red Dye Analysis .........................................................................................11 3.1.2 Green Dye Analysis ......................................................................................14 3.1.3 Blue Dye Analysis ........................................................................................15
3.2 Ambient Light Conditions Study .................................................................................18
CHAPTER 4: INCUBATOR DESIGN .........................................................................................20 4.1 Water Bath Incubator Design .......................................................................................20
4.1.1 Water Bath Analysis and Characterization ...................................................22 4.1.2 Single Well Analysis .....................................................................................25 4.1.3 Current Analysis ...........................................................................................25 4.1.4 Inter-well Variability ....................................................................................27
CHAPTER 5: OPERATION AND RESULTS ..............................................................................29 5.1 Operation......................................................................................................................30 5.2 Sample Preparation ......................................................................................................31 5.3 Experimental Procedure ...............................................................................................33 5.4 Data Analysis ...............................................................................................................35
CHAPTER 6: PDMS INCUBATOR .............................................................................................39 6.1 PDMS Incubator Design ..............................................................................................39 6.2 Prototyping ...................................................................................................................41 6.3 Characterization ...........................................................................................................42 6.4 Testing..........................................................................................................................44 6.5 Challenges and Failures ...............................................................................................51

ii
6.6 Incubator Consistency Test and Statistical Analysis ...................................................52
CHAPTER 7: THERMOCHROMIC PROPERTIES OF PDMS ..................................................71 7.1 System Design .............................................................................................................71 7.2 Composite Preparation and Characterization ...............................................................73 7.3 Self-erasing Thermal Writing ......................................................................................74 7.4 Visualization of Thermal Conductivity .......................................................................76 7.5 Visualization of Heat Capacity ....................................................................................77 7.6 Visualization of Fluid Temperature in Microfluidic Channels ....................................81 7.7 Thermochromic Incubator ...........................................................................................83
7.7.1 Fabrication ....................................................................................................83 7.7.2 Testing...........................................................................................................83
CHAPTER 8: FUTURE WORK ...................................................................................................85 8.1 Autonomous Sample Loading ......................................................................................85 8.2 Interface .......................................................................................................................87 8.3 Data Processing Algorithm ..........................................................................................87
CHAPTER 9: CONCLUSION ......................................................................................................89
REFERENCES ..............................................................................................................................91
APPENDIX A: ARDUINO CODE ...............................................................................................99
APPENDIX B: HEATER CIRCUIT DIAGRAM .......................................................................101
APPENDIX C: COPYRIGHT INFORMATION ........................................................................102

iii
LIST OF TABLES
Table 3.1 Sample concentrations ...................................................................................................10
Table 5.1 Progesterone calibration samples concentrations ..........................................................34
Table 5.2 Unknown progesterone samples calculated values ........................................................38
Table 6.1 Cortisol calibration samples concentrations ..................................................................46
Table 6.2 Control sample readout error (%) .................................................................................47
Table 6.3 Unknown cortisol samples calculated values ................................................................50
Table 6.4 Individual well average deviation (°C) .........................................................................54
Table 6.5 Average deviation of sample temperatures (°C) ...........................................................54
Table 6.6 Incubator #1 samples correlation (R2) ..........................................................................55
Table 6.7 Incubator #2 samples correlation (R2) ..........................................................................55
Table 6.8 Incubator #3 samples correlation (R2) ..........................................................................55

iv
LIST OF FIGURES
Figure 2.1 Schematic of microplate reader operation principle .......................................................6 Figure 2.2 Fisher Scientific™ accuSkan™ FC Filter-Based Microplate Photometer
(microplate reader) .........................................................................................................7 Figure 3.1 Optical readout prototype ...............................................................................................9
Figure 3.2 Red, green and blue dye solutions used for analysis ......................................................9
Figure 3.3 Plate reader absorption measurement of red dye concentrations .................................12
Figure 3.4 RGB components of red dye concentrations ................................................................13
Figure 3.5 Plate reader absorption measurement of green dye concentrations .............................14
Figure 3.6 RGB components of green dye concentrations ............................................................15
Figure 3.7 Plate reader absorption measurement of blue dye concentrations ................................16
Figure 3.8 RGB components of blue dye concentrations ..............................................................17
Figure 3.9 Yellow dye solution used for analysis of ambient light condition effect on the readings. .......................................................................................................................19
Figure 4.1 3D render of the water bath ..........................................................................................21
Figure 4.2 Thermal characteristics of the water bath .....................................................................23
Figure 4.3 Infrared and real images of the water bath in operation ...............................................24
Figure 4.4 Single well thermal map shows that temperature fluctuates just 0.2°C within a 2mm diameter from the sample center .........................................................................26
Figure 4.5 Incubator tuning curves ................................................................................................28
Figure 5.1 3D model of the complete system (artistic rendering) .................................................31
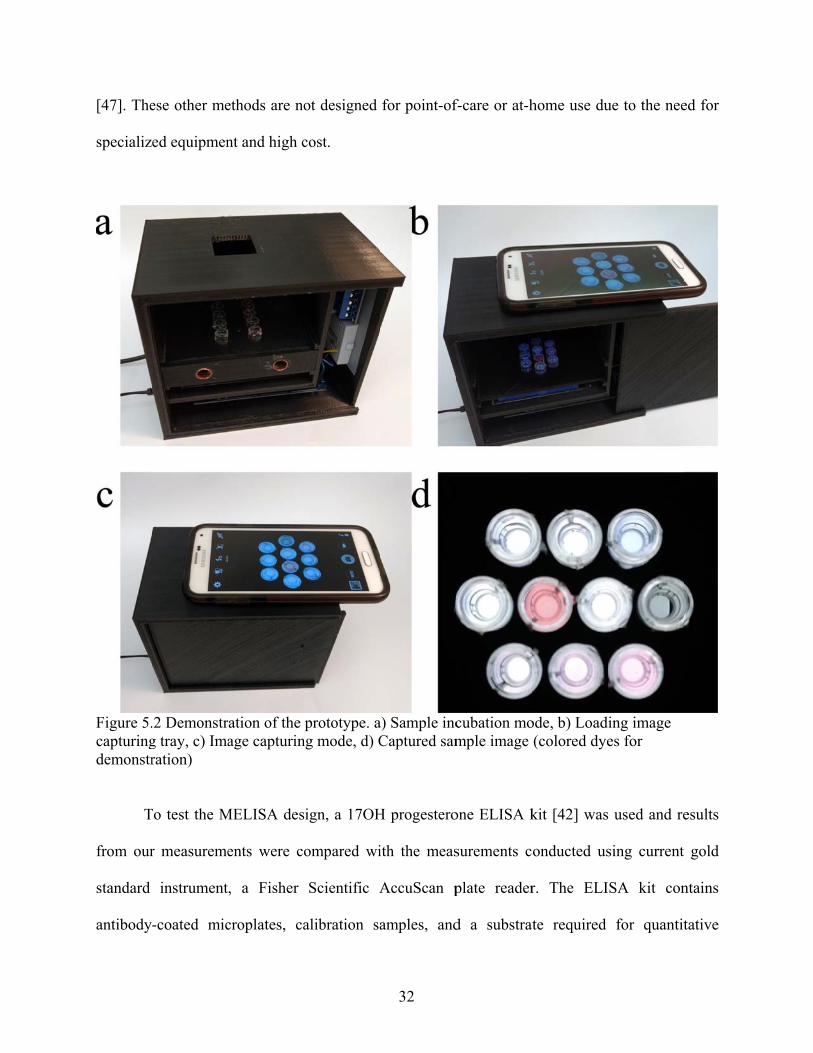
Figure 5.2 Demonstration of the prototype ....................................................................................32
Figure 5.3 Progesterone ELISA samples image ............................................................................34

v
Figure 5.4 Plate reader progesterone concentration calibration curve ...........................................37
Figure 5.5 MELISA (prototype) progesterone concentration calibration curve ............................38
Figure 6.1 Proposed PDMS heater design .....................................................................................40
Figure 6.2 Heater fabrication .........................................................................................................42
Figure 6.3 PDMS incubator testing ...............................................................................................44
Figure 6.4 Standard and PDMS heater cortisol ELISA calibration curves and control samples measured by the plate reader ..........................................................................46
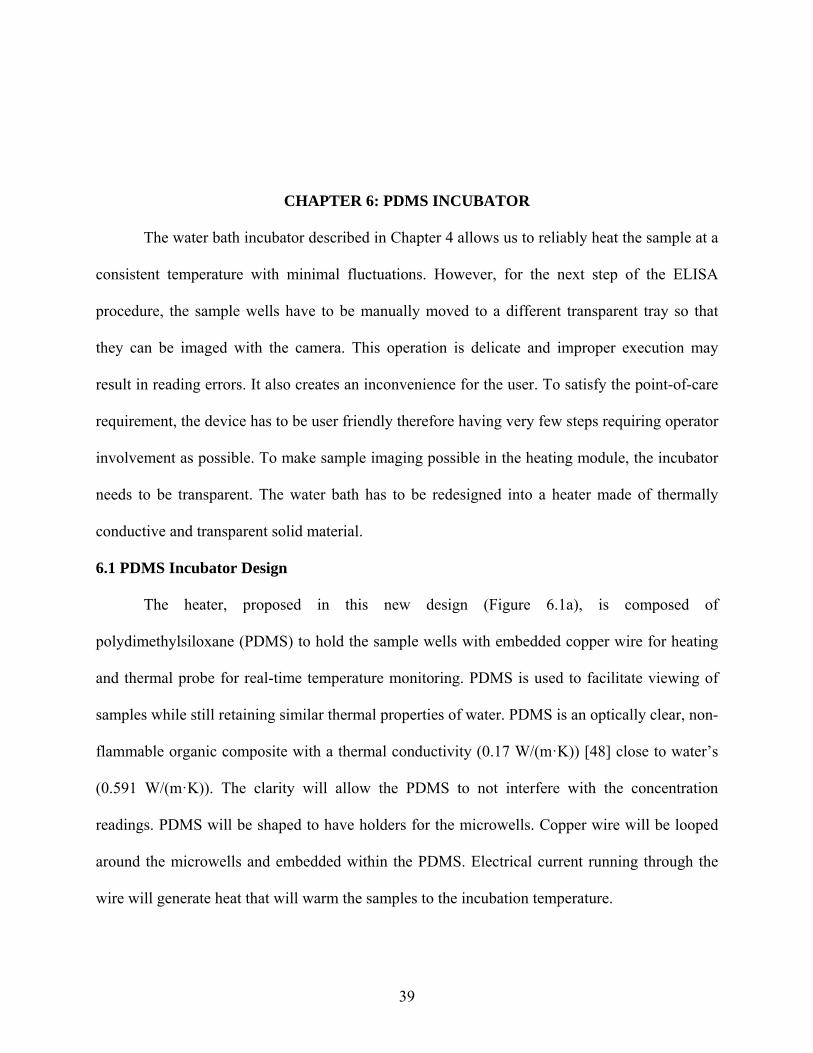
Figure 6.5 Standard and PDMS heater cortisol ELISA calibration curves and control samples measured by optical readout ..........................................................................47
Figure 6.6 Plate reader cortisol concentration calibration curve ...................................................49
Figure 6.7 MELISA cortisol concentration calibration curve .......................................................50
Figure 6.8 Failed prototypes ..........................................................................................................53
Figure 6.9 Incubator #1 ..................................................................................................................56
Figure 6.10 Incubator #1, test 1 .....................................................................................................56
Figure 6.11 Incubator #1, test 2 .....................................................................................................57
Figure 6.12 Incubator #1, test 3 .....................................................................................................58
Figure 6.13 Incubator #1, test 4 .....................................................................................................59
Figure 6.14 Incubator #1, test 5 .....................................................................................................60
Figure 6.15 Incubator #2 ................................................................................................................60
Figure 6.16 Incubator #2, test 1 .....................................................................................................61
Figure 6.17 Incubator #2, test 2 .....................................................................................................62
Figure 6.18 Incubator #2, test 3 .....................................................................................................63
Figure 6.19 Incubator #2, test 4 .....................................................................................................64
Figure 6.20 Incubator #2, test 5 .....................................................................................................65
Figure 6.21 Incubator #3 ................................................................................................................65
Figure 6.22 Incubator #3, test 1 .....................................................................................................66

vi
Figure 6.23 Incubator #3, test 2 .....................................................................................................67
Figure 6.24 Incubator #3, test 3 .....................................................................................................68
Figure 6.25 Incubator #3, test 4 .....................................................................................................69
Figure 6.26 Incubator #3, test 5 .....................................................................................................70
Figure 7.1 Experimental setup (side door opened) ........................................................................72
Figure 7.2 Calibration curve relating R, G and B color components of heated PDMS to its temperature ..................................................................................................................74
Figure 7.3 Demonstration of thermo-chromatic properties of pigmented PDMS .........................75
Figure 7.4 Temperature exchange in contact with high thermal conductivity material ................77
Figure 7.5 a) Heat map showing PDMS cooling rate for different thickness of glass b) Experimental setup, 1mm and 3mm glass slides on a PDMS chip ..............................79
Figure 7.6 Simulated (lines) and experimental (dots) cooling rate for 1mm, 2mm and 3mm glass slides ..........................................................................................................80
Figure 7.7 Pigmented microfluidic PDMS chip ............................................................................82
Figure 7.8 Thermochromic PDMS incubator ................................................................................84
Figure 8.1 Proposed sample dispenser (artistic rendering) ............................................................86

vii
ABSTRACT
Enzyme-linked immunosorbent assay (ELISA) is one of the most important technologies
for biochemical analysis critical for diagnosis and monitoring of many diseases. Traditional
systems for ELISA incubation and reading are expensive and bulky, thus cannot be used at point-
of-care or in the field. Here, we design and demonstrate a new miniature mobile phone based
system for ELISA. This mHealth system can be used to complete all steps of the assay, including
incubation and reading. It can be fabricated at low cost, portable, and can transfer test results via
mobile phone. We have designed the sample dispensing system, incubation chamber, imaging
enclosure, and data processing algorithm. We demonstrate how mobile ELISA can be calibrated
for accurate measurements of progesterone and show successful measurements with the
calibrated system. We show that the results acquired with our prototype match the gold standard
plate reader within 10%. The results satisfy the point-of-care requirements and can be
implemented in clinical trials.
1
CHAPTER 1: INTRODUCTION
ELISA is a diagnostic testing system that uses antibodies and color change to measure
concentration of a protein. It uses chromogenic agents to translate protein concentration into
color change. Since its introduction in 1970s it gained a wide spread of applications including
allergen detection [1], celiac disease [2], HIV test [3], and other diseases. ELISA’s specificity
allows measuring a specific target protein concentration that helps detecting various biomarkers
such as breast cancer [4]. Traditional ELISA procedure consists of the following steps. First, the
bodily fluid sample (blood, serum, plasma, saliva) is loaded into a microwell with pre-coated
antibodies specific to the target protein. Then the sample incubates so that the target protein can
bind to the antibodies. After incubation, the microwells are washed leaving only the target
protein bound with the antibodies that are coated on the inner wall of the microwell. Then the
chromogenic agent is being added to the wells to create a change in color depending on the
amount of bound antibodies. This change of color is then being analyzed by a plate reader that
compares the color of test samples to the calibration curve. This procedure has many challenges
to a user. It requires use of specific and expensive lab equipment and training that makes it
impossible for at home use. Moreover, the plate readers fit the calibration data points with an s-
curve. It makes them rely on a large amount of calibration samples, further increasing the
running cost of a single test.
Currently, the standard of care platform for conducting a wide variety of tests is ELISA,
which is an expensive and complex procedure. It would be immensely beneficial for patients if
ELISA was translated to a mobile platform. However, up to date, most of the research was
2
focused on using a phone camera as a read-out, while there is no complete system that allows
conducting all of the steps of the ELISA protocol [5, 6]. Here, I demonstrate a complete low cost
mobile phone based system allowing execution of all of the ELISA steps without any additional
equipment and demonstrate its successful application to hormone measurements because there
are not many systems focusing on important topics such as measurement of hormone levels.
Studies related to point-of-care hormone measurement are very limited and mostly focus on
cortisol detection [7]. I describe a new mobile phone based device that simplifies and reduces the
cost of current ELISA procedures, and demonstrate measurement of progesterone in whole blood
samples. I characterize new thermochromic material and design a polymer incubator with visual
feedback. Finally I propose further development of the technology on its way to the clinical
trials.

3
CHAPTER 2: STATE OF THE ART
2.1 Use of Mobile Phones in Healthcare
In recent years, mobile phones have become a popular platform for developing point-of-
care testing systems. The term mHealth has been adopted by the World Health Organization to
cover medical services and practices that utilize mobile phones or other portable electronics. In
its early days, mobile phones were assisting with managing Electronic Health Records (EHRs)
and Personal Health Records (PHRs) [8]. These systems allowed doctors access patients’
medical history faster and manage high volumes of data more effectively. Formerly developed
telemedicine and e-health systems were easily incorporated into mHealth [9]. Additionally,
mobile phones were started to be use for collecting and sending images to health practitioners for
faster diagnostics [10, 11]. Mobile phones were quickly becoming multimedia devices, they were
able to capture and transmit sound and video. This was used in healthcare for remote health
monitoring [12]. As the cost of smartphones phones was going down, their wide availability lead
to improving quality of patient care and changing the face of healthcare delivery as a whole [13].
The dominance of smartphones on the PDAs market lead to a large number of developers
producing apps that can help end users to monitor their health [14]. For example, pregnancy
complication monitoring can be done on a mobile phone [15, 16]. Stroke patients can now
monitor their blood pressure with a mobile phone application [17]. Other applications are
currently being developed for diabetic patients [18], weight control [19], patients with sickle cell
disease [20], etc. Additionally, mobile platforms can be used for HIV prevention, care, and
treatment [21].

4
A new step in developing mHealth technologies is the introduction of wearable devices.
Small wearable contact or non-contact sensors collect user’s vitals and using wire or wirelessly
with Bluetooth or Wi-Fi transfers the data to the smartphone to be stored and analyzed. The
collected data can range from sleep patterns, heartrate, steps, blood oxygenation levels and others
[22, 23]. Wearable devices come in all sorts of shapes: wristbands, rings, socks, watches, patches
etc. In cooperation with smartphones these wearables help patients with sleep apnea [24], kidney
failure [25], neurodegenerative diseases such as Alzheimer’s and Parkinson’s [26, 27], diabetes
and others. However, the major challenge of wearable devices is the accuracy of readout and
possibility of improper wearing.
2.2 Hardware Attachments to the Phones
Mobile phones are already widely available across the globe, including low and middle-
income countries. Contemporary cellphones have a number of built-in sensors including:
cameras, light-sensors, microphones, etc. Availability of the aforementioned sensors integrated
into a convenient mobile platform has enabled a number of mobile phone based diagnostic
systems.
There have been a number of projects involving custom made hardware attachments to
mobile phones to solve various problems. Most frequently, mobile phone’s camera is used to
acquire the data and its processing power is utilized to perform analysis. Mobile phones have
been used in microscopy [28-31], detection of heavy metals [32] and dipstick analysis [16].
Wireless connectivity coupled with large amount of sensory and calculation power on board a
modern smartphone make it a perfect platform for mHealth applications. We propose a 3D
printed mobile phone attachment that contains all the hardware required to perform the ELISA
test and interfaced with the mobile phone for data analysis.

5
2.3 ELISA Samples Incubators
To acquire colorimetric data, ELISA samples have to be properly incubated to allow the
target protein conjugate with a specific preset antibody. Depending on the target protein,
incubation may require between room temperature and 37°C. Commercially available ELISA
kits mostly come in form of microwells, therefore any microwell incubator is compatible with
ELISA. The incubators have internal heating elements that provide uniform and consistent
heating.
To reduce incubation time and increase the throughput of the ELISA testing, alternative
methods of incubation, such as shaking [33, 34], have been proposed. However, it was only
proven effective for protein samples with 1:100 concentrations at most, when most vital human
hormones are in the 1:1000000 range. Additionally, the equipment used for shaking is
cumbersome, convoluted and not user friendly. This project is aimed at increasing user-
friendliness of ELSA and proposes creation of an incubator that would be compatible with the
smartphone based mHealth system.
2.4 ELISA Testing Systems
ELISA measuring techniques are widely used in diagnostic laboratories. These
laboratories are equipped with a variety of high-throughput equipment that allows them to
perform all steps of the testing and run a large number of samples simultaneously. Among
traditional equipment to perform ELISA steps, such as pipettes and incubators, they use special
microplate readers. Microplate readers measure light intensity of a beam that had passed the
sample to detect biochemical reactions. They have a light source, an array of filters and
photodetectors to measure the sample absorption as a ratio between light intensity of a beam that
passed the sample and default source value (Figure 2.1) [35]. Operators use calibration samples

6
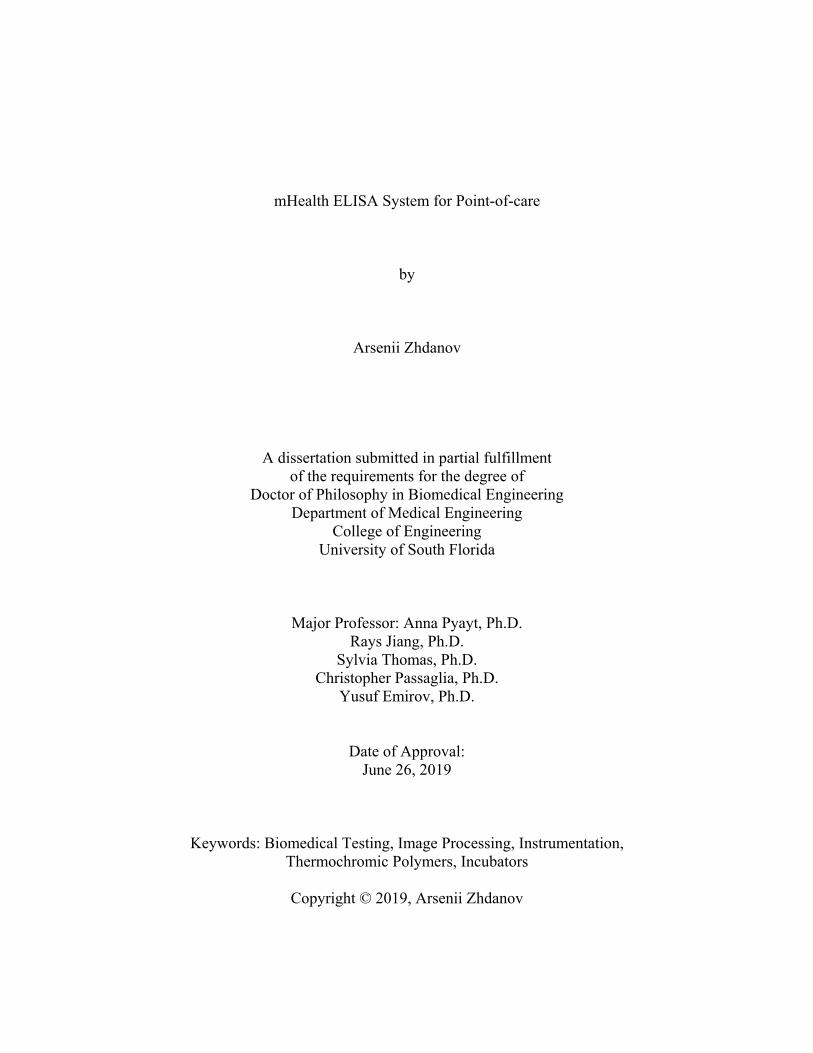
to build a curve corresponding absorption to target values. A traditional Fisher Scientific™
accuSkan™ FC Filter-Based Microplate Photometer will be used as gold standard for this study
(Figure 2.2). This plate reader operates on three wavelengths: 405nm, 450nm and 620nm.
Figure 2.1 Schematic of microplate reader operation principle
Figure 2.reader).
.2 Fisher Sciientific™ accuSkan™ FC
7
C Filter-Bassed Microplaate Photomet
ter (microplate

8
CHAPTER 3: OPTICAL READOUT DESIGN
Previous studies have already demonstrated benefits of using mobile phone cameras for
optical readout of biological assays [5, 6, 16]. Phone cameras are convenient to use, widely
available and accurate enough for reliable measurements. However, systems that rely on mobile
phone imaging require controlled light environment [36]. Any fluctuations in light conditions
throughout the measurement will lead to inevitable readout errors. To create the controlled light
environment, the samples will be enclosed in an opaque container. The mobile phone will be
situated on top of the container with the camera facing the samples through an opening. To
prevent possible reflections, glares and other noise causes, the samples will be illuminated by a
backlight source, such as an LED array (Figure 3.1).
3.1 Characterization
In order to demonstrate accuracy and reproducibility of the optical readout we performed
a number of experiments comparing our system performance with the gold standard ELISA plate
reader. We have used different colored dye solutions with different concentrations for the
evaluation. Standard red, green and blue dyes were diluted with a ½ ratio exponential decay.
Each succeeding dilution was mixed with water at 50/50 proportion. Red, green and blue dyes
concentrations are shown in Table 3.1. Additional blank sample (water) was added as a baseline.

Figure 3.the LED
Figure 3.
.1 Optical rearray light s
.2 Red, green
eadout prototsource at the
n and blue d
type. The same bottom and
dye solutions
9
mples are lod the mobile
s used for an
ocated in an ephone came
nalysis
enclosed comera on the top
mpartment wp.
with

10
Table 3.1 Sample concentrations Sample Concentration (fraction) Concentration (decimal)
1 1/2 0.5
2 1/4 0.25
3 1/8 0.125
4 1/16 0.0625
5 1/32 0.03125
6 1/64 0.015625
7 1/128 0.0078125
8 1/256 0.00390625
9 1/512 0.001953125
10 1/1024 0.000976563
11 1/2048 0.000488281
12 1/4096 0.000244141
13 1/8192 0.00012207
14 1/16384 6.10352E-05
15 1/32768 3.05176E-05
16 0 (blank) 0 (blank)
11
Dye concentrations were loaded into the sample holder and imaged with the cellphone
(Figure 3.2). The results will be compared with the plate reader. Plate reader used in this study
has a set of three optical filters: 405nm, 450nm and 620nm. This gives the plate reader three
channels with different color sensitivity to analyze any color in the visible range. Similarly, the
mobile phone camera CCD matrix consists of photo elements sensitive to red, green and blue
colors to create the RGB color space. To demonstrate that the proposed system is capable of
differentiating colors as accurately as the standard plate reader, we have analyzed three basic
colors solutions separately.
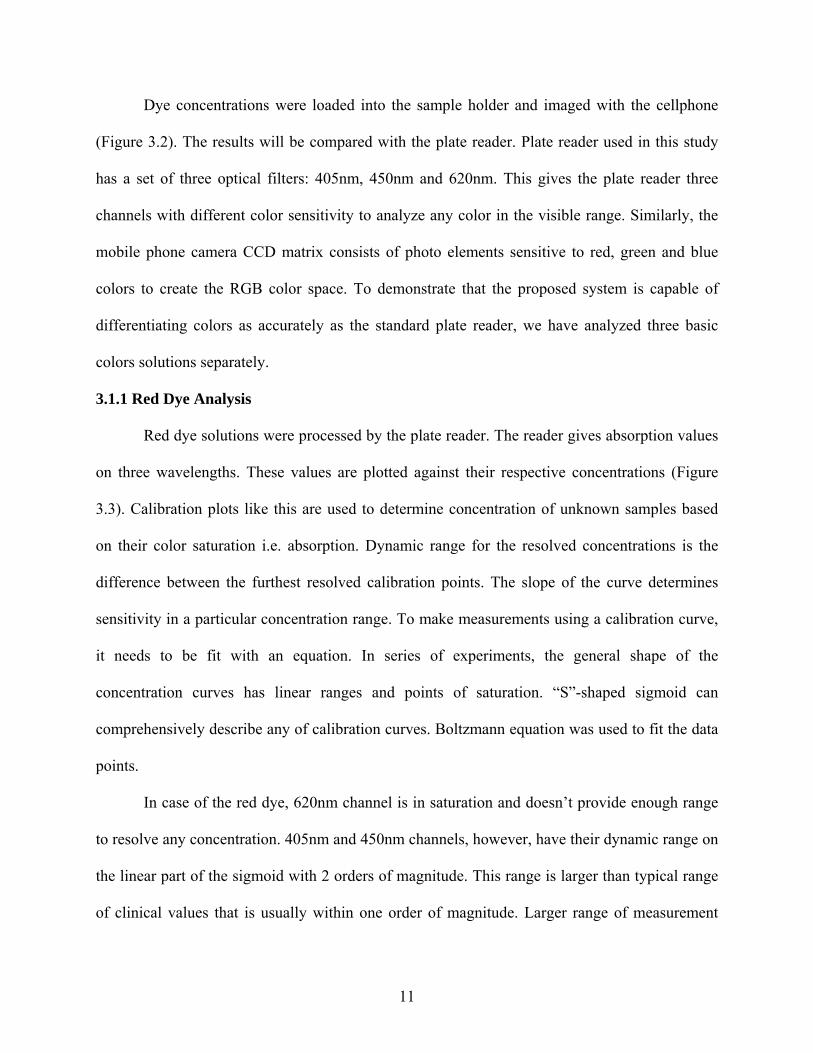
3.1.1 Red Dye Analysis
Red dye solutions were processed by the plate reader. The reader gives absorption values
on three wavelengths. These values are plotted against their respective concentrations (Figure
3.3). Calibration plots like this are used to determine concentration of unknown samples based
on their color saturation i.e. absorption. Dynamic range for the resolved concentrations is the
difference between the furthest resolved calibration points. The slope of the curve determines
sensitivity in a particular concentration range. To make measurements using a calibration curve,
it needs to be fit with an equation. In series of experiments, the general shape of the
concentration curves has linear ranges and points of saturation. “S”-shaped sigmoid can
comprehensively describe any of calibration curves. Boltzmann equation was used to fit the data
points.
In case of the red dye, 620nm channel is in saturation and doesn’t provide enough range
to resolve any concentration. 405nm and 450nm channels, however, have their dynamic range on
the linear part of the sigmoid with 2 orders of magnitude. This range is larger than typical range
of clinical values that is usually within one order of magnitude. Larger range of measurement
12
increases fitting error. Maximum error for this range is shown in Table 3.2. When studying
clinical samples, the fitting range will be reduced for a more accurate fit.
The same set of solutions is then images with the optical readout prototype. The acquired
digital image is comprised of pixels with each pixel having color values in three channels – red,
green and blue. The digital processor in the camera encodes values of each pixel channel value
using 24 bits. This gives 256 possible values for each channel. The color of each pixel is encoded
as a set of three values – one for each channel.
Figure 3.3 Plate reader absorption measurement of red dye concentrations

13
After extracting RGB values from the images and plotting them against respective
concentrations (Figure 3.4), we can analyze R, G and B channels separately. For red dye, R
component doesn’t have enough range to measure any concentration. G channel has a linear area
from 0.017 to 0.5 that gives a dynamic range of 1.5 orders of magnitude. B channel has a sharper
slope on that area that gives higher sensitivity. B channel has the least error in this range and can
be used for measuring unknown samples concentration.
Figure 3.4 RGB components of red dye concentrations
14
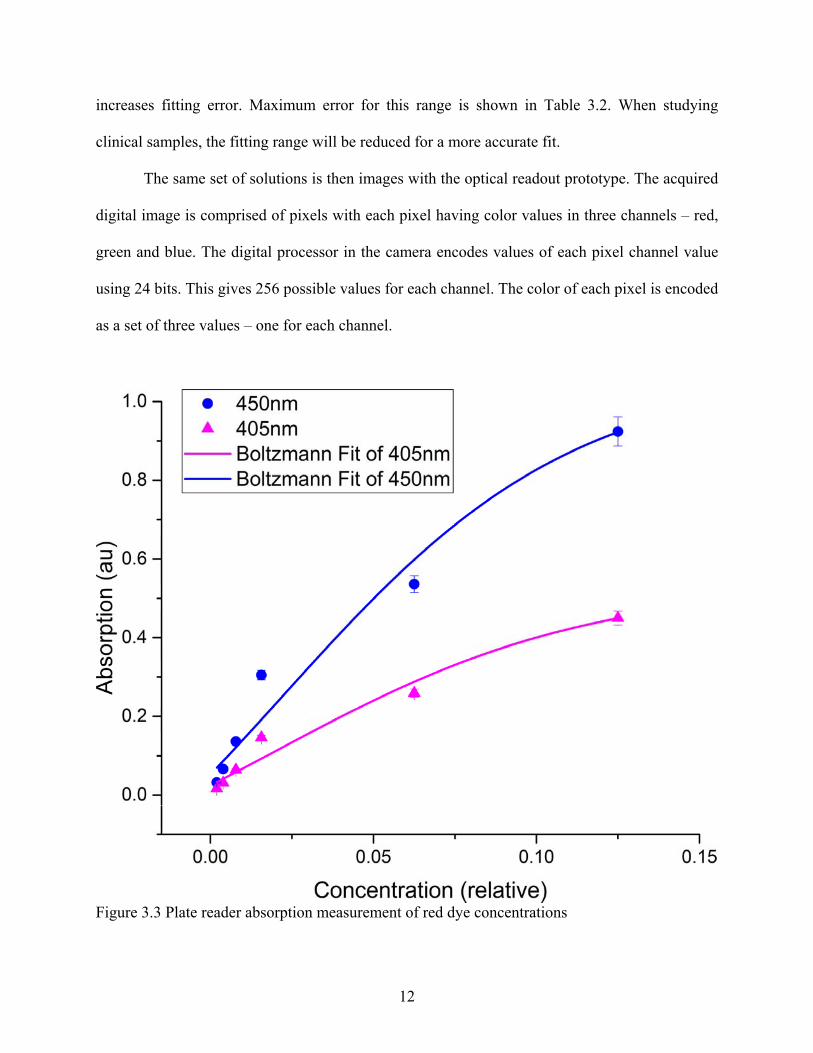
3.1.2 Green Dye Analysis
The green dye solutions were processed with the plate reader in a similar manner, as
mentioned above. Figure 3.5 shows absorption on three channels against concertation.
Absorption on all three channels goes into saturation at 0.02 and the lowest resolved
concentration is 0.004. That gives a dynamic range of 2 orders of magnitude. 620nm and 450nm
channel have the best fit in this range.
Figure 3.5 Plate reader absorption measurement of green dye concentrations
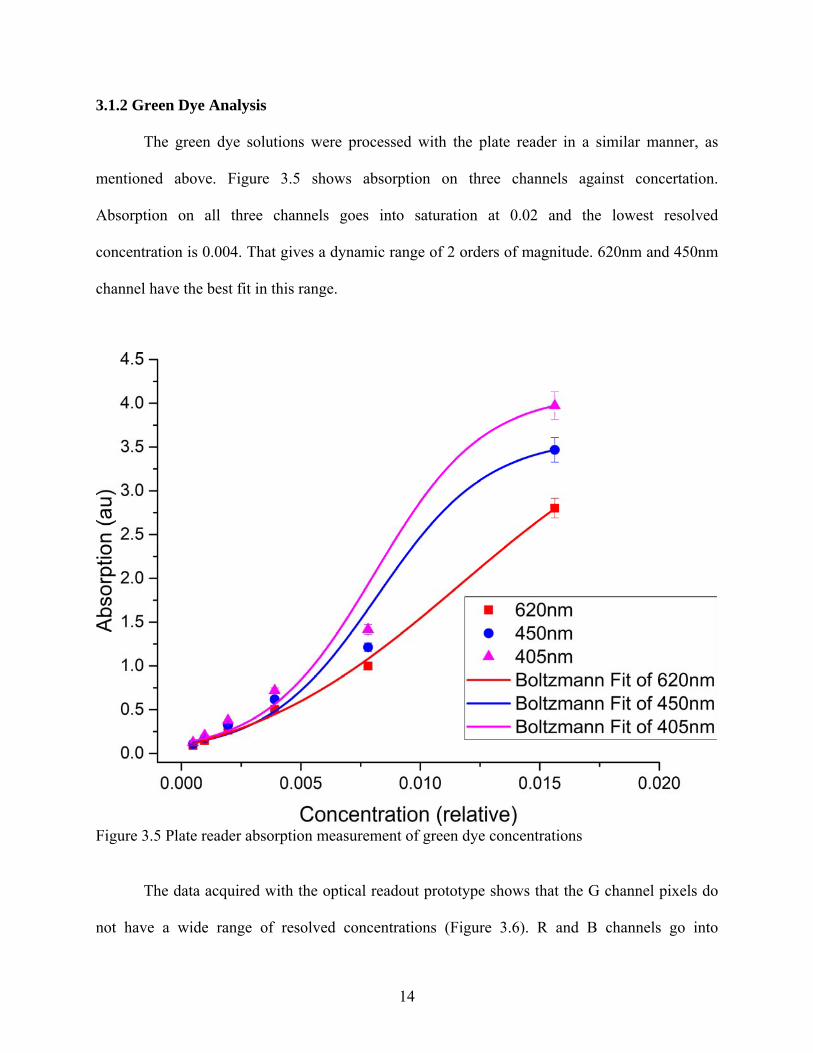
The data acquired with the optical readout prototype shows that the G channel pixels do
not have a wide range of resolved concentrations (Figure 3.6). R and B channels go into
15
saturation on 0.02 concentration, but show higher sensitivity on lower concentrations for a 2
orders of magnitude range. The error for R and B channels does not exceed 6% that allows using
either of these channels for measurement of unknown samples.
Figure 3.6 RGB components of green dye concentrations
3.1.3 Blue Dye Analysis
The plate reader data for the blue dye (Figure 3.7) shows that absorption in the 450nm
channel has a larger range than in other channels – 2 orders of magnitude. However, with the
larger range comes larger fit error. 620nm channel goes into saturation at lower concentration,

16
but has higher sensitivity in lower range. 405nm channel has a medium range, goes into
saturation at lower concentrations and cannot be used for accurate measurements.
Figure 3.8 shows the results of image processing after testing the blue samples with the
optical readout prototype. B channel is in saturation and does not provide data for measurements.
G channels shows a higher dynamic range comparing to the R channel, but reduced sensitivity. G
channel can be used for measurements in higher range, however at lower concentrations, R
channel provides superior sensitivity.
Figure 3.7 Plate reader absorption measurement of blue dye concentrations

17
Figure 3.8 RGB components of blue dye concentrations.
To sum up, the optical readout prototype shows equal or higher sensitivity and dynamic
range than a traditional plate reader. Optical readout allows us to measure concentration values
in any color solution. Green color analysis provides much larger dynamic range and sensitivity
hat the plate reader. Using mobile phone camera allows combining measurements in separate R,
G and B channels for different concentration ranges. Using channels with higher sensitivity in
specific ranges lowers the detection limit. An optical readout prototype shows significantly lower
error for the same data range comparing to the plate reader. Selecting a specific range of values
relevant for a particular experiment also reduces the readout error.

18
3.2 Ambient Light Conditions Study
To demonstrate that the optical readout prototype is immune to the fluctuations in
ambient light conditions we have tested it in various light conditions, such as with lights on and
with lights off. We have chosen yellow dye for this test as one of the most common ELISA test
colors [37]. The dye was diluted as described earlier in Chapter 3.1. Concentration values are
shown it Table 3.1. The solutions were loaded into the readout prototype (Figure 3.1) and imaged
multiple times with changing ambient light conditions. We have imaged the samples 5 times in a
well-lit room, then switched the lights off and imaged 5 more times. Processing the images will
show the natural noise level of the system as well as describe the ambient light conditions effect
on the measurements.
Figure 3.9 shows one of the acquired images. RGB components values for every well
were extracted from all the images to measure standard deviation. For a set of experiments with
lights on, average standard deviation was 0.08. For the same experiment with lights off, standard
deviation value was 0.11. That demonstrates minimal influence of external light conditions on
the readout values. Maximum deviation value for all the images was 1.12. That gives a
maximum error of 1 integer for the readout. Such a low noise level means that the maximum
error for 24 bit color processing is 0.4%.

19
Figure 3.9 Yellow dye solution used for analysis of ambient light condition effect on the readings.

20
CHAPTER 4: INCUBATOR DESIGN
Most hardware involved steps of ELISA are sample incubation, and optical readout.
Incubation is required to bind targeted protein with precoated antibodies in the test microwell. It
has to be performed at a steady temperature for a specific time. Incubation time and temperature
varies for different proteins. For this research, I have chosen to develop the system for
progesterone, one of the hormones vital to female reproductive health. Progesterone regulates a
number of critical physiological processes, affecting blood pressure and the cardiovascular
system in general [38]. In addition, progesterone significantly influences the ability to conceive
and has a major impact on pregnancy overall [39, 40]. Progesterone has a big role in maintaining
a healthy immune system and determines the development of neoplastic diseases [41]. The
system designed for progesterone can be easily adjusted to measure a different protein.
4.1 Water Bath Incubator Design
The first major step of progesterone ELISA is antibody conjugation with the target
protein at 37°C. The microwells have to be heated uniformly to prevent inconsistencies in
binding and errors in measurements. For the first prototype incubator, we have designed a water
bath (Figure 4.1). It consists of an enclosure, lid with sample microwell holders, two copper
tubes integrated with heating elements, and a waterproof temperature probe for continuous
temperature monitoring. The enclosure and the lid were designed using CAD software and 3D
printed.

21
Figure 4.1 3D render of the water bath. (1) water bath enclosure, (2) copper heater, (3) temperature sensor, (4) water bath lid, (5) sample microwell
The top view of the whole water bath heater in operation is shown in Figure 4.2a, b. The
thermal image (Figure 4.2a), taken with an FLIR camera, demonstrates that the temperature is
the highest around the heaters, but is rather uniform between the heaters. A cross-sectional
COMSOL simulation of the heating system is shown in Figure 4.2c, demonstrating the uniform
heat propagation across the water layer. The ELISA microwells are placed in two rows alongside
the heaters to ensure identical thermal treatment of all the samples. Since most ELISA reactions
take place at 37°C, accurate control of the heaters is necessary to maintain this temperature. The
heaters are controlled through solid state relays by an Arduino Mega 2560 microcontroller. The
code for the microcontroller can be seen in Appendix A. When the temperature probe reads less

22
than 37°C, the relays are enabled, which powers the heating elements. When the temperature is
greater than 37°C, the relay closes, switching the heaters off. The ELISA microwells are placed
in holders, with their outside surfaces contacting the warm water in order to provide the
temperature necessary for the conjugation reactions to occur. The water bath and the slower heat
dissipation through the copper tubes help to prevent larger temperature fluctuations in the ELISA
microwells. As shown in Figure 4.2d, the water bath requires 5 minutes to reach the set point of
37°C from ambient conditions. After reaching the set point, the temperature fluctuates within
±0.8°C for the duration of incubation (60 minutes). This precision is sufficient for reproducible
ELISA measurements [42].
4.1.1 Water Bath Analysis and Characterization
One of the essential parts of the device is the incubator that provides suitable conditions
for the antibody binding. Temperature inconsistencies in the incubator may result in binding
corruption and protein deterioration that will lead to inaccurate readings. To test the consistency
of the incubator sample heating, we have conducted a set of experiments monitoring temperature
distribution in microwells filled with water. We have dispensed 200µl of water into each
microwell and arranged them alongside the heaters. The incubator was then filled with water.
After we turned the power on, the incubator started warming up and the microcontroller started
monitoring and recording the temperature using a thermal probe located between the heaters.
Temperature control is performed by a microcontroller that measures temperature through the
thermal probe, compares in with a preset value and activates or deactivates the heating relay.
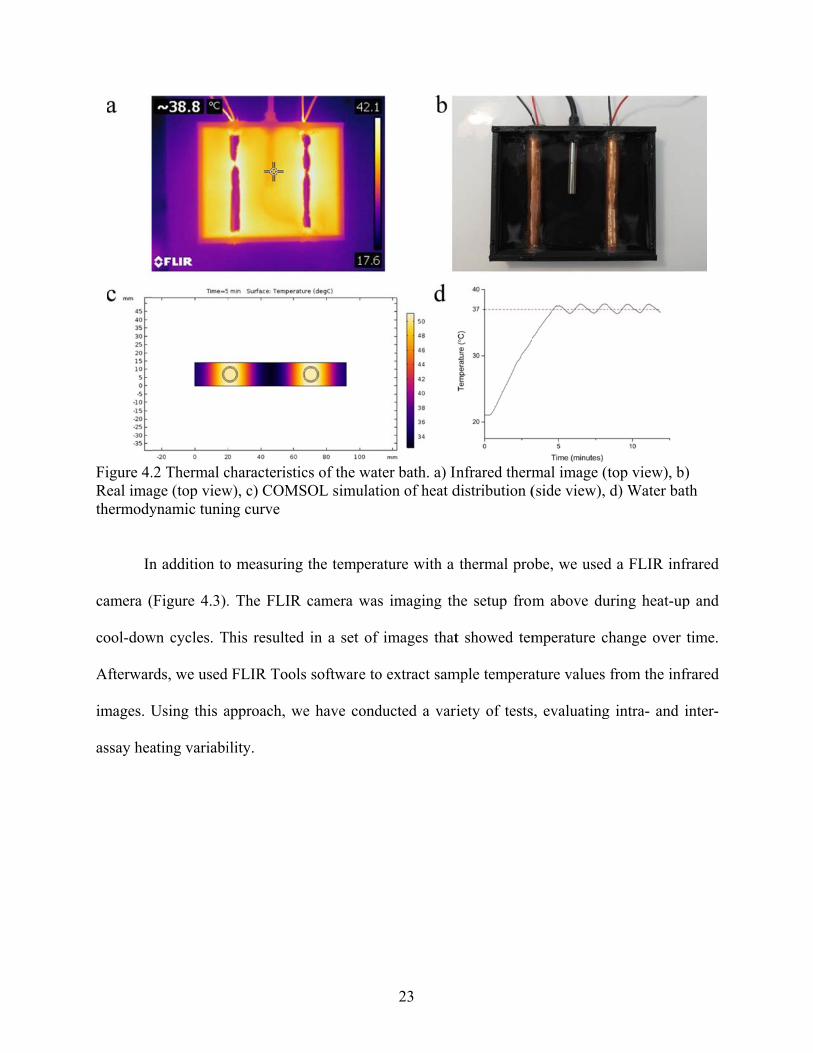
Figure 4.Real imathermody
In
camera (
cool-dow
Afterwar
images. U
assay hea
.2 Thermal cage (top viewynamic tunin
n addition to
(Figure 4.3).
wn cycles. T
rds, we used
Using this a
ating variabi
characteristicw), c) COMSng curve
o measuring
. The FLIR
This resulted
FLIR Tools
approach, we
ility.
cs of the watSOL simulati
the tempera
camera was
in a set of
s software to
e have cond
23
ter bath. a) Inion of heat d
ature with a
s imaging th
images that
o extract sam
ducted a vari
nfrared thermdistribution (
thermal pro
he setup from
t showed tem
mple tempera
iety of tests
mal image (t(side view),
obe, we used
m above du
mperature c
ature values
s, evaluating
top view), bd) Water ba
d a FLIR inf
uring heat-up
hange over
from the inf
g intra- and
)
ath
frared
p and
time.
frared
inter-
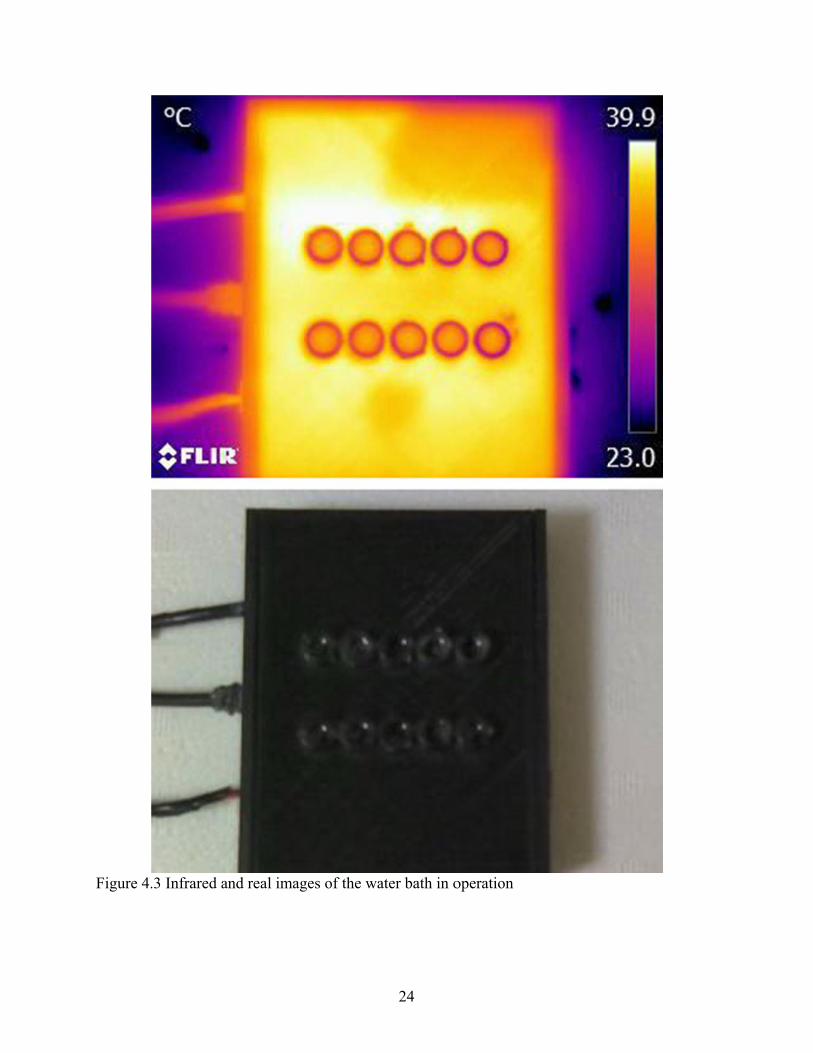
Figure 4..3 Infrared annd real imagges of the wa
24
ater bath in ooperation

25
4.1.2 Single Well Analysis
Before we study inter-well heating consistency, we need to analyze heat distribution
within a single well. Inspecting a zoomed-in thermal image shows inhomogeneity in temperature
distribution. The bright spot in the center on the well corresponds to the temperature of the
sample inside. Edge effects produce imaging artifacts that result in less reliable temperature
readings compared to the ones conducted in the center of the microwell. To determine the
variability we measured the temperature along a 2mm line segment AB (Figure 4.4) and plotted
it against distance. Within that area, temperature variability doesn’t exceed 0.2°C.
4.1.3 Current Analysis
The heating elements in the base of the incubator generate heat proportional to the current
that goes through it. Increasing or decreasing the current allows us to find optimal operating
conditions for stable sample incubation. We have chosen 1.2A and 0.75A currents to test the
incubator dynamics. The temperature was measured by the built-in thermal sensor and plotted
against time (Figure 4.5a). Using 1.2A current results in a rather fast initial heat-up but high
fluctuations around the set point. Using smaller 0.75A current causes the incubator to heat up
slower but reduces the fluctuations. Since the incubation time is not being considered, we
performed all the follow-up experiments at 0.75A for more accurate readings. Designing a
variable power supply would allow us to have higher current for initial sample heat-up and lower
current for maintaining the operation.
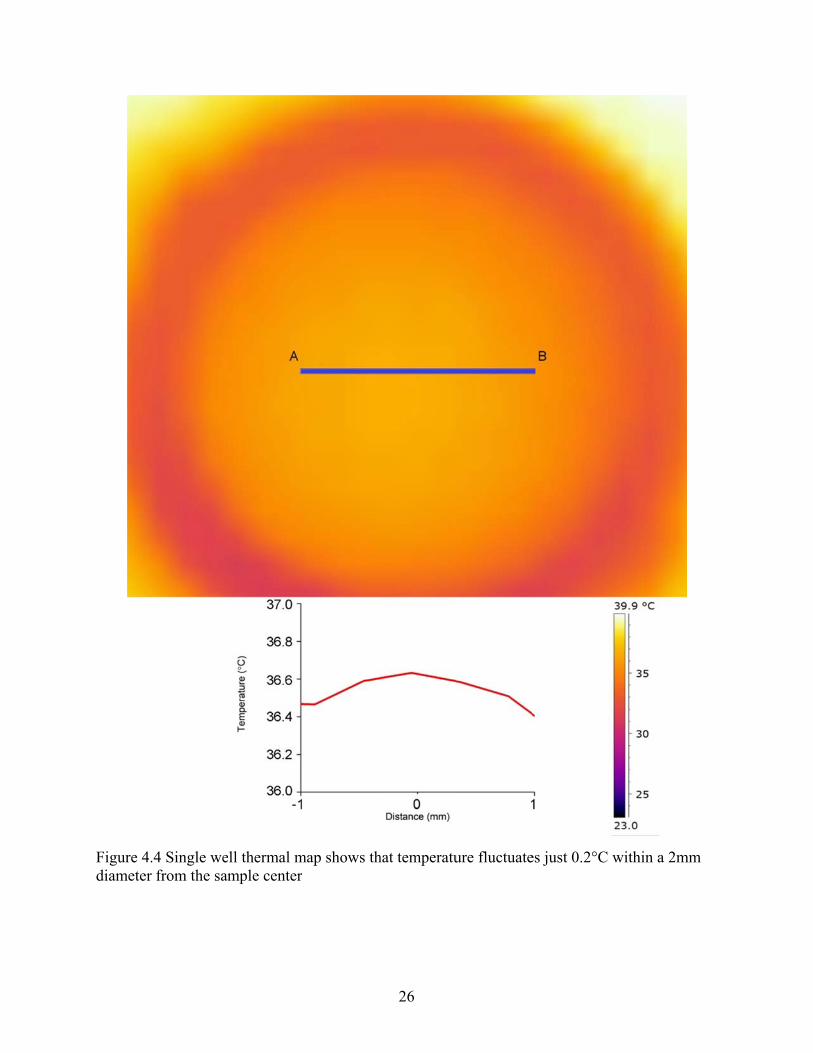
Figure 4.diameter
.4 Single wefrom the sam
ll thermal mmple center
map shows th
26
hat temperatuure fluctuate
es just 0.2°C within a 2m
mm

27
4.1.4 Inter-well Variability
The incubator heats multiple samples simultaneously. To ensure similar protein binding
dynamics across all the samples, they have to be heated uniformly. Inhomogeneous sample
heating will cause errors in protein concentration measurements. The proposed incubator design
includes two parallel heating cores with ten samples arranged alongside them. To test sample
heat dynamics we used an infrared camera to image the incubator after it reached the operation
temperature. The incubator temperature fluctuates around the set point so we had to image the
setup continuously to track this effect.
The acquired set of infrared images allows us to measure the temperature change of
individual samples over time. After extracting the temperature of every well, the mean value was
plotted against time (Figure 4.5b). We also calculated a standard deviation from the mean and
plotted it as error bars. The average standard deviation across 10 samples is 0.23°C. This proves
that samples are heated uniformly and the binding conditions are consistent.
The proposed incubator can heat 10 samples to a 37°C with ±0.15°C fluctuations off the
set point. At 0.75A current, it reaches operating temperature in 15 minutes. We have
demonstrated that the incubator heats all the samples consistently with temperature variations not
exceeding 0.2°C. The results obtained with the thermal probe match the data from the infrared
camera. The proposed design has been analyzed and tested to ensure that it meets the project
criteria.

28
Figure 4.5 Incubator tuning curves. a) incubator heat dynamic under two different currents b) heat dynamic measured with a temperature probe matches with the infrared image analysis.
29
CHAPTER 5: OPERATION AND RESULTS1
The next ELISA step after completing the incubation, is adding a secondary colorimetric
antibody followed by quantifying the sample absorption with a plate reader. As a substitute for a
plater reader, MELISA uses a smartphone camera and this data is then compared with data
obtained using a commercial plate reader. To remove interference from the ambient light while
taking an image with a mobile phone camera, we placed the samples inside of a black box
similar to Chroma-dock [36]. As a light source we used a white LCD screen placed under the
samples, and it produced uniform illumination. The camera from the mobile phone was used for
the colorimetric measurements, and during the measurements camera parameters such as white
balance, ISO, and exposure rate were fixed [43].
The early design of MELISA system is shown in Figure 5.1. The device housing is
comprised of two separate sections. The inner section of the housing is the site where ELISA
procedure steps take place, including incubation and image capture. A backlight LCD screen is
located in the bottom of this section. The outer section of the housing is used to store the control
circuitry necessary for device operation. The control circuitry includes: an Arduino Mega 2560
microcontroller, two DC solid state relays, and an input/output (I/O) circuit for the
microcontroller. A door is designed to block out any light from outside sources and connects to
the box by sliding into grooves. The plastic components were designed in Autodesk Inventor and
the housing was 3D-printed in polylactic acid (PLA) plastic. The device has two inserts – one for
1 Portions of this chapter have been previously published in Biosensors and Bioelectronics, 2018, 103; 138-142 and reproduced with permission from Elsevier (Appendix C).

30
sample heating and the other for image capturing. The heater insert (the water bath) was also
designed in Autodesk Inventor but 3D-printed using acrylonitrile butadiene styrene (ABS)
plastic rather than PLA because of better resistance of this material to higher temperatures. The
heating tray has holders for the ELISA microwells arranged in two lines of five, equidistant from
two copper tubes with inserted heating elements. The water bath slides into the 3D-printed
housing with the heating elements and temperature sensor connecting to the Arduino
microcontroller, as well as a power supply. The image capturing tray has ELISA microwell
holders arranged in a hexagonal pattern for optimal light distribution. The prototype is modular,
enabling custom modifications of the whole system. All the parts needed for construction of the
prototype (besides a mobile phone) can be purchased for less than $40 and be used off the shelf.
5.1 Operation
The first step in the ELISA procedure is shown in Figure 5.2a. Progesterone samples are
added to the microwells and inserted into the sample holder under controlled temperature
environment in the water bath. After heating the samples to 37°C and maintaining this
temperature for 60 minutes, the microwells are removed from the water bath and placed into the
viewing tray, which is then placed on the same rails used for the bath, as shown in Figure 5.2.
Once the microwell-loaded viewing tray has been placed inside the MELISA device, the door is
closed and the LCD screen located below the viewing tray emits light through the bottom of the
microwells. In order to capture the images of the samples, a smartphone is placed on top of the
MELISA housing, and the camera aperture is aligned with the square-inch hole, with this step
shown in Figure 5.2c. With all ambient light blocked by both the door and the enclosed design of
the box, color contrast is more discernable, focus is improved, and the overall image quality is
enhanced. After loading the viewing tray into the housing and closing the door, the color

concentra
resulting
Figure 5.prototypeboard, 5)tubes wit
5.2 Samp
T
ranges of
1.0 ng/m
Concentr
cancer [4
technique
ations of the
image captu
.1 3D modele housing, 2)) DC solid stth heaters, 10
ple Prepara
The next step
f progesteron
ml – 4.5 ng/
ration levels
44]. In addit
es [45], radi
e ELISA sa
ured by a sm
l of the comp) sliding dootate relays, 60) temperatu
ation
p was evalu
ne concentra
/ml in the lu
s below the
ion to ELIS
ioimmunoass
amples can b
martphone is
plete system or, 3) LCD b6) water bathure probe, 11
uation of ME
ations for wo
uteinic phas
clinical ran
A, progester
say [46], and
31
be recorded
shown in Fi
(artistic renbacklight scrh, 7) heating 1) ELISA mi
ELISA using
omen in the
se, and 0.2
ge may incr
rone levels c
d liquid chro
with a sma
igure 5.2d.
ndering). Labreen and Ardtray, 8) imaicrowells.
g actual EL
follicular ph
ng/ml – 0.9
rease the ris
can also be
omatography
artphone. An
beled compoduino Mega 2age capturing
LISA measur
hase is 0.2 ng
9 ng/ml in
sk of endom
measured by
y–tandem m
n example o
onents: 1) 2560, 4) circg tray, 9) cop
rements. He
g/ml – 1.3 n
menopause
metrial and b
y protein-bin
mass spectrom
of the
cuit pper
ealthy
ng/ml,
[42].
breast
nding
metry
[47]. The
specializ
Figure 5.capturingdemonstr
T
from our
standard
antibody
ese other me
ed equipmen
.2 Demonstrg tray, c) Imaration)
To test the M
r measureme
instrument
-coated mic
ethods are no
nt and high c
ration of the age capturin
MELISA des
ents were co
, a Fisher
croplates, ca
ot designed
cost.
prototype. ang mode, d) C
ign, a 17OH
ompared wi
Scientific A
alibration sa
32
for point-of
a) Sample incCaptured sam
H progestero
ith the meas
AccuScan p
amples, and
f-care or at-h
cubation momple image
one ELISA k
surements c
plate reader
d a substrat
home use du
ode, b) Loadi(colored dye
kit [42] was
onducted us
r. The ELI
te required
ue to the nee
ing image es for
used and re
sing current
SA kit con
for quantit
ed for
esults
gold
ntains
tative

33
determination of progesterone concentration. Calibration samples have progesterone
concentrations of 0, 0.2, 0.4, 1.6, 6.4, and 19.2 ng/ml, respectively (Table 5.1). After incubation
and solid-phase washing, horseradish peroxidase (HRP), conjugated with 17OH antigens, binds
to anti-17OH progesterone antibodies. The HRP-antibody binding, along with the addition of
H2O2-tetramethylbenzidine (H2O2-TMB) and a sulfuric acid stop solution, results in a color
change. The color intensity of the ELISA samples is inversely proportional to the 17OH
progesterone hormone concentration. The final step is to measure sample absorption using the
current gold standard to validate results.
5.3 Experimental Procedure
Blood samples were purchased from Innovative Research and a 17OH ELISA calibration
kit was used to measure progesterone concentration with the MELISA device. The blood
samples were allowed to sediment, with 50μl of plasma collected from the top layer of each
sample, and dispensed into each sample microwell. After six calibration samples and three
unknown plasma samples were loaded in the prototype heating tray, samples were incubated for
60 minutes at 37°C. After incubation, the contents of the microwells were washed out with
deionized (DI) water and moved to an image capturing tray. Next, 100μl of H2O2-TMB (0.26 g/L
concentration) is added to each sample, binding to the 17OH antigens that are conjugated with
the HRP chromogenic agent. The image capturing tray is then placed back in the enclosure at
ambient temperature with the door closed. After 15 minutes in the dark, sulfuric acid (0.15
mol/L concentration) stop solution is added to the samples which prepare them for optical
reading [42].

Figure 5.ng/ml, 5)
Table 5.1
A
shown in
captured
balance s
[30]. Sin
balance w
.3 Progestero) 6.4 ng/ml, 6
1 ProgesteroSample #
ng/ml
An image of
n Figure 5.3.
image base
setting is the
nce a stable l
was set to a
one ELISA s6) 19.2 ng/m
ne calibratio1
0
f the samples
The white b
ed on the li
e color repr
light source
‘daylight’ m
samples imaml, 7) blank,
on samples c2
0.2
s was captu
balance setti
ight source.
oducibility f
was used a
mode, which
34
age. 1) 0 ng/m8-10) unkno
concentration3
0.4
red inside th
ing of the ca
The main
for images c
s a backgrou
h normalizes
ml, 2) 0.2 ngown concent
ns 3
4 1
he prototype
amera was u
advantage o
captured und
und in the e
s the color v
g/ml, 3) 0.4 ntration.
4
.6
e with the b
used to adjus
of using an
der different
experimental
values based
ng/ml, 4) 1.6
5
6.4
backlight LC
st the color o
automatic w
t light condi
l setup, the w
d on the stan
6
6
19.2
CD as
of the
white
itions
white
ndard

35
daylight illuminant source D65. The autofocus option in a camera can cause blur in images that
can add error to the measurements. Fixed focus mode was programmed into the mobile
application as the distance between the object and the camera is constant, which is determined by
the height of the box.
5.4 Data Analysis
Commercially available equipment, such as Fisher Scientific AccuScan microplate
reader, uses monochromatic light at 450nm to measure the absorbance of the calibration ELISA
samples. The sample absorbance is plotted against its respective concentrations. The test sample
data is then compared with the calibration curve and the plate reader outputs the measured value.
For this calibration process, traditional ELISA kits usually require 6 or 7 calibration samples. To
make it more cost effective and reduce the number of calibrators we can utilize a custom data
processing algorithm.
The calibration data can be processed with a four-parameter Boltzmann Sigmoid function
[19]:
(5.1)
where x0 is the center of the Sigmoid; dx is the span of the curve; A1 and A2 are the minimum and
the maximum values of the curve. Origin software package can be used to calculate the equation
parameters from the data set. The calibration equation (5.1) obtained using the calibration
samples can be solved for x to measure concentration of the unknown samples based on their
absorbance value:

36
∙ ln 1 (5.2)
Figure 5.4 shows an absorption calibration curve and measuring the concentration of
three unknown samples.
Getting back to the MELISA prototype, it measures color not based on absorption, but
based on light transmission. A mobile phone captures the sample image and on-boars software
can perform data processing. RGB values of the calibration samples can be measured and plotted
against respective concentrations (Figure 5.5). The red (R) and green (G) values are insignificant
due to the low range of measured values. The blue (B) component has the range required to
construct the calibration curve using the four-parameter Boltzmann Sigmoid function (5.1).
Applying the calibration function to the B values of the unknown samples is used to determine
the concentration.

Figure 5.
T
the comm
the value
10% of th
.4 Plate read
The results o
mercially av
es from the
he gold stan
der progester
of measuring
vailable plate
two measure
dard. This is
rone concent
g the progest
e reader and
ements show
s within valu
37
tration calibr
terone conce
d with MELI
ws the accur
ue variability
ration curve
entrations o
ISA are sho
racy of the M
y of the ELIS
f the unknow
own in Table
MELISA pr
SA kit.
wn samples
e 5.2. Comp
rototype is w
with
paring
within

Figure 5.
Table 5.2Sampl
8 9 10
.5 MELISA
2 Unknown pe # Plate r
(ng/ml2.9 2.39 3.23
(prototype)
progesteroneeader measul)
progesteron
e samples caured concent
38
e concentrat
alculated valtration P
(223
tion calibrati
lues Prototype me(ng/ml) 2.6 2.24 3.04
ion curve
easured conccentration
39
CHAPTER 6: PDMS INCUBATOR
The water bath incubator described in Chapter 4 allows us to reliably heat the sample at a
consistent temperature with minimal fluctuations. However, for the next step of the ELISA
procedure, the sample wells have to be manually moved to a different transparent tray so that
they can be imaged with the camera. This operation is delicate and improper execution may
result in reading errors. It also creates an inconvenience for the user. To satisfy the point-of-care
requirement, the device has to be user friendly therefore having very few steps requiring operator
involvement as possible. To make sample imaging possible in the heating module, the incubator
needs to be transparent. The water bath has to be redesigned into a heater made of thermally
conductive and transparent solid material.
6.1 PDMS Incubator Design
The heater, proposed in this new design (Figure 6.1a), is composed of
polydimethylsiloxane (PDMS) to hold the sample wells with embedded copper wire for heating
and thermal probe for real-time temperature monitoring. PDMS is used to facilitate viewing of
samples while still retaining similar thermal properties of water. PDMS is an optically clear, non-
flammable organic composite with a thermal conductivity (0.17 W/(m·K)) [48] close to water’s
(0.591 W/(m·K)). The clarity will allow the PDMS to not interfere with the concentration
readings. PDMS will be shaped to have holders for the microwells. Copper wire will be looped
around the microwells and embedded within the PDMS. Electrical current running through the
wire will generate heat that will warm the samples to the incubation temperature.

Figure 6.of the bomicrowe
T
incubator
mold has
In order t
heating i
has a res
.1 Proposed ttom mold clls d) 3D pri
To create a P
r was design
s an opening
to create a h
s proportion
istivity of 0
PDMS heatec) CAD desiginted heater m
PDMS incub
ned in Solid
g to for the w
eating eleme
nal to the res
.0171 Ohms
er design. a)gn of the topmold
ator in a des
dWorks and
wires to be c
ent, joule he
istance and
s·mm/m. Re
40
) 3D renderinp mold with
sired shape,
d 3D printed
connected to
ating is used
amount of c
sistivity is d
ng of proposcylindrical p
it needs to b
d (Figure 6.
o an external
d where curr
current ran th
directly corre
sed incubatoprotrusions f
be molded.
1d). The bo
l power sour
rent runs thro
hrough the w
elated to tha
or b) CAD defor the samp
The mold fo
ottom part o
rce (Figure 6
ough a wire.
wire. Copper
at value incr
esign le
or the
of the
6.1b).
. This
r wire
reases

41
with length and decreases with gauge. We used copper magnet wire that is covered with a
polymer insulating layer. This insulation provides safety including protection from leakage of
current and exposed wires. The top part of the designed mold has protrusions for the sample
wells that are then looped with the copper wire (Figure 6.1c). Electrical current running through
the wire will generate heat that will warm the samples to the incubation temperature.
6.2 Prototyping
In its uncured form, PDMS is a viscous liquid. When mixed with elastomer, it starts to
cure and solidify. To increase polymerization speed, PDMS is usually cured at 50 – 80°C. The
PDMS mix was created by adding elastomer is added to PDMS at 1:10 ratio. In its pre-baked
phase, PDMS is degassed for 30 minutes in a vacuum chamber to break-down oxygen bubbles in
the mixture. The floor layer of the bottom mold was layered with tape to make the surface
smoother, disassembly easier and to prevent the PDMS from leaking through the pores in plastic.
The 31 AWG copper wire is wrapped around the upper mold pegs with 6 loops (Figure 6.2a).
The loose ends are stripped of coating and soldered to a standard 3.5 mm connector and the
connector is attached to the opening of the bottom mold. The top and the bottom molds connect
leaving an opening to pour PDMS (Figure 6.2b). After degassing, the PDMS mixture is then
gently poured into the mold embedding the copper wire. The mold is put in the oven for curing
for 90 minutes at 75°C. The mold is then broken to release the incubator with openings for 10
sample wells (Figure 6.2d).

42
Figure 6.2 Heater fabrication. a) heater mold with copper wire wrapped around the protrusions for heating distribution b) assembled mold c) experimental setup (side view) d) PDMS heater with embedded copper wire for heating (top view)
6.3 Characterization
One of the essential parts of the device is the incubator that provides suitable conditions
for the antibody binding. Temperature inconsistencies in the incubator may result in binding
corruption and protein deterioration that will lead to inaccurate readings. To test the consistency
of the incubator sample heating, we have conducted a set of experiments monitoring temperature
distribution in microwells filled with water (Figure 6.2a). The thermal probe is located in one of
the sample wells to continuously monitor the temperature. A microcontroller that operates the
relays reads the data from the probe. The heaters are controlled through solid state relays by an

43
Arduino Mega 2560 microcontroller. When the temperature probe reads less than 37°C, the
relays are enabled, which powers the heating elements. When the temperature is greater than
37°C, the relay closes, switching the heaters off. Each well was filled with 200µl microliters of
water and the temperature sensor was placed in one well. An Arduino Uno was used to control
the temperature sensor through relays. It activated and deactivated the relays once the
temperature fell below a preset point and once it reached the minimum temperature of 37°C
respectively. The process was also captured with a FLIR thermal camera (Figure 6.3d).
The initial current for the heater was set at 0.75A, as in the water bath incubator. After 10
minutes the temperature readings in the well saturated at 25°C. PDMS had lower thermal
conductivity then water and wasn’t capable of heating the samples to desired temperature.
Increasing the current to 1.2A for the next 15 minutes raised the temperature to 35°C, however it
still reached saturation and wasn’t high enough for the antibody conjugation. The current was
raised to 2A to reach the desired temperature. Figure 6.3a shows the complete tuning curve and
demonstrates that the relay successfully keeps the temperature at 37°C. The heater was then
tested at 1.7A. It took 6 minutes to reach operating temperature and the temperature was kept at
set point within 0.5°C variation (Figure 6.3c). This current is effective and consistent enough for
the ELISA samples experiments.

44
Figure 6.3 PDMS incubator testing. a) PDMS incubator temperature tuning curve (three power regimes are demonstrated – 0.75A, 1.2A and 2A respectively) b) experimental setup (top view) c) tuning curve at 1.7A d) infrared thermal image of the incubator
6.4 Testing
We have chosen cortisol ELISA samples to test the effectiveness of the heater and
compare its parameters to traditional incubator. Cortisol is a steroid hormone that is produced by
the adrenal glands as a response to stress or low blood glucose concentration to promote
gluconeogenesis. It helps regulating sleep cycle, reduces inflammation and controls blood
pressure [49-51]. Cortisol deficiency causes fatigue, loss of appetite, nausea and abdominal pain.
Cortisol supplements are often prescribed to control metabolism and reduce blood pressure [52].

45
The PDMS incubator was tested against a standard incubator and the samples were read
by the optical readout as well as the plate reader. Five calibration samples of known
concentrations were used to create a calibration curve for the measurement (Table 6.1). Two sets
of samples were prepared to test in the PDMS and the standard incubators. The experiment
followed standard cortisol ELISA procedure where 20µl of sample is added to the pre-coated
microwells and incubated at 37°C for 1 hour. Cortisol ELISA procedure is similar to
progesterone ELISA, described in detail in Chapter 5.3. Additional control sample was used to
calculate readout error.
After incubation in both heaters, the samples were read by the plate reader and the optical
readout. Plate reader absorption values are shown on Figure 6.4. The calibration was fitted with a
Boltzmann Sigmoid equation (5.1) that was used to measure the control sample concentration.
Samples from both heaters were then imaged with the optical readout prototype and RGB color
values were extracted. Out of R, G and B channels only B channel was sensitive to concentration
change. B values were used to plot a calibration curve in Figure 6.5. Concentration values for
control sample were calculated from the Boltzmann curves for both heaters and both readouts to
determine error and check how consistent the PDMS heater is comparing to the standard one.
The readings demonstrate that the control sample value error does not exceed 3% for both
heaters and readout methods (Table 6.2). This proves that PDMS heater can be used for
consistent and reliable measurements.

Table 6.1Sa
ng
Figure 6.measured
1 Cortisol caample #
g/ml
.4 Standard ad by the plat
alibration sam1
0
and PDMS he reader
mples concen2
10
heater cortiso
46
ntrations 3
50
ol ELISA ca
4
150
alibration cur
5
50
urves and con
00
ntrol sample
s
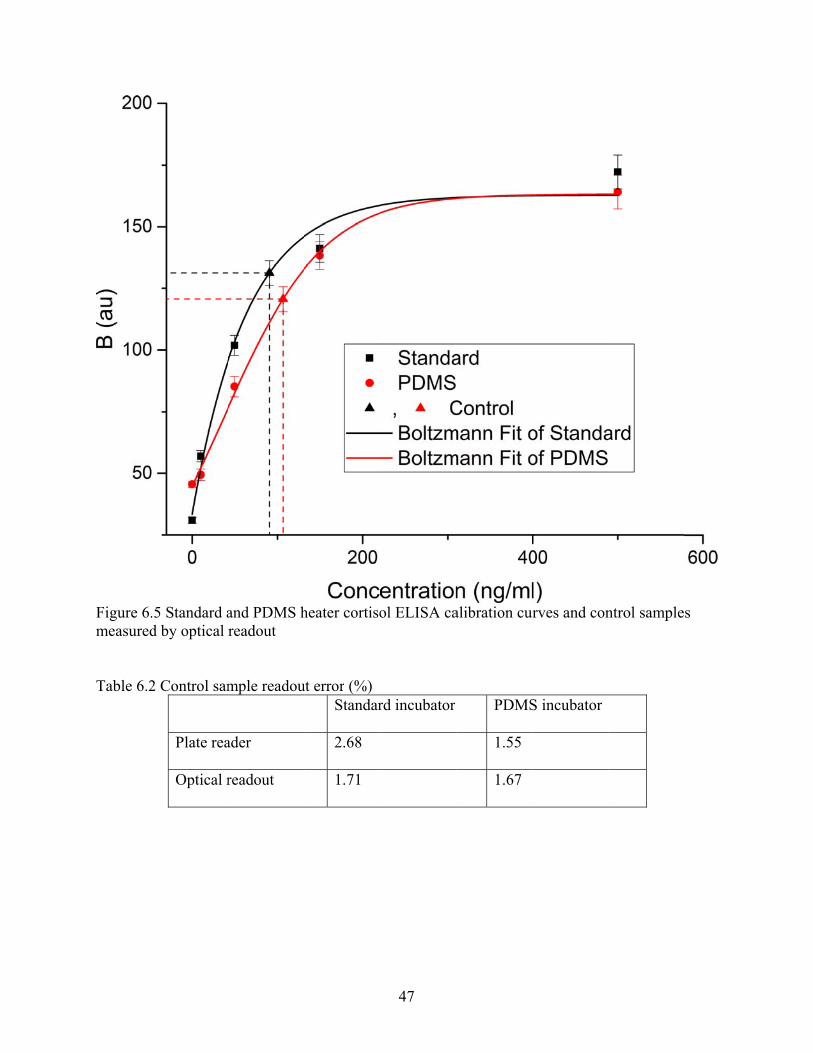
Figure 6.measured
Table 6.2
.5 Standard ad by optical
2 Control sam
Plate rea
Optical r
and PDMS hreadout
mple readou
ader
readout
heater cortiso
ut error (%) Standar
2.68
1.71
47
ol ELISA ca
rd incubator
alibration cur
PDMS
1.55
1.67
urves and con
S incubator
ntrol sample
s

48
To test the consistency of the PDMS heater and accuracy of the optical readout, we have
prepared three samples with unknown concentrations. These samples were incubated alongside
the known calibration samples in the PDMS heater. After incubation, conjugation with the
antibody, adding substrate and other steps of ELISA, the samples were read by the Plate reader
and the optical readout. The plate reader data is shown in Figure 6.6. Absorption values of
unknown samples were projected on the calibration curve to produce concentration data points
(Table 6.3). Similarly, concentration values were acquired from the B channels of the optical
readout (Figure 6.7). As seen in Table 6.3, concentration data measure by both systems matches
within 10% accuracy. That proves that PDMS heater and optical readout can be used in the
portable mHealth ELISA system developed in this project.

Figure 6..6 Plate readder cortisol concentration
49
n calibration curve

Figure 6.
Table 6.3Sample
7 8 9
.7 MELISA
3 Unknown c # Plate re
(ng/ml)33.24 87.4 131.87
cortisol conc
cortisol sameader measur
centration ca
mples calculatred concentr
50
alibration cu
ted values ration P
(381
urve
Prototype me(ng/ml) 31.78 81.63 134.71
easured conccentration

51
6.5 Challenges and Failures
We have faced a number of challenges designing the operational prototype. The main
challenge was optimizing the design so we get same results across multiple prototypes. Firstly,
PDMS curing time depends on incubation temperature. According to the manufacturer, it takes
approximately 2hrs to completely cure at 60°C, whether at 150°C the curing time is only 10min.
However, at temperatures larger than 90°C, the plastic mold starts to deform (Figure 6.8a). The
shape of the resulted incubator is uneven (Figure 6.8b) and it cannot have a uniform heating
profile. To prevent the mold from damage, the PDMS mixture was cured at 75°C for 90 minutes.
Additionally, the initial design of the upper mold pegs could not prevent thinner gauge
wire from slipping off during mold disassembly. When the mold was pulled from the cured
incubator, it took some of the wiring with it (Figure 6.8c, d). Not only does it compromise the
well with loose wiring, but the whole heating system experiences current drops and cannot
provide consistent heating. That was solved by adding notches on the protrusions to hold the
wire and using thicker wire gauge.
Heater transparency is also an important factor. An opaque or inconsistent incubator will
make the color readings unreliable which will lead to readout errors. The molds were created
with 3D printing that moves a heated plastic extruder in a specific pattern to match the shape of
printed object. The motion of the extruder head creates uneven ridges that imprint into the
incubator during molding (Figure 6.8e). Moreover, during printing, the mold infill can be pre-
programmed. Lesser fill uses smaller amounts of plastic and makes the mold easier to break off.
However, PDMS can seep through the mold making it very difficult to separate from the mold. It
may even cause breaking-off the pegs and trapping them in the incubator. Putting tape on the

52
floor of the bottom mold makes the surface smoother and prevents the PDMS mixture from
leaking.
Finally, during mixing with elastomer, the mixture entraps a lot of air bubbles. During
curing, they cause inconsistencies that are detrimental to colorimetric analysis (Figure 6.8f).
Proper degassing in a vacuum chamber is required to break the air bubbles and avoid
inhomogeneities during curing the polymer.
6.6 Incubator Consistency Test and Statistical Analysis
To test the consistency of the PDMS incubator design, described in Chapter 6, three
incubators were tested at 1.7A current. Eight water samples were loaded into each incubator and
heated to a 37°C setpoint controlled by the circuit, shown in Appendix B. Three incubators were
then imaged with high-resolution FLIR camera (Figures 6.9, 6.15, 6.21). Temperature variation
across each well was measured to validate that inter-well fluctuations do not exceed 0.2°C (Table
6.4). Average temperature of each well was measured to determine standard deviation from the
average temperature across eight wells. The experiment was repeated in 5 trials to demonstrate
reproducibility. The results are shown in Table 6.5.
Figures 6.10 – 6.14 show the average temperature in each well during each of the 5 trials
of incubator #1. The experiment was repeated for the incubator #2 (Figures 6.16 – 6.20) and
incubator #3 (Figures 6.22 – 6.26). Error bars represent variability within each sample. Dashed
line shows the average temperature across eight samples or each run. The deviation from the
setpoint (37°C) does not exceed 0.5°C.
Figure 6.incubatorPDMS mbubbles
.8 Failed pror c) dislodge
mix leaks into
ototypes. a) med wire causeo the mold a
mold damaged by thin ga
and entraps o
53
ed from excauge d) unusone of the pe
essive heat dsable well wegs f) incuba
during curinwith compromator comprom
ng b) disfigurmised wiringmised by air
red g e)

54
Table 6.4 Individual well average deviation (°C) Sample 1 2 3 4 5 6 7 8
Incubator #1 Trial 1 0.14 0.03 0.08 0.09 0.23 0.14 0.11 0.13 Trial 2 0.11 0.03 0.10 0.13 0.14 0.15 0.07 0.10 Trial 3 0.11 0.05 0.07 0.06 0.23 0.15 0.07 0.25 Trial 4 0.14 0.06 0.12 0.21 0.34 0.18 0.09 0.13 Trial 5 0.06 0.06 0.07 0.12 0.32 0.52 0.28 0.17 Average 0.11 0.05 0.09 0.12 0.25 0.23 0.12 0.16
Incubator #2 Trial 1 0.06 0.08 0.10 0.06 0.16 0.09 0.11 0.08 Trial 2 0.06 0.08 0.04 0.09 0.15 0.16 0.04 0.04 Trial 3 0.04 0.07 0.04 0.03 0.13 0.11 0.11 0.11 Trial 4 0.09 0.07 0.21 0.06 0.11 0.23 0.09 0.08 Trial 5 0.04 0.08 0.11 0.04 0.07 0.10 0.10 0.06 Average 0.06 0.08 0.10 0.06 0.12 0.14 0.09 0.07
Incubator #3 Trial 1 0.09 0.02 0.08 0.06 0.03 0.08 0.07 0.06 Trial 2 0.03 0.07 0.07 0.07 0.06 0.04 0.09 0.06 Trial 3 0.18 0.19 0.11 0.06 0.11 0.15 0.13 0.09 Trial 4 0.14 0.06 0.06 0.08 0.04 0.09 0.10 0.07 Trial 5 0.11 0.08 0.11 0.03 0.10 0.09 0.08 0.04 Average 0.11 0.08 0.09 0.06 0.07 0.09 0.09 0.06 Total average
0.09 0.07 0.09 0.08 0.15 0.15 0.10 0.10
Table 6.5 Average deviation of sample temperatures (°C) Trial 1 2 3 4 5 Incubator #1 0.41 0.29 0.23 0.25 0.23 Incubator #2 0.39 0.34 0.33 0.43 0.46 Incubator #3 0.32 0.35 0.4 0.29 0.28
Statistical analysis was performed to determine statistical significance of mean variation.
ANOVA factoring sample position and trial was performed for each of the incubators with the
null-hypothesis stating equality of means. The p-values for all the test were lower than 0.05
significance level demonstrating a statistical significance of difference of means. To check for
practical significance I have performed correlation analysis for each of the eight wells across five
trials. Analysis of incubator #1 shows that all the wells, apart from well #7 are correlated
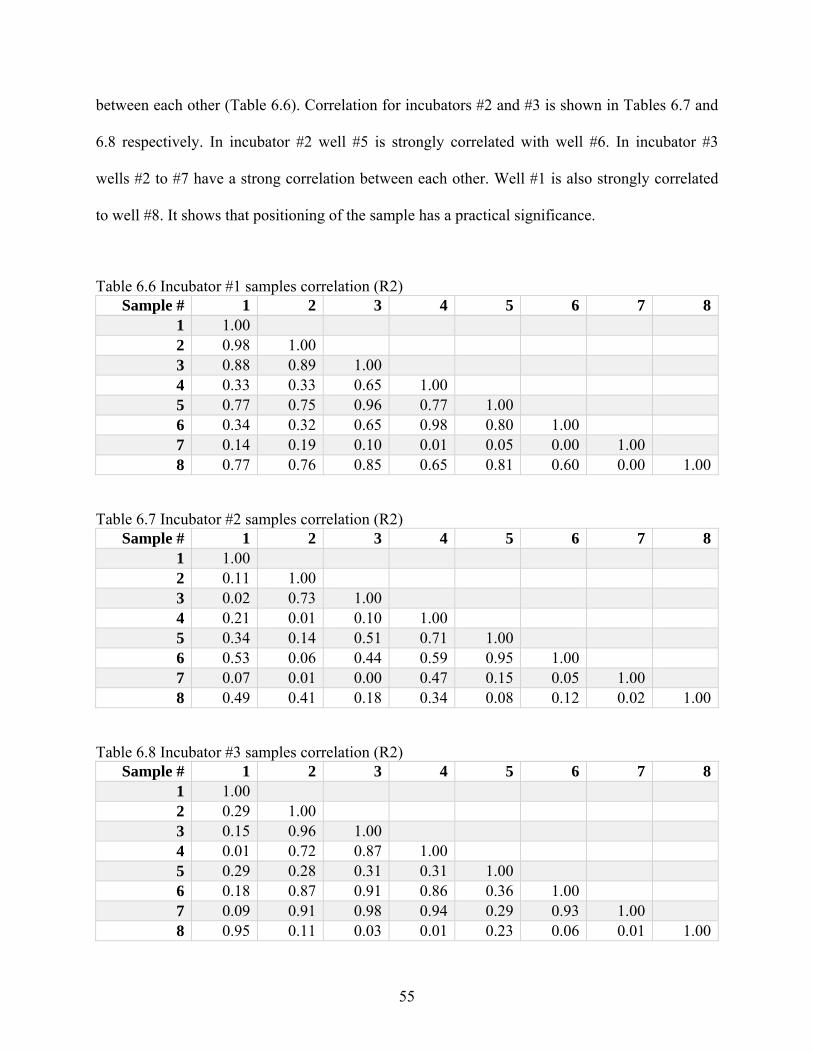
55
between each other (Table 6.6). Correlation for incubators #2 and #3 is shown in Tables 6.7 and
6.8 respectively. In incubator #2 well #5 is strongly correlated with well #6. In incubator #3
wells #2 to #7 have a strong correlation between each other. Well #1 is also strongly correlated
to well #8. It shows that positioning of the sample has a practical significance.
Table 6.6 Incubator #1 samples correlation (R2) Sample # 1 2 3 4 5 6 7 8
1 1.00 2 0.98 1.00 3 0.88 0.89 1.00 4 0.33 0.33 0.65 1.00 5 0.77 0.75 0.96 0.77 1.00 6 0.34 0.32 0.65 0.98 0.80 1.00 7 0.14 0.19 0.10 0.01 0.05 0.00 1.00 8 0.77 0.76 0.85 0.65 0.81 0.60 0.00 1.00
Table 6.7 Incubator #2 samples correlation (R2) Sample # 1 2 3 4 5 6 7 8
1 1.00 2 0.11 1.00 3 0.02 0.73 1.00 4 0.21 0.01 0.10 1.00 5 0.34 0.14 0.51 0.71 1.00 6 0.53 0.06 0.44 0.59 0.95 1.00 7 0.07 0.01 0.00 0.47 0.15 0.05 1.00 8 0.49 0.41 0.18 0.34 0.08 0.12 0.02 1.00
Table 6.8 Incubator #3 samples correlation (R2) Sample # 1 2 3 4 5 6 7 8
1 1.00 2 0.29 1.00 3 0.15 0.96 1.00 4 0.01 0.72 0.87 1.00 5 0.29 0.28 0.31 0.31 1.00 6 0.18 0.87 0.91 0.86 0.36 1.00 7 0.09 0.91 0.98 0.94 0.29 0.93 1.00 8 0.95 0.11 0.03 0.01 0.23 0.06 0.01 1.00
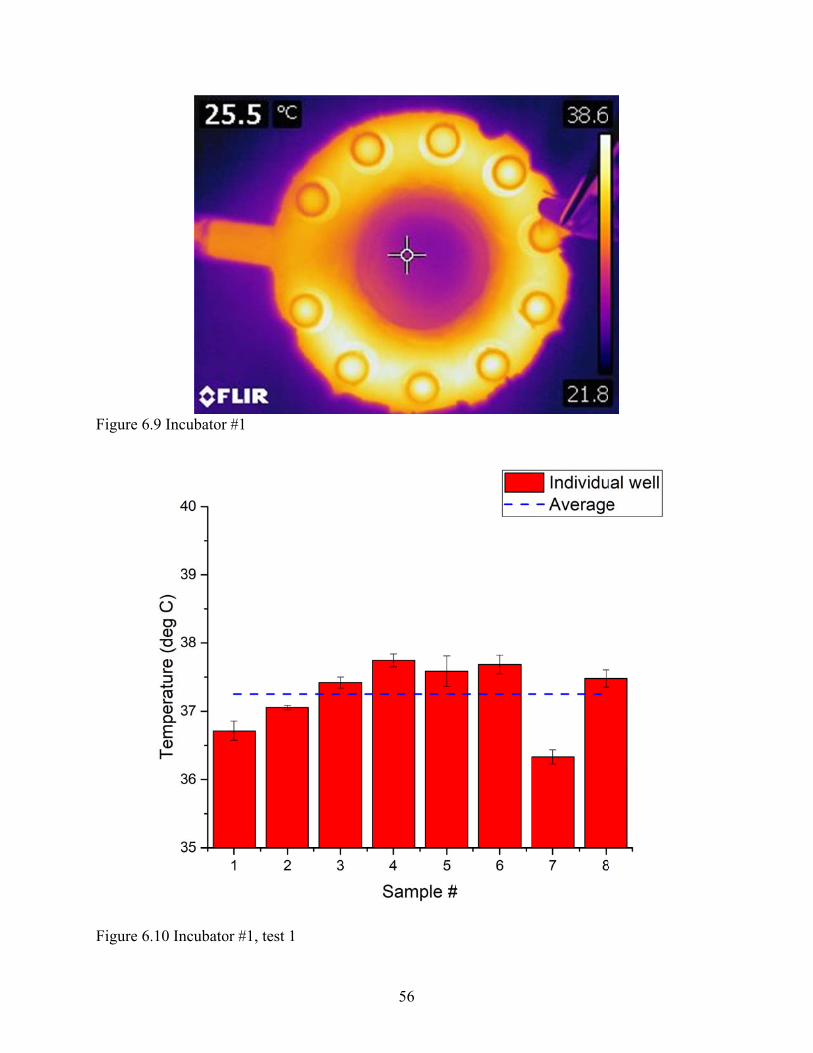
Figure 6.
Figure 6.
.9 Incubator
.10 Incubato
#1
or #1, test 1
56

Figure 6.
.11 Incubatoor #1, test 2
57

Figure 6..12 Incubatoor #1, test 3
58

Figure 6.
.13 Incubatoor #1, test 4
59

Figure 6.
Figure 6.
.14 Incubato
.15 Incubato
or #1, test 5
or #2
60

Figure 6..16 Incubatoor #2, test 1
61

Figure 6..17 Incubatoor #2, test 2
62

Figure 6..18 Incubatoor #2, test 3
63
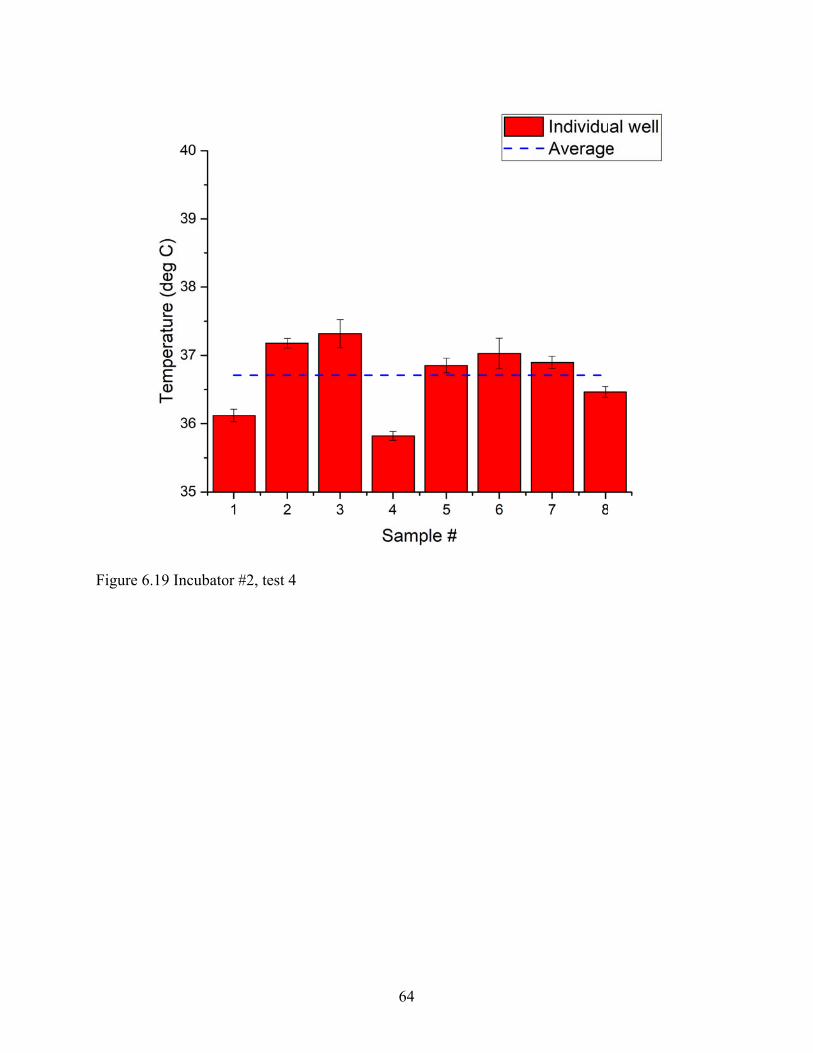
Figure 6..19 Incubatoor #2, test 4
64
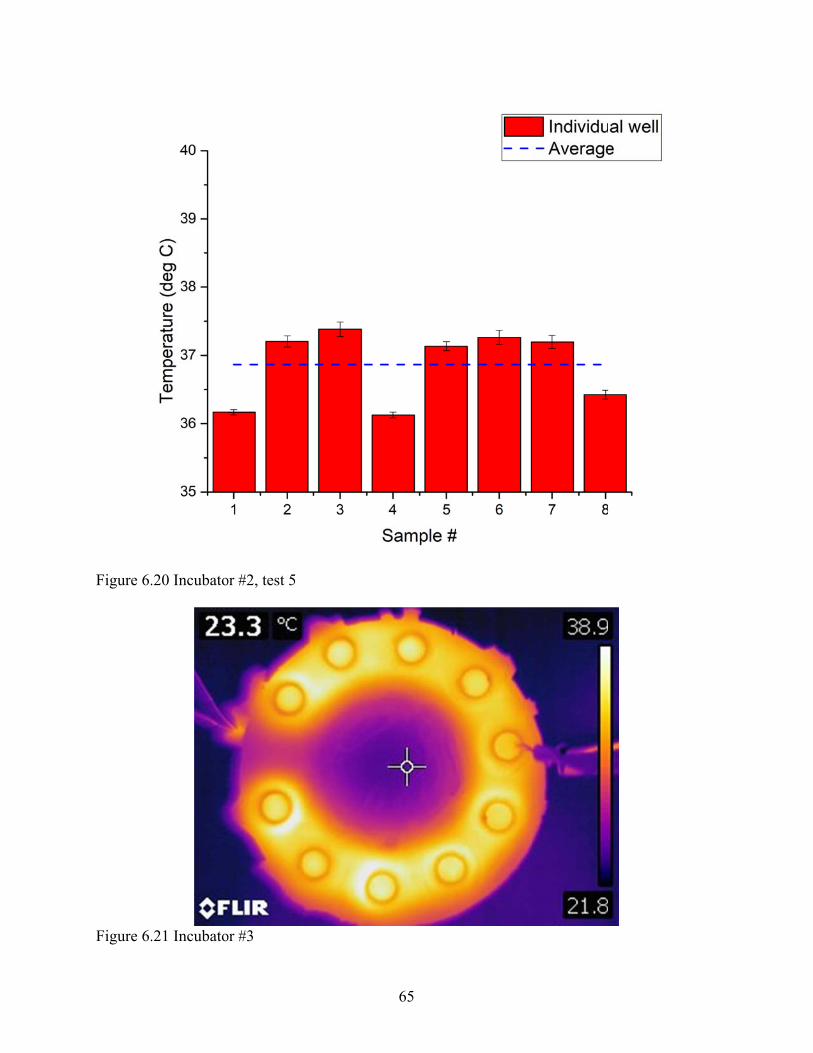
Figure 6.
Figure 6.
.20 Incubato
.21 Incubato
or #2, test 5
or #3
65
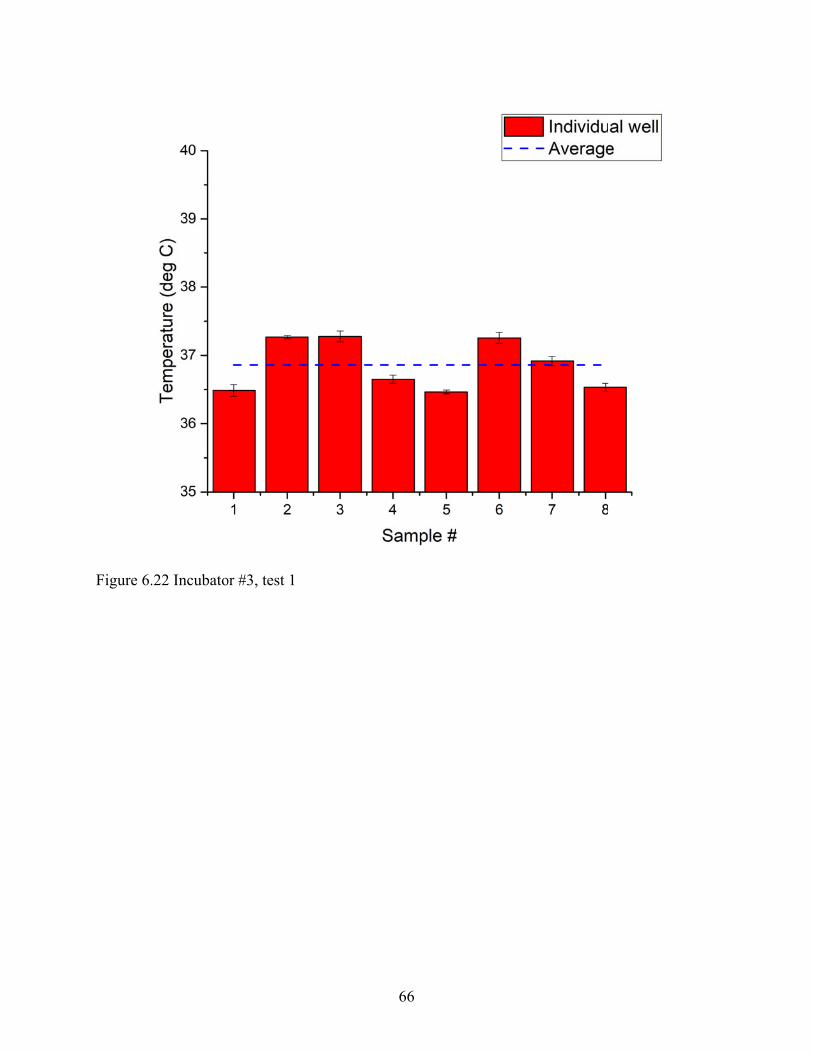
Figure 6.
.22 Incubatoor #3, test 1
66

Figure 6.
.23 Incubatoor #3, test 2
67
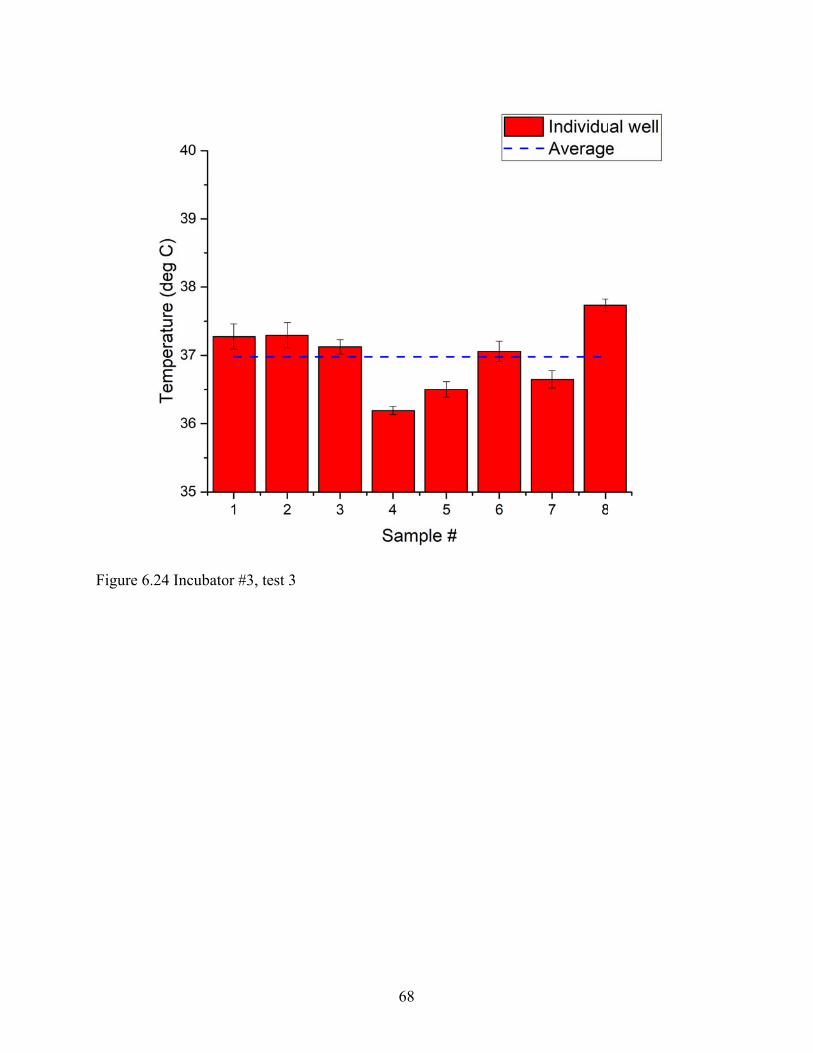
Figure 6.
.24 Incubatoor #3, test 3
68

Figure 6.
T
exceed
inconsist
the coppe
not exce
consisten
.25 Incubato
The experime
0.2°C (at
tencies relate
er wiring cau
ed 0.5°C. R
nt and can be
or #3, test 4
ental results
37°C). Sta
ed to sample
used by the h
Reproducibil
e used for EL
show that u
atistical ana
e position. T
human facto
lity of the e
LISA sample
69
uniformity of
alysis demo
These incons
or. However,
experiment a
es incubation
f the designe
onstrated t
sistencies ar
, the standar
also proves
n.
ed PDMS in
that there
re related to
rd temperatu
that the inc
ncubator doe
are temper
imperfectio
ure deviation
cubator desi
es not
rature
ons of
n does
ign is
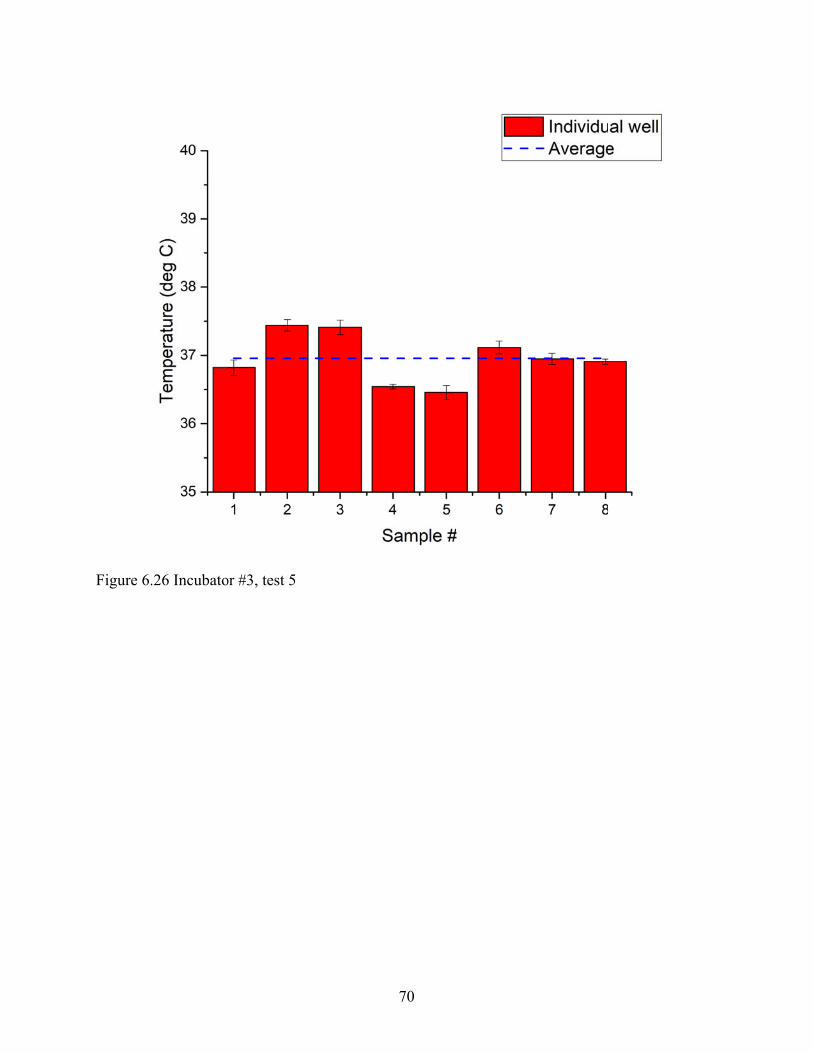
Figure 6.
.26 Incubatoor #3, test 5
70

71
CHAPTER 7: THERMOCHROMIC PROPERTIES OF PDMS
The most important quality of the PDMS heater, described in Chapter 6 is its ability to
sustain temperature of the samples at 37°C. Currently it uses a thermal sensor probe that send the
temperature data to the microcontroller circuit that operates the heater relay. Another part of the
nHealth ELISA system is the optical readout that uses image processing to measure sample
concentrations. Adding a thermochromic effect to the incubator can let the image processing
module take over the temperature control as well. It will simplify the system and make it
components work more efficient.
Currently, one popular area of research is creating PDMS based composite materials that
exhibit new interesting properties unavailable in pure PDMS. For example, mixing PDMS with
carbon, carbonyl iron or gold nanoparticles makes it conductive, magnetic and plasmonically
heatable, respectively [53-55]. Here we propose and demonstrate a new composite based on
PDMS mixed with thermo-chromic pigment (TCP) that makes PDMS thermally-sensitive.
7.1 System Design
The proposed system includes a thermochromic sensitive element and a digital optical
readout device. To take the images under controlled light conditions we use a system described
in Chapter 3 to hold the mobile phone and remove the interference of external light during the
measurement. CMOS sensor in the Smartphone camera acts like a detector to measure color
components of the sample. This setup works like a reflectance colorimeter.
Exposure rate is the amount of light per unit area that reaches the CMOS image sensor.
Color values of the samples were measured inside a dark box as shown in the Figure 7.1, where

auto setti
[43]. To
W
source u
setting is
Autofocu
measurem
between
Figure 7.inside a s
ings of the i
avoid this, th
White balanc
sed while sh
s the color
us option in
ments. Fixed
the object an
.1 Experimensample holde
image senso
he exposure
ce setting is u
hooting the
reproducibil
n the came
d focus mo
nd the camer
ntal setup (ser (2) with a
or can cause
compensati
used to adju
image. The
lity for ima
era can cau
ode was pro
ra is constan
ide door opea smartphone
72
over expos
on was manu
ust the color
e main adva
ages capture
use blur in
ogrammed to
nt which is d
ened). Side ve (1) on the t
sure that can
nually set to a
of the captu
antage of usi
ed under dif
the image
o the mobil
determined b
view of a pigtop
n lead to los
a constant va
ured image b
ing automat
fferent light
that can a
le applicatio
by the height
gmented PD
s of color d
alue.
based on the
tic white ba
conditions
add error to
on as the d
t of the box.
MS chip (3)
details
e light
alance
[56].
o the
istant
)

73
Sensitivity of the image sensor us determined by the ISO number of the digital camera.
The larger the ISO number, the worse is the signal to noise ratio (SNR) [57], so a lower ISO
value was used for the measurement to yield a better SNR.
The experimental setup is shown in Figure 7.1. The image demonstrates a mobile phone
placed on top of a 3D-printed sample holder. The sample holder has a square opening in the
center of the top face. A camera of a mobile phone has to be aligned with the opening. This
design allows using variety of different mobile phones with the same sample holder.
7.2 Composite Preparation and Characterization
In order to create a new thermally-sensitive composite we infused pre-polymerized
PDMS with TCP powder [58]. It was composed of 90.2% PDMS, 9.2%, elastomer and 0.6%
TCP. This leuco dye based powder changes its color gradually from blue, at room temperature,
to white, at activation temperature [59]. Individual powder particles have average size less than
6µm that allows them to be homogeneously dispersed in pre-polymerized PDMS, in its liquid
phase.
To study thermal response properties of the proposed composite, we have fabricated
pigmented PDMS chips by mixing elastomer, TCP and PDMS in liquid phase and polymerizing
it in Petri dish molds. This procedure resulted in creating thermo-sensitive elastic disks. The
temperature measurement on the PDMS chip was determined by calibration curve. To calibrate
the color of the composite with respect to its temperature, the pigmented chip was gradually
heated on a hotplate and imaged under a microscope every 1°C. RGB values were measured
from each individual image and plotted against temperature (Figure 7.2), building a calibration
curve and fitting the data points with a four parametrical Sigmoid curve [59]. Among RGB
components, the G values have the largest range that can be used to measure temperature

between
can be us
Figure 7.temperatu
7.3 Self-e
A
applicatio
pigmente
to create
after bein
26 and 38°C
sed to expan
.2 Calibratioure. Each in
erasing The
After compo
ons. The fir
ed PDMS ca
white patter
ng in contac
C. Additiona
nd the operat
on curve reladividual dat
ermal Writi
site charact
rst applicatio
an be heated
rns on the su
ct with the h
ally, use of p
ion temperat
ating R, G ana set is fitted
ing
erization, th
on is self-er
locally (Fig
urface of the
heating elem
74
pigments wit
ture range o
nd B color cod with corres
he next step
rasable therm
gure 7.3). A
chip. Figur
ment for 10
th lower or h
f the compo
omponents osponding Bo
p was to stu
mal writing.
soldering iro
re 7.3a show
seconds. Fi
higher activa
site [60].
of heated PDoltzmann sig
udy a numb
. It is based
on heated to
ws a thermal i
igure 7.3b d
ation temper
DMS to its gmoid curve
ber of intere
d on the fact
o 300°C was
image of the
demonstrates
rature
esting
t that
s used
e chip
s that
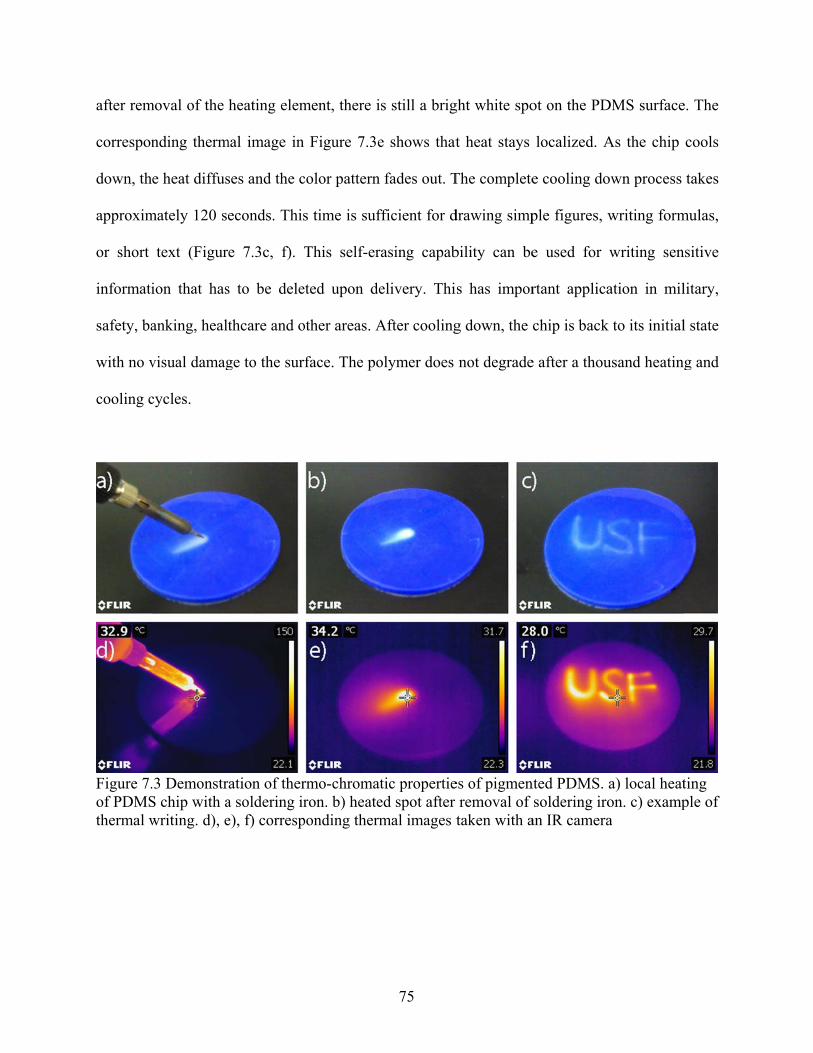
after rem
correspon
down, th
approxim
or short
informati
safety, ba
with no v
cooling c
Figure 7.of PDMSthermal w
moval of the
nding therm
e heat diffus
mately 120 se
text (Figur
ion that has
anking, healt
visual damag
cycles.
.3 DemonstrS chip with awriting. d), e
heating elem
mal image in
ses and the c
econds. This
e 7.3c, f). T
s to be dele
thcare and o
ge to the sur
ration of thera soldering ire), f) corresp
ment, there i
Figure 7.3e
color pattern
s time is suf
This self-er
eted upon de
other areas. A
face. The po
rmo-chromatron. b) heate
ponding therm
75
s still a brig
e shows that
fades out. T
fficient for d
rasing capab
elivery. Thi
After cooling
olymer does
tic propertieed spot after mal images t
ght white spo
t heat stays
The complete
drawing simp
bility can be
s has impor
g down, the
not degrade
es of pigmenremoval of taken with a
ot on the PD
localized. A
e cooling do
ple figures, w
e used for
rtant applica
chip is back
e after a thou
nted PDMS. soldering iro
an IR camera
DMS surface
As the chip
own process
writing form
writing sen
ation in mil
k to its initial
usand heating
a) local heaton. c) exampa
e. The
cools
takes
mulas,
sitive
litary,
l state
g and
ting ple of

76
7.4 Visualization of Thermal Conductivity
The second intriguing application of this new composite material is its ability to show
differences in thermal conductivity. This can be determined by the change of temperature with
time, using equation (7.1), which depends on the material’s thermal conductivity k, density ρ and
specific heat capacity C.
∙ (7.1)
In equation (7.1), T is temperature, t is time and Q is transferred heat. It can be noted that
higher thermal conductivity increases heat exchange rate. To demonstrate this effect, a sample
cooled to 0°C (United States one-cent coin) was placed on the surface of a 2mm thick pigmented
PDMS chip warmed to 40°C. Figure 7.4 illustrates the change of warmed PDMS color when in
contact with the sample for 10 seconds. Initial color of PDMS at 40°C was white and the locally
cooled area became blue. Thermal conductivity of Cu plated coin is 385 W/(m·K) that is
significantly larger than that of PDMS (0.17 W/(m·K)) [48] and air (0.025 W/(m·K)). Therefore,
PDMS surface in contact with the coin cools faster, leaving a dark spot with the size and shape
of the coin. This demonstrates that heat exchange between coin and PDMS happens faster than
between PDMS and air. The shape of the spot shows edge effects – color inhomogeneities on the
borders. To accurately analyze composite’s color to determine the temperature, the measurement
should be performed closer to the center of the spot. The observation of the experiment in cross
section demonstrates that the PDMS chip is uniformly cooled throughout its whole thickness. It
can be visually observed in Figure 7.4c, temperature profile was confirmed in thermal image
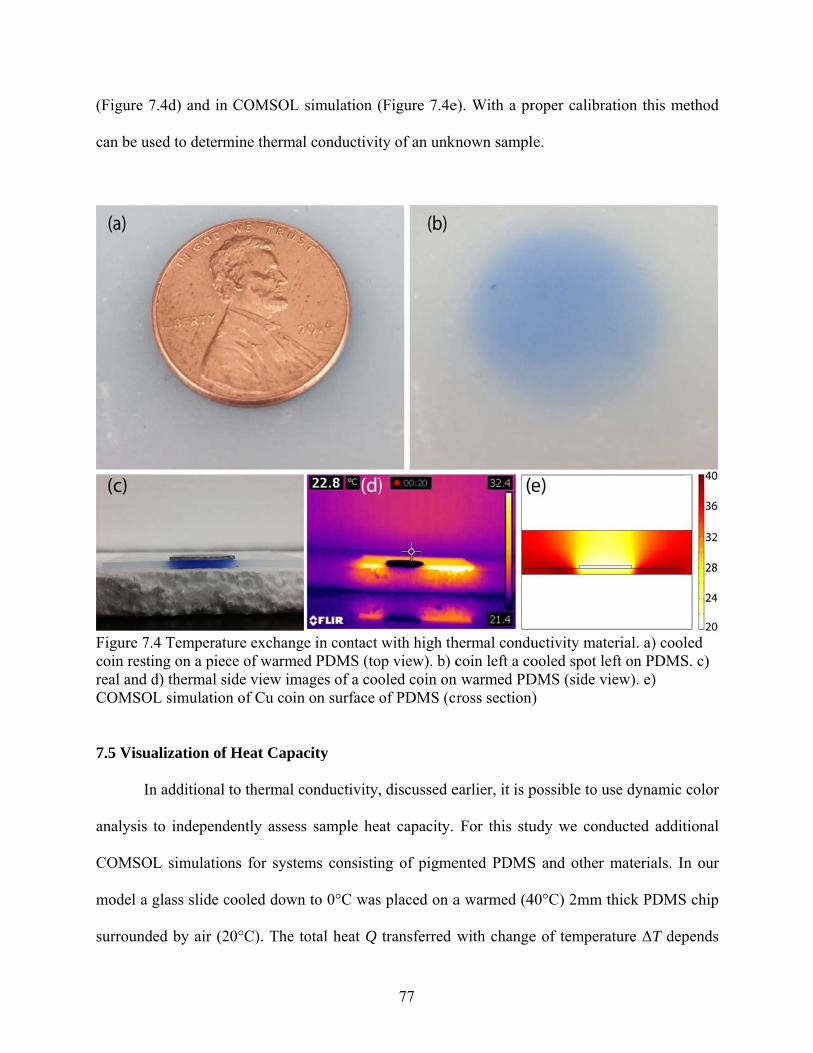
(Figure 7
can be us
Figure 7.coin restireal and dCOMSO
7.5 Visua
In
analysis
COMSO
model a
surround
7.4d) and in
sed to determ
.4 Temperatuing on a piecd) thermal siL simulation
alization of
n additional
to independ
L simulation
glass slide c
ded by air (2
COMSOL
mine thermal
ure exchangce of warmeide view iman of Cu coin
Heat Capac
to thermal c
dently assess
ns for syste
cooled down
20°C). The t
simulation (
l conductivit
e in contact d PDMS (toages of a coo
n on surface o
city
conductivity,
s sample hea
ms consistin
n to 0°C was
otal heat Q
77
(Figure 7.4e
ty of an unkn
with high thop view). b) coled coin onof PDMS (cr
, discussed e
at capacity.
ng of pigme
s placed on a
transferred
e). With a pr
nown sampl
hermal conducoin left a co
n warmed PDross section)
earlier, it is p
For this stu
ented PDMS
a warmed (4
with change
roper calibra
le.
uctivity mateooled spot le
DMS (side vi)
possible to u
udy we cond
S and other
40°C) 2mm t
e of tempera
ation this me
erial. a) cooleft on PDMSiew). e)
use dynamic
ducted addit
materials. In
thick PDMS
ature ΔT dep
ethod
led S. c)
color
tional
n our
S chip
pends

78
on object’s mass m and specific heat capacity c. Since mass can be found as product of volume V
and density ρ, the total heat that the object gains upon heating depends on its volume. Objects of
the same material with larger volume store more heat.
Q cm∆T cVρ∆T (7.2)
To demonstrate dependence of heat capacity on volume we varied thickness of the glass
sample, but kept the glass/PDMS contact area constant. We used the same PDMS chip for all the
simulations. As result of simulation we produced a plot showing dependence of the temperature
on thickness of the glass slide (changing along the x-axis), and the time of simulation (changing
along the y-axis) (Figure 7.5a). Different temperature ranges (30-40°C (1), 20-30°C (2) and 10-
20°C (3)) are shown in different color. The plot shows the dynamics with which the PDMS chip
gradually cools down to room temperature. Edge effects are also present in the simulation so
PDMS temperature was measured in the center of the slide, 0.1mm off the lower edge. The
simulations showed that in place of contact PDMS cools down faster with increasing thickness of
glass. The 1mm thick glass slide cools the PDMS chip down from 40°C to 25°C in more than 10
seconds while the 2mm one does that in just 5 seconds.

Figure 7.Experime
A
of cooled
chip and
(Figure 7
portable
slides ha
the color
extracted
each gla
.5 a) Heat mental setup,
Afterward, w
d glass with
d the coolin
7.5b). Image
low-cost ins
ave larger he
r inhomogen
d from the ce
ss slide thic
ap showing 1mm and 3m
we conducted
different thi
ng process w
e processing
strument for
eat capacity
neity due to
entral part o
ckness using
PDMS coolmm glass slid
d experiment
ickness were
was recorded
g can be ea
low income
and drain m
the edge ef
of the slide.
g the calibr
79
ing rate for ddes on a PDM
t under the c
e placed on t
d with a Sa
asily incorpo
e countries or
more heat fro
ffects, PDM
We plotted
ation curve
different thicMS chip
conditions us
the surface o
amsung Gal
orated in a
r measureme
om the warm
MS chip G co
PDMS chip
from the F
ckness of gla
sed in the sim
of warmed p
laxy S5 sm
mobile app
ent in the fie
med PDMS c
omponent c
p temperatur
Figure 7.2 (
ass b)
mulations. P
pigmented P
martphone ca
p [15] to ma
eld. Thicker
chip. Consid
color values
re versus tim
Figure 7.6).
Pieces
DMS
amera
ake a
glass
dering
were
me for
. The

experime
COMSO
Figure 7.slides
T
conductiv
reaches i
because
ental values
L data (Figu
.6 Simulated
The slope of
vity of the c
its maximum
they corres
are represe
ure 7.5a).
d (lines) and
f the curve
omposite. T
m capacity.
spond to sli
ented by dot
experimenta
shows the
The curve rea
The three c
des made o
80
ts, while the
al (dots) coo
heat transfe
aches saturat
curves have
of the same
e simulated
oling rate for
er rate that
tion as the h
e similar slo
e material b
curves wer
r 1mm, 2mm
correspond
heat transferr
opes and dif
but with dif
re extracted
m and 3mm g
ds to the the
red to glass s
fferent satur
fferent total
from
glass
ermal
slides
ration
heat

81
capacity. Therefore, similar analysis can be used for unknown samples to assess their heat
capacity and material thermal conductivity.
7.6 Visualization of Fluid Temperature in Microfluidic Channels
Finally, pigmented PDMS can be used for tracking fluid temperature on micro scale. A
number of processes conducted in microfluidic channels require precise temperature control. For
example nanochemistry [61], reactions involving proteins, cells and DNA molecules have to be
performed at narrow temperature windows [62]. Currently, precise and accurate measurement of
water temperature in microfluidic channel is challenging because of the following reasons: low
spatial resolutions in thermal cameras and large dimension of resistance based sensors prevent
getting accurate readings on a micro scale; while flowing through a microfluidic channel, fluid
temperature changes from contact with channel walls. We propose that pigmented PDMS can be
used to accurately assess local fluid temperature on a micro scale.
A pigmented PDMS microfluidic chip was fabricated to study fluid temperature. After
reaching steady state, fluid temperature in the channel is roughly equal to the temperature of the
surrounding walls which can be extracted from the color of pigmented PDMS. The spatial
resolution of this method depends on the size of pigment particles. Individual particles vary in
size from ~ 3 to 30 µm (Figure 7.7e). Based on the microscopy images in Figure 7.6 we can
conclude that this particle size does not produce any significant artifacts. A 1.1mm wide
capillary tube was molded into a pigmented PDMS chip to be used as a microfluidic channel. For
smaller channels, larger pigment particles can be filtered out and the solution can be sonicated to
ensure the absence of particle clusters.

Figure 7.water at 7back to r30 µm. f)electron b
T
Figure 7.
the chann
color we
between
individua
experime
four para
temperatu
boundary
.7 Pigmented73°C flows aoom temper
f) larger area beam)
To conduct th
.6 shows the
nel indicates
used the ca
the experim
al ambient l
ents. Figure
ameters inclu
ure axis to b
y values to m
d microfluidand heats theature state. escan shows
he experime
e flow of wa
s presence o
alibration cu
ments and t
ight conditio
7.2 has a Si
uding bound
build the cu
match the ex
dic PDMS che chip. c) che) SEM imagconsistency
ent, water at
ater through
of water flow
urve from Fig
they were t
ons for gett
igmoid Boltz
dary values o
urve. To reca
xperiment d
82
hip. a) microhip remains hge of the TCy in particles
73°C was p
the channel
w. To extrac
gure 7.2. Ho
taken with
ing color to
zmann curv
on color axis
alibrate the c
data (minimu
ofluidic chip heated after w
CP particles. s size (center
pumped into
l. Color chan
ct temperatu
owever, sinc
different ca
o temperatur
e to fit the d
s, color valu
curve for cu
um and max
in preliminawater is remDimensions
r area is dam
the channel
nge of chip
ure of the co
ce lighting c
ameras, we
re correlation
data points.
es range and
urrent experi
ximum value
ary state. b) moved. d) chis vary from 2
maged by the
l using a syr
area surroun
omposite fro
condition dif
had to con
n for each s
Its equation
d the midpoi
iment we ch
es on color a
ip is 2.5 to
ringe.
nding
om its
ffered
nsider
set of
n uses
int on
hange
axis).
83
We can determine that chip temperature changed from 26°C to 35°C in presence of hot water
(Figure 7.7a, b) using the updated calibration curve. This tells us that injected water significantly
cooled down from contact with the channel walls. It allows monitoring fluid temperature in
microfluidic channels.
7.7 Thermochromic Incubator
The PDMS based incubator design described in Chapter 6 can be fabricated with TCP to
create an alternative temperature feedback method. TCP activates at 31°C and saturates at 40°C
(Figure 7.2) making it perfect for pigmenting the heater to trace and maintain temperature at
37°C. Thermochromic readout can be performed with the optical system, described in Chapter 3.
7.7.1 Fabrication
Producing the PDMS incubator is described in Chapter 6.2. To make the heater reactive
to temperature, TCP was mixed into the pre-bakes mixture at 0.5wt%. The resulted prototype
(Figure 7.8a) has an opaque blue tint. To make in compatible with the mobile ELISA system, the
mold has to be reshaped to leave transparent openings under the microwells.
7.7.2 Testing
To test the design, we have filled the wells with 200µl of water and arranged them within
the incubator (Figure 7.8b). The temperature reading was done by a waterproof thermal probe
that was modulating the heating relays through an Arduino microcontroller. 2A current was used
to generate heat in the copper wiring. Additionally, the setup was imaged by a FLIR infrared
camera to ensure all the samples are being heated consistently (Figure 7.8c, d). The heating
profile of the individual wells matches the one from the original PDMS incubator. During
heating, the TCP activates and turns pale white. Heat distribution visualized with TCP (Figure

7.8b) ma
feedback
Figure 7.operationinfrared i
atches the he
k mechanism
.8 Thermochn, the incubaimage of the
eat palette u
m to ensure pr
hromic PDMator traces tee incubator in
used in infra
roper sample
MS incubatormperature chn operation
84
ared image (
e incubation
. a) prototyphange c) inf
(Figure 7.8d
n.
pe at room tefrared image
d). This crea
emperature b of the idle i
ates an addit
b) during incubator d)
tional
85
CHAPTER 8: FUTURE WORK
Current prototype is able to perform all key steps of ELISA procedure and sufficient for
clinical trials and further development. To completely satisfy point-of-care requirements, the
system has to perform all steps of ELISA procedure with the same level of precision and
accuracy as the current gold standard techniques. The three main challenges are making the
system fully autonomous, creating user-friendly interface and fitting the data sets with a custom
algorithm.
8.1 Autonomous Sample Loading
ELISA testing requires a 50µl bodily fluid sample. In the lab environment, the sample is
loaded into testing microwells using a variable volume pipette. To make the system user friendly
and ready for at-home use we need to make sample loading fully autonomous. The prototype
already has an on-board Arduino controller that can be used to power and manipulate the stepper
motors for sample loading and chemical distribution.
Current prototype of the MELISA system requires the operator to manually pipette the
samples and chemicals into the wells. That can be a difficult task for an untrained operator to
perform. To accomplish the system point-of-care goals, an automated liquid sample dispenser
needs to be designed. It can use a series of combination of peristaltic pumps and automatic
pipettes to allocate the necessary volume of sample and test chemicals into the testing well. The
test kit will come pre-loaded with chemicals specific to the testing hormone. Sample and
chemicals will be loaded into the well by an automatic pipette that consists of a micro syringe
with a motor controlled plunger. Stepper motor or a servo drive can be controlled by the Arduino

86
to push the plunger for a preset length. The Arduino can also control the peristaltic pump to wash
the wells in between incubating and chromogenic substrate adding phases. The samples can be
arranged it a circular pattern on a disk like holder. Another Arduino controlled motor can rotate
the disk like a dial to select the well before dispersing the chemicals. 3D render of proposed
sample dispenser is shown in Figure 8.1.
Figure 8.1 Proposed sample dispenser (artistic rendering). a) dispenser nozzles are arranged to match the wells b) close-up of the dispensing nozzles c) top view d) side view

87
8.2 Interface
In the current prototype, the Arduino microcontroller receives commands from a PC
through a USB port. The USB connection is used as a serial bus to transfer information and
commands to and from the microcontroller. In this interface setup, the smartphone is only used
for capturing the sample image. The image is then transferred to the PC and processed with
computer software. This setup allows for on the fly monitoring and adjusting the procedure
during the development. However, using the PC for system control and data processing goes
against the objective of making the system point-of-care.
The interface elements can be integrated into the system. The control functions can be
triggered by push buttons and the feedback elements like elapsed time, operating temperature
and testing step can be projected on a display located on one of the faces of the device.
Moreover, the image processing part can be performed directly on the mobile phone. Current
generation of smartphones have powerful enough hardware to process image, acquire RGB
values for the samples, fit the data set the processing algorithm and obtain concentration values
of unknown samples based on the calibration curve. It requires writing a smartphone app that can
access its camera, store the image in memory, detect RGB values of area of interest and calculate
the Boltzmann Sigmoid parameters. Such an interface satisfies point-of-care requirements and
overall increases user-friendliness.
8.3 Data Processing Algorithm
Current data processing algorithm requires six calibration samples to run in the same
assay as the test samples. The data set acquired with the concentration samples is being fitted
with an s-curve. When going from lab scale to point of care, the large amount of calibration
samples significantly increases the running cost of a single test. Fitting the data with an

88
algorithm such as the Boltzmann Sigmoid equation can reduce the required number of
calibration samples considerably reducing the running cost and increasing the system
availability. The equation parameters A1, A2, x0 and dx may express patterns that can be used for
making an adjusted fitting algorithm with less parameters and therefore requiring less calibration
samples. Testing this hypothesis requires collection of a large number of data sets and resolve the
Boltzmann equation parameters for each set. Collection of such an amount of data requires IRB
approved clinical trials.

89
CHAPTER 9: CONCLUSION
This project introduces a new mobile ELISA (MELISA) system for point of care
measurements of protein concentration. It is designed as a complete low cost mobile phone based
system allowing execution of all of the ELISA steps without any additional equipment. Design
of this system includes developing new algorithms for universal image processing, designing
rules for innovative mobile health systems and creating a comprehensive calibration protocol that
can be implemented on any portable device. We describe a new mobile phone based device that
simplifies and reduces the cost of current ELISA procedures, and demonstrates measurement of
progesterone in whole blood samples. Multiple samples with known concentrations of
progesterone were analyzed using the MELISA system and accuracy was verified using a gold
standard plate reader (Fisher Scientific AccuScan). A close correlation between mobile system
measurements and the data from the plate reader was demonstrated. We showed that the results
acquired with our prototype match the gold standard plate reader within 10%. We have designed,
developed and characterized a new polymer-based incubator with thermochromic feedback.
The translation of ELISA into point-of-care and home use will transform diagnosis and
monitoring of diseases, decrease the cost of healthcare, improve patients’ outcomes, and greatly
increase affordability and accessibility of biomedical testing. Finally, this dissertation lays out
the future work plan and expectations for the project completion. Mobile phone connection
capabilities can be used to create a wireless interface with the circuit microcontroller. Parameters
such as sample temperature, elapsed time and test phase can be transmitted via Bluetooth from
the Arduino paired with a wireless module. A mobile phone app can also act as a controller to

90
send commands such as “start testing”, “stop testing” or “turn on backlight” to the circuit
microcontroller.

91
REFERENCES
1. US Food and Drug Administration. "Food allergen partnership." Last accessed April 16
(2007).
2. Sblattero, D., et al. "Human recombinant tissue transglutaminase ELISA: an innovative
diagnostic assay for celiac disease." The American journal of gastroenterology 95.5 (2000):
1253-1257.
3. Filice, G., et al. "Sensitivity and specificity of anti-HIV ELISA employing recombinant (p24,
p66, gp120) and synthetic (gp41) viral antigenic peptides." Microbiologica 14.3 (1991): 185-
194.
4. Ambrosi, Adriano, Federico Airo, and Arben Merkoci. "Enhanced gold nanoparticle based
ELISA for a breast cancer biomarker." Analytical chemistry 82.3 (2009): 1151-1156.
5. McGeough, C. M., & O'Driscoll, S. (2013). Camera phone-based quantitative analysis of C-
reactive protein ELISA. IEEE transactions on biomedical circuits and systems, 7(5), 655-
659.
6. Vashist, S. K., van Oordt, T., Schneider, E. M., Zengerle, R., von Stetten, F., & Luong, J. H.
(2015). A smartphone-based colorimetric reader for bioanalytical applications using the
screen-based bottom illumination provided by gadgets. Biosensors and Bioelectronics, 67,
248-255.
7. Zangheri, Martina, et al. "A simple and compact smartphone accessory for quantitative
chemiluminescence-based lateral flow immunoassay for salivary cortisol
detection." Biosensors and Bioelectronics 64 (2015): 63-68.

92
8. Li, J., Land, L. P. W., Chattopadhyay, S., & Ray, P. (2008). E-Health readiness framework
from Electronic Health Records perspective. GlobDev 2008, 4.
9. Silva, B. M., Rodrigues, J. J., de la Torre Díez, I., López-Coronado, M., & Saleem, K.
(2015). Mobile-health: A review of current state in 2015. Journal of biomedical informatics,
56, 265-272.
10. Dunsmuir, D., Petersen, C., Karlen, W., Lim, J., Dumont, G. A., & Ansermino, J. M. (2012).
The Phone Oximeter for mobile spot-check. Anest Analg, 18-21.
11. Bellina, L., & Missoni, E. (2011). M-learning: mobile phones’ appropriateness and potential
for the training of laboratory technicians in limited-resource settings. Health and Technology,
1(2-4), 93-97.
12. Debono, Carl James, et al. "Cross-layer design for optimized region of interest of ultrasound
video data over mobile WiMAX." IEEE Transactions on Information Technology in
Biomedicine 16.6 (2012): 1007-1014.
13. Free, C., Phillips, G., Galli, L., Watson, L., Felix, L., Edwards, P., ... & Haines, A. (2013).
The effectiveness of mobile-health technology-based health behaviour change or disease
management interventions for health care consumers: a systematic review. PLoS medicine,
10(1), e1001362.
14. Chib, A., & Lin, S. H. (2018). Theoretical Advancements in mHealth: A Systematic Review
of Mobile Apps. Journal of health communication, 23(10-11), 909-955.
15. Archibong, Edikan, et al. "A mobile phone-based approach to detection of
hemolysis." Biosensors and Bioelectronics 88 (2017): 204-209.
16. Konnaiyan, Karthik Raj, et al. "mHealth dipstick analyzer for monitoring of pregnancy
complications." IEEE Sensors Journal (2017).

93
17. Jenkins, Carolyn, et al. "Stroke patients and their attitudes toward mHealth monitoring to
support blood pressure control and medication adherence." Mhealth 2 (2016).
18. Katz, Richard, Tsega Mesfin, and Karen Barr. "Lessons from a community-based mHealth
diabetes self-management program:“it's not just about the cell phone”." Journal of health
communication 17.sup1 (2012): 67-72.
19. Turner-McGrievy, Gabrielle M., et al. "Comparison of traditional versus mobile app self-
monitoring of physical activity and dietary intake among overweight adults participating in
an mHealth weight loss program." Journal of the American Medical Informatics
Association 20.3 (2013): 513-518.
20. Cheng, Chihwen, et al. "iACT-An interactive mHealth monitoring system to enhance
psychotherapy for adolescents with sickle cell disease." Engineering in Medicine and
Biology Society (EMBC), 2013 35th Annual International Conference of the IEEE. IEEE,
2013.
21. Catalani, Caricia, et al. "mHealth for HIV treatment & prevention: a systematic review of the
literature." The open AIDS journal 7 (2013): 17.
22. Koydemir, Hatice Ceylan, and Aydogan Ozcan. "Wearable and implantable sensors for
biomedical applications." Annual Review of Analytical Chemistry 11 (2018): 127-146.
23. Stahl, S. E., An, H. S., Dinkel, D. M., Noble, J. M., & Lee, J. M. (2016). How accurate are
the wrist-based heart rate monitors during walking and running activities? Are they accurate
enough?. BMJ open sport & exercise medicine, 2(1), e000106.
24. AL‐Khalidi, Farah Q., et al. "Respiration rate monitoring methods: A review." Pediatric
pulmonology 46.6 (2011): 523-529.

94
25. Gura, V., Beizai, M., Ezon, C., & Polaschegg, H. D. (2005). Continuous renal replacement
therapy for end-stage renal disease. In Cardiovascular Disorders in Hemodialysis (Vol. 149,
pp. 325-333). Karger Publishers.
26. Loveday, A., Sherar, L. B., Sanders, J. P., Sanderson, P. W., & Esliger, D. W. (2015).
Technologies that assess the location of physical activity and sedentary behavior: a
systematic review. Journal of medical Internet research, 17(8), e192.
27. Barton, J., O'Flynn, B., & Tedesco, S. (2017). A review of physical activity monitoring and
activity trackers for older adults.
28. Skandarajah, Arunan, et al. "Quantitative imaging with a mobile phone microscope." PloS
one 9.5 (2014): e96906.
29. Contreras-Naranjo, J. C., Wei, Q., & Ozcan, A. (2016). Mobile phone-based microscopy,
sensing, and diagnostics. IEEE Journal of Selected Topics in Quantum Electronics, 22(3), 1-
14.
30. Snow, J. W., Koydemir, H. C., Karinca, D. K., Liang, K., Tseng, D., & Ozcan, A. (2019).
Rapid imaging, detection, and quantification of Nosema ceranae spores in honey bees using
mobile phone-based fluorescence microscopy. Lab on a Chip, 19(5), 789-797.
31. Hernández‐Neuta, Iván, et al. "Smartphone‐based clinical diagnostics: towards
democratization of evidence‐based health care." Journal of internal medicine 285.1 (2019):
19-39.
32. Wei, Qingshan, et al. "Detection and spatial mapping of mercury contamination in water
samples using a smart-phone." ACS nano 8.2 (2014): 1121-1129.

95
33. Wróbel, S. (2014). Modification of ELISA by replacing incubation of microtiter plates in an
incubator with their shaking in PVY, PVM and PLRV detection. American journal of potato
research, 91(4), 354-362.
34. Mushens, R. E., & Scott, M. L. (1990). A fast and efficient method for quantification of
monoclonal antibodies in an ELISA using a novel incubation system. Journal of
immunological methods, 131(1), 83-89.
35. Thermo Fisher Scientific Corporation “Fisher Scientific accuSkan FC User Manual”
36. raj Konnaiyan, Karthik. Smartphone Based 3D Printed Colorimeter for Biomedical
Applications. University of South Florida, 2015.
37. Zhdanov, Arsenii, et al. "Mobile phone based ELISA (MELISA)." Biosensors and
Bioelectronics 103 (2018): 138-142.
38. Barbagallo, Mario, et al. "Vascular effects of progesterone: role of cellular calcium
regulation." Hypertension 37.1 (2001): 142-147.
39. Xu, Bei, et al. "Serum progesterone level effects on the outcome of in vitro fertilization in
patients with different ovarian response: an analysis of more than 10,000 cycles." Fertility
and sterility 97.6 (2012): 1321-1327.
40. Csapo, A. I., O. Pohanka, and H. L. Kaihola. "Progesterone deficiency and premature
labour." Br Med J 1.5899 (1974): 137-140.
41. Stopińska-Głuszak, Urszula, et al. "Effect of estrogen/progesterone hormone replacement
therapy on natural killer cell cytotoxicity and immunoregulatory cytokine release by
peripheral blood mononuclear cells of postmenopausal women." Journal of reproductive
immunology69.1 (2006): 65-75.
42. DCE004, R. E. F., and IVD LOT. "17OH PROGESTERONE ELISA for routine analysis."

96
43. Hirsch, Robert. Exploring Color Photography Fifth Edition: From Film to Pixels. Taylor &
Francis, 2013.
44. Kim, J. Julie, Takeshi Kurita, and Serdar E. Bulun. "Progesterone action in endometrial
cancer, endometriosis, uterine fibroids, and breast cancer." Endocrine reviews 34.1 (2013):
130-162.
45. Yoshimi, T., & Lipsett, M. B. (1968). The measurement of plasma progesterone. Steroids,
11(4), 527-540.
46. Abraham, G. E., Hopper, K., Tulchinsky, D., Swerdloff, R. S., & Odell, W. D. (1971).
Simultaneous measurement of plasma progesterone, 17-hydroxyprogesterone and estradiol-
17B by radioimmunoassay. Analytical Letters, 4(6), 325-335.
47. Inder, W. J., Dimeski, G., & Russell, A. (2012). Measurement of salivary cortisol in 2012–
laboratory techniques and clinical indications. Clinical endocrinology, 77(5), 645-651.
48. Shin, Young Shik, et al. "PDMS-based micro PCR chip with parylene coating." Journal of
Micromechanics and Microengineering 13.5 (2003): 768.
49. Dahlgren, Anna, Göran Kecklund, and Torbjörn Åkerstedt. "Different levels of work-related
stress and the effects on sleep, fatigue and cortisol." Scandinavian Journal of Work,
Environment and Health 31.4 (2005): 277-285.
50. Dahlgren, Anna, Göran Kecklund, and Torbjörn Åkerstedt. "Overtime work and its effects on
sleep, sleepiness, cortisol and blood pressure in an experimental field study." Scandinavian
Journal of Work, Environment and Health 32.4 (2006): 318-327.
51. Nijm, Johnny, and Lena Jonasson. "Inflammation and cortisol response in coronary artery
disease." Annals of medicine 41.3 (2009): 224-233.
97
52. Luo, Lanlan, et al. "Cortisol supplement combined with psychotherapy and citalopram
improves depression outcomes in patients with hypocortisolism after traumatic brain injury."
Aging and disease 6.6 (2015): 418.
53. Deman, A. L., Brun, M., Quatresous, M., Chateaux, J. F., Frénéa-Robin, M., Haddour, N., ...
& Ferrigno, R. (2011). Characterization of C-PDMS electrodes for electrokinetic applications
in microfluidic systems. Journal of Micromechanics and Microengineering, 21(9), 095013.
54. Li, J., Zhang, M., Wang, L., Li, W., Sheng, P., & Wen, W. (2011). Design and fabrication of
microfluidic mixer from carbonyl iron–PDMS composite membrane. Microfluidics and
nanofluidics, 10(4), 919-925.
55. Fang, C., Shao, L., Zhao, Y., Wang, J., & Wu, H. (2012). A gold nanocrystal/poly
(dimethylsiloxane) composite for plasmonic heating on microfluidic chips. Advanced
Materials, 24(1), 94-98.
56. Hsu, E., Mertens, T., Paris, S., Avidan, S., & Durand, F. (2008, August). Light mixture
estimation for spatially varying white balance. In ACM transactions on graphics (TOG) (Vol.
27, No. 3, p. 70). ACM.
57. A. Foi, M. Trimeche, V. Katkovnik, K. Egiazarian, IEEE Transactions on Image Processing.
(2008), 17, 1737.
58. Novinson, T. (1996). U.S. Patent No. 5,480,482. Washington, DC: U.S. Patent and
Trademark Office.
59. Cheemalapati, Surya, et al. "Dynamic visualization of photothermal heating by gold
nanocages using thermoresponsive elastin like polypeptides." Nanoscale 8.45 (2016): 18912-
18920.

98
60. Seeboth, A., Lötzsch, D., Ruhmann, R., & Muehling, O. (2014). Thermochromic Polymers・
Function by Design. Chemical reviews, 114(5), 3037-3068.
61. Gedanken, A. (2003). Sonochemistry and its application to nanochemistry. Current science,
1720-1722.
62. Liu, Q., Kasuga, M., Sakuma, Y., Abe, H., & Miura, S. (15). Yamaguchi-Shinozaki, K., and
Shinozaki, K.(1998). Two transcription factors, DREB1 and DREB2, with an EREBP/AP2
DNA binding domain separate two cellular signal transduction pathways in drought-and low-
temperature-responsive gene expression, respectively. Arabidopsis. Plant Cell, 10, 1391-
1406.
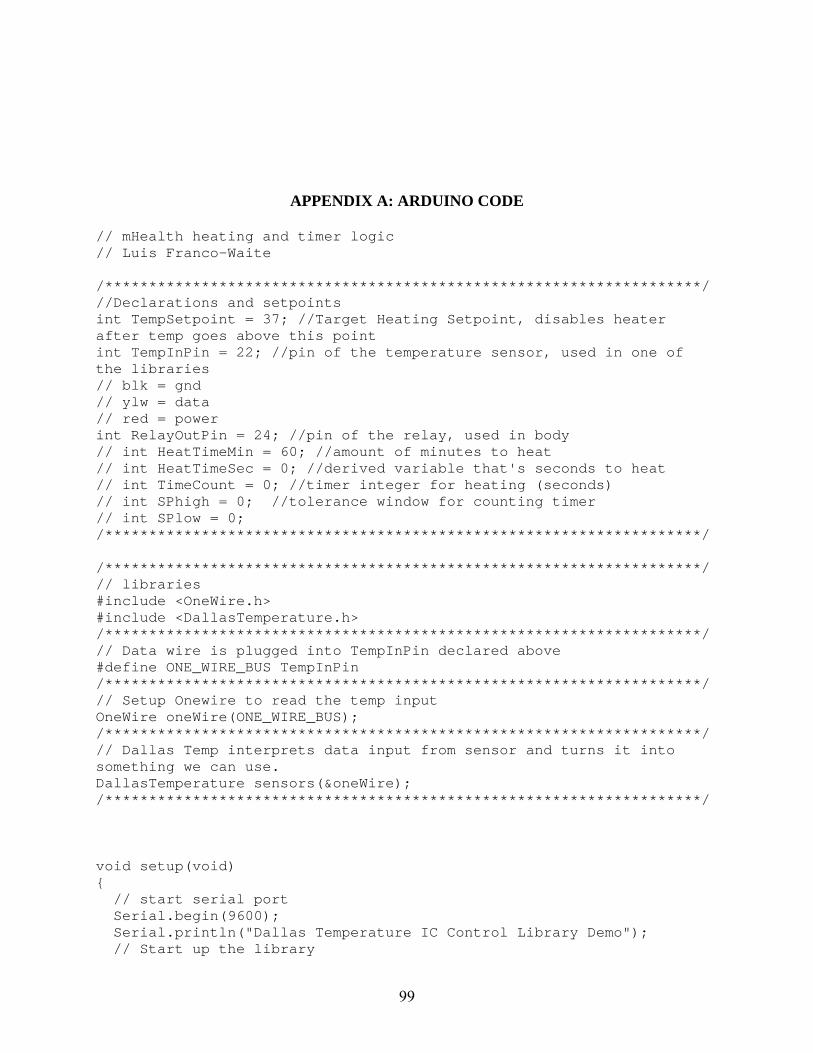
99
APPENDIX A: ARDUINO CODE
// mHealth heating and timer logic // Luis Franco-Waite /********************************************************************/ //Declarations and setpoints int TempSetpoint = 37; //Target Heating Setpoint, disables heater after temp goes above this point int TempInPin = 22; //pin of the temperature sensor, used in one of the libraries // blk = gnd // ylw = data // red = power int RelayOutPin = 24; //pin of the relay, used in body // int HeatTimeMin = 60; //amount of minutes to heat // int HeatTimeSec = 0; //derived variable that's seconds to heat // int TimeCount = 0; //timer integer for heating (seconds) // int SPhigh = 0; //tolerance window for counting timer // int SPlow = 0; /********************************************************************/ /********************************************************************/ // libraries #include <OneWire.h> #include <DallasTemperature.h> /********************************************************************/ // Data wire is plugged into TempInPin declared above #define ONE_WIRE_BUS TempInPin /********************************************************************/ // Setup Onewire to read the temp input OneWire oneWire(ONE_WIRE_BUS); /********************************************************************/ // Dallas Temp interprets data input from sensor and turns it into something we can use. DallasTemperature sensors(&oneWire); /********************************************************************/ void setup(void) { // start serial port Serial.begin(9600); Serial.println("Dallas Temperature IC Control Library Demo"); // Start up the library

100
sensors.begin(); pinMode(RelayOutPin, OUTPUT); //need this to get the relays working // HeatTimeSec = HeatTimeMin * 60; } void loop(void) { // call sensors.requestTemperatures() to issue a global temperature // request to all devices on the bus Serial.print(" Requesting temperatures..."); sensors.requestTemperatures(); // Send the command to get temperature readings Serial.println("DONE"); Serial.print("Temperature is: "); Serial.print(sensors.getTempCByIndex(0)); // Why "byIndex"? // You can have more than one DS18B20 on the same bus, but not doing that in this case. // 0 refers to the first IC on the wire delay(1000); //Logic for heating deadband if (sensors.getTempCByIndex(0) <= TempSetpoint) //sensors.gettempcbyindex is where the temp information is stored { digitalWrite(RelayOutPin, LOW); } if (sensors.getTempCByIndex(0) > TempSetpoint) { digitalWrite(RelayOutPin, HIGH); } // Logic for timer // SPhigh = TempSetpoint + 1.5; // SPlow = TempSetpoint - 1.5; // while (SPlow <= sensors.getTempCByIndex(0) <= SPhigh) // { // Timecount++; // delay(1000); // if (Timecount == HeatTimeSec) // { // } // } }

APPEENDIX B: HEA
101
ATER CIRCUUIT DIAGRAMM

102
APPENDIX C: COPYRIGHT INFORMATION