metabolic network modelling of nitrification and
TRANSCRIPT

1
Metabolic network modelling of nitrification and denitrification under
cyanogenic conditions
By
Ncumisa Mpongwana Student number: 209013451
Thesis submitted in fulfilment of the requirements for the degree Doctor of Engineering in Chemical Engineering
Faculty of Engineering and Built Environment Cape Peninsula University of Technology
Supervisor: Prof. S.K.O. Ntwampe Co-Supervisor: Dr. E.I. Omodanisi
Co-Supervisor: Dr. B.S. Chidi
Cape Town
December 2019 CPUT copyright information
The thesis may not be published either in part (in scholarly, scientific or technical journals), or as a whole (as a monograph), unless permission has been obtained from the University

ii
DECLARATION
I, Ncumisa Mpongwana, declare that the contents of this thesis represent my own unaided work and that
the thesis has not previously been submitted for academic examination towards any qualification.
Furthermore, it represents my own opinions and not necessarily those of the Cape Peninsula University of
Technology and the national research foundation of South Africa.
All intellectual concepts, theories, methodologies, and material derivations and model developments used
in this thesis and published in various scientific journals (except those that the candidate is not the first
author in) were derived solely by the candidate and first author of the published manuscripts. Were
appropriate intellectual property of others was acknowledged by using appropriate references. The
contribution of co-authors for the conference and the published manuscript was in training capacity,
research assistance and supervisory capacity.
Signed: Date: 20 Jan 2019

iii
ABSTRACT
Simultaneous nitrification and aerobic denitrification (SNaD) is a preferred method for single stage total
nitrogen (TN) removal, which was recently proposed to improve wastewater treatment plant design.
However, SNaD processes are prone to inhibition by toxicant loading with free cyanide (CN-) possessing
the highest inhibitory effect on such processes, rendering these processes ineffective. Despite the best
efforts of regulators to limit toxicant disposal into municipal wastewater sewage systems (MWSSs), free
cyanide (CN-) still enters MWSSs through various pathways; hence, it has been suggested that CN- resistant
or tolerant microorganisms be utilized for processes such as SNaD. To mitigate toxicant loading, organisms
in SNaD have been observed to adopt a multiphase growth strategy to sequentially degrade CN- during
primary growth and subsequently degrade TN during the secondary growth phase. However, CN- degrading
microorganisms are not widely used for SNaD in MWSSs due to the inadequate application of suitable
microorganisms (Chromobacterium violaceum, Pseudomonas aeruginosa, Thiobacillus denitrificans,
Rhodospirillum palustris, Klebsiella pneumoniae, and Alcaligenes faecalis) commonly used in single-stage
SNaD.
The use of CN- degrading or resistant microorganisms for SNaD is a cost-effective method compared to the
use of other methods of CN- removal prior to TN removal, as they involve multi-stage systems (as currently
observed in MWSSs). The use of CN- degrading microorganisms, particularly when used as a consortium,
presents a promising and sustainable resolution to mitigate inhibitory effects of CN- in SNaD. However,
SNaD is known to be completely inhibited by CN- thus it is imperative to also study some thermodynamic
parameters of SNaD under high CN- conditions to see the feasibility of the process. The Gibbs free energy
is significant to understand the feasibility of SNaD, it is also vital to study Gibbs free energy to determine
whether or not the biological reaction is plausible. The relationship between the rate of nitrification and
Gibbs free energy was also investigated.
The attained results showed that up to 37.55 mg CN-/L did not have an effect on SNaD. The consortia
degraded CN- and achieved SNaD, with degradation efficiency of 92.9 and 97.7% while the degradation
rate of 0.0234 and 0.139 mg/L/hr for ammonium-nitrogen (NH4-N) and CN- respectively. Moreover, all the
free Gibbs energy was describing the individual processes were found to be negative, with the lowest Gibbs
free energy being -756.4 and -1830.9 Kcal/mol for nitritation and nitratation in the first 48 h of the
biological, reaction respectively. Additionally, a linear relationship between the rate of NH4-N and nitrite-
nitrogen (NO2-N) degradation with their respective Gibbs free energy was observed. Linear model was also
used to predict the relationship between NH4-N, NO2-N degradation and Gibbs free energy. These results
obtained showed a good correlation between the models and the experimental data with correlation
efficiency being 0.94 and 0.93 for nitritation, and nitratation, respectively.

iv
From the results found it can be deduced that SNaD is plausible under high cyanide conditions when
cyanide degrading or tolerant microorganisms are employed. This can be a sustainable solution to SNaD
inhibition by CN- compounds during wastewater treatment.
Furthermore, a single strain was purified from the consortium and identified as Acinetobacter courvalinii.
This bacterial strain was found to be able to perform sequential CN- degradation, and SNaD; an ability
associated with multiphase growth strategy of the microorganism when provided with multiple nitrogenous
sources, i.e. CN- and TN. The effect of CN- on nitrification and aerobic denitrification including enzyme
expression, activity and protein functionality of Acinetobacter courvalinii was investigated. It was found
that CN- concentration of up to 5.8 mg CN-/L did not affect the growth of Acinetobacter courvalinii. In
cultures whereby the A. courvalinii isolate was used, degradation rates of CN- and NH4-N were found to be
2.2 mg CN-/L/h and 0.40 mg NH4-N/L/h, respectively. Moreover, the effect of CN- on NH4-N, nitrate-
nitrogen (NO3-N) and NO2-N oxidizing enzymes was investigated, with findings indicating CN- did not
affect the expression and activity of ammonia monooxygenase (AMO), but affected the activity of nitrate
reductase (NaR) and nitrite reductase (NiR). Nevertheless, a slow decrease in NO2-N was observed after
the addition of CN- thus confirming the activity of NaR and the activation of the denitrification pathway by
the CN-. Moreover, five models’ (Monod, Moser, Rate law, Haldane, and Andrew’s model) ability to
predict SNaD under CN- conditions, indicated that only Rate law, Haldane and Andrew’s models, were
suited to predict both SNaD and CN- degradation. Due to low degradation rates of NH4-N and CN-,
optimization of SNaD was essential. Therefore, response surface methodology was used to optimize the
SNaD under CN- conditions.
The physiological parameters that were considered for optimization were temperature and pH; with the
result showing that the optimum for pH and temperature was 6.5 and 36.5oC respectively, with NH4-N and
CN- degradation efficiency of 50 and 80.2%, respectively. Furthermore, the degradation kinetics of NH4-N
and CN- were also studied under the optimum conditions in batch culture reactors, and the results showed
that up to 70.6% and 97.3% of NH4-N and CN- were simultaneously degraded with degradation rates of
0.66 and 0.41 mg/L/h, respectively. The predictive ability of RSM was further compared with cybernetic
models, and cybernetic models were found to better predict SNaD under CN- conditions. These results
exhibited a promising solution in the management of inhibition effected of CN- towards SNaD at an
industrial scale.
Keywords: Aerobic denitrification; ammonia-oxidizing; biological nitrogen removal; cybernetic model;
diauxic; free cyanide; Gibbs free energy; metabolic network; metabolism; modeling; nitrification;
nitrification; nitrite-oxidizing bacteria; RSM models; simultaneous nitrification and aerobic denitrification;
total nitrogen; wastewater treatment;

v
DEDICATION
I dedicate this thesis to all the family and friends that supported me throughout this journey, especial my mother (uMamthembu, Qhudeni, uMpafane, Umvelase uNgoza uMkhubukeli umakhonza egoduka), my late father (Unkwali, UBhukula, uMkwanase) and my baby Thalam who give me strength when I didn’t think it was possible for me to finish my studies.

vi
ACKNOWLEDGEMENTS
I would like to thank the following people and organizations:
• God for the courage and strength,
• My family for their support throughout this journey,
• Lukhanyo Yolwa for supporting me and babysitting my baby during my studies, • My supervisors Prof. SKO Ntwampe, Dr. EI Omodanisi, and Dr. BS Chidi their assistance and
guidance and technical advice throughout my studies,
• Cynthia Dlangamandla, Melody Mukandi, and Dr. Christine technical advice,
• Yolanda Mpentshu, Nkosikho Dlangamandla, Lukhanyo Mekuto and Zandile Jingxie for their
technical support and advice,
• My Friends Nangamso Cawe, Mathabo Ludaka, Zandile Mdingi, Cynthia Dlangamandla and
Thuletu Mbita for always being there for me throughout my hardships,
• The University Research Fund (RK16) and the National Research Foundation for financial support
of this research, and
• All the postgraduate students at Bioresource Engineering Research Group (BioERG), Faculty of
Applied Sciences, CPUT.

vii
RESEARCH OUTPUTS
The following research outputs represent the contributions of the candidate to scientific knowledge and
development during the doctoral candidacy (2017-2020):
DHET accredited manuscripts published/accepted for publication forming part of this thesis
N. Mpongwana, S.K.O. Ntwampe, E.I. Omodanisi, B.S. Chidi, and L.C. Razanamahandry. 2019.
Sustainable Approach to Eradicate the Inhibitory Effect of Free-Cyanide on Simultaneous Nitrification and
Aerobic Denitrification during Wastewater Treatment. Sustainability 2019, 11(21), 6180;
https://doi.org/10.3390/su11216180 (Impact Factor: 2.592)
Ncumisa Mpongwana, Seteno K. O. Ntwampe, Boredi S. Chidi, Elizabeth I. Omodanisi. 2019. Kinetic
Modelling of Free Energy for Simultaneous Nitrification and Aerobic Denitrification under High Cyanide
Environments. 16th SOUTH AFRICAN International Conference on Agricultural, Chemical, Biological and
Environmental Science (ACBES-19) Nov. 18-19 2019 Johannesburg (South Africa). Pp 305-306, ISBN–
978-81-943403-0-0, https://doi.org/10.17758/EARES8.EAP1119149
Ncumisa Mpongwana, Seteno Karabo Obed Ntwampe, Elizabeth Ife Omodanisi, Boredi Silas Chidi,
Lovasoa Christine Razanamahandry, Cynthia Dlangamandla, Melody Ruvimbo Mukandi. Bio-kinetics of
simultaneous nitrification and aerobic denitrification (SNaD) by a cyanide degrading bacteria under
cyanide-laden Conditions. Submitted to Applied Sciences Manuscript ID: applsci-702267 (Accepted)
(Impact factor: 2.217)
Submitted manuscripts
N. Mpongwana, S. K. O. Ntwampe, E. I. Omodanisi, B.S. Chidi, C. Dlangamandla, M.R. Mukandi.
Significance of metabolic network modelling of total nitrogen removal in simultaneous nitrification and
aerobic denitrification. Submitted to Bioengineering (under review)
Ncumisa Mpongwana, Seteno Karabo Obed Ntwampe, Lovasoa Christine Razanamahandry, Boredi Silas
Chidi, Elizabeth Ife Omodanisi. Predictive capability of response surface methodology and cybernetic
models for cyanogenic simultaneous nitrification and aerobic denitrification (SNaD) facilitated by cyanide-
resistant bacteria. Submitted to Microorganisms (under review)

viii
LAYOUT OF THESIS
The general aim of this research study was to elucidate the metabolic network and modeling of simultaneous
nitrification and aerobic denitrification (SNaD) under cyanogenic conditions using CN- resistant/ tolerant
microorganisms for SNaD as a single-stage process under CN-. The experimental part of this study was
conducted at the Cape Peninsula University of Technology, Bioresource Engineering Research Group
(BioERG), South Africa. The references at the end of this thesis are listed in accordance with the CPUT
Harvard method of referencing.
The thesis is divided into the following chapters:
• Chapter 1: Introduction; this chapter provides background information about total nitrogen
biological removal and the challenges that affect total nitrogen removal, particularly inhibition of
nitrification and aerobic denitrification by cyanide compounds. Additionally, it provides a problem
statement, hypothesis, objectives, significance of study and delineation.
• Chapter 2: This chapter focuses on the literature consulted for which the detailed background of
the developments and the challenges that are experienced during SNaD are explained, moreover,
the sustainable methods to resolve these challenges are also reviewed.
• Chapter 3: This chapter focuses on literature consulted to highlight the significance of metabolic
network modeling in wastewater treatment plants; furthermore, the cybernetic modeling approach
is also reviewed.
• Chapter 4: This chapter lists the materials and methods used to achieve the aims of the study.
• Chapter 5: This chapter focuses on the kinetic modelling of free energy for SNaD under a high
cyanide environment.
• Chapter 6: This chapter focuses on the biokinetics of SNaD by cyanide degrading bacteria under
cyanide laden conditions.
• Chapter 7: The results on the predictive capability of RSM and cybernetic models for cyanogenic
SNaD facilitated by cyanide resistant bacteria, are listed in this chapter.
• Chapter 8: This chapter presents the overall summary and conclusions and also provides answers
to the research question listed in Chapter 1. Recommendations for future research, are also listed
in this chapter.

ix
• Chapter 9: This chapter consists of literature citations used in this study, in accordance with the
CPUT Harvard style of referencing.
10
TABLE OF CONTENTS
DECLARATION .......................................................................................................................................... ii
ABSTRACT ................................................................................................................................................. iii
DEDICATION .............................................................................................................................................. v
ACKNOWLEDGEMENTS ......................................................................................................................... vi
RESEARCH OUTPUTS ............................................................................................................................. vii
LAYOUT OF THESIS .............................................................................................................................. viii
LIST OF FIGURES .................................................................................................................................... 14
LIST OF TABLES ...................................................................................................................................... 16
GLOSSARY ............................................................................................................................................... 18
CHAPTER 1 ............................................................................................................................................... 23
INTRODUCTION ...................................................................................................................................... 23
1.1. Introduction ................................................................................................................................. 23
1.2. Problem statement ....................................................................................................................... 23
1.3. Hypothesis................................................................................................................................... 24
1.4. Research questions ...................................................................................................................... 24
1.5. Aims and objectives .................................................................................................................... 24
1.6. Delineation of the study .............................................................................................................. 25
1.7. Significance of the research ........................................................................................................ 25
CHAPTER 2: .............................................................................................................................................. 28
LITERATURE REVIEW 1 ........................................................................................................................ 28
2.1. Introduction ...................................................................................................................................... 28
2.2. Nitrification and Subsequent Denitrification: An Obsolete Technology ......................................... 29
2.3. Recent Advances in Nitrification and Denitrification Processes: Future Perspectives .................... 34
2.4. Overall Remarks on Simultaneous Nitrification and Aerobic Denitrification (SNaD): Advances and Limitations .............................................................................................................................................. 37
2.5. Challenges in Simultaneous Nitrification and Aerobic Denitrification (SNaD) processes.............. 37
2.6. Prevention of Biomass Washout During the Start-Up of SNaD ...................................................... 38
2.7. Inhibition Mechanism of Simultaneous Nitrification and Aerobic Denitrification by Pollutants ... 39
2.8. FCN Wastewater in Municipal Wastewater Sewage Systems (MWSSs) and Its Impact on Nitrification and Denitrification: A Culture of Illegal Wastewater Dumping ........................................ 40
2.9. Current Solutions to the Challenges in Simultaneous Nitrification and Aerobic Denitrification (SNaD) .................................................................................................................................................... 41
2.9.1. Physical Process Used as Remedial Strategy to Decrease the Inhibitory Effect of FCN on SNaD ................................................................................................................................................... 41
2.9.2. Biological Systems Responsible for Lowering FCN Concentration Prior to SNaD ................. 42
2.9.3. Overall Remarks on Remedial Strategies in Place to Mitigate FC in SNaD ............................ 43

11
2.10. A Proposed Sustainable Solution: Environmental Benignity at the Core of SNaD Development 43
2.10.1. Application of FCN Resistant Microorganisms in Simultaneous Nitrification and Aerobic Denitrification (SNaD) Under Cyanogenic Conditions ...................................................................... 43
2.11. Conclusion ..................................................................................................................................... 45
CHAPTER 3: .............................................................................................................................................. 48
LITERATURE REVIEW 2 ........................................................................................................................ 48
3.1. Introduction ...................................................................................................................................... 48
3.2. Biological wastewater treatment: Total Nitrogen (TN) removal ..................................................... 49
3.3. Microbial population and contaminant metabolism in wastewater .................................................. 51
3.3.1. Microbial metabolic interactions in wastewater treatment ....................................................... 51
3.3.2. Microbial metabolism during the removal of TN in wastewater treatment plant ..................... 52
3.4. The role of Thermodynamics and Stoichiometric analysis in metabolic networking ...................... 53
3.5. Metabolic pathways identified in the biological treatment of wastewater ....................................... 53
3.6. Metabolic network modeling in wastewater treatment .................................................................... 55
3.6.1. Significance of metabolic network modeling in the wastewater treatment............................... 55
3.6.2. Suitable metabolic network modeling approaches for biological wastewater treatment .......... 56
3.6.3. Flux balance approach (FBA) for modeling wastewater treatment plant ................................. 61
3.6.4. Cybernetic modeling ................................................................................................................. 62
3.7. Conclusions ...................................................................................................................................... 64
CHAPTER 4: .............................................................................................................................................. 66
MATERIALS AND METHODS ................................................................................................................ 66
4.1. General background ......................................................................................................................... 66
4.1. PHASE 1: Thermodynamic evaluation of SNaD under cyanide-laden conditions .......................... 66
4.1.1. Isolation and Inoculum Development ....................................................................................... 66
4.1.2. Reactor Experimental Runs ...................................................................................................... 66
4.1.3. Bioenergetic/Thermodynamic Models ...................................................................................... 67
4.2. PHASE 2: Assessing the predictive capability of existing models .................................................. 68
4.2.1. Isolation and identification of the bacterial isolate of interest .................................................. 68
4.2.2 Batch culture experiments .......................................................................................................... 68
4.2.3. Enzyme extraction..................................................................................................................... 69
4.2.4. Analytical procedure(s) ............................................................................................................. 69
4.2.5. Kinetics model developed ......................................................................................................... 69
4.2.6. Regression of experimental data and estimation of model kinetic parameters ......................... 70
4.2.7. Data handling and kinetic parameters ....................................................................................... 71
4.3. PHASE 3: Optimisation and evaluation of predictive ability of RSM and Cybernetic models .. 71
4.4. Microbial isolation and identification ......................................................................................... 71
4.5. Response surface methodology ........................................................................................................ 71
4.5.1. Central composite design experiments...................................................................................... 71

12
4.6. Statistics analyses ............................................................................................................................. 73
4.7. Cybernetic model ............................................................................................................................. 73
4.7.1. Batch culture experiment .......................................................................................................... 73
4.7.2. Enzyme activity assessments .................................................................................................... 74
4.7.3. Analytical procedure ................................................................................................................. 74
4.7.4. Model development................................................................................................................... 74
CHAPTER 5: .............................................................................................................................................. 78
KINETIC MODELLING OF FREE ENERGY FOR SIMULTANEOUS NITRIFICATION AND AEROBIC DENITRIFICATION UNDER HIGH CYANIDE ENVIRONMENTS .................................. 78
5.1. Introduction ................................................................................................................................. 78
5.2. Objectives ................................................................................................................................... 78
5.3. Materials and methods ................................................................................................................ 79
5.4. Result and Discussion ................................................................................................................. 79
5.5. Conclusion .................................................................................................................................. 83
CHAPTER 6: .............................................................................................................................................. 85
BIO-KINETICS OF SIMULTANEOUS NITRIFICATION AND AEROBIC DENITRIFICATION (SNAD) BY A CYANIDE DEGRADING BACTERIA UNDER CYANIDE-LADEN CONDITIONS .. 85
6.1. Introduction ...................................................................................................................................... 85
6.2. Objectives ........................................................................................................................................ 86
6.3. Materials and methods ..................................................................................................................... 86
6.4. Results and Discussion .................................................................................................................... 87
6.4.1. Identification of bacterial Isolate .............................................................................................. 87
6.4.2. Degradation kinetics of Cyanide and NH4-N ............................................................................ 87
6.4.3. Effect of Cyanide on AMO, NaR, and NiR .............................................................................. 95
6.5. Conclusions ...................................................................................................................................... 97
CHAPTER 7: .............................................................................................................................................. 99
PREDICTIVE CAPABILITY OF RESPONSE SURFACE METHODOLOGY AND CYBERNETIC MODELS FOR CYANOGENIC SIMULTANEOUS NITRIFICATION AND AEROBIC DENITRIFICATION (SNAD) FACILITATED BY CYANIDE-RESISTANT BACTERIA ................... 99
7.1. Introduction ................................................................................................................................. 99
7.2. Objectives ................................................................................................................................. 101
7.3. Materials and methods .............................................................................................................. 101
7.4. Results and discussion .............................................................................................................. 102
7.4.1. Predictive ability of Response Surface Methodology ............................................................. 102
7.4.1.1. Analysis of variance (ANOVA) for TN removal ................................................................. 102
7.4.1.2. Batch reactor experiment and model simulations ................................................................ 104
7.5. Prediction ability of RSM in comparison to cybernetic models .................................................... 105
7.6. TN/ CN- biocatalysis ...................................................................................................................... 107

13
7.7. Conclusion ..................................................................................................................................... 108
CHAPTER 8: ............................................................................................................................................ 111
SUMMARY AND CONCLUSION.......................................................................................................... 111
8.1 Summary and Conclusions........................................................................................................ 111
8.2 Recommendations for future work ........................................................................................... 112
CHAPTER 9: ............................................................................................................................................ 115
CHAPTER 10: .......................................................................................................................................... 132
APPENDIX A ........................................................................................................................................... 132
14
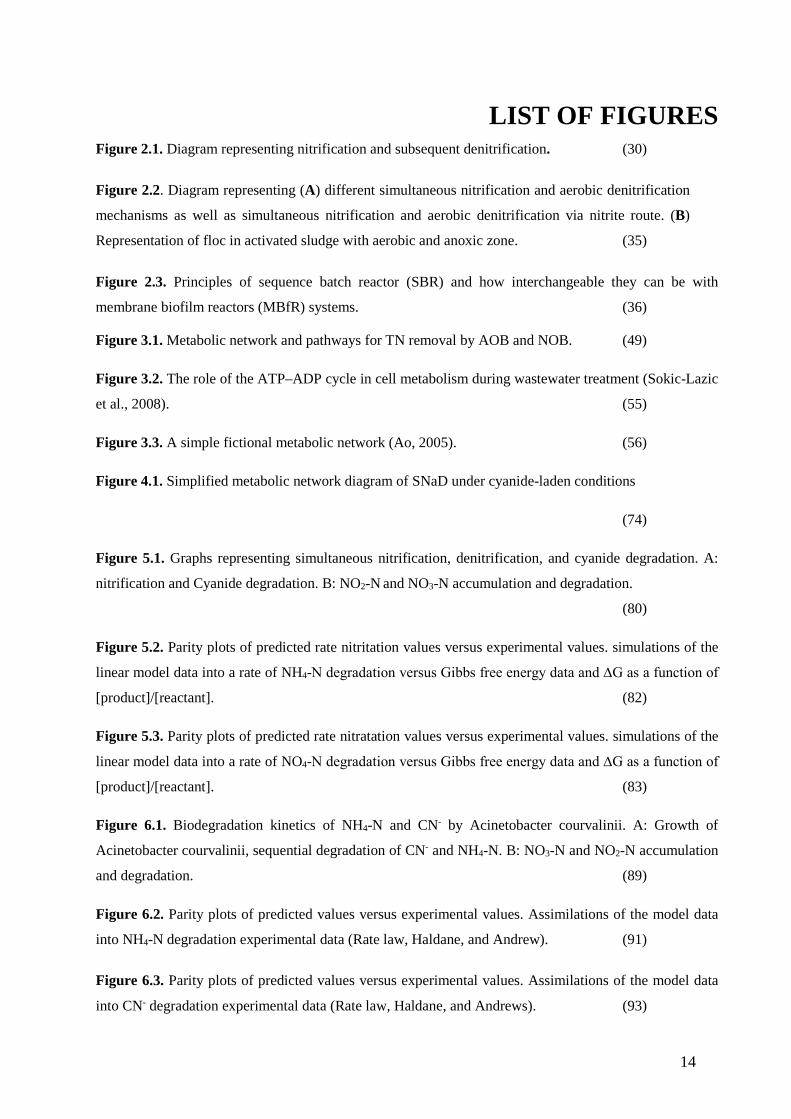
LIST OF FIGURES Figure 2.1. Diagram representing nitrification and subsequent denitrification. (30)
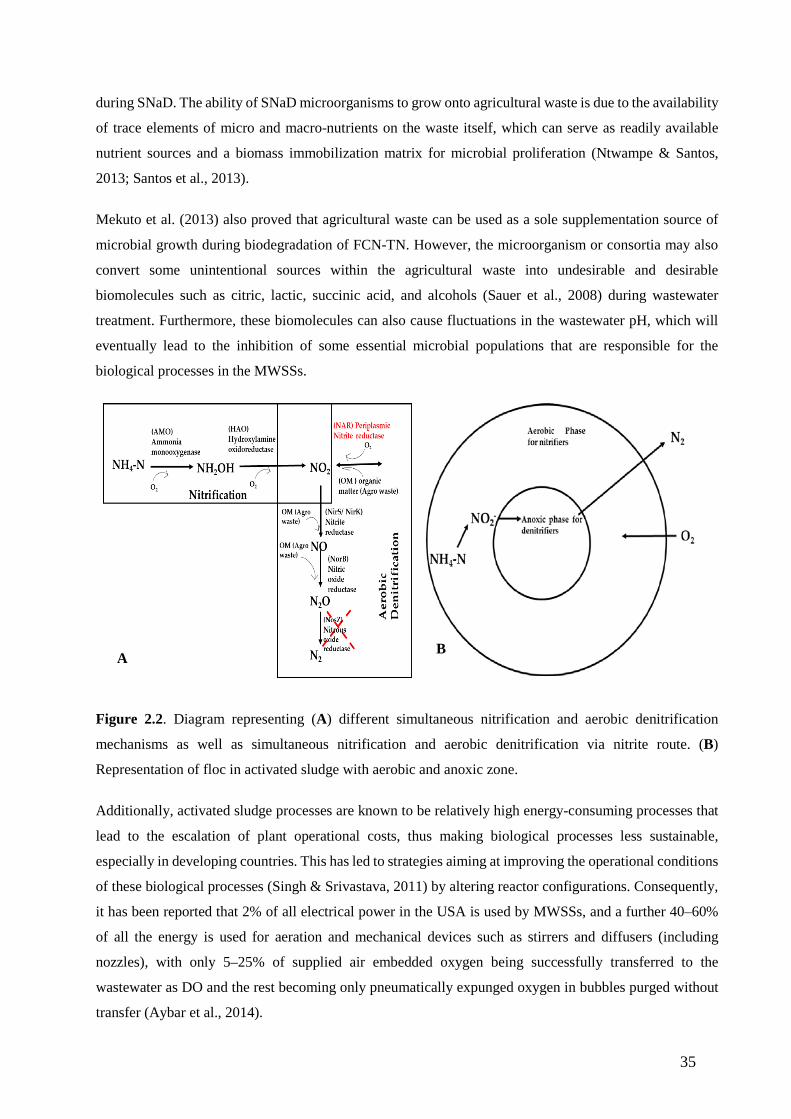
Figure 2.2. Diagram representing (A) different simultaneous nitrification and aerobic denitrification
mechanisms as well as simultaneous nitrification and aerobic denitrification via nitrite route. (B)
Representation of floc in activated sludge with aerobic and anoxic zone. (35)
Figure 2.3. Principles of sequence batch reactor (SBR) and how interchangeable they can be with
membrane biofilm reactors (MBfR) systems. (36)
Figure 3.1. Metabolic network and pathways for TN removal by AOB and NOB. (49)
Figure 3.2. The role of the ATP–ADP cycle in cell metabolism during wastewater treatment (Sokic-Lazic
et al., 2008). (55)
Figure 3.3. A simple fictional metabolic network (Ao, 2005). (56)
Figure 4.1. Simplified metabolic network diagram of SNaD under cyanide-laden conditions
(74)
Figure 5.1. Graphs representing simultaneous nitrification, denitrification, and cyanide degradation. A:
nitrification and Cyanide degradation. B: NO2-N and NO3-N accumulation and degradation.
(80)
Figure 5.2. Parity plots of predicted rate nitritation values versus experimental values. simulations of the
linear model data into a rate of NH4-N degradation versus Gibbs free energy data and ∆G as a function of
[product]/[reactant]. (82)
Figure 5.3. Parity plots of predicted rate nitratation values versus experimental values. simulations of the
linear model data into a rate of NO4-N degradation versus Gibbs free energy data and ∆G as a function of
[product]/[reactant]. (83)
Figure 6.1. Biodegradation kinetics of NH4-N and CN- by Acinetobacter courvalinii. A: Growth of
Acinetobacter courvalinii, sequential degradation of CN- and NH4-N. B: NO3-N and NO2-N accumulation
and degradation. (89)
Figure 6.2. Parity plots of predicted values versus experimental values. Assimilations of the model data
into NH4-N degradation experimental data (Rate law, Haldane, and Andrew). (91)
Figure 6.3. Parity plots of predicted values versus experimental values. Assimilations of the model data
into CN- degradation experimental data (Rate law, Haldane, and Andrews). (93)

15
Figure 6.4. The activity of NH4-N, NO3-N and NO2-N oxidizing enzymes and CN- degrading enzyme. A:
Effect of CN- on the induction of NH4-N, NO3-N and NO2-N oxidizing enzymes by A. courvalinii. B: Effect
of CN- on free cell NH4-N, NO3-N and NO2-N oxidizing enzymes (96)
Figure 7.1. Surface response plot showing the interaction between pH, Temperature and TN removal.
(103)
Figure 7.2. Degradation kinetics of TN and cyanide in a batch culture reactor. A: TN and CN- degradation
and cell concentration over time. B: model fitting into biomass plot. (104)
Figure 7.3. A comparison of the prediction ability of RSM and cybernetic models. A: prediction of TN
removal efficiency by RSM model; B: parity plot comparing predicted total nitrogen removal efficiency
and actual total nitrogen removal efficiency by RSM; C: Rate of TN removal predicted by cybernetic model;
D: parity plot for comparing predicted rate of TN removal with actual rate of TN removal by cybernetic
model. (105)
Figure 7.4. (a) NH4-N and CN- removal/ degradation. (b) NO2-N, and NO3-N removal. simulation of
cybernetic model into (c) level of key enzyme e1 over time. (d) level of key enzyme e2 over time. (e) level
of key enzyme e3 over time. (f) level of key enzyme e4. (108)
Figure 10.1. Simultaneous nitrification and aerobic denitrification performed by cyanide degrading mix
consortia under high cyanide conditions. (a) NH4-N and CN- degradation profile. (b) NO2-N and NO3-N
degradation and accumulation profile. (132)
Figure 10.2. metagenomics report for the consortium. (a): Kingdom classification. (b): Phylum
classification. (c): Class classification. (d); Order classification. E: Family classification. (134)
Figure 10.3. Parity plots of predicted values versus experimental values. Assimilations of the model data
into NH4-N degradation experimental data (Monod and Moser). (a) parity plot for Monod equation. (b)
simulation of predicted rate of reaction by Monod into experimental data. (c) parity plot for Moser equation.
(d) simulation of predicted rate of reaction by Moser into experimental data. (136)
Figure 10.4. Parity plots of predicted values versus experimental values. Assimilations of the model data
into CN- degradation experimental data (Monod, Moser and Andrews). (a) parity plot for Monod equation.
(b) simulation of predicted rate of reaction by Monod into experimental data. (c) parity plot for Moser
equation. (d) simulation of predicted rate of reaction by Moser into experimental data. (137)
16
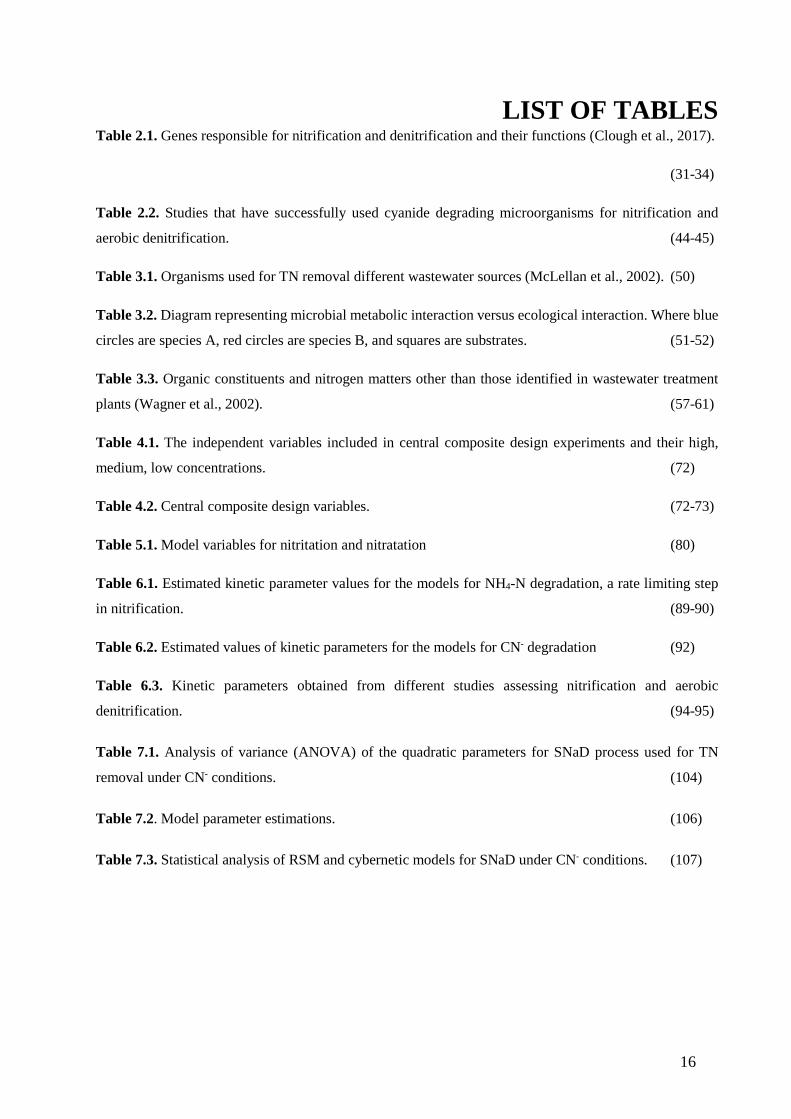
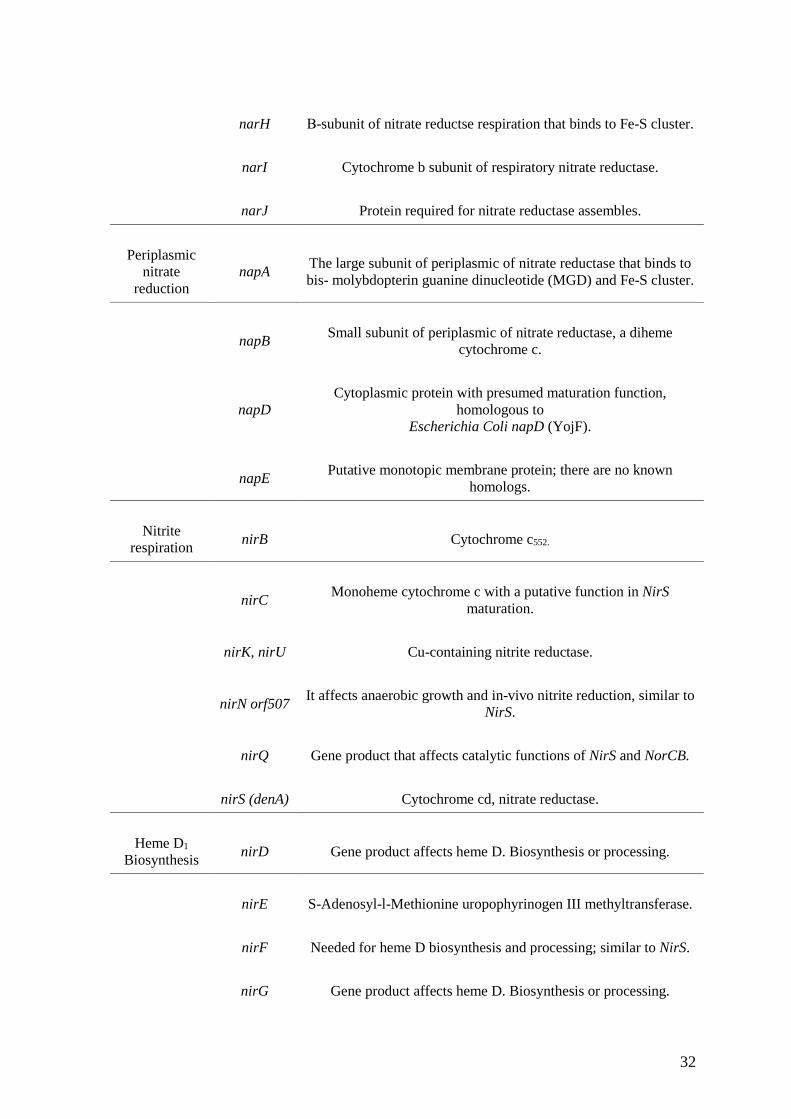
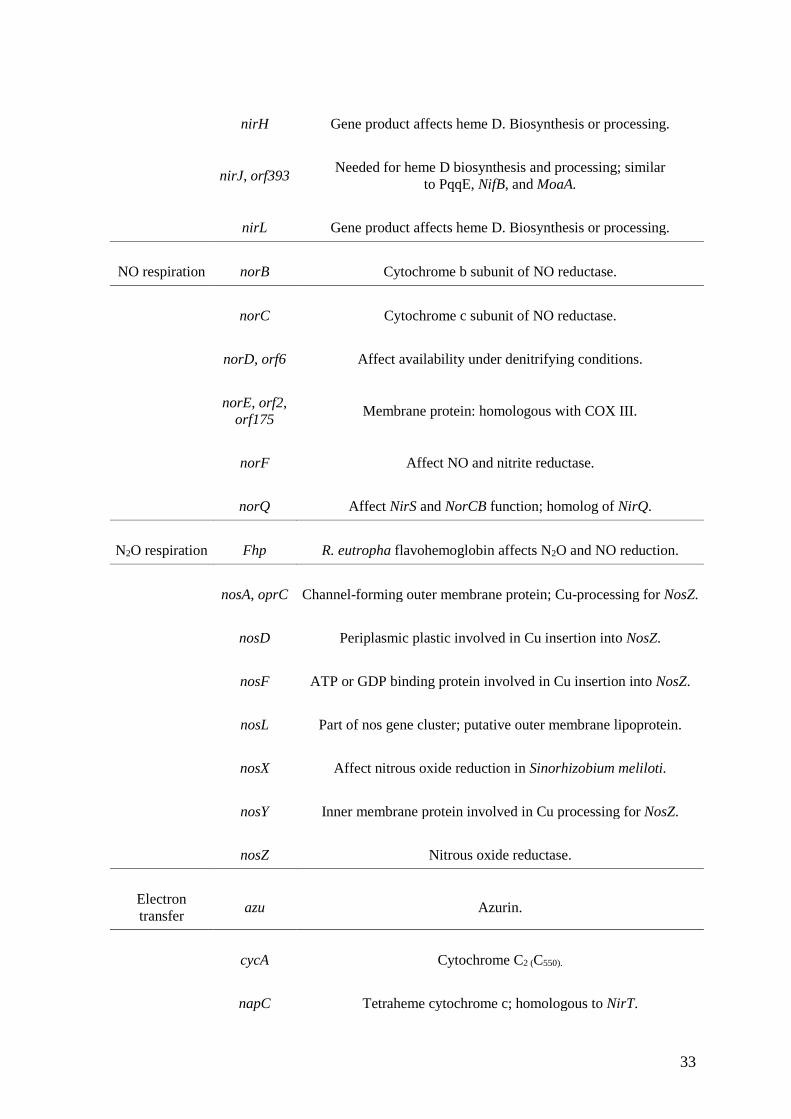
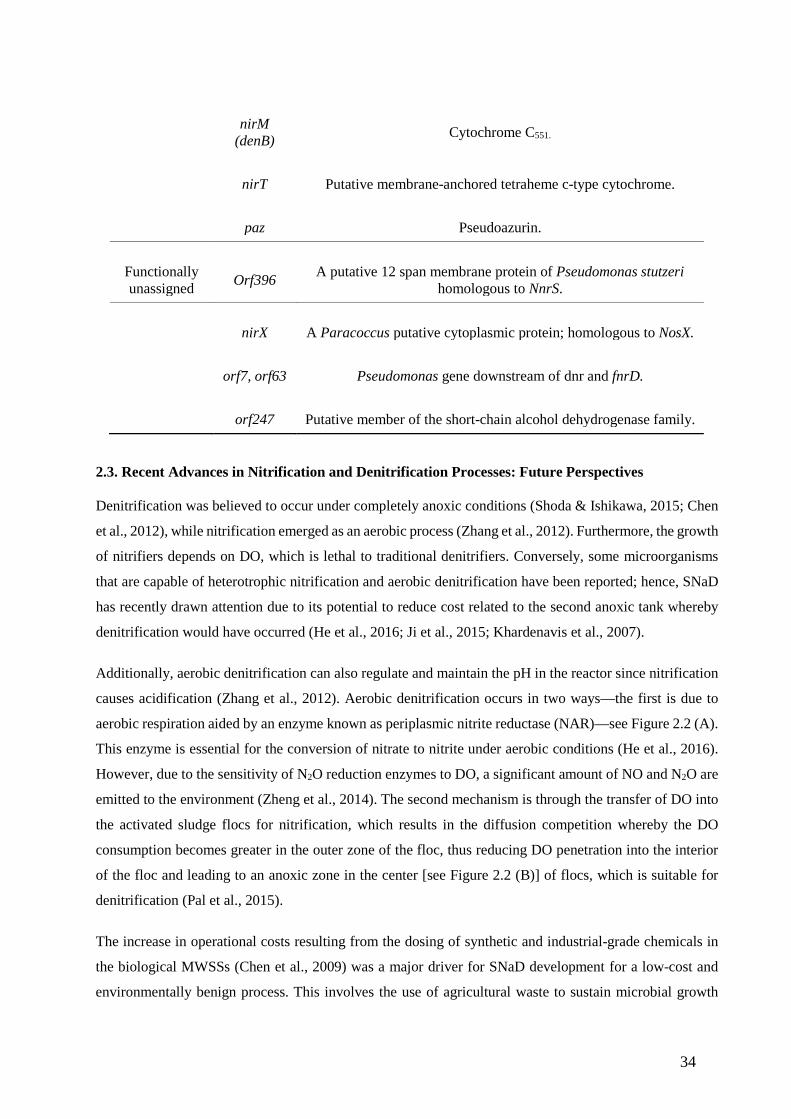
LIST OF TABLES Table 2.1. Genes responsible for nitrification and denitrification and their functions (Clough et al., 2017).
(31-34)
Table 2.2. Studies that have successfully used cyanide degrading microorganisms for nitrification and
aerobic denitrification. (44-45)
Table 3.1. Organisms used for TN removal different wastewater sources (McLellan et al., 2002). (50)
Table 3.2. Diagram representing microbial metabolic interaction versus ecological interaction. Where blue
circles are species A, red circles are species B, and squares are substrates. (51-52)
Table 3.3. Organic constituents and nitrogen matters other than those identified in wastewater treatment
plants (Wagner et al., 2002). (57-61)
Table 4.1. The independent variables included in central composite design experiments and their high,
medium, low concentrations. (72)
Table 4.2. Central composite design variables. (72-73)
Table 5.1. Model variables for nitritation and nitratation (80)
Table 6.1. Estimated kinetic parameter values for the models for NH4-N degradation, a rate limiting step
in nitrification. (89-90)
Table 6.2. Estimated values of kinetic parameters for the models for CN- degradation (92)
Table 6.3. Kinetic parameters obtained from different studies assessing nitrification and aerobic
denitrification. (94-95)
Table 7.1. Analysis of variance (ANOVA) of the quadratic parameters for SNaD process used for TN
removal under CN- conditions. (104)
Table 7.2. Model parameter estimations. (106)
Table 7.3. Statistical analysis of RSM and cybernetic models for SNaD under CN- conditions. (107)
17
Table 10.1. Estimated values of kinetic parameters for the models for NH4-N degradation, a limiting step
in nitrification. (134)
Table 10.2. Estimated values of kinetic parameters for the models for CN- degradation, a limiting step in
nitrification. (134-
235)
18
GLOSSARY
Definition (units) Abbreviations/Symbols
Adenosine 5′-triphosphate ATP
Ammonia monooxygenase AMO
Ammonia oxidising bacteria AOB
Ammonium nitrogen NH4-N
Anaerobic regulation of arginine ANR
Analysis of variance ANOVA
Anoxic ammonium oxidising bacteria AnAOB
Biological nitrogen removal BNR
Biomass yield coefficient (CFU/g substrate) Yx/s
Cell concentration (CFU/mL) X
Central composite design CCD
Chemical oxygen demand COD
Coefficients of the interaction parameters βij
Coefficients of the linear parameters βi
Coefficients of the quadratic parameter βii
Colony-Forming Unit CFU
Concentration of the Pollutant (mg/L) Ca
Constant term β0
Consumption rate of nitrogenous source (mg/g.h) 𝑟𝑟𝑖𝑖
Correlation coefficient R2

19
Cyanide degrading bacteria CDB
Cyanide hydratases CHTs
Cyanide monooxygenase CNO
Degradation rate constant of the enzyme (mg/g.h) 𝑏𝑏
Degree Celsius °C
Denaturing gradient gel electrophoresis DGGE
Dilution term due to growth rate (mg/g.h) 𝑟𝑟𝑔𝑔
di-Nitrogen N2
Dissimilative nitrate respiration regulator DNR
Dissolved oxygen DO
Electrodialysis ED
Extracellular polymeric substances EPS
Flavin adenine dinucleotide FADH2
Fluorescence in-situ hybridization FISH
Flux balance approach FBA
Free ammonium FA
Free cyanide F-CN
Free energy change (Kcal/mol) ∆G
Fumarate and nitrate reductase FNR
Gibbs energy (Kj/mol) ∆G
Heme iron atom of the heme protein His-Fe2+-His
Hydrogen cyanide HCN
Hydroxylamine oxidoreductase HAO
20
Inductive rate (mg/g.h) 𝛼𝛼𝑒𝑒𝑖𝑖
Ion exchange IE
Linear function F
Maximum level of enzyme 𝑒𝑒𝑖𝑖(mg/L) 𝑒𝑒𝑖𝑖𝑚𝑚𝑚𝑚𝑚𝑚
Maximum rate (mg/g.h) 𝑟𝑟𝑖𝑖𝑚𝑚𝑚𝑚𝑚𝑚
Membrane biofilm reactors MBfRs
Model fitting constant n
Municipal wastewater sewage systems MWSSs
Nicotinamide adenine dinucleotide NADH
Nicotinamide adenine dinucleotide phosphate NADPH
Nitrate nitrogen NO3-N
Nitrate reductase Nar
Nitric and nitrous oxide reductases NorB/NosZ
Nitric oxide NO
Nitric oxide reductase Nor
Nitrite nitrogen NO2-N
Nitrite oxidoreductase NXR
Nitrite reductase Nir
Nitrous oxide N2O
Nitrous oxide reductase Nos
Number of variables k
Polyhydroxyalkanoates PHA
Polymerase chain reaction PCR
21
Potassium cyanide KCN
Rate of degradation (mg/h) r
Represents the variables xi
Residual associated to the experiments. ɛ
Response surface methodology RSM
Saturation constant (mg/L) 𝐾𝐾𝑖𝑖
Sequence batch reactor SBR
Simultaneous nitrification denitrification SNaD
Specific degradation rate of the substrate Vm
Specific growth rate (h-1) µ
Substrate constant (mg/ L) Ki
Substrate inhibition constant (mg/ L) Ks
Temperature (ºC) T
Terminal restriction fragment length polymorphism T-RFLP
Thiocyanate SCN
Time (h) t
Total nitrogen TN
Universal gas constant R
Wastewater treatment plant WWTP

22
CHAPTER 1
GENERAL INTRODUCTION
23
CHAPTER 1
INTRODUCTION
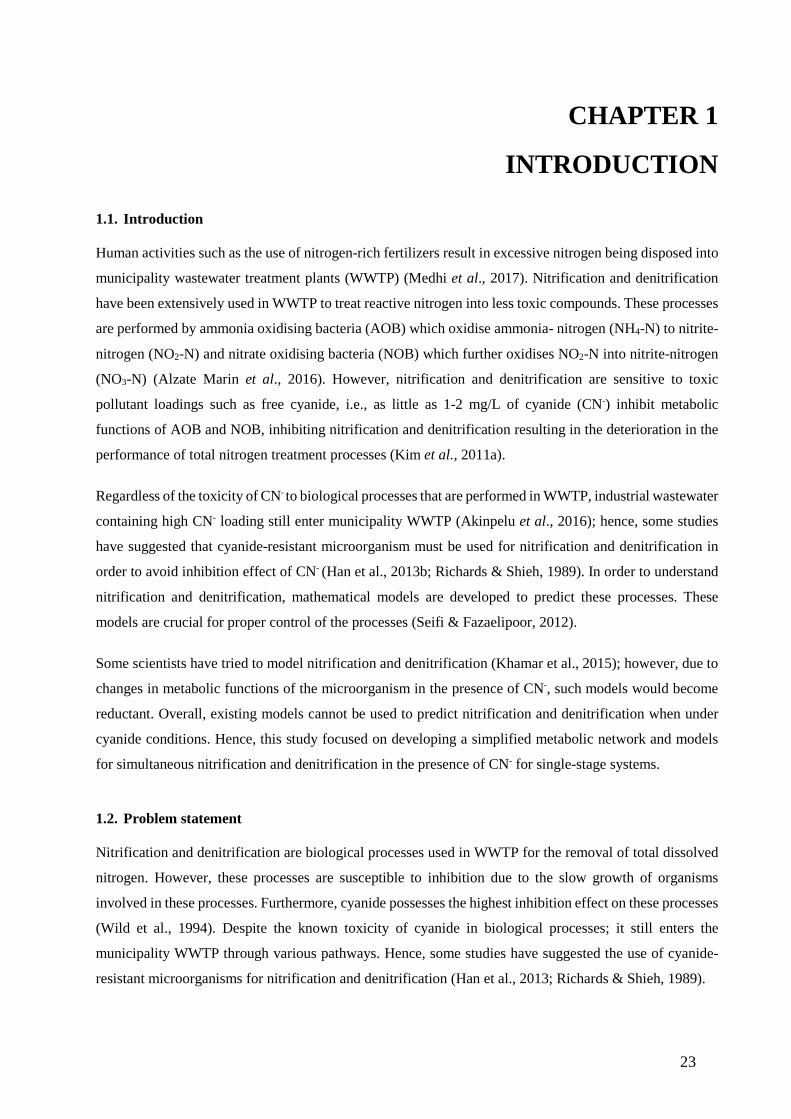
1.1. Introduction
Human activities such as the use of nitrogen-rich fertilizers result in excessive nitrogen being disposed into
municipality wastewater treatment plants (WWTP) (Medhi et al., 2017). Nitrification and denitrification
have been extensively used in WWTP to treat reactive nitrogen into less toxic compounds. These processes
are performed by ammonia oxidising bacteria (AOB) which oxidise ammonia- nitrogen (NH4-N) to nitrite-
nitrogen (NO2-N) and nitrate oxidising bacteria (NOB) which further oxidises NO2-N into nitrite-nitrogen
(NO3-N) (Alzate Marin et al., 2016). However, nitrification and denitrification are sensitive to toxic
pollutant loadings such as free cyanide, i.e., as little as 1-2 mg/L of cyanide (CN-) inhibit metabolic
functions of AOB and NOB, inhibiting nitrification and denitrification resulting in the deterioration in the
performance of total nitrogen treatment processes (Kim et al., 2011a).
Regardless of the toxicity of CN- to biological processes that are performed in WWTP, industrial wastewater
containing high CN- loading still enter municipality WWTP (Akinpelu et al., 2016); hence, some studies
have suggested that cyanide-resistant microorganism must be used for nitrification and denitrification in
order to avoid inhibition effect of CN- (Han et al., 2013b; Richards & Shieh, 1989). In order to understand
nitrification and denitrification, mathematical models are developed to predict these processes. These
models are crucial for proper control of the processes (Seifi & Fazaelipoor, 2012).
Some scientists have tried to model nitrification and denitrification (Khamar et al., 2015); however, due to
changes in metabolic functions of the microorganism in the presence of CN-, such models would become
reductant. Overall, existing models cannot be used to predict nitrification and denitrification when under
cyanide conditions. Hence, this study focused on developing a simplified metabolic network and models
for simultaneous nitrification and denitrification in the presence of CN- for single-stage systems.
1.2. Problem statement
Nitrification and denitrification are biological processes used in WWTP for the removal of total dissolved
nitrogen. However, these processes are susceptible to inhibition due to the slow growth of organisms
involved in these processes. Furthermore, cyanide possesses the highest inhibition effect on these processes
(Wild et al., 1994). Despite the known toxicity of cyanide in biological processes; it still enters the
municipality WWTP through various pathways. Hence, some studies have suggested the use of cyanide-
resistant microorganisms for nitrification and denitrification (Han et al., 2013; Richards & Shieh, 1989).

24
These microorganisms are able to thrive under high cyanide conditions by converting cyanide into less
toxic compounds. Additionally, the metabolic functions of these microorganisms’ changes in the presence
of CN-; hence, the nitrification and denitrification behavior of these cyanide-resistant microorganisms is
different from that of non-cyanide tolerant microorganisms. Therefore, mathematical models developed to
predict the behavior of nitrification and denitrification in non-cyanide conditions cannot be used to describe
nitrification and denitrification in cyanogenic conditions.
This will include the metabolic networks facilitating nitrification and denitrification. Hence, there is a need
to develop metabolic network models that can be used to describe metabolic functions of nitrification and
denitrification of the microorganisms under cyanogenic conditions. This will assist in proper controlling of
nitrification and aerobic denitrification under cyanogenic conditions. The application of cyanogenic
bacteria will be more practically applicable in WWTP.
1.3. Hypothesis
Metabolic functions of bacterial strain used for nitrification and sequential denitrification differ when
different toxicants are present in the wastewater thus mathematical models developed with nitrogen as a
sole toxicant cannot suitably predict both nitrification and denitrification in cyanogenic conditions.
1.4. Research questions
• Will the cyanide resistant/ tolerant microorganisms achieve SNaD under CN- condition?
• What is the maximum concentration of CN- can the isolated bacteria perform SNaD?
• Can the normal mathematical models predict SNaD under CN- conditions well?
• What will be the optimum conditions for the isolated bacteria to perform SNaD under CN-
conditions?
• Can response surface methodology (RSM) models be used to predict SNaD under CN-?
• Can Cybernetic models be used for prediction of metabolic network of SNaD under CN-?
1.5. Aims and objectives
Aim 1: Study feasibility of using cyanide resistant mix consortium for SNaD under CN-laden conditions.
Objective 1: Isolation of mix consortium from a CN- environment.
Objective 2: Perform SNaD kinetic studies catalysed by the isolated mix consortium.
25
Objective 3: Model Gibbs free energy of the rate-limiting step (nitrification) of SNaD under CN-
conditions.
Aim 2: Assessing the predictive capability of different mathematical models towards simultaneous
nitrification and aerobic denitrification.
Objective 1: Isolation of cyanide resistant single bacterial strain from the isolated mix consortium.
Objective 2: Assessing the ability of the isolated bacteria to perform SNaD under cyanogenic conditions.
Objective 3: Evaluating the predictive ability of different mathematical model towards removal/
degradation of multiple nitrogenous source (NH4-N and CN-)
Objective 4: Study the effect of free CN- on nitrifying and denitrifying enzymes.
Aim 3: Optimisation of SNaD under CN- conditions and development of cybernetic models for SNaD
prediction.
Objective 1: Study Physico-chemical (pH and Temperature) conditions that affect SNaD and CN-
degradation.
Objective 2: Develop a simplified SNaD metabolic network for the development of a simple cybernetic
model.
Objective 3: Comparison of RSM and cybernetic model predictive capability towards SNaD under CN-
conditions.
1.6. Delineation of the study
This study did not look at:
• The detailed of the gene responsible for simultaneous nitrification and aerobic denitrification, and
• The toxicity of the isolated strain on the wastewater treatment plant resident bacterial strains.
1.7. Significance of the research
CN- enters wastewater treatment plants from different industrial sources and inhibits biological processes
performed in traditional wastewater treatment plants; hence, the use of cyanogen resistant microorganisms
is recommended especially for sensitive processes such as nitrification and denitrification. In order to
control these processes under cyanogenic conditions, metabolic network models that will predict the
behavior of these processes under cyanogenic conditions are required; hence, the aim of this study is to

26
develop such a modeling network model that will describe nitrification and denitrification under cyanogenic
conditions.
27
CHAPTER 2
LITERATURE REVIEW 1
Published as: Mpongwana, N., Ntwampe, S.K.O., Omodanisi, E.I., Chidi, B.S. & Razanamahandry. L.C.
2019. Sustainable Approach to Eradicate the Inhibitory Effect of Free-Cyanide on Simultaneous
Nitrification and Aerobic Denitrification during Wastewater Treatment. Sustainability 2019, 11(21), 6180;
https://doi.org/10.3390/su11216180

28
CHAPTER 2:
LITERATURE REVIEW 1
2.1. Introduction
Excessive nitrogenous compounds in wastewater discharged into water bodies such as rivers can result in
dissolved oxygen (DO) depletion and eutrophication in the receiving rivers (Ali & Okabe, 2015). Due to
governmental regulations in place to regulate treated wastewater discharge standards, it is important that
wastewater containing a high concentration of nitrogenous compounds must be treated prior to discharge
(Duan et al., 2015). This type of wastewater can be treated by biological processes such as simultaneous
nitrification and aerobic denitrification (SNaD) or Physico-chemical processes such as ammonium
stripping, chemical precipitation of ammonia, electrochemical conversion, and many other treatment
technologies (Norton-Brandão et al., 2013).
However, biological treatment of total nitrogen (TN) laden wastewater via traditional methods, i.e.,
nitrification and subsequent anoxic denitrification in a two-step set-up, is the desired method for treatment
of TN in generic municipal wastewater sewage systems (MWSSs) because these methods are efficient at a
larger scale. Overall, biological treatment uses the metabolic activity of living organisms in consortia for
pollutant removal, with microorganisms such as bacteria primarily being used in an agglomerated symbiotic
biological potpourri of reactions in sequential or parallel processes. Nonetheless, biological treatment
methods are not always suitable to treat some industrial wastewater due to the toxicity of organic and other
substances therein (Oller et al., 2011), which reduces these methods’ efficiency.
An example is coking wastewater, which contains a high concentration of free cyanide (FCN), which
decomposes to ammonium-nitrogen, nitrates, and nitrite, herein referred to as TN and phenolics. Such
wastewater, if treated in an inefficient primary process, would culminate in the inhibition of biologics of
downstream processes such as nitrification and denitrification, resulting in the disposal of partially treated
wastewater still containing a high concentration of TN. Moreover, when primary and secondary wastewater
treatment processes experience increased toxicant loading such as FCN from industrial processes in
combination with secondary pollutants, e.g., phenolics or heavy metals, the discharged FCN containing
wastewater would further contribute to receiving surface water pollution, a challenge which is further
exacerbated by runoff from agricultural operations whereby the use of cyanogen-based pesticides is still in
practice, especially in developing countries. In certain instances, the remedial strategy implementable to
minimize FCN inhibition toward primary and secondary processes such as nitrification and denitrification
sometimes involves the use of adsorbents such as activated carbon as a sorbent (Kim et al., 2008) for FCN
adsorption. Conversely, the application of physical processes such as activated carbon would incur

29
additional operational costs associated with the procurement of the adsorbent and its disposal, including
regeneration if it is to be used in multi-cycle operations.
Additionally, the use of sorbents such as activated carbon is less effective in eliminating the inhibitory
effect of FCN in nitrification and subsequent denitrification, particularly when periodic spillovers to these
processes downstream occur and when inadvertent adsorption-desorption processes in the primary process
occur due to process conditions variation, including wastewater quality changes. This can also be due to
the low absorption capability of poor quality activated carbon used in some operations and because the
affinity of FCN to activated carbon is low (Kim et al., 2007). Therefore, it is prudent to invest in and
investigate a sustainable method to eliminate the inhibition of FCN towards nitrification and denitrification.
Kim et al. (2013) suggested the use of FCN degrading bacteria to eliminate cyanide inhibition towards
nitrification and subsequent denitrification. Furthermore, although both nitrification and anoxic
denitrification occur as separate processes at an industrial scale (Han et al., 2014), several research studies
have indicated the use of simultaneous nitrification and aerobic denitrification (SNaD), which effectively
culminates in the integration of a traditional two-stage process into a single-stage process (Shoda &
Ishikawa, 2015; Chen et al., 2012) with an added benefit of having a reduced footprint; albeit, there is
minimal literature on the utilization of SNaD as a sustainable process in which FCN degrading bacterial
consortia are used, a practice yet to be adopted at an industrial scale.
2.2. Nitrification and Subsequent Denitrification: An Obsolete Technology
The secondary treatment in wastewater uses biological processes due to its cost-effectiveness and
environmental benignity compared to physical treatment technologies, which are expensive and produce
toxic by-products. Biological treatment plays a crucial role during nutrient removal and for the prevention
of eutrophication in receiving water bodies (Banning et al., 2015). Nitrification and subsequent
denitrification are among the important biological processes that are currently being successfully employed
in MWSSs for the removal of TN (Oller et al., 2011). Generally, the process of TN removal is initiated with
aerobic ammonium-nitrogen (NH4-N) oxidation in a two-step process with the first step being nitritation
and the second being nitratation. During nitritation, ammonia-oxidizing bacteria (AOB) oxidize NH4-N to
NH2OH through ammonia monooxygenase (AMO) biocatalysis; the NH2OH is oxidized further into NO2−
through hydroxylamine oxidoreductase (HAO) (Banning et al., 2015).
This process is known as nitrification through the nitrite route and is ideal as it reduces carbon source
requirements by up to 40%, thus reducing costs associated with carbon source utilization. The second step
involves the oxidation of NO2− into NO3
− by nitrite-oxidizing bacteria (NOB) catalyzed by nitrite reductase
(NIR) (Ge et al., 2015b; Levy-Booth et al., 2014). Although nitrification is successfully applied in MWSSs
for TN removal, it is a highly sensitive process (Shoda & Ishikawa, 2014). The effluent from nitrification
is further processed in an anaerobic reactor for anoxic denitrification, whereby microorganisms oxidize
30
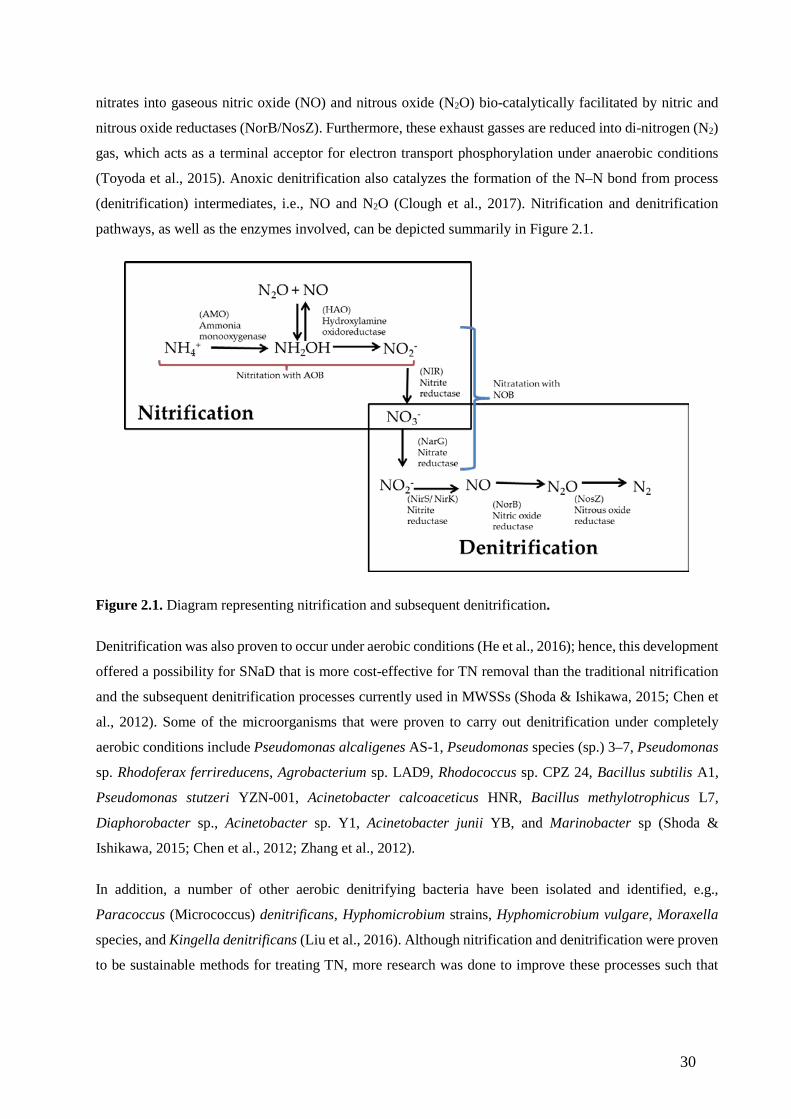
nitrates into gaseous nitric oxide (NO) and nitrous oxide (N2O) bio-catalytically facilitated by nitric and
nitrous oxide reductases (NorB/NosZ). Furthermore, these exhaust gasses are reduced into di-nitrogen (N2)
gas, which acts as a terminal acceptor for electron transport phosphorylation under anaerobic conditions
(Toyoda et al., 2015). Anoxic denitrification also catalyzes the formation of the N–N bond from process
(denitrification) intermediates, i.e., NO and N2O (Clough et al., 2017). Nitrification and denitrification
pathways, as well as the enzymes involved, can be depicted summarily in Figure 2.1.
Figure 2.1. Diagram representing nitrification and subsequent denitrification.
Denitrification was also proven to occur under aerobic conditions (He et al., 2016); hence, this development
offered a possibility for SNaD that is more cost-effective for TN removal than the traditional nitrification
and the subsequent denitrification processes currently used in MWSSs (Shoda & Ishikawa, 2015; Chen et
al., 2012). Some of the microorganisms that were proven to carry out denitrification under completely
aerobic conditions include Pseudomonas alcaligenes AS-1, Pseudomonas species (sp.) 3–7, Pseudomonas
sp. Rhodoferax ferrireducens, Agrobacterium sp. LAD9, Rhodococcus sp. CPZ 24, Bacillus subtilis A1,
Pseudomonas stutzeri YZN-001, Acinetobacter calcoaceticus HNR, Bacillus methylotrophicus L7,
Diaphorobacter sp., Acinetobacter sp. Y1, Acinetobacter junii YB, and Marinobacter sp (Shoda &
Ishikawa, 2015; Chen et al., 2012; Zhang et al., 2012).
In addition, a number of other aerobic denitrifying bacteria have been isolated and identified, e.g.,
Paracoccus (Micrococcus) denitrificans, Hyphomicrobium strains, Hyphomicrobium vulgare, Moraxella
species, and Kingella denitrificans (Liu et al., 2016). Although nitrification and denitrification were proven
to be sustainable methods for treating TN, more research was done to improve these processes such that
31
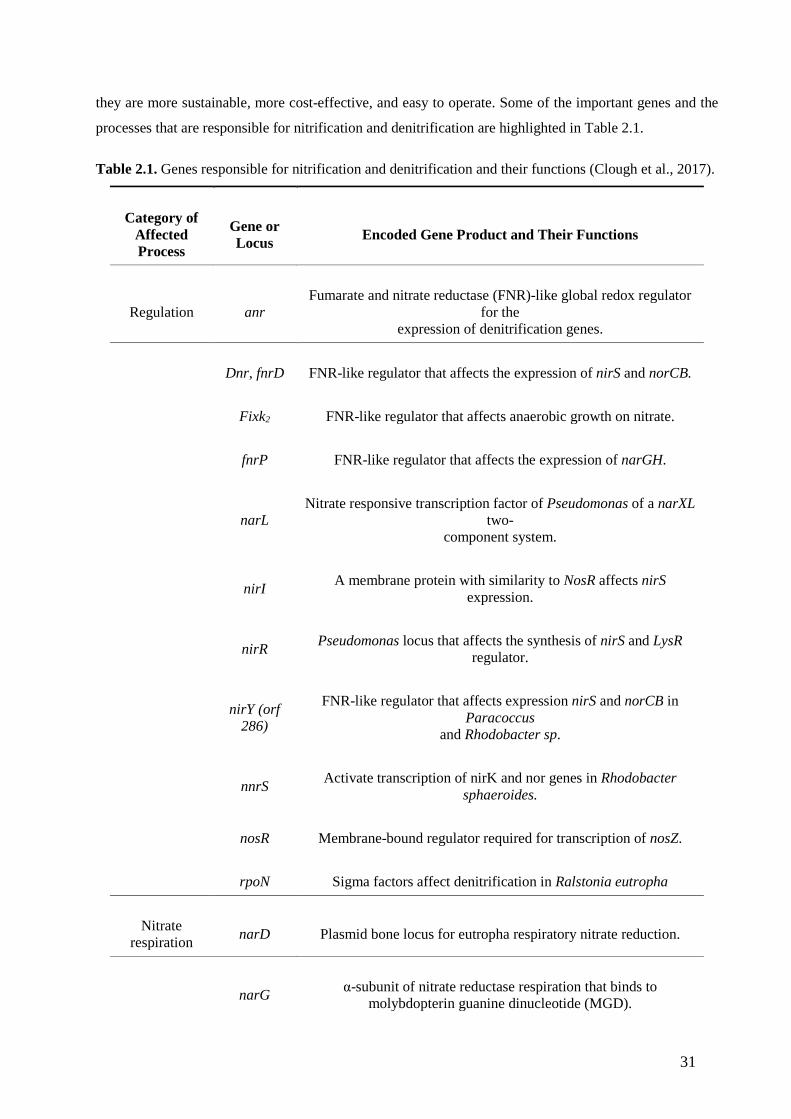
they are more sustainable, more cost-effective, and easy to operate. Some of the important genes and the
processes that are responsible for nitrification and denitrification are highlighted in Table 2.1.
Table 2.1. Genes responsible for nitrification and denitrification and their functions (Clough et al., 2017).
Category of Affected Process
Gene or Locus Encoded Gene Product and Their Functions
Regulation anr Fumarate and nitrate reductase (FNR)-like global redox regulator
for the expression of denitrification genes.
Dnr, fnrD FNR-like regulator that affects the expression of nirS and norCB.
Fixk2 FNR-like regulator that affects anaerobic growth on nitrate.
fnrP FNR-like regulator that affects the expression of narGH.
narL Nitrate responsive transcription factor of Pseudomonas of a narXL
two- component system.
nirI A membrane protein with similarity to NosR affects nirS expression.
nirR Pseudomonas locus that affects the synthesis of nirS and LysR regulator.
nirY (orf 286)
FNR-like regulator that affects expression nirS and norCB in Paracoccus
and Rhodobacter sp.
nnrS Activate transcription of nirK and nor genes in Rhodobacter sphaeroides.
nosR Membrane-bound regulator required for transcription of nosZ.
rpoN Sigma factors affect denitrification in Ralstonia eutropha
Nitrate respiration narD Plasmid bone locus for eutropha respiratory nitrate reduction.
narG α-subunit of nitrate reductase respiration that binds to molybdopterin guanine dinucleotide (MGD).
32
narH Β-subunit of nitrate reductse respiration that binds to Fe-S cluster.
narI Cytochrome b subunit of respiratory nitrate reductase.
narJ Protein required for nitrate reductase assembles.
Periplasmic nitrate
reduction napA The large subunit of periplasmic of nitrate reductase that binds to
bis- molybdopterin guanine dinucleotide (MGD) and Fe-S cluster.
napB Small subunit of periplasmic of nitrate reductase, a diheme cytochrome c.
napD Cytoplasmic protein with presumed maturation function,
homologous to Escherichia Coli napD (YojF).
napE Putative monotopic membrane protein; there are no known homologs.
Nitrite respiration nirB Cytochrome c552.
nirC Monoheme cytochrome c with a putative function in NirS maturation.
nirK, nirU Cu-containing nitrite reductase.
nirN orf507 It affects anaerobic growth and in-vivo nitrite reduction, similar to NirS.
nirQ Gene product that affects catalytic functions of NirS and NorCB.
nirS (denA) Cytochrome cd, nitrate reductase.
Heme D1
Biosynthesis nirD Gene product affects heme D. Biosynthesis or processing.
nirE S-Adenosyl-l-Methionine uropophyrinogen III methyltransferase.
nirF Needed for heme D biosynthesis and processing; similar to NirS.
nirG Gene product affects heme D. Biosynthesis or processing.
33
nirH Gene product affects heme D. Biosynthesis or processing.
nirJ, orf393 Needed for heme D biosynthesis and processing; similar to PqqE, NifB, and MoaA.
nirL Gene product affects heme D. Biosynthesis or processing.
NO respiration norB Cytochrome b subunit of NO reductase.
norC Cytochrome c subunit of NO reductase.
norD, orf6 Affect availability under denitrifying conditions.
norE, orf2, orf175 Membrane protein: homologous with COX III.
norF Affect NO and nitrite reductase.
norQ Affect NirS and NorCB function; homolog of NirQ.
N2O respiration Fhp R. eutropha flavohemoglobin affects N2O and NO reduction.
nosA, oprC Channel-forming outer membrane protein; Cu-processing for NosZ.
nosD Periplasmic plastic involved in Cu insertion into NosZ.
nosF ATP or GDP binding protein involved in Cu insertion into NosZ.
nosL Part of nos gene cluster; putative outer membrane lipoprotein.
nosX Affect nitrous oxide reduction in Sinorhizobium meliloti.
nosY Inner membrane protein involved in Cu processing for NosZ.
nosZ Nitrous oxide reductase.
Electron transfer azu Azurin.
cycA Cytochrome C2 (C550).
napC Tetraheme cytochrome c; homologous to NirT.
34
nirM (denB) Cytochrome C551.
nirT Putative membrane-anchored tetraheme c-type cytochrome.
paz Pseudoazurin.
Functionally unassigned Orf396 A putative 12 span membrane protein of Pseudomonas stutzeri
homologous to NnrS.
nirX A Paracoccus putative cytoplasmic protein; homologous to NosX.
orf7, orf63 Pseudomonas gene downstream of dnr and fnrD.
orf247 Putative member of the short-chain alcohol dehydrogenase family.
2.3. Recent Advances in Nitrification and Denitrification Processes: Future Perspectives
Denitrification was believed to occur under completely anoxic conditions (Shoda & Ishikawa, 2015; Chen
et al., 2012), while nitrification emerged as an aerobic process (Zhang et al., 2012). Furthermore, the growth
of nitrifiers depends on DO, which is lethal to traditional denitrifiers. Conversely, some microorganisms
that are capable of heterotrophic nitrification and aerobic denitrification have been reported; hence, SNaD
has recently drawn attention due to its potential to reduce cost related to the second anoxic tank whereby
denitrification would have occurred (He et al., 2016; Ji et al., 2015; Khardenavis et al., 2007).
Additionally, aerobic denitrification can also regulate and maintain the pH in the reactor since nitrification
causes acidification (Zhang et al., 2012). Aerobic denitrification occurs in two ways—the first is due to
aerobic respiration aided by an enzyme known as periplasmic nitrite reductase (NAR)—see Figure 2.2 (A).
This enzyme is essential for the conversion of nitrate to nitrite under aerobic conditions (He et al., 2016).
However, due to the sensitivity of N2O reduction enzymes to DO, a significant amount of NO and N2O are
emitted to the environment (Zheng et al., 2014). The second mechanism is through the transfer of DO into
the activated sludge flocs for nitrification, which results in the diffusion competition whereby the DO
consumption becomes greater in the outer zone of the floc, thus reducing DO penetration into the interior
of the floc and leading to an anoxic zone in the center [see Figure 2.2 (B)] of flocs, which is suitable for
denitrification (Pal et al., 2015).
The increase in operational costs resulting from the dosing of synthetic and industrial-grade chemicals in
the biological MWSSs (Chen et al., 2009) was a major driver for SNaD development for a low-cost and
environmentally benign process. This involves the use of agricultural waste to sustain microbial growth
35
during SNaD. The ability of SNaD microorganisms to grow onto agricultural waste is due to the availability
of trace elements of micro and macro-nutrients on the waste itself, which can serve as readily available
nutrient sources and a biomass immobilization matrix for microbial proliferation (Ntwampe & Santos,
2013; Santos et al., 2013).
Mekuto et al. (2013) also proved that agricultural waste can be used as a sole supplementation source of
microbial growth during biodegradation of FCN-TN. However, the microorganism or consortia may also
convert some unintentional sources within the agricultural waste into undesirable and desirable
biomolecules such as citric, lactic, succinic acid, and alcohols (Sauer et al., 2008) during wastewater
treatment. Furthermore, these biomolecules can also cause fluctuations in the wastewater pH, which will
eventually lead to the inhibition of some essential microbial populations that are responsible for the
biological processes in the MWSSs.
Figure 2.2. Diagram representing (A) different simultaneous nitrification and aerobic denitrification
mechanisms as well as simultaneous nitrification and aerobic denitrification via nitrite route. (B)
Representation of floc in activated sludge with aerobic and anoxic zone.
Additionally, activated sludge processes are known to be relatively high energy-consuming processes that
lead to the escalation of plant operational costs, thus making biological processes less sustainable,
especially in developing countries. This has led to strategies aiming at improving the operational conditions
of these biological processes (Singh & Srivastava, 2011) by altering reactor configurations. Consequently,
it has been reported that 2% of all electrical power in the USA is used by MWSSs, and a further 40–60%
of all the energy is used for aeration and mechanical devices such as stirrers and diffusers (including
nozzles), with only 5–25% of supplied air embedded oxygen being successfully transferred to the
wastewater as DO and the rest becoming only pneumatically expunged oxygen in bubbles purged without
transfer (Aybar et al., 2014).
A B
36
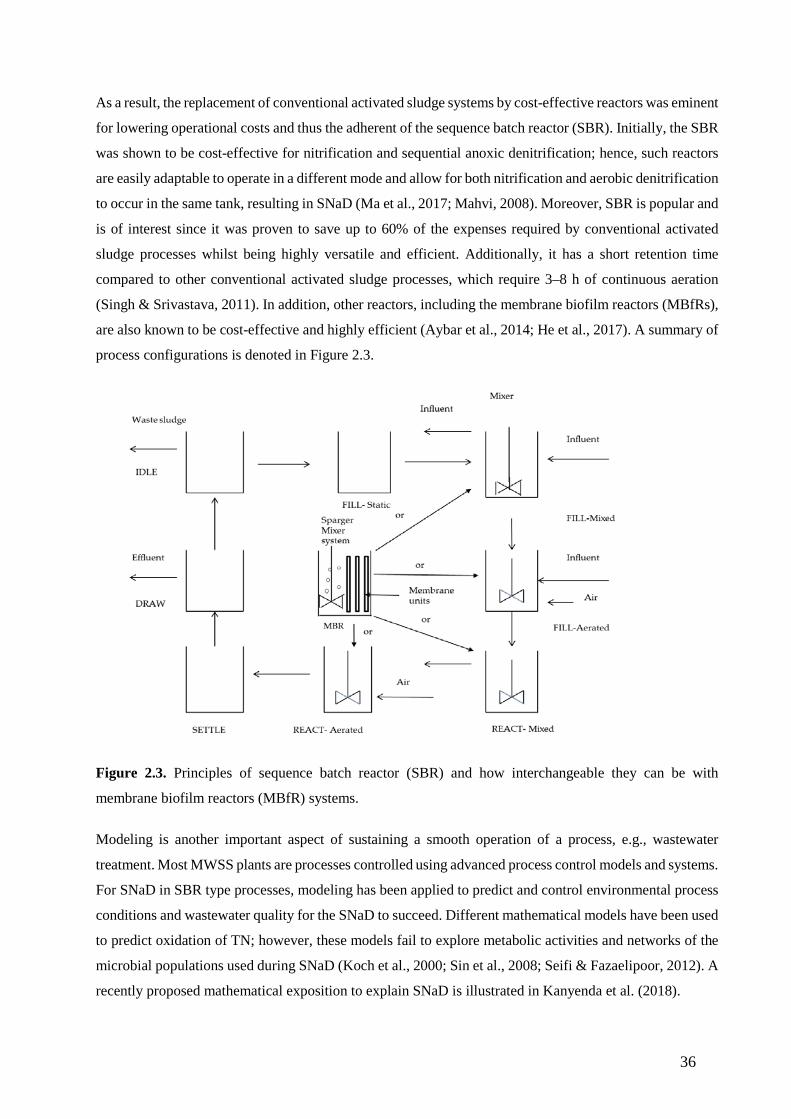
As a result, the replacement of conventional activated sludge systems by cost-effective reactors was eminent
for lowering operational costs and thus the adherent of the sequence batch reactor (SBR). Initially, the SBR
was shown to be cost-effective for nitrification and sequential anoxic denitrification; hence, such reactors
are easily adaptable to operate in a different mode and allow for both nitrification and aerobic denitrification
to occur in the same tank, resulting in SNaD (Ma et al., 2017; Mahvi, 2008). Moreover, SBR is popular and
is of interest since it was proven to save up to 60% of the expenses required by conventional activated
sludge processes whilst being highly versatile and efficient. Additionally, it has a short retention time
compared to other conventional activated sludge processes, which require 3–8 h of continuous aeration
(Singh & Srivastava, 2011). In addition, other reactors, including the membrane biofilm reactors (MBfRs),
are also known to be cost-effective and highly efficient (Aybar et al., 2014; He et al., 2017). A summary of
process configurations is denoted in Figure 2.3.
Figure 2.3. Principles of sequence batch reactor (SBR) and how interchangeable they can be with
membrane biofilm reactors (MBfR) systems.
Modeling is another important aspect of sustaining a smooth operation of a process, e.g., wastewater
treatment. Most MWSS plants are processes controlled using advanced process control models and systems.
For SNaD in SBR type processes, modeling has been applied to predict and control environmental process
conditions and wastewater quality for the SNaD to succeed. Different mathematical models have been used
to predict oxidation of TN; however, these models fail to explore metabolic activities and networks of the
microbial populations used during SNaD (Koch et al., 2000; Sin et al., 2008; Seifi & Fazaelipoor, 2012). A
recently proposed mathematical exposition to explain SNaD is illustrated in Kanyenda et al. (2018).
37
These mathematical models also fail to accurately address the metabolic networking of microbial
populations responsible for SNaD (Edwards et al., 2002). Thus, they cannot be used to describe biological
processes used in MWSSs, since biological processes rely on the metabolic networking of microbial
populations, particularly for consortia-catalyzed systems.
2.4. Overall Remarks on Simultaneous Nitrification and Aerobic Denitrification (SNaD): Advances and Limitations
All these improvements have contributed to a significant difference in the smooth operation of nitrification
and denitrification for TN removal. Moreover, these improvements have also made a considerable reduction
in the operational cost of these processes. Nevertheless, with all the efforts made to advance nitrification
and denitrification, MWSSs still face challenges—they are easily inhibited by many contaminants present
in the wastewater, resulting in a negative impact on the operation and rendering the overall process
ineffective. Hence, efforts have been made to address such challenges.
2.5. Challenges in Simultaneous Nitrification and Aerobic Denitrification (SNaD) processes
The major challenges SNaD is currently facing are the slow growth rate and the sensitivity to temperature,
pH, DO concentration, and toxicants, which negatively affect nitrifying and denitrifying organisms (Cui et
al., 2014; Papirio et al., 2014). Additionally, high shear stress resulting from aeration can also result in the
slow growth of nitrifying and denitrifying microorganisms (Lochmatter & Holliger, 2014), causing
excessive biomass wash-out during wastewater treatment and resulting in reduced TN removal efficiency
and SNaD failure (Szabó et al., 2016).
This could ensure SNaD susceptibility to inhibition by toxicants and heavy metals present in the
wastewater. High concentrations of heavy metal are usually found in nitrogen-rich wastewaters from
anaerobic digestates, e.g., anaerobically digested piggery and dairy slurries (Li et al., 2015a). Although
heavy metals affect SNaD, they are required in small quantities to enhance microbial growth and stimulate
the activity of microorganisms by stimulating enzymes and co-enzymes that play important roles in SNaD,
e.g., copper and molybdenum, which are constituents of nitrite reductase and nitrite oxidoreductase,
respectively, while other known enzymes involved in SNaD depend on other heavy metals such as nickel-
dependent hydrogenase, ATP-dependent zinc metalloprotease FtsH 1, and zinc-containing dehydrogenase
(Li et al., 2015b).
Although minute amounts of heavy metals such as Fe, CU, Co, Ni, and Zn are essential in wastewater
treatment, their toxicity towards nitrifying and denitrifying microorganisms is mainly influenced by metal
speciation, sludge health sloughing, and the type of reactor used (Aslan & Sozudogru, 2017). Moreover,
denitrification inhibition by high concentrations of nitrate in wastewater also affects the metabolism of
nitrifying and denitrifying organisms. Another challenge that hinders the practicality of SNaD is the

38
inhibition of denitrifiers by DO. Additionally, operational, maintenance, and process control strategies can
produce better reactor performance in general wastewater systems but can also hamper SNaD, especially
under rudimentary process control conditions that facilitate undesirable loadings and environmental
conditions (Show et al., 2013).
Another challenge with SNaD is the elongated start-up and stabilization period, with the NH4-N and NO2-
concentrations within the system able to affect the growth of SNaD by stunting the microbial community
proliferation during this period. Low NH4-N and NO2- concentrations can also result in substrate limitation
and can thus lead to a low growth rate of the SNaD microbial populations. Two start-up procedures for
SNaD are known to exist, with the first involving directed evolution of the SNaD microorganisms by
adaption to increasing NH4-N and NO2- concentrations. The second procedure involves the physical
inoculation with anoxic denitrifying consortium after the primary (nitrification) step of the SNaD has been
initiated. Then, the nitrification and the partial aerobic denitrification in SNaD can thereafter ensue such
that they are well established in one process unit (Zhang et al., 2014). The inhibition of SNaD by FCN is
another common challenge, as FCN has been reported to possess the highest inhibitory effect toward SNaD;
furthermore, some microorganisms suited for SNaD have been reported to use FCN as a nitrogenous source
(Luque-Almagro et al., 2016).
2.6. Prevention of Biomass Washout During the Start-Up of SNaD
Environmental engineers have been making efforts to reduce the start-up time of SNaD microorganisms in
order to reduce biomass washout and maintain the TN removal efficiency (Lochmatter & Holliger, 2014).
Different reactors with low retention times have been designed and studied, including the fluidized bed
reactor, the membrane reactor, the gas lift reactor, the rotating biological reactor, and the up-flow anaerobic
sludge blanket; however, a portion of biomass is still washed out with the effluent in all these systems,
particularly for unstable periods, due to the cases overloading to increase wastewater treatment through-
put, which induces biomass sloughing and flotation and which results in wash-out (Huang et al., 2016).
The sequencing batch reactor has been found to be the more suitable reactor for the growth of SNaD
microorganisms and is efficient in biomass retention. The possibility of immobilization of SNaD
microorganisms as biofilm on the surface carriers has also been explored as another alternative to reducing
biomass washout. The materials that have been well studied as surface carriers include zeolite, polyethylene
sponge strips, porous non-woven fabrics, novel acrylic resin materials, bamboo charcoal, and polyurethane
spheres (Daverey et al., 2015).
Szabó et al. (2016) also showed that by gradually improving biomass, settling can also reduce SNaD
washout. Parameters such as changing DO aeration strategy and contaminant load adaptation during the
early stage of the start-up as well as the availability of soluble chemical oxygen demand (COD), which can

39
readily be consumed prior to the commencement of the aeration phase at a low temperature (20 °C) and a
neutral pH, have been found to greatly affect the retention of biomass in SNaD. These parameters have
been studied in order to optimize the functionality of the SNaD (Daverey et al., 2015; Gunatilake, 2015).
Furthermore, washout can be prevented by toxicant removal by the addition of psycho-chemical pre-
treatments, which might involve chemical precipitation, adsorption, ion exchange, and electrochemical
deposition.
Additionally, these psycho-chemical pre-treatments may result in additional process operational costs;
hence, it is imperative to shift to a biotechnological approach to avoid slow startup and biomass retention
by controlling the inhibition of SNaD organisms by toxic pollutants present in wastewater. FCN degrading
bacteria have been reported to have a fast-growing rate; hence, they can provide a practical solution to the
inhibition of FCN and eliminate challenges associated with the slow growth of SNaD microorganisms
(Luque-Almagro et al., 2016).
2.7. Inhibition Mechanism of Simultaneous Nitrification and Aerobic Denitrification by Pollutants
With all the efforts that have been made to improve SNaD, this process still faces challenges, such as
inhibition by toxic pollutants. This is due to the slow growth of NOB, making SNaD prone to inhibition. It
has been shown that SNaD is more sensitive to FCN and phenol loading; as little as 1–2 mg/L of hydrogen
cyanide (HCN) could result in complete inhibition of metabolic functions of both AOB and NOB, even in
consortia bio-catalyzed SNaD. The presence of high concentrations of FCN in the MWSSs can render the
secondary treatment processes ineffective subsequent to the disposal of wastewater containing a high
concentration of TN, resulting in the deterioration of the MWSS’s effluent quality (Kim et al., 2011;
Akinpelu et al., 2016). Different inhibition mechanisms of SNaD by different pollutants have been reported.
Primary inhibition involves the deactivation of the actions or the activity of ammonia monooxygenase
(AMO), which is an important enzyme in the primary step of nitrification, through inhibition of the
respiration system of the microorganism by exogenous ligands that attach to the heme protein (His-Fe2+-
His) (Wu et al., 2017). The heme protein is required for the mediation of the redox processes and respiration,
which aid in the reduction of dissolved compounds by bacteria in MWSSs (Ruser & Schulz, 2015).
Secondary inhibition is through the binding of an inhibitor to the active site of the enzyme prohibiting the
binding of the substrate (i.e., NH4-N), thus inhibiting its oxidation. Another inhibition phenomenon
involves the removal of the AMO-Cu co-factor through chelation, culminating in the formation of an
unreactive complex and rendering the whole SNaD process ineffective. The presence of Cu co-factors has
been found to play a crucial role in the activity of AMO, which affects the oxidation of NH4-N. The last
enzymatic inhibition involves substrate oxidation, which causes the substrate to be highly reactive, resulting
in the premature excretion of the AMO as a secondary metabolite (Ruser & Schulz, 2015). FCN has been

40
proven to greatly inhibit SNaD in activated sludge systems, primarily due to inadequate AMO activity (Kim
et al., 2008). FCN inhibits nitrification and denitrification by acting as an exogenous ligand, which binds
into His-Fe2+-His in three sequential steps, which are: (1) the ionic exchange of the endogenous ligand; (2)
the formation of a reactive penta-coordinated species; and (3) the binding of the external ligand (De Sanctis
et al., 2006).
Additionally, Inglezakis et al. (2017) showed that the specific NH4--N uptake rate is less inhibited compared
to a specific oxygenation rate. It was thus concluded that the autotrophic biomass was less sensitive to FCN
than heterotrophic biomass. The inhibition of SNaD by FCN has been widely studied by many, including
Kim et al. (2011). Moreover, efforts have been made to try to eradicate SNaD inhibition by using techniques
such as the application of pretreatment systems with adsorption processes and the addition of a step whereby
microorganisms are used to treat FCN to acceptable concentrations that have a lessened impact on TN
removal subsequent to SNaD.
2.8. FCN Wastewater in Municipal Wastewater Sewage Systems (MWSSs) and Its Impact on Nitrification and Denitrification: A Culture of Illegal Wastewater Dumping
FCN is a toxic carbon-nitrogen radical found in various inorganic and organic compounds, some of which
are used on an industrial scale. A common form of FCN is hydrogen cyanide (HCN), which can be an
odorless gas characterized by a faint, bitter, almond-like odor (Safa et al., 2017; Tiong et al., 2015). Cyanide
can be found in different forms depending on the pH; at high pH, it is found as an ion of FCN and evaporates
as HCN at neutral pH, pKa 9.2. Additionally, FCN has a high affinity for metals and thus can form
complexes with metals found in nature even when released in agricultural soil (Itoba-Tombo, 2019). These
metal FCN complexes can be categorized into two categories—weak acid dissociable (WAD) and strong
acid dissociable (SAD) FCN (Han et al., 2014; Luque-Almagro et al., 2011). Microorganisms and animals
also produce minute quantities of FCN as a protection mechanism, e.g., cassava, corn, and lima beans,
forages (alfalfa, sorghum, and Sudan grasses), and horticulture plants (ornamental cherry and laurel). FCN
is often released as a nitrogenous source when the plant is under stressed environmental conditions (Gupta
et al., 2010).
As such, FCN enters MWSSs via illegal disposal of wastewater, mostly from different industries (Luque-
Almagro et al., 2016), and as runoff from the disposal of FCN containing agricultural wastes in landfills,
the use of FCN containing pesticides, and through the use of FCN containing tar salts. FCN is known for
being a metabolic inhibitor of many microorganisms, and as little as 0.3 mg/L can result in the loss of
biological activity in microorganisms (Basheer et al., 1992). It alters the metabolic functions of the
organism by forming a stable complex with transient metals that plays a significant role in the functioning
of the proteins, including micro and macro-metallo contents within cells, which play an important role in
nutritional sustenance of biomass intended for FCN bioremediation (Tiong et al., 2015). In the wastewater
41
treatment process catalyzed by biomass, this can result in the inhibition of SNaD (Han et al., 2014; Han et
al., 2013).
Some microorganisms produce minute quantities of cyanide for defensive purposes (Khamar et al., 2015),
albeit they are able to carry out most metabolic functions in the presence of low FCN. Furthermore, some
organisms are able to survive FCN expressing specialized enzymes for the degradation of FCN into NH4-
N and CO2 through nicotinamide adenine dinucleotide (NADH)-linked cyanide monooxygenase (CNO),
including enzymes such as nitralase and cyanide hydratases (CHTs) (Khamar et al., 2015; Rinágelová et
al., 2014); these can be rendered ineffective by chelation reaction-side blockages and promotion of
redundancy in the overall functionality of the bio-catalysis process.
FCN has been reported to be a highly poisonous compound known to man (Luque-Almagro et al., 2018),
and it is hyper-toxic under aerobic conditions, which would mean higher toxicity for aerobic organisms
used in SNaD. It inactivates the respiration of many microorganisms by binding to the cytochrome-c
oxidase (Murugesan et al., 2018). However, some microorganisms have developed a metabolic FCN
detoxification mechanism. These mechanisms have been studied in numerous microorganisms, which
culminated in an interest in the research community in SNaD, even under toxicant loading and particularly
under FCN loading. Studies have also shown that these microorganisms can either use FCN primarily as a
nitrogenous or as a carbon source by converting it to NH4-N and CO2 through NADH-linked cyanide
oxygenase (Dwivedi et al., 2016). FCN degradation in aerobic conditions can be expressed as highlighted
in Equation 1.
2𝐻𝐻𝐻𝐻𝐻𝐻 + 𝑂𝑂2 →𝐸𝐸𝐸𝐸𝐸𝐸𝐸𝐸𝑚𝑚𝑒𝑒
2𝐻𝐻𝐻𝐻𝐻𝐻𝑂𝑂 (1)
whereby the hydrogen cyanate is therefore hydrolyzed into NH4-N and CO2 (Equation 2):
𝐻𝐻𝐻𝐻𝑂𝑂 + 2𝐻𝐻2𝑂𝑂 → 𝐻𝐻𝐻𝐻4+ + 𝑂𝑂2− (2)
2.9. Current Solutions to the Challenges in Simultaneous Nitrification and Aerobic Denitrification (SNaD) 2.9.1. Physical Process Used as Remedial Strategy to Decrease the Inhibitory Effect of FCN on SNaD
Chemical methods have been employed to decrease the concentrations of FCN prior to SNaD. One of the
few chemical methods used includes alkaline chlorination oxidation. This method is a preferred chemical
method since it is highly effective; however, alkaline chlorination (and thus oxidation) results in undesirable
byproducts and produces excess hypochlorite, which is a toxicant. Chemical precipitation by ferrous sulfate
is another method that is preferred for FCN removal due to its cost-effectiveness and availability of the salt,
but it produces large quantities of toxic sludge. Ion exchange can also be used to lower FCN concentration,

42
although it is difficult to operate and has high input costs (Cui et al., 2014). Activated carbon has also been
widely used to effectively remove pollutants in MWSSs (Ramavandi, 2016). However, activated carbon
has been reported to be less effective at removing metals and some inorganic pollutants—especially FCN—
due to their low adsorbability in poor quality wastewater. It was reported that the adsorption capability of
activated carbon depends on the potpourri of available chemical species, thus some research has suggested
modification of different activated carbon functional groups to enhance selective adsorption capability
(Singh at al., 2016). The use of such activated carbon can result in increased production cost, which would
in turn increase operational costs of SNaD, thus making this option a less desirable remedial strategy for
TN reduction when considering the inhibition of FCN. Thus, more appropriate and less costly methods are
required, with some biological processes being proposed as suitable approaches (Özel et al., 2010).
2.9.2. Biological Systems Responsible for Lowering FCN Concentration Prior to SNaD
As a remedial strategy, the elimination of FCN by microbial processes carried out during wastewater
treatment is usually employed to detoxify FCN into NH4-N. These microorganisms use different
mechanisms for FCN degradation with five different FCN degradation mechanisms known, which are
hydrolytic, oxidative, reductive, substitution/transfer, and synthesis pathways (Gupta et al., 2010). The
hydrolytic, the oxidative, and the reductive pathways are because of enzymatic actions for which FCN is
transformed into simple organic or inorganic byproducts such as NH4-N and CO2, and the other two
mechanisms (substitution/transfer and synthesis mechanisms) are responsible for the assimilation of FCN
(Gupta et al., 2010).
These pathways are used for the assimilation of FCN as a nitrogen and a carbon source. The hydrolytic
pathway is catalyzed by five different enzymes, including cyanide hydratase, nitrile hydratase, and
thiocyanate hydrolase. These enzymes have specific activators for and direct hydrolysis of FCN.
Additionally, some hydrolyze the triple bond between the carbon and the nitrogen elements to form
formaldehyde. Others, including nitrilase and cyanidase, are effective in the microbial metabolic activity
and the conversion of FCN into NH4-N and a carboxylic acid (Inglezakis et al., 2017; Dwivedi et al., 2016).
The oxidative pathway involves oxygenolytic conversion of the FCN into CO2 and NH4-N, although this
pathway requires an addition of a carbon source, e.g., agricultural waste extracts, and nicotinamide adenine
dinucleotide phosphate (NADPH) to catalyze the degradation pathway (Inglezakis et al., 2017; Dwivedi et
al., 2016). Moreover, the oxidative pathway is divided further into two distinctive pathways involving three
enzymes, namely, cyanide monooxygenase, cyanase, and cyanide dioxygenase. The reductive pathway
occurs anaerobically and is catalyzed by nitrogenase to convert FCN to methane and ammonium (Sharma
et al., 2019), a process that is not facilitated in SNaD.
43
The substitution/transfer pathway catalyzes FCN assimilation for growth purposes with the aid of rhodenase
and mercaptopyruvate sulfurtransferase by using FCN as a nitrogen source. The synthesis pathway is
another FCN assimilation pathway that involves the production of an amino acid, β-cyanoalanine, and ϒ-
cyano-α-aminobutyric acid, using other amino acid residues as precursors that react with the FCN
compound (Sharma et al., 2019). Conversely, FCN degradation has been found to be significantly inhibited
by some by-products of NH4-N oxidation, such as those analogous to organic acids (Kao et al., 2003).
To date, there is still minimal literature on the exploitation of FCN resistant or tolerant organisms with an
ability to mediate the inhibition effect of FCN compounds in MWSSs. Additionally, Mekuto et al. (2015)
also reported SNaD at 100–300 mg FCN/L loading by the Bacillus species. According to the authors, whilst
the use of cyanide degrading bacteria to lower toxicity levels of FCN is environmentally benign, the
additional reactors in series prior to SNaD can be beneficial for FCN degradation, which can escalate
operational costs in MWSSs.
Some FCN degrading microorganisms displayed the ability to degrade FCN subsequent to SNaD. This led
to Kim et al. (2008) proposition of using FCN degrading microorganisms for SNaD, which is an interesting
phenomenon that promotes the simultaneous removal of the FCN compound and TN and eventually results
in the implementation of SNaD in lower operational cost associated settings, even in an FCN biodegradation
reactor.
2.9.3. Overall Remarks on Remedial Strategies in Place to Mitigate FC in SNaD
Although efforts have been made to address the inhibition of SNaD by FCN, the current strategies in place
have their limitations; for example, the activated carbon is not effective in the absorption of FCN. Hence,
this option is not an appropriate remedial strategy to lower FCN in wastewater on a large scale. The use of
FCN degrading bacteria to lower FCN concentration to acceptable standards prior to SNaD has attracted
more attention since it is an environmentally benign option. However, this option can result in the escalation
of operational costs associated with the maintenance of the primary reactor designated for FCN degradation.
Hence, it is important that this option be re-evaluated to minimize costs.
2.10. A Proposed Sustainable Solution: Environmental Benignity at the Core of SNaD Development 2.10.1. Application of FCN Resistant Microorganisms in Simultaneous Nitrification and Aerobic Denitrification (SNaD) Under Cyanogenic Conditions
Research has shown that there are FCN resistant microorganisms that can remain active even in
concentrations above 18 mg FCN/L (Chen et al., 2008). Kim et at. (2013) successfully achieved SNaD
under high FCN conditions using FCN degrading bacteria in a single reactor process (Han et al., 2014).
Microorganisms use different mechanisms to resist the influence of FCN through the enzymatic mechanism
for FCN degradation through the degradation of FCN into less toxic compounds (cyanotrophic organisms)
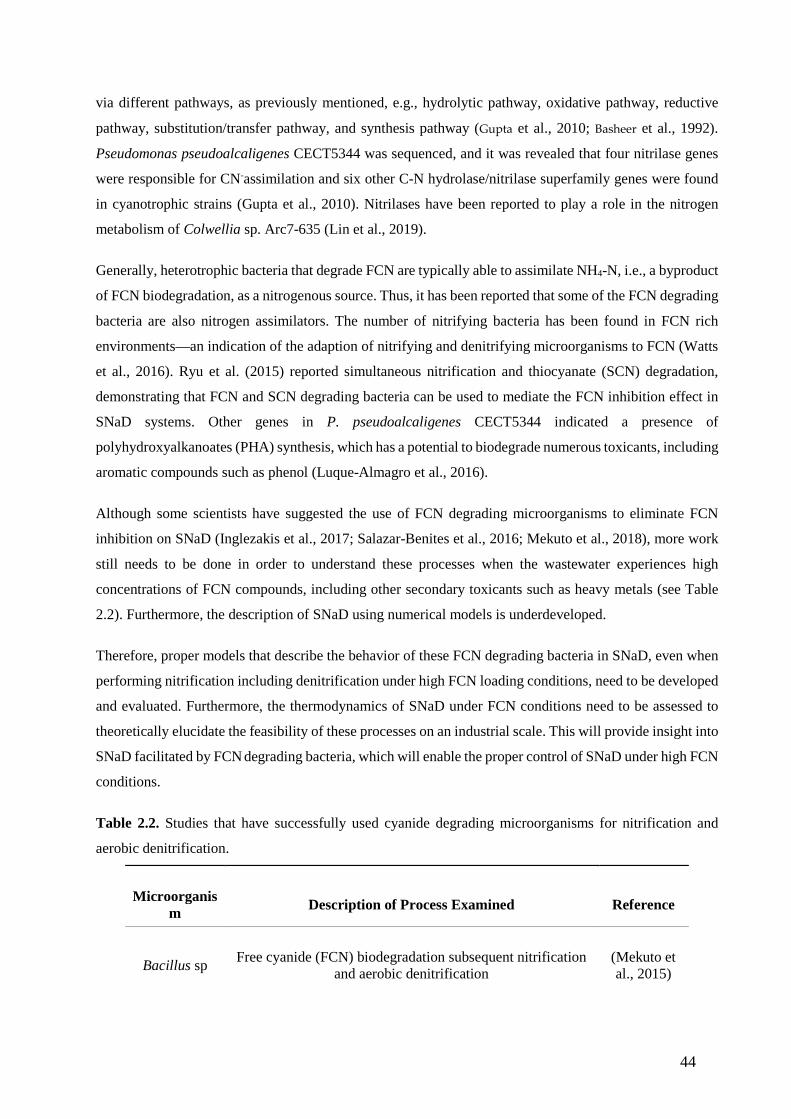
44
via different pathways, as previously mentioned, e.g., hydrolytic pathway, oxidative pathway, reductive
pathway, substitution/transfer pathway, and synthesis pathway (Gupta et al., 2010; Basheer et al., 1992).
Pseudomonas pseudoalcaligenes CECT5344 was sequenced, and it was revealed that four nitrilase genes
were responsible for CN-assimilation and six other C-N hydrolase/nitrilase superfamily genes were found
in cyanotrophic strains (Gupta et al., 2010). Nitrilases have been reported to play a role in the nitrogen
metabolism of Colwellia sp. Arc7-635 (Lin et al., 2019).
Generally, heterotrophic bacteria that degrade FCN are typically able to assimilate NH4-N, i.e., a byproduct
of FCN biodegradation, as a nitrogenous source. Thus, it has been reported that some of the FCN degrading
bacteria are also nitrogen assimilators. The number of nitrifying bacteria has been found in FCN rich
environments—an indication of the adaption of nitrifying and denitrifying microorganisms to FCN (Watts
et al., 2016). Ryu et al. (2015) reported simultaneous nitrification and thiocyanate (SCN) degradation,
demonstrating that FCN and SCN degrading bacteria can be used to mediate the FCN inhibition effect in
SNaD systems. Other genes in P. pseudoalcaligenes CECT5344 indicated a presence of
polyhydroxyalkanoates (PHA) synthesis, which has a potential to biodegrade numerous toxicants, including
aromatic compounds such as phenol (Luque-Almagro et al., 2016).
Although some scientists have suggested the use of FCN degrading microorganisms to eliminate FCN
inhibition on SNaD (Inglezakis et al., 2017; Salazar-Benites et al., 2016; Mekuto et al., 2018), more work
still needs to be done in order to understand these processes when the wastewater experiences high
concentrations of FCN compounds, including other secondary toxicants such as heavy metals (see Table
2.2). Furthermore, the description of SNaD using numerical models is underdeveloped.
Therefore, proper models that describe the behavior of these FCN degrading bacteria in SNaD, even when
performing nitrification including denitrification under high FCN loading conditions, need to be developed
and evaluated. Furthermore, the thermodynamics of SNaD under FCN conditions need to be assessed to
theoretically elucidate the feasibility of these processes on an industrial scale. This will provide insight into
SNaD facilitated by FCN degrading bacteria, which will enable the proper control of SNaD under high FCN
conditions.
Table 2.2. Studies that have successfully used cyanide degrading microorganisms for nitrification and
aerobic denitrification.
Microorganism Description of Process Examined Reference
Bacillus sp Free cyanide (FCN) biodegradation subsequent nitrification and aerobic denitrification
(Mekuto et al., 2015)

45
CN− degrading consortium
Heterotrophic nitrification—aerobic denitrification potential of cyanide
and thiocyanate degrading microbial communities under cyanogenic conditions
(Mekuto et al., 2018)
Enterobacter sp.,
Yersinia sp. And
Serratia sp
Nitrification and aerobic denitrification under cyanogenic conditions
(mpongwana et al., 2016)
Pseudomonas fluorescens
Elimination of cyanide inhibition through cultivation of cyanide
degrading bacteria
(Han et al., 2014)
Thiobacillus and
Micractinium Simultaneously remove SCN and total nitrogen (Ryu et al.,
2015)
2.11. Conclusion
SNaD system development faces many challenges; among these is the inhibition of SNaD consortia by
FCN, a predominant challenge in most MWSSs. FCN is a byproduct of most industrial processes, such as
electroplating and ore processing in the mining industry. FCN enters MWSSs through various pathways,
which include runoffs from cyanide spills or disposal of FCN containing wastewater from numerous
industries. Different psycho-chemical methods have been used to treat FCN prior to the SNaD process;
however, these methods produce undesirable byproducts and they are expensive. Hence, it is important that
a sustainable solution to the FCN inhibition of SNaD be developed. Biological removal of cyanide has been
thoroughly studied, and it is the most commonly used method due to its cost-effectiveness and
sustainability. This method has been used as pre-treatment of FCN prior to the influent entering the SNaD;
nevertheless, this procedure increases the cost associated with the operation of the SNaD systems.
The ability of FCN degrading microorganisms to carry out simultaneous nitrification and SCN degradation
has also been recommended for SNaD. This approach not only provides a solution to the inhibition of FCN
but also provides a solution to the slow growth rate of common SNaD microorganisms. Therefore, the
application of FCN degrading microorganisms could provide a sustainable solution to the inhibition of
SNaD by other toxic pollutants and prevent biomass washout. The utilization of FCN resistant or degrading
microorganisms for SNaD has been suggested by other scientists. However, for the use of FCN resistant or
degrading microorganisms to minimize the inhibition effect of FCN towards processes of TN removal,
mathematical and thermodynamic models are required to better understand SNaD as a sustainable approach
to eradicating the inhibition effect of FCN in SNaD systems. There is still limited information about the
46
employment of these suitable microorganisms for SNaD; thus, this paper discusses the application of FCN
resistant or degrading microorganisms for SNaD to reduce the effect of FCN inhibition, even under
conditions whereby agricultural waste can be used as a supplementary nutrient source and as an
immobilization surface for improved efficacy of microbial proliferation for the advancement of SNaD.

47
CHAPTER 3
LITERATURE REVIEW 2
Submitted as: N. Mpongwana, S. K. O. Ntwampe, E. I. Omodanisi, B.S. Chidi, C. Dlangamandla, M.R.
Mukandi. Significance of metabolic network modeling of total nitrogen removal in simultaneous
nitrification and aerobic denitrification. Submitted to Bioengineering
48
CHAPTER 3:
LITERATURE REVIEW 2
3.1. Introduction
Water pollution has become a worldwide challenge (Ceissen et al., 2015), with water becoming a scarce
resource in many arid and semi-arid countries (Eliasson et al., 2015). It is important to implement a rigid
wastewater treatment plan to promote the conservation of water (Lyu et al., 2016). and the reduction of
environmental contaminants; thus, prevention of environmental degradation.
Biological processes are the core technology used for nutrient removal in particular total nitrogen removal
(TN). Moreover, biological nitrogen removal (BNR) has drawn much interest due to its efficiency and cost-
effectiveness (Peng & Zhu, 2006; Zhang et al., 2011). Stringent government regulations with regards to the
disposal of water containing TN are currently in place and are strictly enforced globally (Chen et al., 2018).
Hence, the need for appropriate understanding and proper control of TN removal processes which has
become essential for BNR (Seifi & Fazaelipoor, 2012) since improper controlling of BNR can result in
serious environmental and public health challenges (Hamed et al., 2004).
Substantial studies have been conducted to improve TN removal efficiency, thus lowering quantity TN
being disposed into water bodies. These improvements include the use of microorganisms capable of
simultaneously removing NH4-N and NO3-N under similar conditions, resulting in simultaneous
nitrification and aerobic denitrification (SNaD) (Chen et al., 2012). Nevertheless, SNaD has been found to
be heavily inhibited by heavy metals especially free cyanide (FCN); hence, the application of cyanogenic
microorganisms that are able to use FCN and simultaneously degrade NH4-N have been suggested (Kim et
al., 2008).
Modeling plays an important role in accurate facilitation, controlling and designing of BNR (Gao et al.,
2010). Various mathematical models have been developed for conventional nitrification and denitrification
of wastewater (Sin et al., 2008). Although these mathematical models have been successfully employed,
they have their limitations, i.e. most traditional models focus on nitrification and denitrification of which
nitrification have been proven to be a two-step process, though in majority of wastewater treatment plants,
nitrite accumulates insignificantly, making the model redundant (Gao et al., 2010; Sin et al., 2008).
In other cases, nitrite plays a crucial role in wastewater treatment; especially in SNaD through the nitrite
route. These traditional models are less effective in such cases as they do not comprehensively pronounce
nitrite accumulation and depletion. Additionally, since wastewater consists of different contaminants, these
mathematical models do not account for microbial diauxic growth which is an important phenomenon in
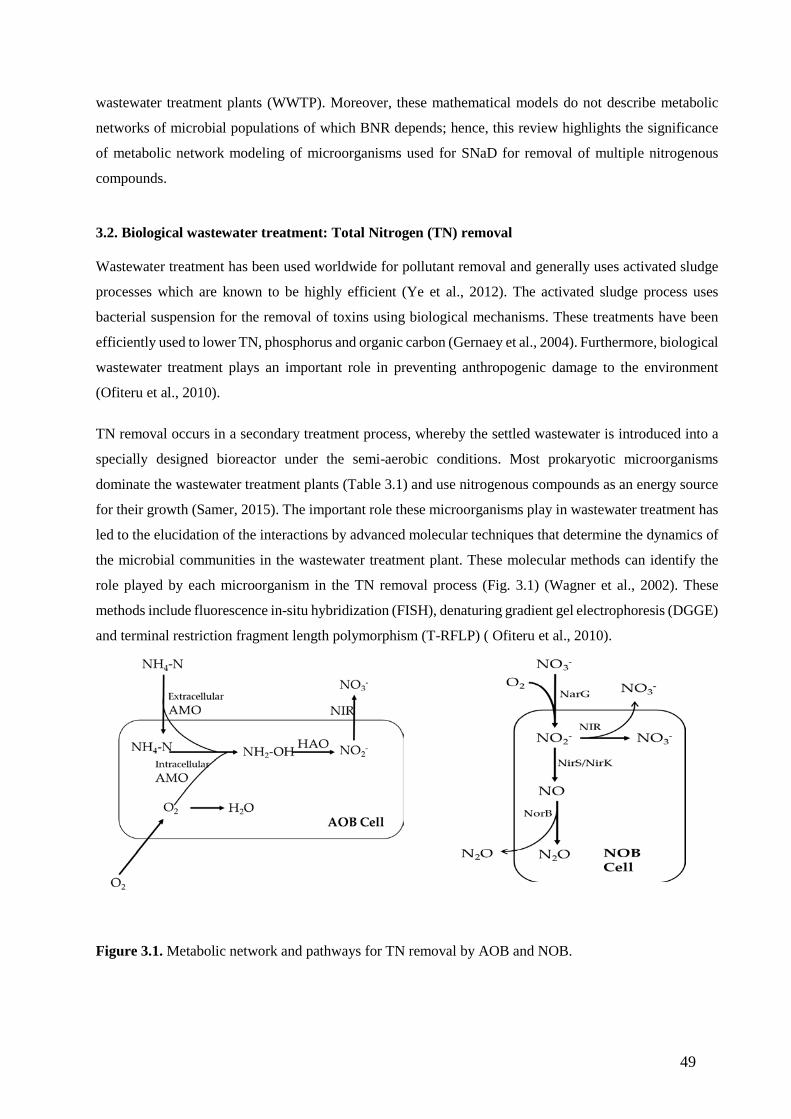
49
wastewater treatment plants (WWTP). Moreover, these mathematical models do not describe metabolic
networks of microbial populations of which BNR depends; hence, this review highlights the significance
of metabolic network modeling of microorganisms used for SNaD for removal of multiple nitrogenous
compounds.
3.2. Biological wastewater treatment: Total Nitrogen (TN) removal
Wastewater treatment has been used worldwide for pollutant removal and generally uses activated sludge
processes which are known to be highly efficient (Ye et al., 2012). The activated sludge process uses
bacterial suspension for the removal of toxins using biological mechanisms. These treatments have been
efficiently used to lower TN, phosphorus and organic carbon (Gernaey et al., 2004). Furthermore, biological
wastewater treatment plays an important role in preventing anthropogenic damage to the environment
(Ofiteru et al., 2010).
TN removal occurs in a secondary treatment process, whereby the settled wastewater is introduced into a
specially designed bioreactor under the semi-aerobic conditions. Most prokaryotic microorganisms
dominate the wastewater treatment plants (Table 3.1) and use nitrogenous compounds as an energy source
for their growth (Samer, 2015). The important role these microorganisms play in wastewater treatment has
led to the elucidation of the interactions by advanced molecular techniques that determine the dynamics of
the microbial communities in the wastewater treatment plant. These molecular methods can identify the
role played by each microorganism in the TN removal process (Fig. 3.1) (Wagner et al., 2002). These
methods include fluorescence in-situ hybridization (FISH), denaturing gradient gel electrophoresis (DGGE)
and terminal restriction fragment length polymorphism (T-RFLP) ( Ofiteru et al., 2010).
Figure 3.1. Metabolic network and pathways for TN removal by AOB and NOB.

50
Table 3.1. Organisms used for TN removal of different wastewater sources (McLellan et al., 2010).
Taxonomy Order/family
Genus (species) Percentage of sequence tags
Human waste Sewage wastewater
Surface water
Lachnospiraceae 40.78 5.49 0.03
Bacteroidaceae Bacteroides 11.17 1.98 <0.01
Ruminococcaceae Faecalibacterium 7.28 1.35 ND
Bifidobacteriaceae Bifidobacterium 7.28 0.74 ND
Ruminococcaceae 4.87 0.91 0.02
Ruminococcaceae Subdoligranulum 4.13 0.38 ND
Lachnospiraceae Roseburia 4.09 0.37 ND
Bacteroidaceae Bacteroides ovatus
2.25 0.17 ND
Lachnospiraceae Dorea 2.17 0.30 ND
Ruminococcaceae Ruminococcus 2.16 0.31 ND
Coriobacteriaceae Collinsella 1.07 0.24 ND
Alcaligenaceae Sutterella 1.00 0.05 0.01
Porphyromonadaceae Parabacteroides 0.99 1.33 <0.01
Clostridia 0.95 0.17 <0.01
Akkermansiaceae Akkermansia 0.93 0.08 ND
Peptostreptococcaceae 0.76 0.20 <0.01
Lachnospiraceae Lachnospira 0.71 0.07 ND
Bacteroidaceae Bacteroides fragilis
0.58 0.06 ND
Bacteroidaceae Bacteroides massiliensis
0.57 0.12 ND
Ruminococcaceae Papillibacter 0.48 0.06 <0.01
Total 95.24 14.35 0.07
The development of new high throughput technologies used for sequencing to identify microbial
communities within a short period of time has made genomic sequencing, transcription, and proteomic data

51
readily available; e.g. elucidation of microbial populations involved in biological processes for SNaD.
Important as this data is, there is a lack of data analysis tools that are capable of performing phenotypic
characteristics of microorganisms and the exploration of SNaD. On the other hand, scientists are also using
genic information to generate new understanding by automated genome annotation, metabolic network
reconstruction, protein structure determination and, regulatory network reconstruction from microarray data
(Edwards et al., 2002; Le et al., 2004; Zhou et al., 2015).
3.3. Microbial population and contaminant metabolism in wastewater 3.3.1. Microbial metabolic interactions in wastewater treatment
Microorganisms are mostly found as sludge flocs or biofilm that are composed of a number of immersed
species in wastewater treatment plants (Sheng et al., 2010). The function of these biofilms or flocs is
determined by a number of factors including reaction rates of individual organisms. The matrix architecture,
movement of substrate into biofilm or flocs, the composition of the extracellular polymeric substances
(EPS) being produced and the interaction of microorganisms as a whole, also plays a role (Andersson et al.,
2011).
EPS has been found to pose a significant impact on the protection of nitrifying and denitrifying biofilms
from toxic contaminants. EPS significantly influence the physicochemical properties of microbial
aggregates and many other properties of flocs including their structure, surface charge, flocculation, settling
properties, dewatering properties, and adsorption ability (Sheng et al., 2010). The interactions of microbial
species in wastewater is either metabolism-based or driven by ecological traits. The metabolic interaction
involves the communication of different species through their metabolic products, i.e., the degradation of
NH4-N which then induces nitrifying and denitrifying enzymes leading to the initiation of SNaD (Wang et
al., 2015). Moreover, the interaction between species can be either described as positive, negative or a
neutral interaction (Table 3.2) (Perez-Garcia et al., 2016). To understand such an interaction metabolic
network modeling is essential as the symbioses between different microbial species in the biocatalysis for
TN removal during SNaD as this can be a rate-limiting step in wastewater treatment.
Table 3.2. Diagram representing microbial metabolic interaction versus ecological interaction. Where blue
circles are species A, red circles are species B, and squares are substrates.
Symbiotic relationship Ecological interaction Metabolic interaction
0/+
Commensalism
Food chain

52
-/-
Competition
Substrate competition
+/-
Parasitism
Food chain with by-product inhibition
+/+
Mutualism
Syntrophy
0/-
Amensalism
By-product inhibition
3.3.2. Microbial metabolism during the removal of TN in wastewater treatment plant
The secondary sludge process is composed of biological solids and inert sludge is responsible for the
removal of TN and other nutrients in wastewater (Ye et al., 2012). The microorganisms remove TN through
metabolic functions of immersed species within (Hu et al., 2012).
Most WWTP uses aerobic metabolism to remove TN through chemotrophic bacteria which nitrify NH4-N
into nitrate via the nitrite-nitrogen route (Low & Chase, 1999). Cellular metabolism comprises of the uptake
and the transformation of TN using a complex network of reactions that are facilitated by specific enzymes.
The production of components from TN removal known as metabolites and other metabolic by-products
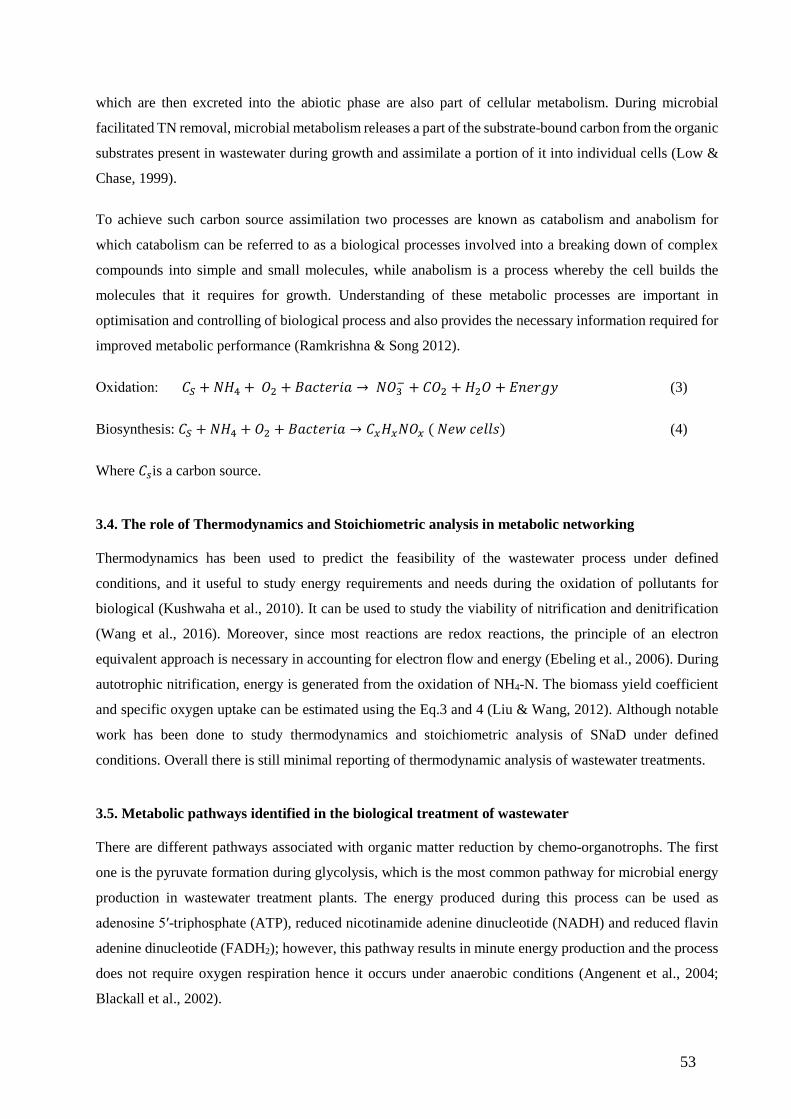
53
which are then excreted into the abiotic phase are also part of cellular metabolism. During microbial
facilitated TN removal, microbial metabolism releases a part of the substrate-bound carbon from the organic
substrates present in wastewater during growth and assimilate a portion of it into individual cells (Low &
Chase, 1999).
To achieve such carbon source assimilation two processes are known as catabolism and anabolism for
which catabolism can be referred to as a biological processes involved into a breaking down of complex
compounds into simple and small molecules, while anabolism is a process whereby the cell builds the
molecules that it requires for growth. Understanding of these metabolic processes are important in
optimisation and controlling of biological process and also provides the necessary information required for
improved metabolic performance (Ramkrishna & Song 2012).
Oxidation: 𝐻𝐻𝑆𝑆 + 𝐻𝐻𝐻𝐻4 + 𝑂𝑂2 + 𝐵𝐵𝐵𝐵𝐵𝐵𝐵𝐵𝑒𝑒𝑟𝑟𝐵𝐵𝐵𝐵 → 𝐻𝐻𝑂𝑂3− + 𝐻𝐻𝑂𝑂2 + 𝐻𝐻2𝑂𝑂 + 𝐸𝐸𝐸𝐸𝑒𝑒𝑟𝑟𝐸𝐸𝐸𝐸 (3)
Biosynthesis: 𝐻𝐻𝑆𝑆 + 𝐻𝐻𝐻𝐻4 + 𝑂𝑂2 + 𝐵𝐵𝐵𝐵𝐵𝐵𝐵𝐵𝑒𝑒𝑟𝑟𝐵𝐵𝐵𝐵 → 𝐻𝐻𝑚𝑚𝐻𝐻𝑚𝑚𝐻𝐻𝑂𝑂𝑚𝑚 ( 𝐻𝐻𝑒𝑒𝑁𝑁 𝐵𝐵𝑒𝑒𝑐𝑐𝑐𝑐𝑐𝑐) (4)
Where 𝐻𝐻𝑠𝑠is a carbon source.
3.4. The role of Thermodynamics and Stoichiometric analysis in metabolic networking
Thermodynamics has been used to predict the feasibility of the wastewater process under defined
conditions, and it useful to study energy requirements and needs during the oxidation of pollutants for
biological (Kushwaha et al., 2010). It can be used to study the viability of nitrification and denitrification
(Wang et al., 2016). Moreover, since most reactions are redox reactions, the principle of an electron
equivalent approach is necessary in accounting for electron flow and energy (Ebeling et al., 2006). During
autotrophic nitrification, energy is generated from the oxidation of NH4-N. The biomass yield coefficient
and specific oxygen uptake can be estimated using the Eq.3 and 4 (Liu & Wang, 2012). Although notable
work has been done to study thermodynamics and stoichiometric analysis of SNaD under defined
conditions. Overall there is still minimal reporting of thermodynamic analysis of wastewater treatments.
3.5. Metabolic pathways identified in the biological treatment of wastewater
There are different pathways associated with organic matter reduction by chemo-organotrophs. The first
one is the pyruvate formation during glycolysis, which is the most common pathway for microbial energy
production in wastewater treatment plants. The energy produced during this process can be used as
adenosine 5′-triphosphate (ATP), reduced nicotinamide adenine dinucleotide (NADH) and reduced flavin
adenine dinucleotide (FADH2); however, this pathway results in minute energy production and the process
does not require oxygen respiration hence it occurs under anaerobic conditions (Angenent et al., 2004;
Blackall et al., 2002).
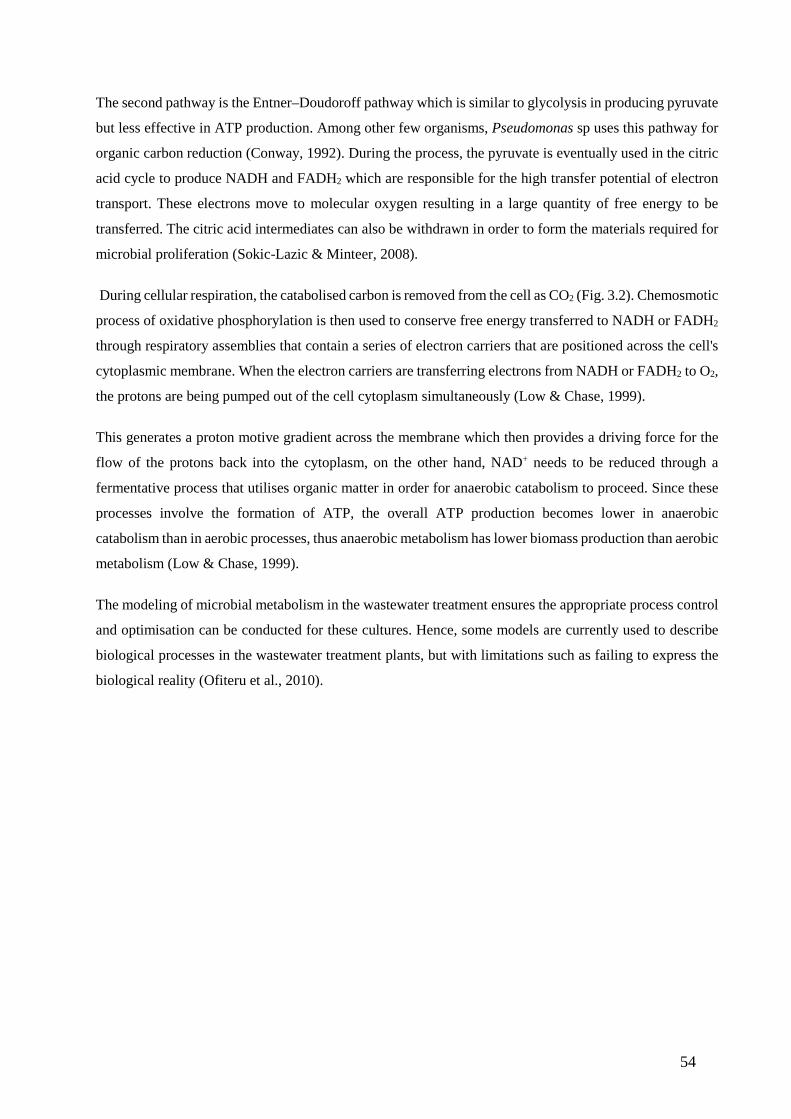
54
The second pathway is the Entner–Doudoroff pathway which is similar to glycolysis in producing pyruvate
but less effective in ATP production. Among other few organisms, Pseudomonas sp uses this pathway for
organic carbon reduction (Conway, 1992). During the process, the pyruvate is eventually used in the citric
acid cycle to produce NADH and FADH2 which are responsible for the high transfer potential of electron
transport. These electrons move to molecular oxygen resulting in a large quantity of free energy to be
transferred. The citric acid intermediates can also be withdrawn in order to form the materials required for
microbial proliferation (Sokic-Lazic & Minteer, 2008).
During cellular respiration, the catabolised carbon is removed from the cell as CO2 (Fig. 3.2). Chemosmotic
process of oxidative phosphorylation is then used to conserve free energy transferred to NADH or FADH2
through respiratory assemblies that contain a series of electron carriers that are positioned across the cell's
cytoplasmic membrane. When the electron carriers are transferring electrons from NADH or FADH2 to O2,
the protons are being pumped out of the cell cytoplasm simultaneously (Low & Chase, 1999).
This generates a proton motive gradient across the membrane which then provides a driving force for the
flow of the protons back into the cytoplasm, on the other hand, NAD+ needs to be reduced through a
fermentative process that utilises organic matter in order for anaerobic catabolism to proceed. Since these
processes involve the formation of ATP, the overall ATP production becomes lower in anaerobic
catabolism than in aerobic processes, thus anaerobic metabolism has lower biomass production than aerobic
metabolism (Low & Chase, 1999).
The modeling of microbial metabolism in the wastewater treatment ensures the appropriate process control
and optimisation can be conducted for these cultures. Hence, some models are currently used to describe
biological processes in the wastewater treatment plants, but with limitations such as failing to express the
biological reality (Ofiteru et al., 2010).
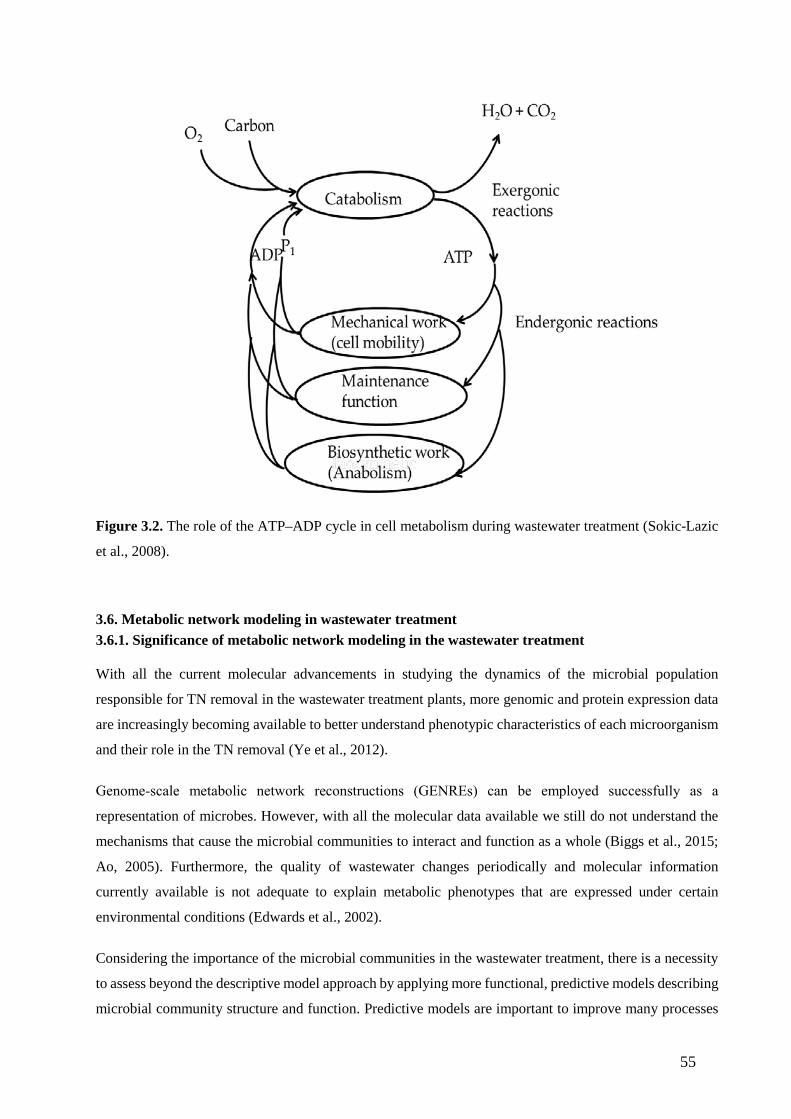
55
Figure 3.2. The role of the ATP–ADP cycle in cell metabolism during wastewater treatment (Sokic-Lazic
et al., 2008).
3.6. Metabolic network modeling in wastewater treatment 3.6.1. Significance of metabolic network modeling in the wastewater treatment
With all the current molecular advancements in studying the dynamics of the microbial population
responsible for TN removal in the wastewater treatment plants, more genomic and protein expression data
are increasingly becoming available to better understand phenotypic characteristics of each microorganism
and their role in the TN removal (Ye et al., 2012).
Genome‐scale metabolic network reconstructions (GENREs) can be employed successfully as a
representation of microbes. However, with all the molecular data available we still do not understand the
mechanisms that cause the microbial communities to interact and function as a whole (Biggs et al., 2015;
Ao, 2005). Furthermore, the quality of wastewater changes periodically and molecular information
currently available is not adequate to explain metabolic phenotypes that are expressed under certain
environmental conditions (Edwards et al., 2002).
Considering the importance of the microbial communities in the wastewater treatment, there is a necessity
to assess beyond the descriptive model approach by applying more functional, predictive models describing
microbial community structure and function. Predictive models are important to improve many processes
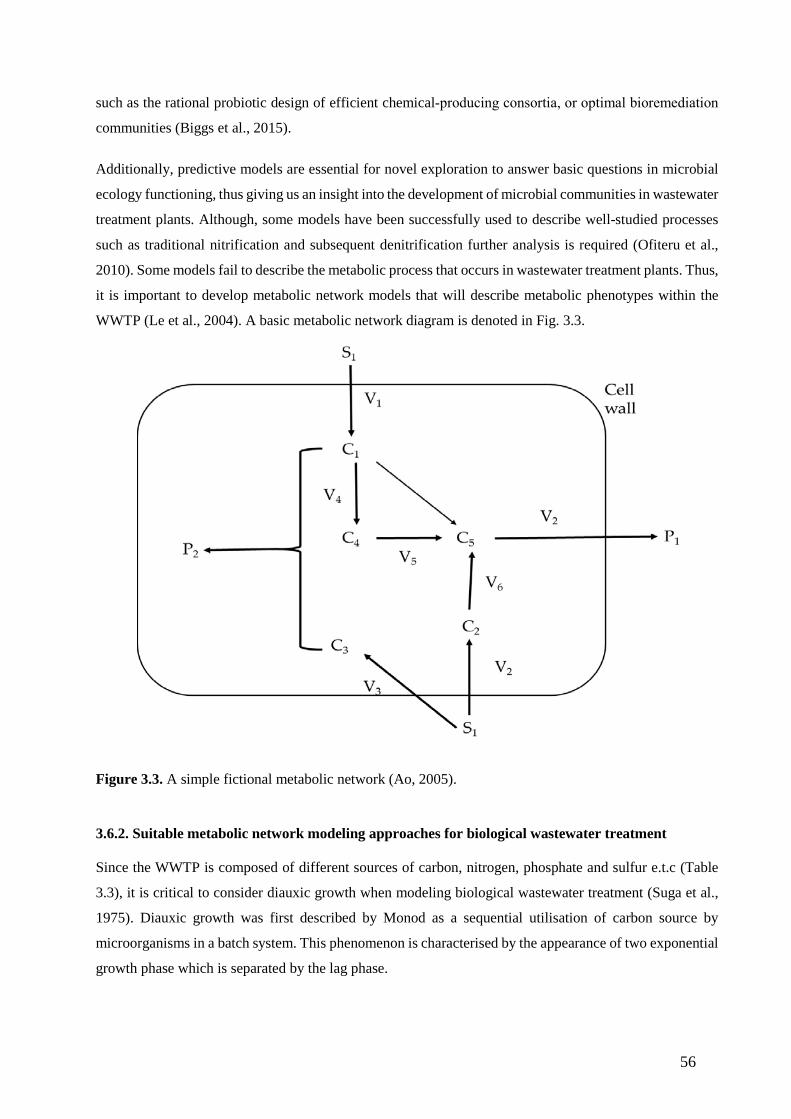
56
such as the rational probiotic design of efficient chemical‐producing consortia, or optimal bioremediation
communities (Biggs et al., 2015).
Additionally, predictive models are essential for novel exploration to answer basic questions in microbial
ecology functioning, thus giving us an insight into the development of microbial communities in wastewater
treatment plants. Although, some models have been successfully used to describe well-studied processes
such as traditional nitrification and subsequent denitrification further analysis is required (Ofiteru et al.,
2010). Some models fail to describe the metabolic process that occurs in wastewater treatment plants. Thus,
it is important to develop metabolic network models that will describe metabolic phenotypes within the
WWTP (Le et al., 2004). A basic metabolic network diagram is denoted in Fig. 3.3.
Figure 3.3. A simple fictional metabolic network (Ao, 2005).
3.6.2. Suitable metabolic network modeling approaches for biological wastewater treatment
Since the WWTP is composed of different sources of carbon, nitrogen, phosphate and sulfur e.t.c (Table
3.3), it is critical to consider diauxic growth when modeling biological wastewater treatment (Suga et al.,
1975). Diauxic growth was first described by Monod as a sequential utilisation of carbon source by
microorganisms in a batch system. This phenomenon is characterised by the appearance of two exponential
growth phase which is separated by the lag phase.
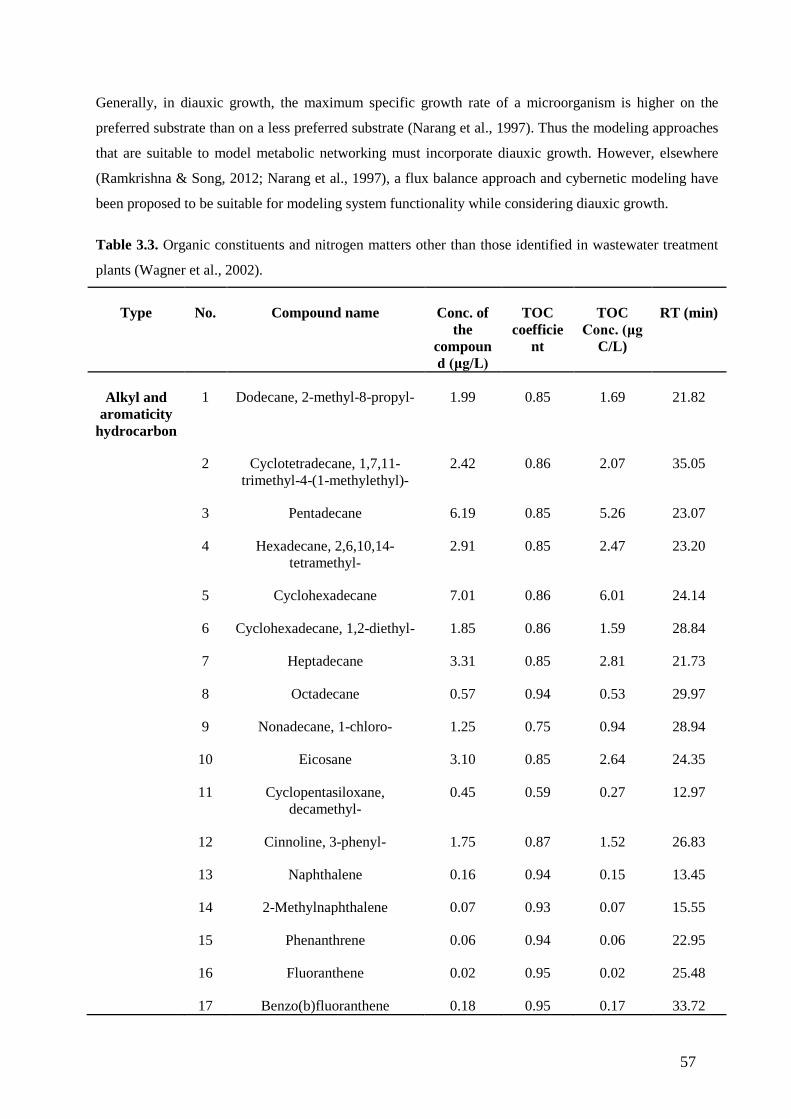
57
Generally, in diauxic growth, the maximum specific growth rate of a microorganism is higher on the
preferred substrate than on a less preferred substrate (Narang et al., 1997). Thus the modeling approaches
that are suitable to model metabolic networking must incorporate diauxic growth. However, elsewhere
(Ramkrishna & Song, 2012; Narang et al., 1997), a flux balance approach and cybernetic modeling have
been proposed to be suitable for modeling system functionality while considering diauxic growth.
Table 3.3. Organic constituents and nitrogen matters other than those identified in wastewater treatment
plants (Wagner et al., 2002).
Type No. Compound name Conc. of the
compound (μg/L)
TOC coefficie
nt
TOC Conc. (μg
C/L)
RT (min)
Alkyl and aromaticity
hydrocarbon
1 Dodecane, 2-methyl-8-propyl- 1.99 0.85 1.69 21.82
2 Cyclotetradecane, 1,7,11-trimethyl-4-(1-methylethyl)-
2.42 0.86 2.07 35.05
3 Pentadecane 6.19 0.85 5.26 23.07
4 Hexadecane, 2,6,10,14-tetramethyl-
2.91 0.85 2.47 23.20
5 Cyclohexadecane 7.01 0.86 6.01 24.14
6 Cyclohexadecane, 1,2-diethyl- 1.85 0.86 1.59 28.84
7 Heptadecane 3.31 0.85 2.81 21.73
8 Octadecane 0.57 0.94 0.53 29.97
9 Nonadecane, 1-chloro- 1.25 0.75 0.94 28.94
10 Eicosane 3.10 0.85 2.64 24.35
11 Cyclopentasiloxane, decamethyl-
0.45 0.59 0.27 12.97
12 Cinnoline, 3-phenyl- 1.75 0.87 1.52 26.83
13 Naphthalene 0.16 0.94 0.15 13.45
14 2-Methylnaphthalene 0.07 0.93 0.07 15.55
15 Phenanthrene 0.06 0.94 0.06 22.95
16 Fluoranthene 0.02 0.95 0.02 25.48
17 Benzo(b)fluoranthene 0.18 0.95 0.17 33.72
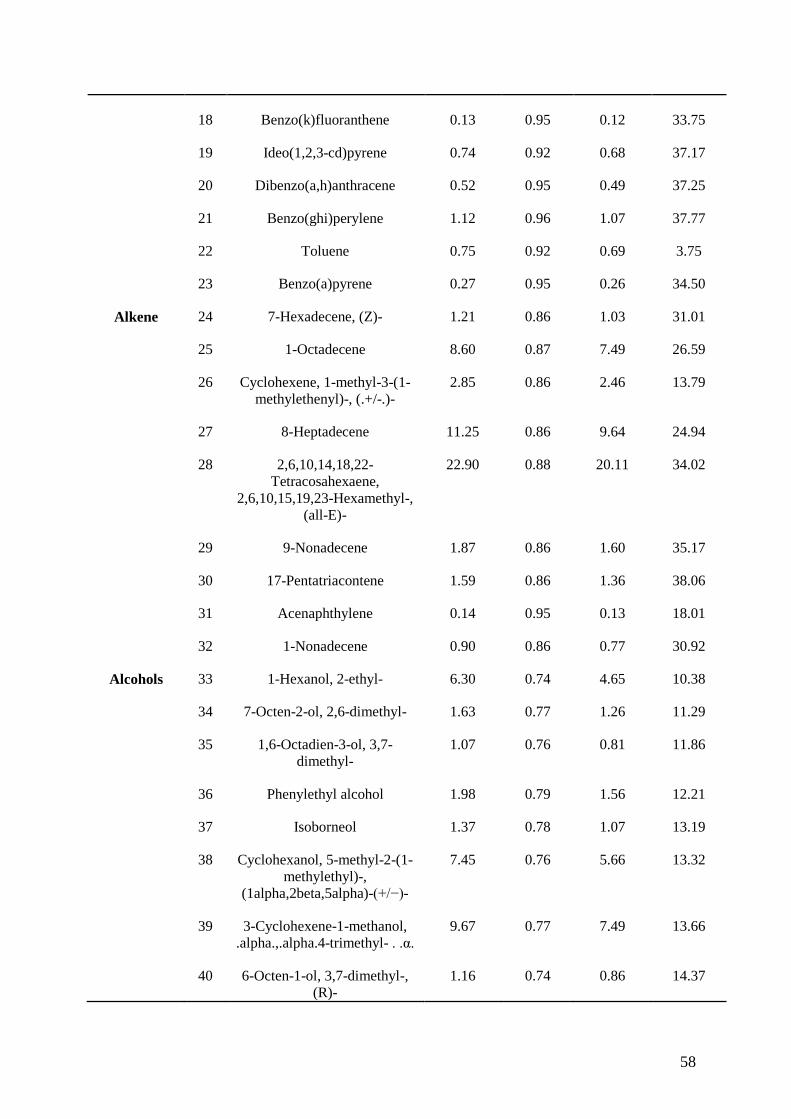
58
18 Benzo(k)fluoranthene 0.13 0.95 0.12 33.75
19 Ideo(1,2,3-cd)pyrene 0.74 0.92 0.68 37.17
20 Dibenzo(a,h)anthracene 0.52 0.95 0.49 37.25
21 Benzo(ghi)perylene 1.12 0.96 1.07 37.77
22 Toluene 0.75 0.92 0.69 3.75
23 Benzo(a)pyrene 0.27 0.95 0.26 34.50
Alkene 24 7-Hexadecene, (Z)- 1.21 0.86 1.03 31.01
25 1-Octadecene 8.60 0.87 7.49 26.59
26 Cyclohexene, 1-methyl-3-(1-methylethenyl)-, (.+/-.)-
2.85 0.86 2.46 13.79
27 8-Heptadecene 11.25 0.86 9.64 24.94
28 2,6,10,14,18,22-Tetracosahexaene,
2,6,10,15,19,23-Hexamethyl-, (all-E)-
22.90 0.88 20.11 34.02
29 9-Nonadecene 1.87 0.86 1.60 35.17
30 17-Pentatriacontene 1.59 0.86 1.36 38.06
31 Acenaphthylene 0.14 0.95 0.13 18.01
32 1-Nonadecene 0.90 0.86 0.77 30.92
Alcohols 33 1-Hexanol, 2-ethyl- 6.30 0.74 4.65 10.38
34 7-Octen-2-ol, 2,6-dimethyl- 1.63 0.77 1.26 11.29
35 1,6-Octadien-3-ol, 3,7-dimethyl-
1.07 0.76 0.81 11.86
36 Phenylethyl alcohol 1.98 0.79 1.56 12.21
37 Isoborneol 1.37 0.78 1.07 13.19
38 Cyclohexanol, 5-methyl-2-(1-methylethyl)-,
(1alpha,2beta,5alpha)-(+/−)-
7.45 0.76 5.66 13.32
39 3-Cyclohexene-1-methanol, .alpha.,.alpha.4-trimethyl- . .α.
9.67 0.77 7.49 13.66
40 6-Octen-1-ol, 3,7-dimethyl-, (R)-
1.16 0.74 0.86 14.37

59
41 5-Cholestene-3-ol, 24-methyl- 6.46 0.84 5.43 37.50
42 Farnesol isomer a 1.11 0.81 0.90 33.75
43 Beta-sitosterol 11.01 0.78 8.58 38.40
44 Benzyl alcohol 0.92 0.68 0.63 10.60
45 Cholestanol 35.37 0.82 29.08 36.22
46 Cholesterol 59.32 0.84 49.79 35.56
Organic acids
47 Hexanoic acid, 2-methyl- 7.90 0.65 5.10 10.94
48 Hexanoic acid, 2-ethyl- 1.42 0.67 0.94 12.44
49 6-Octadecenoic acid, (Z)- 40.59 0.77 31.09 27.26
50 Octadec-9-enoic acid 3.02 0.77 2.31 27.31
51 Octadecanoic acid 45.26 0.76 34.43 27.54
52 Heptadecanoic acid 2.05 0.76 1.55 26.34
53 n-Hexadecanoic acid 103.27 0.75 77.45 25.27
54 Dodecanoic acid 7.32 0.72 5.27 19.89
55 Oleic acid 1.00 0.77 0.77 33.46
56 Benzenepropanoic acid 0.61 0.72 0.44 16.41
57 Tetradecanoic acid 11.45 0.74 8.44 22.64
Ketone 58 Cyclohexanone 0.92 0.73 0.68 7.07
59 Bicyclo[2.2.1]heptan-2-one, 1,7,7-trimethyl-, (1R)-
2.21 0.79 1.75 12.75
60 9,10-Anthracenedione 5.06 0.65 3.30 25.42
61 Androstan-17-one, 3-hydroxy-, (3.alpha.,5.beta.)-
1.05 0.79 0.83 31.18
62 Cholest-4-en-3-one 1.18 0.84 0.99 37.72
Phenolic 63 Phenol 8.43 0.77 6.46 9.45
64 Chloroxylenol 8.93 0.61 5.48 17.16
65 4-Methylphenol 1.44 0.78 1.12 11.52
66 4-Chloro-3-methyl phenol 0.14 0.58 0.08 15.57
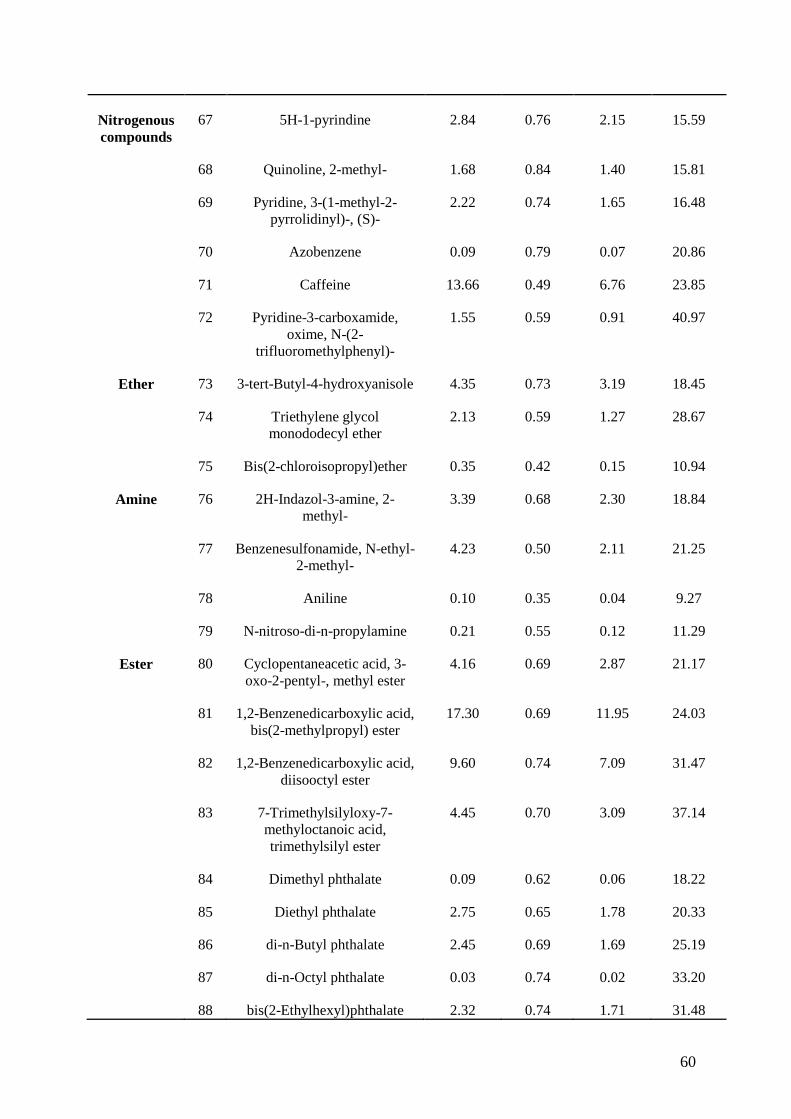
60
Nitrogenous compounds
67 5H-1-pyrindine 2.84 0.76 2.15 15.59
68 Quinoline, 2-methyl- 1.68 0.84 1.40 15.81
69 Pyridine, 3-(1-methyl-2-pyrrolidinyl)-, (S)-
2.22 0.74 1.65 16.48
70 Azobenzene 0.09 0.79 0.07 20.86
71 Caffeine 13.66 0.49 6.76 23.85
72 Pyridine-3-carboxamide, oxime, N-(2-
trifluoromethylphenyl)-
1.55 0.59 0.91 40.97
Ether 73 3-tert-Butyl-4-hydroxyanisole 4.35 0.73 3.19 18.45
74 Triethylene glycol monododecyl ether
2.13 0.59 1.27 28.67
75 Bis(2-chloroisopropyl)ether 0.35 0.42 0.15 10.94
Amine 76 2H-Indazol-3-amine, 2-methyl-
3.39 0.68 2.30 18.84
77 Benzenesulfonamide, N-ethyl-2-methyl-
4.23 0.50 2.11 21.25
78 Aniline 0.10 0.35 0.04 9.27
79 N-nitroso-di-n-propylamine 0.21 0.55 0.12 11.29
Ester 80 Cyclopentaneacetic acid, 3-oxo-2-pentyl-, methyl ester
4.16 0.69 2.87 21.17
81 1,2-Benzenedicarboxylic acid, bis(2-methylpropyl) ester
17.30 0.69 11.95 24.03
82 1,2-Benzenedicarboxylic acid, diisooctyl ester
9.60 0.74 7.09 31.47
83 7-Trimethylsilyloxy-7-methyloctanoic acid, trimethylsilyl ester
4.45 0.70 3.09 37.14
84 Dimethyl phthalate 0.09 0.62 0.06 18.22
85 Diethyl phthalate 2.75 0.65 1.78 20.33
86 di-n-Butyl phthalate 2.45 0.69 1.69 25.19
87 di-n-Octyl phthalate 0.03 0.74 0.02 33.20
88 bis(2-Ethylhexyl)phthalate 2.32 0.74 1.71 31.48

61
Others 89 Kitazin P 1.16 0.54 0.63 23.74
90 Cyclic octa atomic sulfur 4.61 0.27 1.23
3.6.3. Flux balance approach (FBA) for modeling wastewater treatment plant
Flux balance analysis is one of the widely accepted methods of modeling metabolism and is a popular
approach to model biological systems such as activated sludge systems. This analysis can be done by
quantifying the rate of reactions within the network formed by the chemical compounds and the sequence
chemical reaction within the microbial metabolism (Perez-Garcia et al., 2014). It uses linear programming
to predict fluxes thus providing knowledge on reaction stoichiometry, the composition of biomass and
constraints i.e., limit on the uptake or excretion rate of nutrients and by-products respectively.
Flux balance provides detailed information about all the enzymes involved in a metabolic process
(Kauffman et al., 2003) and can also be used for rational design of strain, prediction of theoretical yields
and identification of bottlenecks or in understanding the metabolism for optimisation of processes (Boyle
& Morgan, 2009). Moreover, flux balance analysis is used to describe the potential behavior of an organism
under specific environmental conditions (Kauffman et al., 2003).
In previous years’ flux balance analysis was successfully applied to model photosynthetic metabolism of
Cyanobacteria Synechocystis sp and to model metabolic network of other cyanobacteria such as
Arthrospira platensis (Boyle & Morgan, 2009; Wiechert, 2001). FBA is often used by metabolic engineers
to quantitatively simulate microbial metabolism (Kauffman et al., 2003).
This modeling approach is a constraint-based model whereby the metabolic fluxes (reactions) are balanced
around each node (metabolite) and it relies on the use of linear programming to predict, for example, the
maximisation yield for biomass (Ramkrishna & Song, 2012). This modeling approach assumes that the
metabolic networks will reach a steady-state and not be constrained by the stoichiometry. Generally, the
mass balance is described by linear equations (Mahadevan et al., 2002)-see Eq 5.
𝐴𝐴 ∗ 𝑣𝑣 = 0 (5)
Where A is m X n stoichiometric matrix of the reactions, n is the number fluxes and m is the number of
metabolites. If a metabolic network consists of (m) metabolites and (n) fluxes, then the mass conservation
equation for each metabolite can be (Eq 6):
𝑑𝑑𝐸𝐸𝑑𝑑𝑑𝑑
= 𝐴𝐴𝑣𝑣𝐴𝐴, 𝑑𝑑𝑑𝑑𝑑𝑑𝑑𝑑
= 𝜇𝜇𝐴𝐴, 𝜇𝜇 = ∑𝑁𝑁𝑖𝑖𝑣𝑣𝑖𝑖 (6)
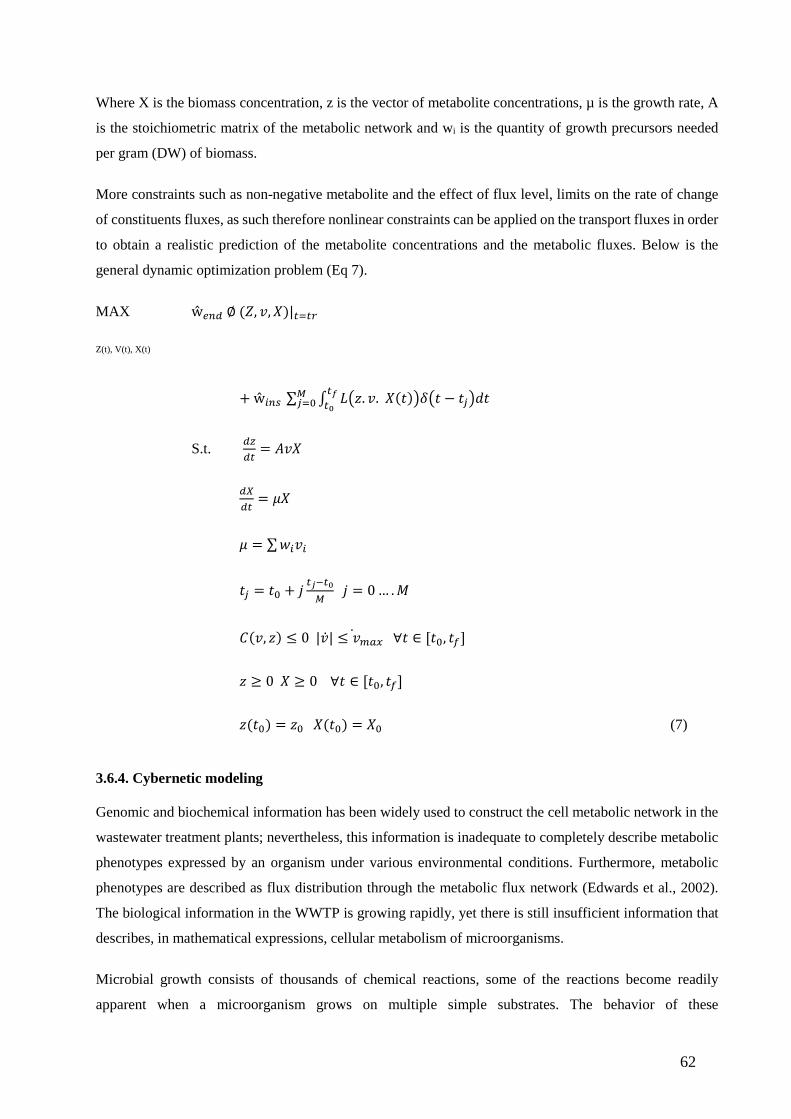
62
Where X is the biomass concentration, z is the vector of metabolite concentrations, µ is the growth rate, A
is the stoichiometric matrix of the metabolic network and wi is the quantity of growth precursors needed
per gram (DW) of biomass.
More constraints such as non-negative metabolite and the effect of flux level, limits on the rate of change
of constituents fluxes, as such therefore nonlinear constraints can be applied on the transport fluxes in order
to obtain a realistic prediction of the metabolite concentrations and the metabolic fluxes. Below is the
general dynamic optimization problem (Eq 7).
MAX ŵ𝑒𝑒𝐸𝐸𝑑𝑑 ∅ (𝑍𝑍, 𝑣𝑣,𝐴𝐴)|𝑑𝑑=𝑑𝑑𝑡𝑡
Z(t), V(t), X(t)
+ ŵ𝑖𝑖𝐸𝐸𝑠𝑠 ∑ ∫ 𝐿𝐿�𝑧𝑧. 𝑣𝑣. 𝐴𝐴(𝐵𝐵)�𝛿𝛿�𝐵𝐵 − 𝐵𝐵𝑗𝑗�𝑑𝑑𝐵𝐵𝑑𝑑𝑓𝑓𝑑𝑑0
𝑀𝑀𝑗𝑗=0
S.t. 𝑑𝑑𝐸𝐸𝑑𝑑𝑑𝑑
= 𝐴𝐴𝑣𝑣𝐴𝐴
𝑑𝑑𝑑𝑑𝑑𝑑𝑑𝑑
= 𝜇𝜇𝐴𝐴
𝜇𝜇 = ∑𝑁𝑁𝑖𝑖𝑣𝑣𝑖𝑖
𝐵𝐵𝑗𝑗 = 𝐵𝐵0 + 𝑗𝑗 𝑑𝑑𝑗𝑗−𝑑𝑑0𝑀𝑀
𝑗𝑗 = 0 … .𝑀𝑀
𝐻𝐻(𝑣𝑣, 𝑧𝑧) ≤ 0 |�̇�𝑣| ≤ 𝑣𝑣𝑚𝑚𝑚𝑚𝑚𝑚̇ ∀𝐵𝐵 ∈ [𝐵𝐵0, 𝐵𝐵𝑓𝑓]
𝑧𝑧 ≥ 0 𝐴𝐴 ≥ 0 ∀𝐵𝐵 ∈ [𝐵𝐵0, 𝐵𝐵𝑓𝑓]
𝑧𝑧(𝐵𝐵0) = 𝑧𝑧0 𝐴𝐴(𝐵𝐵0) = 𝐴𝐴0 (7)
3.6.4. Cybernetic modeling
Genomic and biochemical information has been widely used to construct the cell metabolic network in the
wastewater treatment plants; nevertheless, this information is inadequate to completely describe metabolic
phenotypes expressed by an organism under various environmental conditions. Furthermore, metabolic
phenotypes are described as flux distribution through the metabolic flux network (Edwards et al., 2002).
The biological information in the WWTP is growing rapidly, yet there is still insufficient information that
describes, in mathematical expressions, cellular metabolism of microorganisms.
Microbial growth consists of thousands of chemical reactions, some of the reactions become readily
apparent when a microorganism grows on multiple simple substrates. The behavior of these

63
microorganisms in multiple substrates condition varies as some microbes may exhibit simultaneous
utilization of substrate while others may use substrates sequentially for the benefit a whole process. It is
critical to understand the internal regulatory processes responsible for these varied behavior patterns of
microorganisms under certain conditions (Kompala et al., 1984).
In order to understand this phenomenon, cybernetic models have been employed to model microbial growth
on multiple substrates. This model was first reported by (Ramkrishna et al., 1982). Cybernetic modeling
considers the primary goal of microorganisms to maximise the growth rate (Patnaik, 2000). Additionally,
it assumes that when microorganisms are subjected to limited resources for enzyme induction, they will
allocate the limited resources for the induction of key enzymes (Mandli et al., 2015).
These modeling approaches can be used to model microbial and diauxic growth which is an important
process in the wastewater treatment plant. Metabolism can be manipulated by controlling the synthesis of
enzymes that are responsible for the reactions within the metabolic network, even when the reactions are
performed under limited resource conditions. There are two vectors which are referred to as cybernetic
variables. U and V, where u is a fractional allocation of resources required for enzyme synthesis, so that
∑ 𝑢𝑢𝑖𝑖 = 1𝐸𝐸𝑖𝑖𝑖𝑖−1 and v represents the activity of different enzymes. Hence, we must have 0 ≤ 𝑢𝑢𝑖𝑖, 𝑣𝑣𝑖𝑖 ≤ 1, 𝐵𝐵 =
1,2 u which is required to balance the reaction. For example, if the maximum synthesis rate 𝑟𝑟𝐸𝐸 for enzyme
𝐸𝐸𝑖𝑖 is regulated then 𝑢𝑢𝑖𝑖𝑟𝑟𝐸𝐸𝑖𝑖. 𝑣𝑣𝑖𝑖 are needed for estimated regulated reaction rates; therefore, if 𝑟𝑟𝑖𝑖 is the rate of
𝐵𝐵th reaction when enzyme 𝐸𝐸𝑖𝑖 is fully active, the regulated 𝐵𝐵th reaction can be represented as 𝑣𝑣𝑡𝑡𝑟𝑟𝑖𝑖. The
reaction rates are determined by specifications 𝛹𝛹,𝑢𝑢, 𝑣𝑣 . Therefore, the system dynamics can be described
as in Eq 8:
𝑑𝑑𝑑𝑑𝑑𝑑𝑑𝑑
= 𝑓𝑓(𝛹𝛹,𝑢𝑢, 𝑣𝑣) (8)
It is known that the ultimate goal of an organism is to maximise or minimise its functions that are required
for microbial survival over any time interval (𝐵𝐵, 𝐵𝐵 + 𝜏𝜏) which can be described in terms of the state vector
𝛹𝛹. This function can be denoted as ∆𝐽𝐽 = 𝐽𝐽(𝐵𝐵 + 𝜏𝜏) − 𝐽𝐽(𝐵𝐵), thus the goal of the organism can be described as
in Eq 9:
MAX ∆𝐽𝐽
Z(t), V(t), X(t) (9)
such that:
∑ 𝑢𝑢𝑖𝑖 = 1𝐸𝐸𝑖𝑖𝑖𝑖−1 0 ≤ 𝑢𝑢𝑖𝑖, 𝑣𝑣𝑖𝑖 ≤ 1 (10)
64
𝜇𝜇𝑖𝑖 and 𝑣𝑣𝑖𝑖 are the variables of interest in cybernetic models and they are at time 𝐵𝐵; however, the planning
horizon is at (𝐵𝐵, 𝐵𝐵 + 𝜏𝜏). When Equation 3 has been solved then 𝜇𝜇𝑖𝑖 and 𝑣𝑣𝑖𝑖 can be defined making Equation
6 a fully descriptive model.
3.7. Conclusions
TN removal is an important process in wastewater treatment as it takes advantage of microbial metabolic
pathways for efficient removal of TN to acceptable levels. Considering the significance of the microbial
population in TN removal, it is important to put a special emphasis on BNR operation and its control in
order to promote the smooth operation of this process. Models have been successfully applied in
mathematical expression of TN removal processes; however, these models do not consider the metabolic
involvement of processes such as SNaD, which makes it complex, during the manipulation of certain
pathways responsible. The current review, therefore emphasises the importance of network modeling.
65
CHAPTER 4
MATERIALS AND METHODS
66
CHAPTER 4:
MATERIALS AND METHODS 4.1. General background
The experiments for this study were separated into 3 phases in order to achieve the aims and the objectives
as listed in Chapter 1, section 1.5.
4.1. PHASE 1: Thermodynamic evaluation of SNaD under cyanide-laden conditions
This Phase aims to Assess the feasibility of nitrification and aerobic denitrification under high CN-
conditions through thermodynamics modeling.
4.1.1. Isolation and Inoculum Development
The consortia were isolated from CN- containing waste at the Bioresource Engineering research group
(BioERG), Cape Peninsula University of Technology (CPUT) and it was sequenced at Inqaba Biotech SA
for identification. They were cultured into a complex media at sterile conditions for 5 days; thereafter, it
was transferred into 100 ml of basal media containing: 7.9 g Na2HPO4, 1.5 g KH2PO4, 0.5 g MgSO4.7H2O
and 1 mL trace elemental solution. The trace elemental solution was composed of: 1.1 g
(NH4)6Mo7O2.4H2O, 50 g EDTA, 2.2 g ZnSO4.7H2O, 5.5 g CaCl2, 5.0 g FeSO4.7H2O, 5.06 g MnCl2.4H2O,
1.61 g CoCl2.6H2O, 1.57 g CuSO4.5H2O (per liter). The consortia were incubated at 36.5oC for 48 h and
was used as an inoculum for the reactor experiment.
4.1.2. Reactor Experimental Runs
The basal media as indicated in section 4.1.1 was used for the reactor experiment. 1 L reactor was used for
this experiment. It was inoculated with 10% of the 48 h culture and the microorganisms were grown for 5
days, the contaminants were added on day 6. The pH and temperature were maintained at 6.5 and 36.5°C
throughout the experiment respectively. A concentration, i.e. 285 and 37.55 mg/L of NH4-N and CN- were
then added to the reactors, respectively. After the addition of the toxicant, the reactors were tightly closed
and covered with foil to avoid ammonium stripping and volatilization of CN-. Samples were collected every
24 h to analyze residual CN-, NH4-N, NO2-N, and NO3-N using test kits obtained from Merck SA and
Merck ANOVA Spectroquant. All the analysis was performed in duplicates. The bases of the cyanide test
kit are based on the reaction of cyanide with Chloramines-T and pyridine-barbituric acid (Lambert et al.,
1975). The ammonium test kit function based on the reaction of Berthelot reagent, ammonium, chlorine
and phenolic compounds, to form indophenol dyes (Patton and Crouch, 1977). The nitrate test kit uses
concentrated sulphuric acid in the presence of a benzoic acid derivative to produce a calorimetrically

67
quantifiable by-product, while the nitrite test kit is based on the reaction of nitrite ions with sulfanilic acid
to form diazonium salt (Rider & Mellon, 1946). The microbial growth rate in the cultures was determined
using a UV-VIS spectrophotometer at 660 nm.
4.1.3. Bioenergetic/Thermodynamic Models
The free energy (∆G) equation for nitrification can be expressed as:
𝐻𝐻𝐻𝐻4 − 𝐻𝐻 + 1.052 ⟶ 𝐻𝐻𝑂𝑂2− + 𝐻𝐻+∆𝐺𝐺 = 65 + 𝑅𝑅𝑅𝑅𝑐𝑐𝐸𝐸 �[𝑁𝑁𝑁𝑁2−](10−𝑝𝑝𝑝𝑝)2
[𝑁𝑁𝑁𝑁4−𝑁𝑁][𝑁𝑁2]1.5� (11)
𝐻𝐻𝑂𝑂2− + 0.52 ⟶𝐻𝐻𝑂𝑂3− ∆𝐺𝐺 = 18.5 + 𝑅𝑅𝑅𝑅 𝑐𝑐𝐸𝐸 � [𝑁𝑁𝑁𝑁2−𝑁𝑁][𝑁𝑁𝑁𝑁2−𝑁𝑁][𝑁𝑁2]0.5� (12)
Where ∆G is a free energy change in Kcal/mol, NH4-N is the molar concentration of ammonium ions, NO2-
N is the molar concentration of NO2-N and O2 is a molar concentration of oxygen gas, R is the universal
gas constant and T is temperature. However, when the experiment is operated at steady-state with constant
Temperature, pH and abundance of O2 Eq. (11) and (12) becomes:
∆𝐺𝐺 = 65 + 𝑅𝑅𝑅𝑅𝑐𝑐𝐸𝐸 �[𝑁𝑁𝑁𝑁2−𝑁𝑁][𝑁𝑁𝑁𝑁4−𝑁𝑁]
� (13)
∆𝐺𝐺 = 18.5 + 𝑅𝑅𝑅𝑅𝑐𝑐𝐸𝐸 �[𝑁𝑁𝑁𝑁3−𝑁𝑁][𝑁𝑁𝑁𝑁2−𝑁𝑁]
� (14)
The model used to estimate the rates with respect to their corresponding Free energies is as explained by
Mirbagheri et al. (2010). The model assumes that when nitrifying bacteria remain constant then the rate of
microbial growth could be described as a function of ∆G, therefore:
µ = 𝐹𝐹∆𝐺𝐺 (15)
Where µ is a growth rate, F is a linear function. However µ = (1/X)(dx/dt) and Y= dx/dt, ds/dt the equation
can be rearranged as follow:
𝑑𝑑𝑠𝑠𝑑𝑑𝑑𝑑
= 𝑑𝑑𝑌𝑌𝐹𝐹∆𝐺𝐺 (16)
Where X is biomass concentration and Y is biomass yield. At steady-state and when the bacterial yield is
constant the equation can be rearranged as:
𝑑𝑑𝑠𝑠𝑑𝑑𝑑𝑑
= 𝐹𝐹∆𝐺𝐺 (17)
68
The value of ∆G was determined as using with equations 13 and 14, thereafter, Eq. 17 was for linear
regression using polymath 10.0.
4.2. PHASE 2: Assessing the predictive capability of existing models
The aim of this phase was to compare the predictive capability of existing mathematical models towards
simultaneous nitrification and aerobic denitrification under high CN- conditions.
4.2.1. Isolation and identification of the bacterial isolate of interest
The isolate used in this study was isolated from CN- containing waste at the Bioresource Engineering
Research Group (BioERG) laboratory, Cape Peninsula University of Technology, Cape Town, South
Africa. This organism was sub-cultured to obtain pure colonies and subjected to toxicant (CN-) resistance
testing to determine the highest CN- concentration it can withstand subsequent to gram staining. The
genomic DNA was extracted from the pure cultures using the Quick-DNA™, Fungal/Bacterial Miniprep
kit, to target the 16S rRNA gene (Zymo Research, Irvine, CA, Catalogue No. D6005). This region was
amplified using the OneTaq® Quick-Load® 2X Master Mix (Zymo Research, Irvine, CA, Catalogue No.
M0486) and the primers which were used were the 16S-27F and 16S-1492R with sequence (5’ to 3’)
AGAGTTTGATCMTGGCTCAG, and CGGTTACCTTGTTACGACTT, respectively.
The PCR products were run on an agarose gel and the gel fragments were extracted using the Zymoclean™
Gel DNA Recovery Kit (Zymo Research, Irvine, CA, Catalogue No. D4001). The extracted fragments were
sequenced in the forward and reverse direction using the Nimagen BrilliantDye™ Terminator Cycle
Sequencing kit v3.1 and further purified using the Zymo Research, ZR-96 DNA Sequencing Clean-up kit™.
The purified fragments were analyzed using the ABI 3500XLGenetic Analyzer (Applied Biosystems,
ThermoFisher Scientific, Massachusetts, USA). CLC Bio Main Workbench v7.6 was used to analyze the
files generated by the ABI 3500XL Genetic Analyzer and results were obtained through a BLAST search
(NCBI).
4.2.2 Batch culture experiments
A basal medium similar to the one used in 4.1.1 was used for SNaD and CN- degradation studies.
Erlenmeyer flasks (250mL) were used with a working volume of 100 mL of basal media. The media was
inoculated with a loop full of an overnight agar grown bacterial culture. The inoculated media was initially
grown for 72 h without NH4-N and CN-, thereafter; 20 mgNH4-N /L and 20 mg CN-/L were added to the
inoculated basal medium whereby samples were collected on a 24 h interval for 168 h to analyze CN-, NH4-
N, NO2-N, NO3-N and microbial growth at OD660 nm. The biomass concentration at OD660 nm was
calculated by Eq. 18 (from calibrated values in triplicate).

69
OD660 = 0.0089 (CFU) - 0.3097 (18)
4.2.3. Enzyme extraction
To analyze the activities of the enzymes, i.e. AMO, NaR and NiR, cold acetone was added to the collected
samples, forming a pellet that was separated from the supernatant by centrifuging each sample at 5000 g
for 15 min. The pellet was lysed using a sonicator and the supernatant was collected by centrifugation at
16000 rpm for 5 min. Thereafter, the precipitate was washed three times and resuspended in phosphate (360
mg/L) buffer solution (pH 7.4). NH4-N and CN- solutions were prepared and the enzyme extracts were
added into the NH4-N and CN- solutions, while the changes in CN- (09701), NH4-N (00683), NO2-N
(110057) and NO3-N (14773) were monitored and analyzed using the Merck test kits (Merck & Co., New
Jersey, USA).
The activity of the NH4-N oxidizing enzyme was monitored by measuring the changes in NH4-N after the
addition of the enzyme extracts into the NH4-N solution. The formation of NO3-N from NO2-N and the
disappearance of NO3-N were also monitored in order to determine the activity of both NO3-N and NO2-N
oxidizing enzymes, i.e. NaR and NiR. The CN- degrading enzymes were monitored with the changes in the
concentration of CN-.
4.2.4. Analytical procedure(s)
All the test kits used for the analyses of the samples in this study were obtained from Merck SA a subsidiary
of Merck & Co., New Jersey, USA. Furthermore, the Merck Spectroquant Nova 60 instrument was used to
quantify the residual CN-, NH4-N, NO2-N, and NO3- concentrations. The tests were conducted as per the
manufacturer’s instructions.
4.2.5. Kinetics model developed
During CN- biodegradation, microorganisms convert CN- to NH4-N which was then used as a nitrogenous
source. Mekuto et al. (2015) reported the ability of cyanide degrading bacteria to degrade CN- and
subsequently utilize NH4-N, with a further indication that some microorganisms are able to use NH4-N and
CN- as nitrogenous sources simultaneously. It has been shown by Mpongwana et al. (2016) that when a
cyanide degrading microorganism is used for nitrification and denitrification under cyanide conditions, the
microorganism undergoes, multiple growth phases, i.e. mostly diauxic growth; hence, growth models that
describe diauxic growth must be considered when evaluating growth kinetic parameters of such
microorganisms when removing TN. The multiphase growth rate was first described by Monod. (1942) as
a sequential utilization of substrates accompanied by distinct exponential growth phases during a period in
which the individual substrates were utilized.

70
In this study, Monod’s and other models were also used to describe simultaneous CN- degradation, and
SNaD, with all the experiments being carried out in a closed system (1L batch culture). The rate of toxicant
pollutant degradation can be described as in Eq. 19.
−dCadt
= 𝑟𝑟𝑚𝑚 = 𝐾𝐾𝑖𝑖𝐻𝐻𝑚𝑚𝐸𝐸 (19)
Where ra is the rate of pollutant degradation, Ki is the saturation constant, Ca is the concentration of the
pollutant, -dCa/dt is the disappearance rate of the pollutant, and n is the model fitting constant.
When TN is the sole nitrogenous source, the system is considered to be a non-inhibited system. As such,
Monod's’ proposed kinetic model (Eq. 20) for non-inhibited systems, is deemed suitable to model such
systems.
−𝑑𝑑𝐶𝐶𝑎𝑎𝑑𝑑𝑑𝑑
= 𝑉𝑉𝑚𝑚∗𝐶𝐶𝑎𝑎𝐾𝐾𝑖𝑖+𝐶𝐶𝑎𝑎
(20)
Where Vm, is the maximum specific degradation rate of the pollutant.
Haldane (Annuar et al., 2008) also represented pollutant degradation kinetics using a model as shown in
Eq. 21.
−𝑑𝑑𝐶𝐶𝑎𝑎𝑑𝑑𝑑𝑑
= 𝑉𝑉𝑚𝑚C𝑎𝑎
𝐶𝐶𝑎𝑎+ 𝐶𝐶𝑎𝑎2
𝐾𝐾𝑖𝑖
(21)
Due to the possibility of inhibition of SNaD by CN-, a model (Andrew’s model) representing the kinetics
of a primary pollutants’ degradation in which a secondary inhibitory pollutant is present, was deemed
necessary to use, as presented in Eq. 22 (Annuar et al., 2008).
𝑑𝑑𝐶𝐶𝑎𝑎𝑑𝑑𝑑𝑑
= −𝑉𝑉𝑚𝑚 �1− �𝐾𝐾𝑖𝑖𝐶𝐶𝑎𝑎�� �1 + �𝐶𝐶𝑎𝑎
𝐾𝐾𝑠𝑠�� (22)
Where Ks is a secondary pollutants’ inhibition constant.
4.2.6. Regression of experimental data and estimation of model kinetic parameters
Mathematical models describing CN- and NH4-N accumulation and degradation were fitted to the
experimental data generated. Additionally, the models describing NH4-N degradation with pollutant
inhibition were also fitted into NH4-N accumulation and accumulation experimental data. A nonlinear
regression function on Polymath 6.0 software was used for simulations, thus the generation of simulation
data (using estimated kinetic parameters) that was compared to experimental data.

71
4.2.7. Data handling and kinetic parameters
The data were computed and analyzed using Microsoft Excel v2016. The mean was determined using Eq.
23; Moreover, Polymath 6.0 was used to estimate kinetic parameters in Eq. (s) 19, 21 and 22. The data
obtained from polymath was plotted using Microsoft Excel v2016.
𝑀𝑀𝑒𝑒𝐵𝐵𝐸𝐸 = ∑𝑑𝑑𝐸𝐸
(23)
Where ∑𝐴𝐴 is the sum of the data points, while n is the number of experimental experiments conducted.
4.3. PHASE 3: Optimisation and evaluation of predictive ability of RSM and Cybernetic models
The aim of this phase was to optimise SNaD and cyanide degradation, subsequent to evaluation of
predictive ability of RSM versus the cybernetic model for SNaD and CN- degradation.
4.4. Microbial isolation and identification
The bacteria used for this study was isolated from CN- containing waste at the Bioresource Engineering
Research Group (BioERG) facility at the Cape Peninsula University of Technology (CPUT), South Africa.
Isolates were cultured on nutrient agar to obtain pure colonies. Thereafter, they were grown on nutrient agar
(NA) containing different concentrations of CN- 10 to 300 mg/L of CN- to determine the highest
concentration of CN- that they can withstand, subsequent to gram staining. The cyanide tolerant bacteria’s
16S RNA was sequenced and identified the bacteria as Acinetobacter courvalinii, accession number
AB602910.1 or NR_148843.1 (Stephen et al., 1997).
4.5. Response surface methodology 4.5.1. Central composite design experiments
The central composite design was used for the optimization of SNaD under CN- conditions. This was done
by determining the independents variables, i.e. temperature and pH, optima which have been reported to
affect SNaD (Mekuto et al., 2015). In this study, a 13-run experimental plan which included the variation
in independent variables (temperature and pH) was generated using central composite design (CCD) (see
Table 4.1).
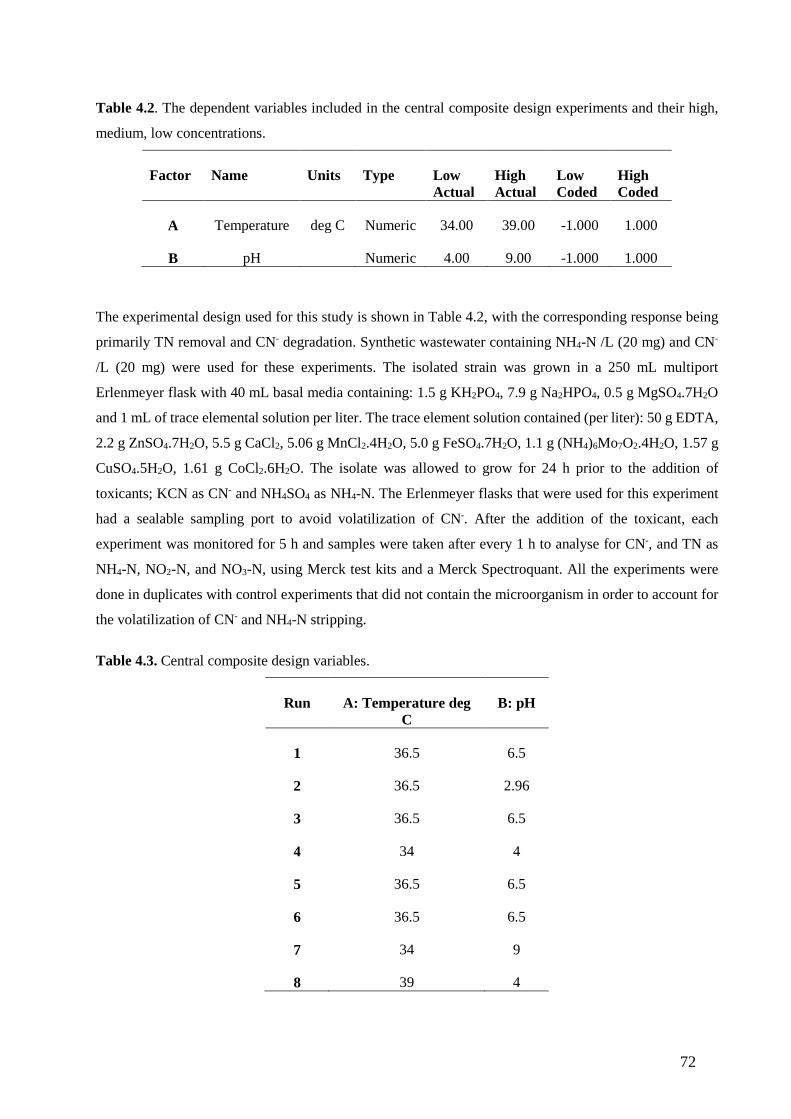
72
Table 4.2. The dependent variables included in the central composite design experiments and their high,
medium, low concentrations.
Factor Name Units Type Low Actual
High Actual
Low Coded
High Coded
A Temperature deg C Numeric 34.00 39.00 -1.000 1.000
B pH Numeric 4.00 9.00 -1.000 1.000
The experimental design used for this study is shown in Table 4.2, with the corresponding response being
primarily TN removal and CN- degradation. Synthetic wastewater containing NH4-N /L (20 mg) and CN-
/L (20 mg) were used for these experiments. The isolated strain was grown in a 250 mL multiport
Erlenmeyer flask with 40 mL basal media containing: 1.5 g KH2PO4, 7.9 g Na2HPO4, 0.5 g MgSO4.7H2O
and 1 mL of trace elemental solution per liter. The trace element solution contained (per liter): 50 g EDTA,
2.2 g ZnSO4.7H2O, 5.5 g CaCl2, 5.06 g MnCl2.4H2O, 5.0 g FeSO4.7H2O, 1.1 g (NH4)6Mo7O2.4H2O, 1.57 g
CuSO4.5H2O, 1.61 g CoCl2.6H2O. The isolate was allowed to grow for 24 h prior to the addition of
toxicants; KCN as CN- and NH4SO4 as NH4-N. The Erlenmeyer flasks that were used for this experiment
had a sealable sampling port to avoid volatilization of CN-. After the addition of the toxicant, each
experiment was monitored for 5 h and samples were taken after every 1 h to analyse for CN-, and TN as
NH4-N, NO2-N, and NO3-N, using Merck test kits and a Merck Spectroquant. All the experiments were
done in duplicates with control experiments that did not contain the microorganism in order to account for
the volatilization of CN- and NH4-N stripping.
Table 4.3. Central composite design variables.
Run A: Temperature deg C
B: pH
1 36.5 6.5
2 36.5 2.96
3 36.5 6.5
4 34 4
5 36.5 6.5
6 36.5 6.5
7 34 9
8 39 4
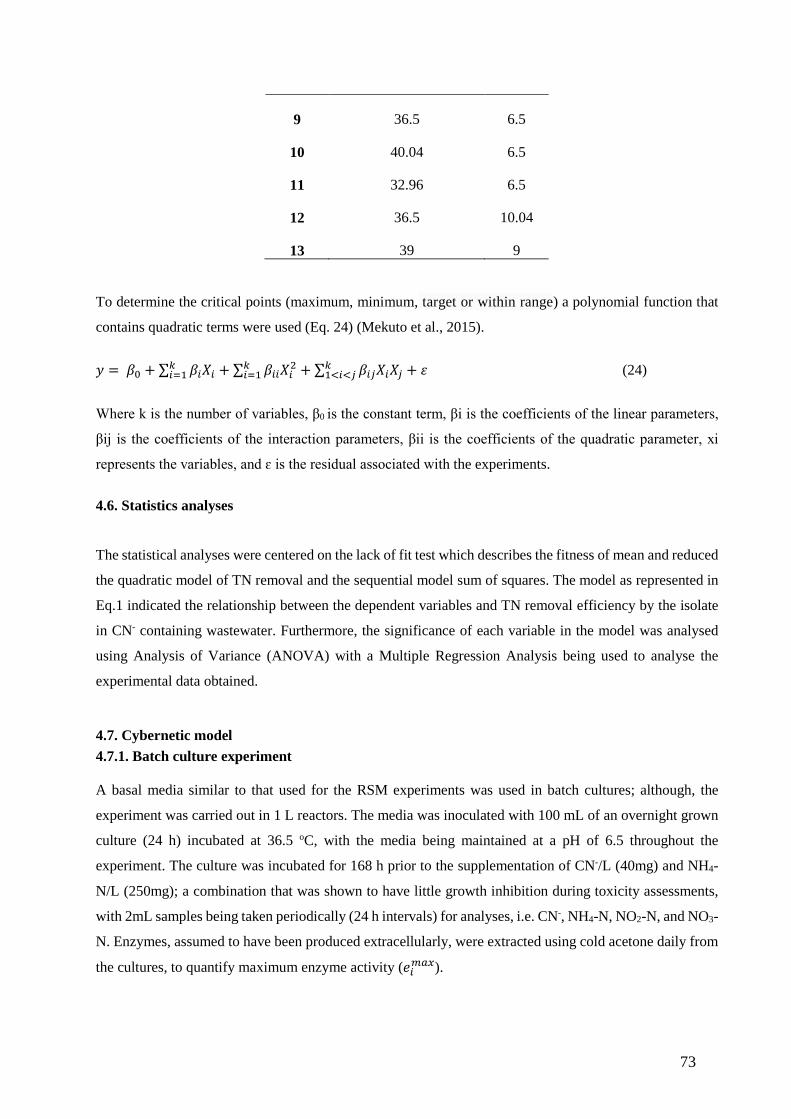
73
9 36.5 6.5
10 40.04 6.5
11 32.96 6.5
12 36.5 10.04
13 39 9
To determine the critical points (maximum, minimum, target or within range) a polynomial function that
contains quadratic terms were used (Eq. 24) (Mekuto et al., 2015).
𝐸𝐸 = 𝛽𝛽0 + ∑ 𝛽𝛽𝑖𝑖𝐴𝐴𝑖𝑖𝑘𝑘𝑖𝑖=1 + ∑ 𝛽𝛽𝑖𝑖𝑖𝑖𝐴𝐴𝑖𝑖2𝑘𝑘
𝑖𝑖=1 + ∑ 𝛽𝛽𝑖𝑖𝑗𝑗𝐴𝐴𝑖𝑖𝐴𝐴𝑗𝑗𝑘𝑘1<𝑖𝑖<𝑗𝑗 + 𝜀𝜀 (24)
Where k is the number of variables, β0 is the constant term, βi is the coefficients of the linear parameters,
βij is the coefficients of the interaction parameters, βii is the coefficients of the quadratic parameter, xi
represents the variables, and ɛ is the residual associated with the experiments.
4.6. Statistics analyses
The statistical analyses were centered on the lack of fit test which describes the fitness of mean and reduced
the quadratic model of TN removal and the sequential model sum of squares. The model as represented in
Eq.1 indicated the relationship between the dependent variables and TN removal efficiency by the isolate
in CN- containing wastewater. Furthermore, the significance of each variable in the model was analysed
using Analysis of Variance (ANOVA) with a Multiple Regression Analysis being used to analyse the
experimental data obtained.
4.7. Cybernetic model 4.7.1. Batch culture experiment
A basal media similar to that used for the RSM experiments was used in batch cultures; although, the
experiment was carried out in 1 L reactors. The media was inoculated with 100 mL of an overnight grown
culture (24 h) incubated at 36.5 oC, with the media being maintained at a pH of 6.5 throughout the
experiment. The culture was incubated for 168 h prior to the supplementation of CN-/L (40mg) and NH4-
N/L (250mg); a combination that was shown to have little growth inhibition during toxicity assessments,
with 2mL samples being taken periodically (24 h intervals) for analyses, i.e. CN-, NH4-N, NO2-N, and NO3-
N. Enzymes, assumed to have been produced extracellularly, were extracted using cold acetone daily from
the cultures, to quantify maximum enzyme activity (𝑒𝑒𝑖𝑖𝑚𝑚𝑚𝑚𝑚𝑚).
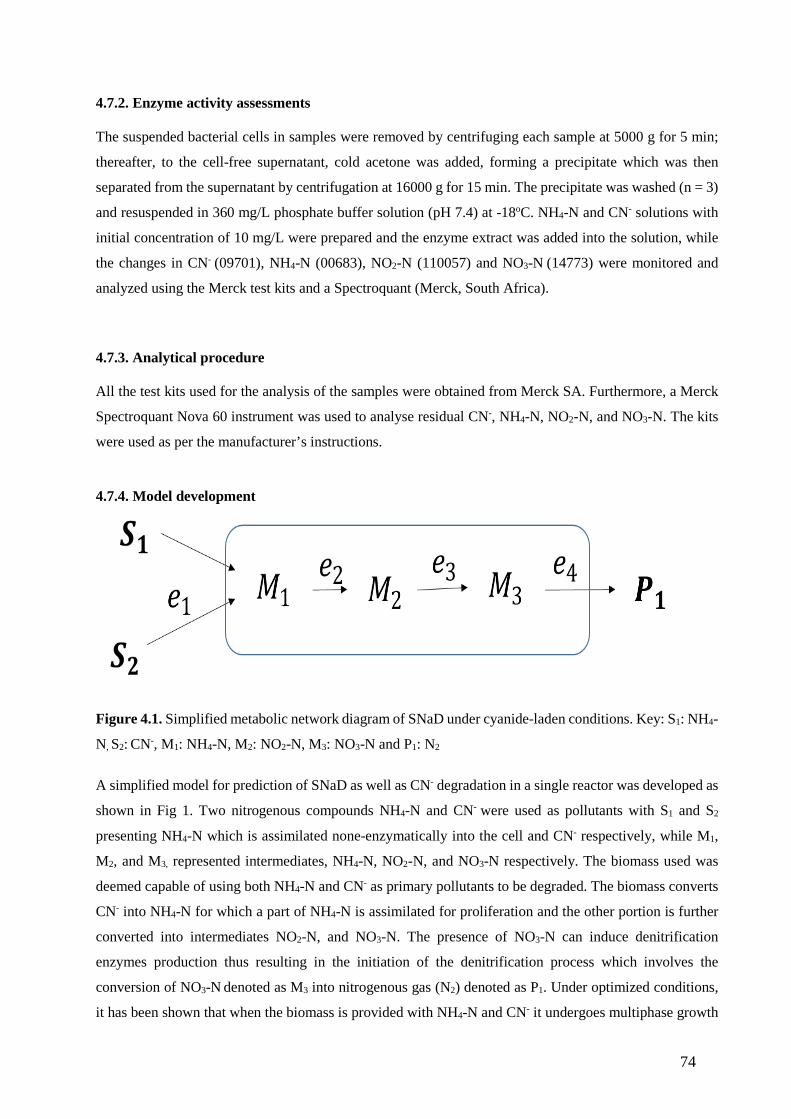
74
4.7.2. Enzyme activity assessments
The suspended bacterial cells in samples were removed by centrifuging each sample at 5000 g for 5 min;
thereafter, to the cell-free supernatant, cold acetone was added, forming a precipitate which was then
separated from the supernatant by centrifugation at 16000 g for 15 min. The precipitate was washed (n = 3)
and resuspended in 360 mg/L phosphate buffer solution (pH 7.4) at -18oC. NH4-N and CN- solutions with
initial concentration of 10 mg/L were prepared and the enzyme extract was added into the solution, while
the changes in CN- (09701), NH4-N (00683), NO2-N (110057) and NO3-N (14773) were monitored and
analyzed using the Merck test kits and a Spectroquant (Merck, South Africa).
4.7.3. Analytical procedure
All the test kits used for the analysis of the samples were obtained from Merck SA. Furthermore, a Merck
Spectroquant Nova 60 instrument was used to analyse residual CN-, NH4-N, NO2-N, and NO3-N. The kits
were used as per the manufacturer’s instructions.
4.7.4. Model development
Figure 4.1. Simplified metabolic network diagram of SNaD under cyanide-laden conditions. Key: S1: NH4-
N, S2: CN-, M1: NH4-N, M2: NO2-N, M3: NO3-N and P1: N2
A simplified model for prediction of SNaD as well as CN- degradation in a single reactor was developed as
shown in Fig 1. Two nitrogenous compounds NH4-N and CN- were used as pollutants with S1 and S2
presenting NH4-N which is assimilated none-enzymatically into the cell and CN- respectively, while M1,
M2, and M3, represented intermediates, NH4-N, NO2-N, and NO3-N respectively. The biomass used was
deemed capable of using both NH4-N and CN- as primary pollutants to be degraded. The biomass converts
CN- into NH4-N for which a part of NH4-N is assimilated for proliferation and the other portion is further
converted into intermediates NO2-N, and NO3-N. The presence of NO3-N can induce denitrification
enzymes production thus resulting in the initiation of the denitrification process which involves the
conversion of NO3-N denoted as M3 into nitrogenous gas (N2) denoted as P1. Under optimized conditions,
it has been shown that when the biomass is provided with NH4-N and CN- it undergoes multiphase growth
75
while simultaneously degrading the pollutants. Therefore, the predictive capability of cybernetic models
was evaluated to estimate the simultaneous degradation of NH4-N and CN- using the cyanide degrading
bacteria Acinetobacter courvalinii. The model was developed based on the metabolic reaction network as
illustrated in Fig 4.1. All these processes are catalysed by specific enzymes, i.e. ammonia monooxygenase
(AMO), nitrate reductase (NaR) and nitrite reductase (NiR). When modeling metabolic networks, two
vectors are considered important for cybernetic variables. These vectors are 𝑢𝑢 and 𝑣𝑣, for which 𝑢𝑢 is a
fractional allocation of resources needed for enzyme synthesis, such that ∑ 𝑢𝑢𝑖𝑖 = 1𝐸𝐸𝑖𝑖𝑖𝑖−1 and with v
representing the activity of the different enzymes. Conditions 0 ≤ 𝑢𝑢𝑖𝑖, 𝑣𝑣𝑖𝑖 ≤ 1, whereby 𝐵𝐵 = 1,2, 3, 4. u is
needed for balancing the reaction. For example, when the maximum synthesis rate 𝑟𝑟𝐸𝐸 for enzyme 𝐸𝐸𝑖𝑖 is
regulated then 𝑢𝑢𝑖𝑖𝑟𝑟𝐸𝐸𝑖𝑖. Moreover, 𝑣𝑣𝑖𝑖 is required to estimate the regulated reaction rates; thus, 𝑟𝑟𝑖𝑖 will be the
rate of the 𝐵𝐵th reaction when enzyme 𝐸𝐸𝑖𝑖 is fully active. The regulated 𝐵𝐵th reaction can also be written as 𝑟𝑟 =
𝑣𝑣𝑡𝑡𝑟𝑟𝑖𝑖.
Monods’ model was used to express the rate of TN removal (𝑟𝑟𝑖𝑖) for pollutant 𝑆𝑆𝑖𝑖 and 𝑆𝑆𝑗𝑗 catalysed by enzyme
𝑒𝑒𝑖𝑖 to form intermediate 𝑀𝑀2 and 𝑀𝑀3 (Eq. 25).
𝑟𝑟𝑖𝑖 = 𝑟𝑟𝑖𝑖𝑚𝑚𝑚𝑚𝑚𝑚𝑠𝑠1
𝑠𝑠1+𝐾𝐾𝑖𝑖� 𝑒𝑒1𝑒𝑒𝑖𝑖𝑚𝑚𝑎𝑎𝑚𝑚� 𝐵𝐵 = 1, 2, 3, 4 (25)
The cell growth rate was model using rate law equation (1st order) indicated in Eq. 26.
𝑑𝑑𝑚𝑚𝑑𝑑𝑑𝑑
= 𝑟𝑟𝑔𝑔𝐴𝐴 (26)
Where 𝑟𝑟𝑖𝑖𝑚𝑚𝑚𝑚𝑚𝑚 is the are maximum pollutant removal rate and 𝐾𝐾𝑖𝑖 is the pollutant saturation constant, 𝐴𝐴 is cell
concentration and 𝑟𝑟𝑔𝑔 is the cell growth rate.
Enzyme synthesis for the two pollutants, 𝑆𝑆1 and 𝑆𝑆2 was assumed to be maximized as the growth rate of
biomass increased such that (Eq. 27);
𝑢𝑢 = 𝑡𝑡𝑖𝑖/𝑀𝑀𝑖𝑖∑ 𝑡𝑡𝑗𝑗2𝑗𝑗=1 /𝑀𝑀𝑖𝑖
𝑣𝑣 = 𝑡𝑡𝑖𝑖/𝑀𝑀𝑖𝑖max (𝑡𝑡𝑖𝑖 / 𝑀𝑀𝑖𝑖)
𝐵𝐵 = 1, 2, 3, 4 (27)
It was hypothesised that NH4-N was broken down into NO2-N via AMO (represented by 𝑒𝑒2) catalysis while
CN- was decomposed by cyanide degrading enzyme(s) represented as 𝑒𝑒1. The intermediate NO2-N was
further broken down into NO3-N facilitated by NiR represented in the diagram as 𝑒𝑒3, with NO3-N being
further decomposed into N2 by NaR represented as 𝑒𝑒4. The model, Eq. 28, would thus represent the rate of
enzyme(s) synthesis responsible for the SNaD under cyanogenic conditions.
𝑑𝑑𝑒𝑒1𝑑𝑑𝑑𝑑
= 𝛼𝛼𝑒𝑒𝑖𝑖 + 𝑟𝑟𝑒𝑒𝑖𝑖𝑢𝑢𝑖𝑖 − (𝐷𝐷𝑔𝑔 + 𝑏𝑏𝑖𝑖)𝑒𝑒𝑖𝑖 (28)

76
Where 𝛼𝛼𝑒𝑒𝑖𝑖 represents an inductive rate, 𝑏𝑏𝑖𝑖 is the activity of the enzyme responsible for decomposition of a
pollutant, 𝑟𝑟𝑒𝑒𝑖𝑖 the decomposition rate of the nitrogenous pollutant, bi is the degradation rate constant of the
enzyme, 𝐷𝐷𝑔𝑔 dilution term due to growth rate. The model parameters were estimated by polymath software
v6.0 using experimental data.
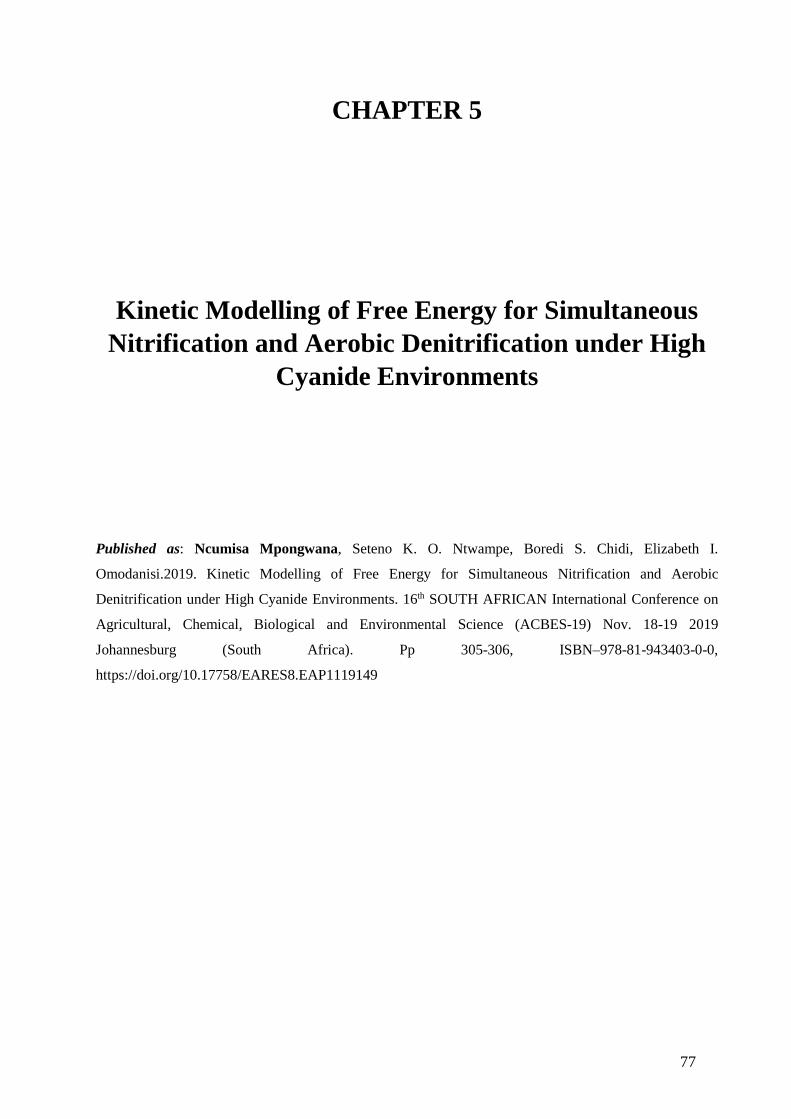
77
CHAPTER 5
Kinetic Modelling of Free Energy for Simultaneous Nitrification and Aerobic Denitrification under High
Cyanide Environments
Published as: Ncumisa Mpongwana, Seteno K. O. Ntwampe, Boredi S. Chidi, Elizabeth I.
Omodanisi.2019. Kinetic Modelling of Free Energy for Simultaneous Nitrification and Aerobic
Denitrification under High Cyanide Environments. 16th SOUTH AFRICAN International Conference on
Agricultural, Chemical, Biological and Environmental Science (ACBES-19) Nov. 18-19 2019
Johannesburg (South Africa). Pp 305-306, ISBN–978-81-943403-0-0,
https://doi.org/10.17758/EARES8.EAP1119149

78
CHAPTER 5:
KINETIC MODELLING OF FREE ENERGY FOR SIMULTANEOUS NITRIFICATION AND
AEROBIC DENITRIFICATION UNDER HIGH CYANIDE ENVIRONMENTS
5.1. Introduction
Cyanide (CN-) is a toxic compound known to inhibit most biological process that is being performed in
wastewater treatment plants (WWTP). Nitrification and denitrification are among the process that are
heavily affected by CN- compounds (Kapoor et al., 2016; Kim et al., 2008). Remedial procedures such as
the use of activated carbon have been recognized to eradicate inhibition effect of toxic compounds on
nitrification and denitrification; however, the use of activated carbon is not feasible in CN- containing
wastewater due to its low absorption capability; furthermore, the use of activated carbon may also result in
additional costs (Kim et al., 2008). Han et al. (2013) proposed that cyanide degrading bacteria must be
employed to eliminate the inhibition effect of CN- toward nitrification and denitrification. Mpongwana et
al. (2016) has proven the feasibility of using cyanide degrading bacteria as a remedial option for inhibition
of nitrification and denitrification by CN-.
However, the application of cyanide degrading microorganisms is not yet established in a large scale
WWTP due to fear of irretrievable process failure, thus more information that will ease the process control
is still required. This study investigates the thermodynamics to understand the simultaneous nitrification
and aerobic denitrification (SNaD) by cyanide degrading consortium in the presence of high CN- conditions.
The Gibbs free energy of nitritation and nitratation were investigated since nitritation is known to be a rate-
limiting step. A linear relationship is known to exist between the rate of biochemical reaction and their
respective free energies (Rottenberg & Gutman, 1977). The Gibbs free energy was selected for this study
since it is known to be a driving force of a reaction. The reaction is judged based on the principles of
whether the reaction is spontaneous (∆G<0), at equilibrium (∆G=0) and impossible if (∆G˃0) (Zhang et
al., 2010).
5.2. Objectives
The objectives of this section was to:
• Isolate and identify a cyanide resistant mix consortia.

79
• Asses the feasibility of using the cyanide resistant mix consortia for SNaD at CN- environments.
• Model Gibbs free energy of SNaD under CN- environments.
5.3. Materials and methods
The mix consortium was isolated at Bioresource Engineering research group (BioERG), Cape Peninsula
University of Technology (CPUT). It was sequenced and identified at Inqaba biotech SA. The mix consortia
were grown in a 250 mL Erlenmeyer flask containing 100 mL of basal media explained in section 4.1.1.
Thereafter it was incubated at 36.5oC for five days, samples were collected every 24 h to analyse NH4-N,
NO2-N, NO3-N, and CN-. (All the experiments were conducted in duplicates).
5.4. Result and Discussion
An experiment was conducted to study the effect of high CN- concentrations on the ability of cyanide
degrading mix consortia to achieve SNaD. The experiment was conducted in a batch reactor. The results
obtained reveal that 37.55 mg/L of CN- did not affect the SNaD. The consortia rapidly degraded CN- from
37.55 to 12 mg/L in the first 48 h of the experiment. This could be a defensive mechanism for the consortia
to detoxify the CN- concentration into less toxic concentrations. The consortia achieved nitrification,
denitrification and cyanide degradation simultaneously.
The degradation efficiency over 288 h was found to be 92.9%, 97.7% with the degradation rate of 0.0234
and 0.139 mg/L/hr for nitrification and CN- degradation respectively. The removal efficiency found in this
study is greater than that of a study conducted by Kapoor et al. (2016). Furthermore, Han et al. (2013) found
similar results when using cyanide degrading bacteria for nitrification subsequent denitrification. However,
the conversion of NH4-N to NO2-N did not make a stoichiometric logic as the concentration of NH4-N used
did not correspond with the NO2-N produced. This phenomenon could be an indication of the residual NO2-
N being used for microbial proliferation or may be caused by high nitrite reductase which rapidly converts
NO2-N into NO3-N. Jin et al. (2014) also found similar results in a study conducted using Pseudomonas sp.
ADN-42 for Heterotrophic SNaD under saline conditions. The existence of denitrification was
demonstrated by the decrease in the NO3-N -see Fig. 5.1. Nevertheless, the production of the nitrogenous
gasses was not examined during this study.
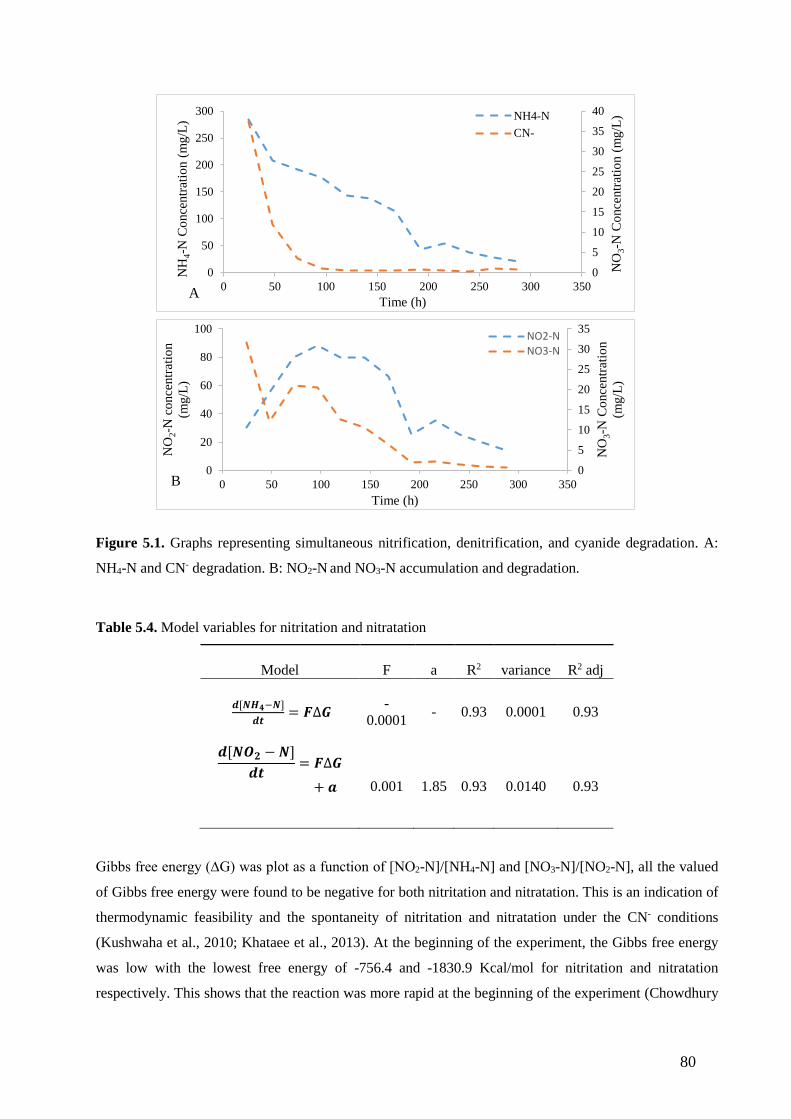
80
Figure 5.1. Graphs representing simultaneous nitrification, denitrification, and cyanide degradation. A:
NH4-N and CN- degradation. B: NO2-N and NO3-N accumulation and degradation.
Table 5.4. Model variables for nitritation and nitratation
Model F a R2 variance R2 adj
𝒅𝒅[𝑵𝑵𝑵𝑵𝟒𝟒−𝑵𝑵]𝒅𝒅𝒅𝒅
= 𝑭𝑭∆𝑮𝑮 -0.0001 - 0.93 0.0001 0.93
𝒅𝒅[𝑵𝑵𝑵𝑵𝟐𝟐 − 𝑵𝑵]𝒅𝒅𝒅𝒅
= 𝑭𝑭∆𝑮𝑮+ 𝒂𝒂
0.001 1.85 0.93 0.0140 0.93
Gibbs free energy (∆G) was plot as a function of [NO2-N]/[NH4-N] and [NO3-N]/[NO2-N], all the valued
of Gibbs free energy were found to be negative for both nitritation and nitratation. This is an indication of
thermodynamic feasibility and the spontaneity of nitritation and nitratation under the CN- conditions
(Kushwaha et al., 2010; Khataee et al., 2013). At the beginning of the experiment, the Gibbs free energy
was low with the lowest free energy of -756.4 and -1830.9 Kcal/mol for nitritation and nitratation
respectively. This shows that the reaction was more rapid at the beginning of the experiment (Chowdhury
0
5
10
15
20
25
30
35
40
0
50
100
150
200
250
300
0 50 100 150 200 250 300 350
NO
3-N
Con
cent
ratio
n (m
g/L)
NH
4-N
Con
cent
ratio
n (m
g/L)
Time (h)
NH4-NCN-
0
5
10
15
20
25
30
35
0
20
40
60
80
100
0 50 100 150 200 250 300 350
NO
3-N
Con
cent
ratio
n (m
g/L)
NO
2-N
con
cent
ratio
n (m
g/L)
Time (h)
NO2-NNO3-N
A
B

81
et al., 2011), as the concentration of the toxicant becomes exhausted the free Gibbs energy increases. It has
been documented that when a rate of reaction has a strongly negative ∆G values, it implies that they are
kinetically controlled, meaning they are feasible in wide concentration ranges, this is more likely to occur
in oxidation reaction with stronger electron accepter like oxygen and nitrate (Rodríguez et al., 2008).
This could also be linked with microorganisms reaching the stationary phase, thus the decrease in energy.
Literature claims that there’s a linear relationship that exists between biochemical reaction with their
corresponding ∆G (Rottenberg & Gutman, 1977). The relationship between the rate of NH4-N and NO2-N
degradation and their corresponding ∆G was studied and it was apparent that there is a linear correlation
between the rate of NH4-N and NO2-N degradation and their corresponding ∆G. Lüttge et al. (2006), also
reported a linear relationship between the rate of albite dissolution and their corresponding ∆G.
Furthermore, the Linear models were used to predict the relationship between the rate of NH4-N and NO2-
N degradation with their corresponding ∆G. the model fitted well into the experiment with correlation
coefficient of 0.94 and 0.93 for nitritation and nitratation respectively. Additionally, the observed rate of
NH4-N and NO2-N degradation was plotted against the predicted rate of degradation for both NH4-N and
NO2-N, the result showed that the observed rate and the predicted rate had a good linear correlation with
the correlation coefficient of 0.97 and 0.93 for nitritation and nitratation respectively- Fig 5.2 and 5.3.
Model: Change = F*G
Parity plot
R² = 0,9667
00,020,040,060,080,1
0,120,140,16
0 0,05 0,1 0,15 0,2
Pred
icte
d ra
te o
f NH
4-N
de
grad
atio
n (m
g/L/
h)
Observed rate of NH4-N degradation (mg/L/h)
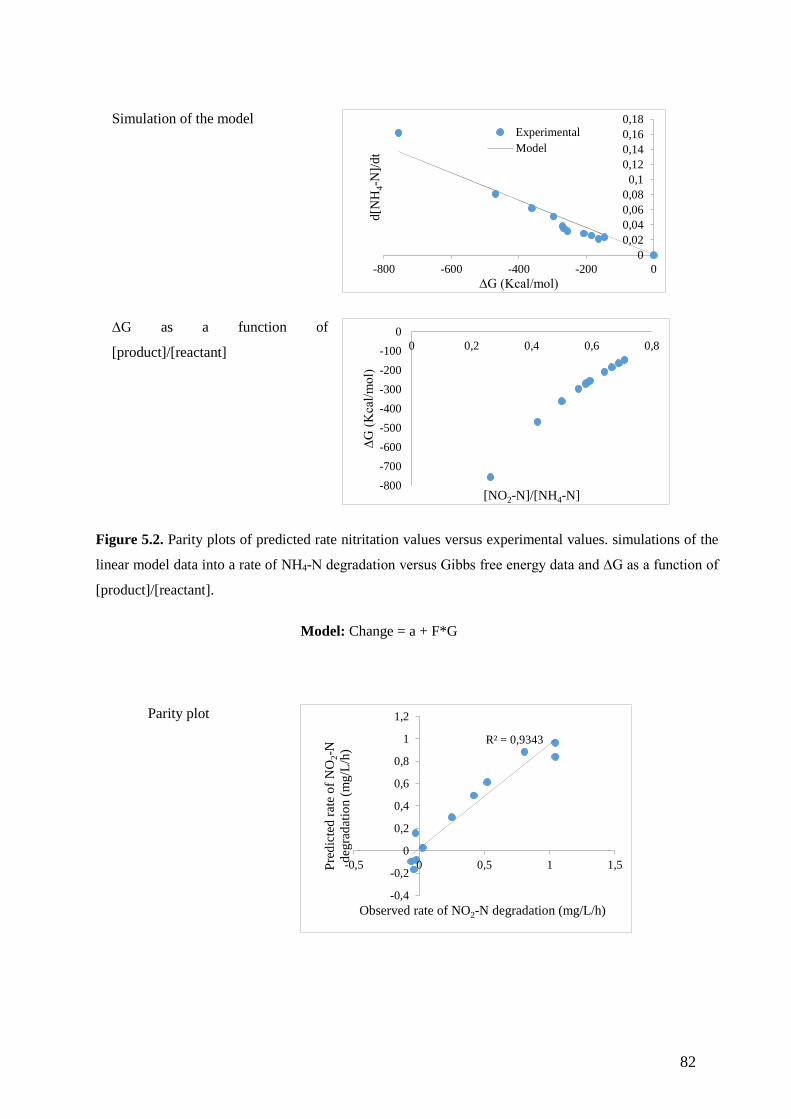
82
Simulation of the model
∆G as a function of
[product]/[reactant]
Figure 5.2. Parity plots of predicted rate nitritation values versus experimental values. simulations of the
linear model data into a rate of NH4-N degradation versus Gibbs free energy data and ∆G as a function of
[product]/[reactant].
Model: Change = a + F*G
Parity plot
00,020,040,060,080,1
0,120,140,160,18
-800 -600 -400 -200 0
d[N
H4-
N]/d
t
∆G (Kcal/mol)
ExperimentalModel
-800-700-600-500-400-300-200-100
00 0,2 0,4 0,6 0,8
∆G (K
cal/m
ol)
[NO2-N]/[NH4-N]
R² = 0,9343
-0,4
-0,2
0
0,2
0,4
0,6
0,8
1
1,2
-0,5 0 0,5 1 1,5Pred
icte
d ra
te o
f NO
2-N
de
grad
atio
n (m
g/L/
h)
Observed rate of NO2-N degradation (mg/L/h)

83
Simulation of the
model
∆G as a function of
[product]/[reactant]
Figure 5.3. Parity plots of predicted rate nitratation values versus experimental values. simulations of the
linear model data into a rate of NO2-N degradation versus Gibbs free energy data and ∆G as a function of
[product]/[reactant].
5.5. Conclusion
The isolated consortia presented an interesting characteristic, it performed nitrification, denitrification and
degraded CN- simultaneously. The Gibbs free energy was also studied to confirm the feasibility of the
nitrification and aerobic denitrification under high CN- conditions. Negative ∆G were obtained for both
nitratation and nitritation, this indicated that the reactions are feasible, spontaneous and rapid. Furthermore,
the relationship between the rate of NH4-N and NO2-N degradation and ∆G was investigated, the results
showed that there is a linear correlation between rate of NH4-N and NO2-N degradation and their respective
∆G. The equilibrium constant was also investigated (results not shown) since the nature of equilibrium
constant can also articulate whether the reaction is spontaneous or not, an increase in equilibrium constant
with the decrease in ∆G was observed, this is also a proof that SNaD reaction occurs spontaneously and
does not require additional energy.
-0,4
-0,2
0
0,2
0,4
0,6
0,8
1
1,2
-2000 -1500 -1000 -500 0
d[N
O2-
N]/d
t∆G (Kcal/mol)
ExperimentalModel
-2000-1800-1600-1400-1200-1000-800-600-400-200
00 0,2 0,4 0,6 0,8 1 1,2
∆G (K
cal/m
ol)
[NO3-N]/[NO2-N]

84
CHAPTER 6
BIO-KINETICS OF SIMULTANEOUS NITRIFICATION AND AEROBIC
DENITRIFICATION (SNAD) BY A CYANIDE DEGRADING BACTERIA UNDER CYANIDE-
LADEN CONDITIONS
Submitted as: Ncumisa Mpongwana, Seteno Karabo Obed Ntwampe, Elizabeth Ife Omodanisi, Boredi
Silas Chidi, Lovasoa Christine Razanamahandry, Cynthia Dlangamandla, Melody Ruvimbo Mukandi.
Kinetic modelling of free energy for simultaneous nitrification and aerobic denitrification under high
cyanide environments. Applied Sciences Manuscript ID: applsci-702267 (Accepted)

85
CHAPTER 6:
BIO-KINETICS OF SIMULTANEOUS NITRIFICATION AND AEROBIC
DENITRIFICATION (SNAD) BY A CYANIDE DEGRADING BACTERIA UNDER CYANIDE-
LADEN CONDITIONS
6.1. Introduction
Untreated total nitrogen (TN) containing wastewater in the environment can result in eutrophication, thus
the treatment of such wastewater containing TN is crucial in wastewater treatment plants (WWTPs) (Duan
et al., 2015). This type of wastewater may be treated by either physicochemical or biological methods. Most
municipal and industrial wastewater treatment plants use biological methods such as simultaneous
nitrification and aerobic denitrification (SNaD) for the treatment of contaminated water due to the cost-
effectiveness of such processes (Ge et al., 2015a; He et al., 2016).
However, SNaD is sensitive to toxicant loading (Daims et al., 2015; Li et al., 2014; Kim et al., 2008),
particularly free cyanide (CN-) (Daims et al., 2015). Physical and chemical methods have been used to
reduce CN- effects on SNaD; however, these methods are relatively expensive, complex and produce
undesirable by-products such as hypochlorite, and toxicant loaded sludge (Kapoor et al., 2015). Hence, the
biological removal of CN- prior to SNaD has recently received the most attention. Biological CN- removal
has been proven to be an ideal option because of its cost-effectiveness and environmental benignity
(Inglezakis et al., 2017). Although biological CN- removal reduces the production of undesirable by-
products, conducting CN- degradation in a separate reactor with SNaD in sequential two-stage reactor
systems, may result in the escalation of costs associated with the operation of the multiple independent
reactors dedicated to the biodegradation of CN- and TN. Han et al. (2014) proposed that CN- degrading and
resistant microorganisms can be used for SNaD in order to lower the inhibition effect of CN- towards SNaD
in a single reactor system.
Mekuto et al. (2015) reported that Bacillus species were capable of degrading up to 300 mg CN-/L and
subsequently utilize the by-products which were NH4-N, NO3-N, and NO2-N. Additionally, Mpongwana et
al. (2016) isolated a CN- tolerant strain capable of simultaneous CN- degradation and SNaD. However, the
applicability of CN- degrading and resistant microorganisms is still restricted due to the lack of information
necessary to adequately control SNaD under high CN- loading conditions. Hence, this paper reports on the
isolation of an organism that simultaneously degrades CN- while performing SNaD, with the phenomena
86
of simultaneous CN- degradation and NH4-N removal being modeled by the determination of kinetic
parameters using numerous decay models. The mechanism by which CN- affects the nitrification and
denitrification enzymes is still not documented, thus making it difficult to apply CN- resistant
microorganisms in SNaD systems, in which CN- laden wastewater is being treated. To also address this
research gap, the expression and activity of ammonia monooxygenase (AMO), nitrate reductase (NaR) and
nitrite reductase (NiR) present in the CN- resistant isolates’ supernatant, deemed suitable for this research,
was also conducted.
6.2. Objectives
• Isolation of a single strain of cyanide resistant bacteria from the isolated mix consortium.
• Asses the ability of the isolated single strain to perform SNaD under CN- conditions.
• Evaluating the predictive capability of different mathematical models towards simultaneous
nitrification and aerobic denitrification under CN- environments.
• Evaluate the effect of CN- on nitrifying and denitrifying enzymes.
6.3. Materials and methods
The single microorganism was isolated from the mix consortium. The Isolated strain was subjected to
toxicity test, whereby it was grown in a nutrient agar containing varied concentrations of NH4-N and CN-.
The 16sRNA of the isolated strain was sequenced at Inqaba biotech SA using 16S-27F and 16S-1492R
primers with sequence (5’ to 3’) AGAGTTTGATCMTGGCTCAG, and CGGTTACCTTGTTACGACTT,
respectively. Thereafter, the basal medium mentioned in section 4.1.1 was used for batch culture
experiments, the microorganism was initially grown for 3 days subsequent to the addition of 20 mg NH4-
N/L and 20 mg CN-/L into the basal media. samples were collected at a 24 h’ interval for 7 days to examine
CN-, NH4-N, NO2-N, NO3-N and microbial growth at OD660 nm. The analysis was performed using Merck
SA test kits and ANOVA Spectroquant as per manufactures instructions. The effect of CN- on the
nitrification and denitrification enzyme was examined. The enzymes were extracted by primary lysing of
the cell using sonicator; thereafter, the enzymes were collected from the free cell extract using cold acetone.
The free cell extract was also analysed by FTIR to assess whether the CN- attaches to the proteins of the
cell.

87
6.4. Results and Discussion 6.4.1. Identification of bacterial Isolate
The CN- resistant bacterial strain was characterized by sequencing 16sRNA using the universal primers
27F and 1492R to amplify the target region. The results were obtained by a BLAST search. The sequence
on NCBI indicated that the isolated bacteria was Acinetobacter courvalinii, accession number
AB602910.1/NR_148843.1.
6.4.2. Degradation kinetics of Cyanide and NH4-N
An experiment was conducted to investigate the growth of A. courvalinii under CN- conditions, subsequent
to CN- and TN biodegradation studies by the isolate. The growth of A. courvalinii was shown not to be
affected by CN- concentration of up to 20 mg CN-/L; therefore, it was selected for the assessment of its
ability to perform SNaD under cyanogenic conditions. The isolate was found to possess a special ability of
sequential utilization of CN- and TN by exploiting its multi-phased growth attributes, by initially utilizing
of CN- and subsequently, NH4-N, which was evident by the appearance of a secondary logarithmic phase
as seen in Fig. 6.1A.
Fig. 6.1A demonstrates that A. courvalinii utilized CN- primarily, from a concentration of 20 mg CN-/L to
5.8 mg CN-/L followed by NH4-N. The rate of degradation for both CN- and NH4-N was 2.2 mg CN-/L/h
and 0.40 mg NH4-N/L/h, respectively. Moreover, a cyanide degrading consortium was also assessed (Fig
10.1 Appendix A) as it was having similar attributes to the isolate used in this study; albeit, due to a large
percentage of organisms within the consortium being identified as unknown (Fig 10.2 Appendix A), the
results were not included nor discussed herein. Overall, an increase of CN- in the first 24 h was observed,
with a subsequent CN- decrease from 58.1 mg CN-/L to 5.8 mg CN-/L, being observed. The initial increase
in CN- was associated with the activation of the ANR cascade which results in the production of HCN and
denitrification enzymes (NAR, NIR, NOR, and N2OR) Fig. 6.1A.
Arai et al. (1997) reported the regulation of ANR cascade for transcription of denitrification enzymes
resulting in the production of HCN by Pseudomonas aeruginosa. Moreover, the Pseudomonadaceae have
been reported to possess aerobic denitrification capability needed in the aiding and furtherance of SNaD
(Yunjie et al., 2020). A courvalinii exhibited similar characteristics to those of Pseudomonas sp.
Mpongwana et al. (2016) also reported an increase in CN- concentration during the expression of
denitrification enzymes. For this study, a decrease in NH4-N from 64.2 to 28.4 mgNH4-N/L was observed,
indicating an initiation of nitrification from the threshold limit of 5.8 mg CN-/L Fig. 6.1A. This indicated
that a concentration of 5.8 mg CN-/L did not completely inhibit nitrification; albeit, this concentration is
above the threshold concentration of CN- known to completely inhibit nitrification reaction (Kim et al.,
2008). Kim et al. (2007) reported the complete inhibition of nitrification by 1 mg CN-/L. The inhibition is
largely associated with enzyme redundancy, non-production and deactivation.
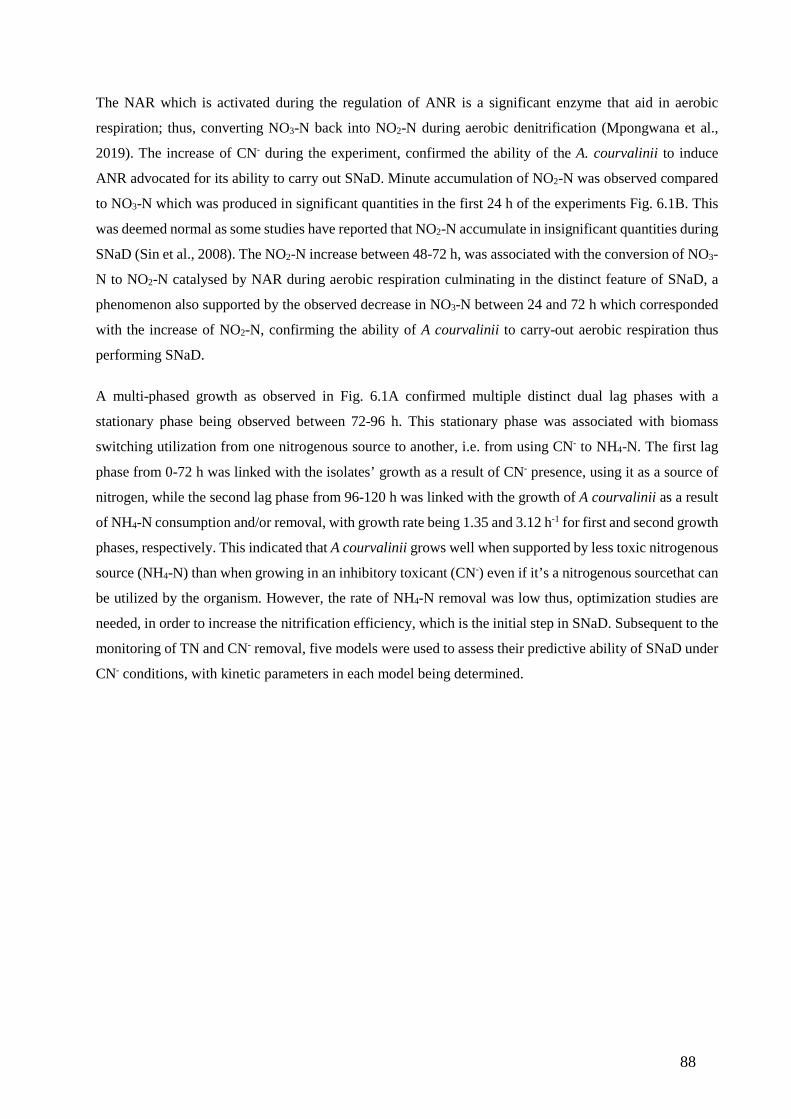
88
The NAR which is activated during the regulation of ANR is a significant enzyme that aid in aerobic
respiration; thus, converting NO3-N back into NO2-N during aerobic denitrification (Mpongwana et al.,
2019). The increase of CN- during the experiment, confirmed the ability of the A. courvalinii to induce
ANR advocated for its ability to carry out SNaD. Minute accumulation of NO2-N was observed compared
to NO3-N which was produced in significant quantities in the first 24 h of the experiments Fig. 6.1B. This
was deemed normal as some studies have reported that NO2-N accumulate in insignificant quantities during
SNaD (Sin et al., 2008). The NO2-N increase between 48-72 h, was associated with the conversion of NO3-
N to NO2-N catalysed by NAR during aerobic respiration culminating in the distinct feature of SNaD, a
phenomenon also supported by the observed decrease in NO3-N between 24 and 72 h which corresponded
with the increase of NO2-N, confirming the ability of A courvalinii to carry-out aerobic respiration thus
performing SNaD.
A multi-phased growth as observed in Fig. 6.1A confirmed multiple distinct dual lag phases with a
stationary phase being observed between 72-96 h. This stationary phase was associated with biomass
switching utilization from one nitrogenous source to another, i.e. from using CN- to NH4-N. The first lag
phase from 0-72 h was linked with the isolates’ growth as a result of CN- presence, using it as a source of
nitrogen, while the second lag phase from 96-120 h was linked with the growth of A courvalinii as a result
of NH4-N consumption and/or removal, with growth rate being 1.35 and 3.12 h-1 for first and second growth
phases, respectively. This indicated that A courvalinii grows well when supported by less toxic nitrogenous
source (NH4-N) than when growing in an inhibitory toxicant (CN-) even if it’s a nitrogenous sourcethat can
be utilized by the organism. However, the rate of NH4-N removal was low thus, optimization studies are
needed, in order to increase the nitrification efficiency, which is the initial step in SNaD. Subsequent to the
monitoring of TN and CN- removal, five models were used to assess their predictive ability of SNaD under
CN- conditions, with kinetic parameters in each model being determined.

89
Figure 6.1. Biodegradation kinetics of NH4-N and CN- by Acinetobacter courvalinii. A: Growth of
Acinetobacter courvalinii, sequential degradation of CN- and NH4-N. B: NO3-N and NO2-N accumulation
and degradation.
Table 6.1. Estimated kinetic parameter values for the models for NH4-N degradation, a rate-limiting step
in nitrification
Fitting constants and the values of kinetic parameter
(±95% confidence interval)
Model Vm (h-1) Ki (mgL-1) Ks (mgL-1) n (-) R2 variance
Rate law
−𝐝𝐝𝐝𝐝𝐝𝐝𝐝𝐝𝐝𝐝
= 𝒓𝒓 = 𝑲𝑲𝒊𝒊𝑪𝑪𝒂𝒂𝒏𝒏
- 6.29E-05 - 2.27 0.91
0.02
0
50
100
150
200
250
0
10
20
30
40
50
60
70
0 50 100 150
Bio
mas
s (m
g/C
FU/h
r)
NH
4-N
/ CN
-C
once
ntra
tion
(mg/
L)
Time (h)
Residual NH4-N
Residual CN-
Biomass
0
0,05
0,1
0,15
0,2
0,25
00,5
11,5
22,5
33,5
44,5
0 50 100 150
NO
2-N
Con
cent
ratio
n (m
g/L)
NO
3-N
Con
cent
ratio
n (m
g/L)
Time (h)
Residual NO3-N
Residual NO2-N
A
B

90
Haldane
−𝒅𝒅𝑪𝑪𝒂𝒂𝒅𝒅𝒅𝒅
=𝑽𝑽𝒎𝒎𝐝𝐝𝒂𝒂
𝑪𝑪𝒂𝒂 + 𝑪𝑪𝒂𝒂𝟐𝟐𝐊𝐊𝐢𝐢
0.45 23.94 - - 0.92
0.02
Model with substrate inhibition
Andrews
−𝒅𝒅𝑪𝑪𝒂𝒂𝒅𝒅𝒅𝒅
= 𝑽𝑽𝒎𝒎[𝟏𝟏 −𝑲𝑲𝒊𝒊
𝑪𝑪 𝒂𝒂][𝟏𝟏
+𝑪𝑪𝒂𝒂𝑲𝑲𝒔𝒔
]
0.36 27.54 13.22 - 0.94 0.02
*Equations 2 to 6 were obtained from Annuar et al (2008)
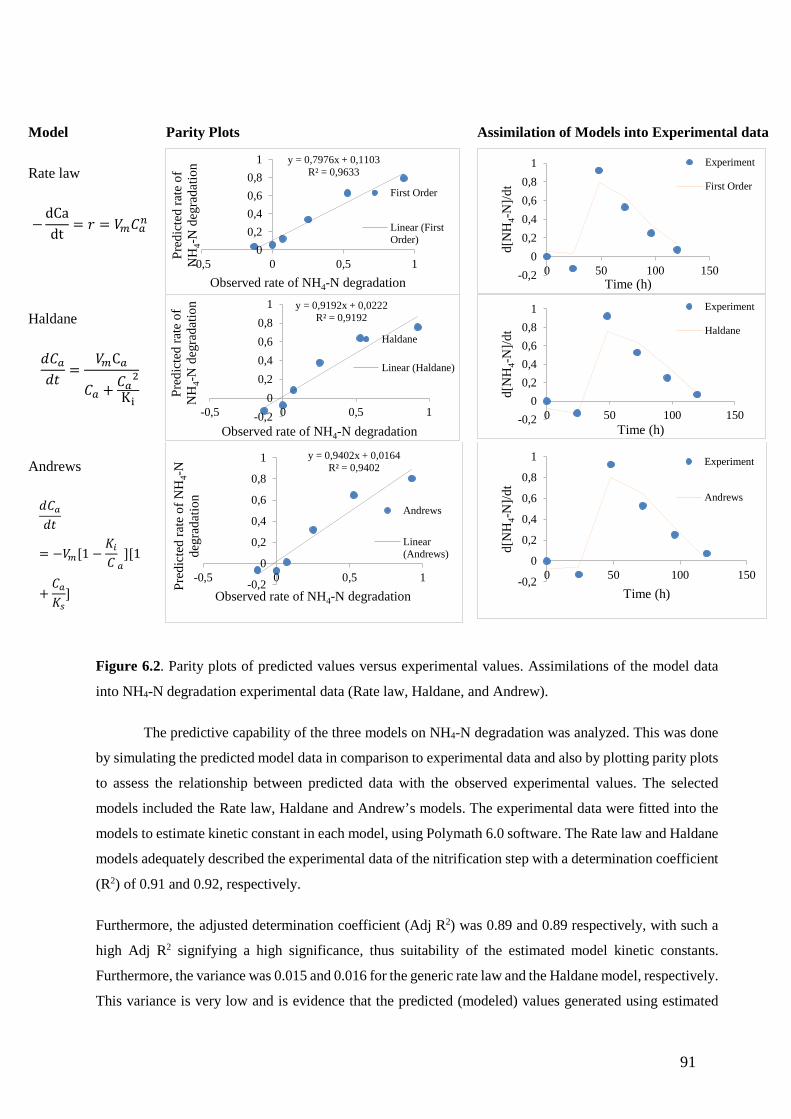
91
Figure 6.2. Parity plots of predicted values versus experimental values. Assimilations of the model data
into NH4-N degradation experimental data (Rate law, Haldane, and Andrew).
The predictive capability of the three models on NH4-N degradation was analyzed. This was done
by simulating the predicted model data in comparison to experimental data and also by plotting parity plots
to assess the relationship between predicted data with the observed experimental values. The selected
models included the Rate law, Haldane and Andrew’s models. The experimental data were fitted into the
models to estimate kinetic constant in each model, using Polymath 6.0 software. The Rate law and Haldane
models adequately described the experimental data of the nitrification step with a determination coefficient
(R2) of 0.91 and 0.92, respectively.
Furthermore, the adjusted determination coefficient (Adj R2) was 0.89 and 0.89 respectively, with such a
high Adj R2 signifying a high significance, thus suitability of the estimated model kinetic constants.
Furthermore, the variance was 0.015 and 0.016 for the generic rate law and the Haldane model, respectively.
This variance is very low and is evidence that the predicted (modeled) values generated using estimated
Model Parity Plots Assimilation of Models into Experimental data
Rate law
−dCadt
= 𝑟𝑟 = 𝑉𝑉𝑚𝑚𝐻𝐻𝑚𝑚𝐸𝐸
Haldane
𝑑𝑑𝐻𝐻𝑚𝑚𝑑𝑑𝐵𝐵
=𝑉𝑉𝑚𝑚C𝑚𝑚
𝐻𝐻𝑚𝑚 + 𝐻𝐻𝑚𝑚2Ki
Andrews
𝑑𝑑𝐻𝐻𝑚𝑚𝑑𝑑𝐵𝐵
= −𝑉𝑉𝑚𝑚[1 −𝐾𝐾𝑖𝑖𝐻𝐻 𝑚𝑚
][1
+𝐻𝐻𝑚𝑚𝐾𝐾𝑠𝑠
]
y = 0,7976x + 0,1103R² = 0,9633
00,20,40,60,8
1
-0,5 0 0,5 1
Pred
icte
d ra
te o
f N
H4-
N d
egra
datio
n
Observed rate of NH4-N degradation
First Order
Linear (FirstOrder)
-0,20
0,20,40,60,8
1
0 50 100 150
d[N
H4-
N]/d
t
Time (h)
Experiment
First Order
y = 0,9192x + 0,0222R² = 0,9192
-0,20
0,20,40,60,8
1
-0,5 0 0,5 1
Pred
icte
d ra
te o
f N
H4-
N d
egra
datio
n
Observed rate of NH4-N degradation
Haldane
Linear (Haldane)
-0,20
0,20,40,60,8
1
0 50 100 150
d[N
H4-
N]/d
t
Time (h)
Experiment
Haldane
y = 0,9402x + 0,0164R² = 0,9402
-0,2
0
0,2
0,4
0,6
0,8
1
-0,5 0 0,5 1
Pred
icte
d ra
te o
f NH
4-N
de
grad
atio
n
Observed rate of NH4-N degradation
Andrews
Linear(Andrews)
-0,2
0
0,2
0,4
0,6
0,8
1
0 50 100 150
d[N
H4-
N]/d
t
Time (h)
Experiment
Andrews

92
kinetic parameters did not differ much from experimental data. Similarly, Andrews model-generated data
with substrate inhibition was also compared to experimental data. The model gave a better fit with a
correlation coefficient of 0.94 and a linear correlation efficiency of 0.98 and an Adj R2 0.90.
The average standard deviations were compared for the selection of the better predicting model for NH4-N
degradation as a limiting step, with a standard deviation of Haldane, Rate law and Andrews model being
0.041, 0.043, and 0.036, respectively. However, for the selection of the model that is adequate in predicting
multiple nitrogenous pollutants (CN-, NH4-N, NO2-N and NO3-N) removal, the prediction ability of the
model towards CN- degradation needed to be considered. The parity plot indicated a satisfactory correlation
between the experimental rate of NH4-N degradation and the predicted rates with R2 being 0.96, 0.92, and
0.94 for Rate law, Haldane and Andrew’s model respectively.
Moreover, the variance for Andrews’s model also proved the significance of the model with variance being
0.015. This variance was minute which indicated that there was a negligible difference between the model
and experimental data (see Fig. 6.2 and Table 6.1). Monod and Moser models were also assessed for their
predictive ability of NH4-N and CN- degradation rates; however, they did not fit well into the experimental
data (Fig. 10.3 and 10.4, Appendix A).
Table 6.2. Estimated values of kinetic parameters for the models for CN- degradation
Values of kinetic Parameter (±95% confidence interval)
Model Vm (h-1) Ki (mgL-1) Ks (mgL-
1) n (-) R2 variance
Rate law
−𝐝𝐝𝐝𝐝𝐝𝐝𝐝𝐝𝐝𝐝
= 𝒓𝒓 = 𝑲𝑲𝒊𝒊𝑪𝑪𝒂𝒂𝒏𝒏
- 3.33E-05 - 2.65 0.92 0.05
Haldane
𝒅𝒅𝑪𝑪𝒂𝒂𝒅𝒅𝒅𝒅
=𝑽𝑽𝒎𝒎𝐝𝐝𝒂𝒂
𝑪𝑪𝒂𝒂 + 𝑪𝑪𝒂𝒂𝟐𝟐𝐊𝐊𝐢𝐢
0.36 11.36 - - 0.95 365.43
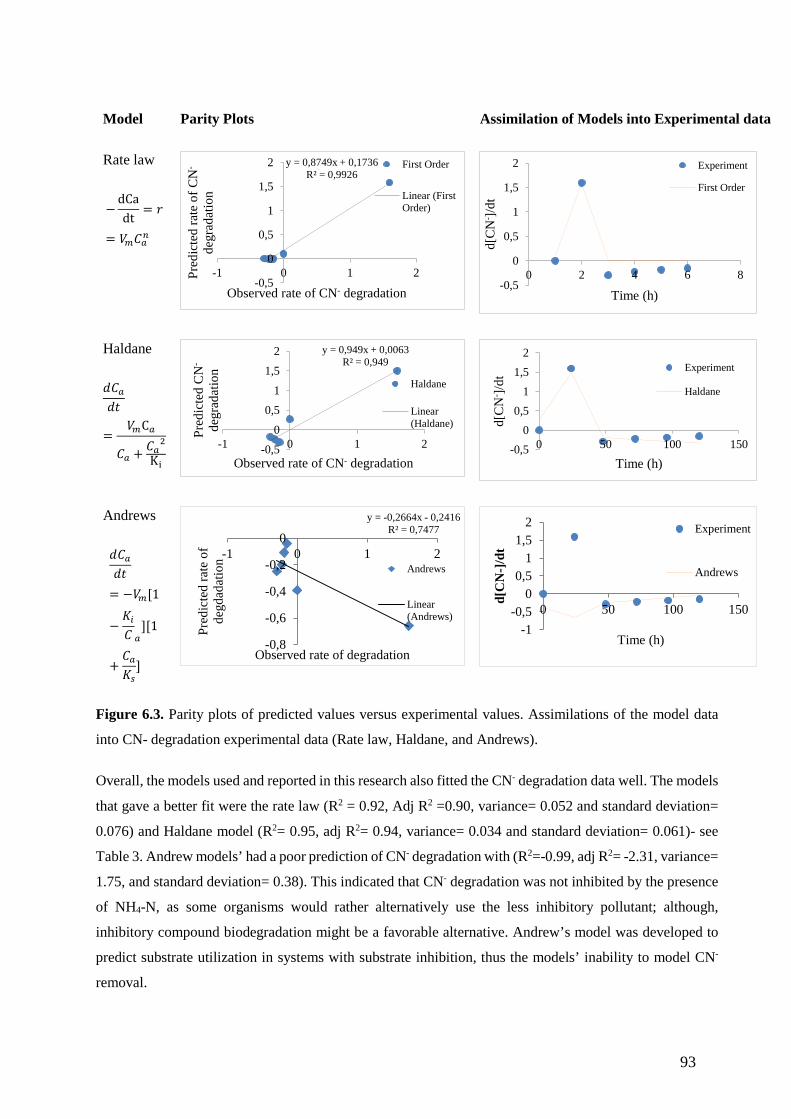
93
Model Parity Plots Assimilation of Models into Experimental data
Rate law
−dCadt
= 𝑟𝑟
= 𝑉𝑉𝑚𝑚𝐻𝐻𝑚𝑚𝐸𝐸
Haldane
𝑑𝑑𝐻𝐻𝑚𝑚𝑑𝑑𝐵𝐵
=𝑉𝑉𝑚𝑚C𝑚𝑚
𝐻𝐻𝑚𝑚 + 𝐻𝐻𝑚𝑚2Ki
Andrews
𝑑𝑑𝐻𝐻𝑚𝑚𝑑𝑑𝐵𝐵
= −𝑉𝑉𝑚𝑚[1
−𝐾𝐾𝑖𝑖𝐻𝐻 𝑚𝑚
][1
+𝐻𝐻𝑚𝑚𝐾𝐾𝑠𝑠
]
Figure 6.3. Parity plots of predicted values versus experimental values. Assimilations of the model data
into CN- degradation experimental data (Rate law, Haldane, and Andrews).
Overall, the models used and reported in this research also fitted the CN- degradation data well. The models
that gave a better fit were the rate law (R2 = 0.92, Adj R2 =0.90, variance= 0.052 and standard deviation=
0.076) and Haldane model (R2= 0.95, adj R2= 0.94, variance= 0.034 and standard deviation= 0.061)- see
Table 3. Andrew models’ had a poor prediction of CN- degradation with (R2=-0.99, adj R2= -2.31, variance=
1.75, and standard deviation= 0.38). This indicated that CN- degradation was not inhibited by the presence
of NH4-N, as some organisms would rather alternatively use the less inhibitory pollutant; although,
inhibitory compound biodegradation might be a favorable alternative. Andrew’s model was developed to
predict substrate utilization in systems with substrate inhibition, thus the models’ inability to model CN-
removal.
y = 0,8749x + 0,1736R² = 0,9926
-0,5
0
0,5
1
1,5
2
-1 0 1 2Pred
icte
d ra
te o
f CN
-
degr
adat
ion
Observed rate of CN- degradation
First Order
Linear (FirstOrder)
-0,5
0
0,5
1
1,5
2
0 2 4 6 8
d[C
N- ]/
dt
Time (h)
Experiment
First Order
y = 0,949x + 0,0063R² = 0,949
-0,50
0,51
1,52
-1 0 1 2
Pred
icte
d C
N-
degr
adat
ion
Observed rate of CN- degradation
Haldane
Linear(Haldane)
-0,50
0,51
1,52
0 50 100 150
d[C
N- ]/
dt
Time (h)
Experiment
Haldane
y = -0,2664x - 0,2416R² = 0,7477
-0,8
-0,6
-0,4
-0,2
0-1 0 1 2
Pred
icte
d ra
te o
f de
gdad
atio
n
Observed rate of degradation
Andrews
Linear(Andrews)
-1-0,5
00,5
11,5
2
0 50 100 150
d[C
N-]
/dt
Time (h)
Experiment
Andrews

94
Ge et al. (2015) studied the kinetics of SNaD under high phenol concentrations using bacterial strains
capable of phenol degradation, heterotrophic nitrification, and aerobic denitrification. Additionally,
Vasiliadou et al. (2006) also studied the kinetics of denitrification with nitrate inhibition. Additionally, Li
et al. (2019) also determined that the Haldane model predicted CN- well with R2 being 0.99 These studies
indicated the feasibility of SNaD even under inhibitory pollutant loading. Moreover, the kinetic parameters
obtained were comparable to those obtained for this study (Table 6.3).
Overall, the variance and standard deviation of the model showed that all three models predicted NH4-N
degradation better as opposed to CN- degradation. This was shown with the higher variances and standard
deviation of CN- degradation than those of NH4-N degradation. Although, all three models adequately
represented NH4-N removal with high R2 and adj R2, the rate law and Andrews models had higher average
standard deviation and variance for predicted rate of CN- degradation in comparison to actual experimental
data; thus rendering unusable as candidate prediction models for removal systems with multiple nitrogenous
pollutants.
Moreover, Haldanes’ model was selected as a better predictor of NH4-N removal under CN- conditions.
This decision was based on its standard deviation and the variance being the lowest for both NH4-N and
CN- degradation, indicating that the predicted rate of NH4-N and CN- by Haldane had a minute deviation
from the experimental data thus qualifying it as a better model to be used for multiple nitrogenous pollutants
systems, especially, SNaD.
The result obtained it this study were consistent with those that were previously reported by Pradhan et al.
(2019) describing dual substrate kinetics of ammonia oxidation by Haldane model, with R2 > 0.98 and adj
R2 > 0.98 and low standard errors (RMSE) < 0.61. Additionally, Wang et al. (2019) reported a high
correlation between Haldane prediction and experimental data with adjusted R2 (0.995), Ks (2.997 ± 0.041
mg/L) and Ki (64.736 ± 0.023 mg/L).
Table 6.3. Kinetic parameters obtained from different studies assessing nitrification and aerobic
denitrification
Model Kinetic parameters
𝑽𝑽𝒎𝒎 𝑲𝑲𝒔𝒔 𝑲𝑲𝒊𝒊 n Reference
Haldane 0.323 9.65 152.40 - (Kim et al., 2008)
SNaD under high phenol concentrations using A strain capable of phenol degradation
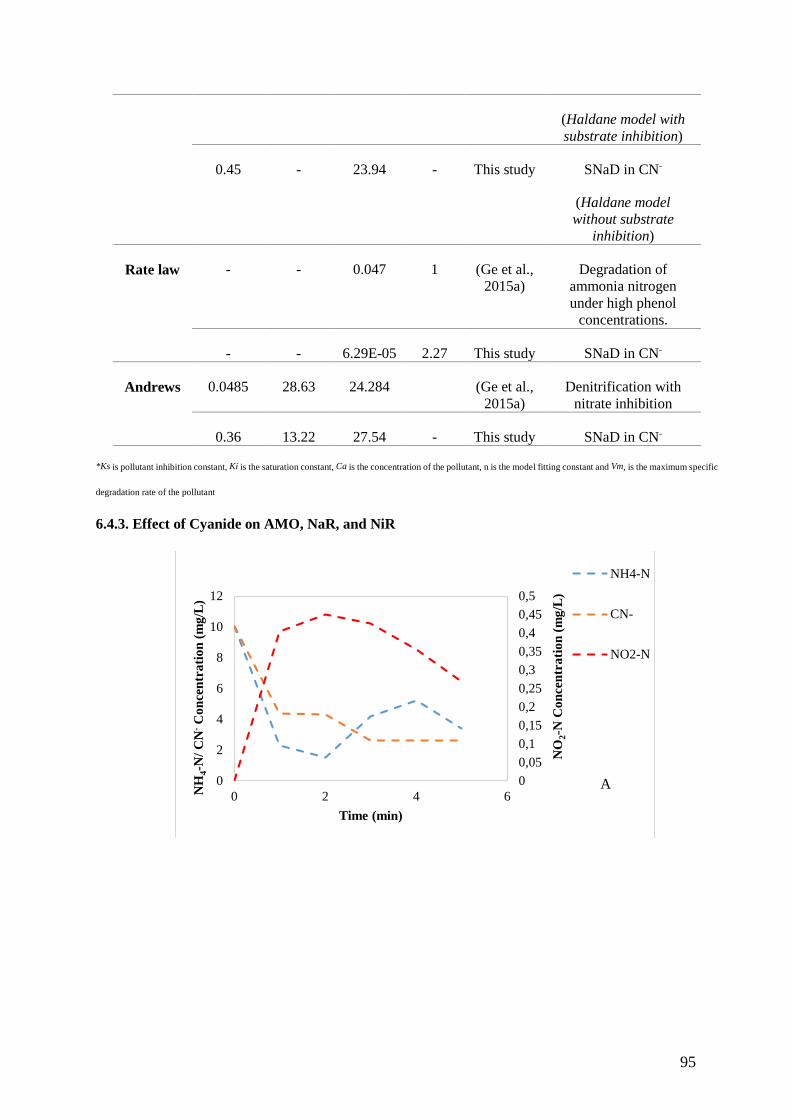
95
(Haldane model with substrate inhibition)
0.45 - 23.94 - This study SNaD in CN-
(Haldane model without substrate
inhibition)
Rate law - - 0.047 1 (Ge et al., 2015a)
Degradation of ammonia nitrogen under high phenol
concentrations.
- - 6.29E-05 2.27 This study SNaD in CN-
Andrews 0.0485 28.63 24.284 (Ge et al., 2015a)
Denitrification with nitrate inhibition
0.36 13.22 27.54 - This study SNaD in CN-
*Ks is pollutant inhibition constant, Ki is the saturation constant, Ca is the concentration of the pollutant, n is the model fitting constant and Vm, is the maximum specific
degradation rate of the pollutant
6.4.3. Effect of Cyanide on AMO, NaR, and NiR
00,050,10,150,20,250,30,350,40,450,5
0
2
4
6
8
10
12
0 2 4 6
NO
2-N
Con
cent
ratio
n (m
g/L
)
NH
4-N
/ CN
-C
once
ntra
tion
(mg/
L)
Time (min)
NH4-N
CN-
NO2-N
A

96
Figure 6.4. The activity of NH4-N, NO3-N and NO2-N oxidizing enzymes and CN- degrading enzyme. A:
Effect of CN- on the induction of NH4-N, NO3-N and NO2-N oxidizing enzymes by A. courvalinii. B: Effect
of CN- on free cell NH4-N, NO3-N and NO2-N oxidizing enzymes
Enzyme inhibition can occur in different ways such as the binding of an inhibitor onto an active site or for
example a site of the AMO responsible for NH4-N oxidation. The second inhibition mechanism can involve
the removal of the Cu co-factor of AMO which in turn affects the activity of AMO (Ruser, 2015). To assess
the effect of CN- towards SNaD, enzyme extracts from A. courvalinii cultivated in batch cultures were used.
The effect of CN- towards the expression of NH4-N (AMO), NO3-N (NaR) and NO2-N (NiR) oxidizing
enzymes (Fig. 6.4A) was evaluated.
The activity and presence of AMO, NaR, and NiR was conducted using cell-free extracts by the addition
of the enzyme solution into solutions of NH4-N. The results revealed that A. courvalinii was able to express
AMO, and not NaR and NiR; this was shown by the decrease of NH4-N and the accumulation of NO2-N;
however, there was minimal NO2-N oxidation observed thus minimal NO3-N formation and accumulation
detected (see Fig. 6.4B). This observation led to a hypothesis that CN- inhibited the expression of NO3-N
and NO2-N oxidizing enzymes or results in the excretion of non-active NO3-N and NO2-N oxidizing
enzymes.
In addition, the competitive inhibition by the addition of CN- to free cell extract was examined. This
experiment aimed to determine the effect of CN- on the expressed NH4-N, NO3-N, and NO2-N oxidizing
enzymes, of which the outcomes indicated that the presence of CN- did not have an effect on the NH4-N
reducing enzyme; albeit, a slow decrease of NO2-N was observed which suggested the activation of
denitrification. Additionally, no NO3-N accumulation was observed which meant that A. courvalinii
converted NO2-N directly to N2.
0
0,1
0,2
0,3
0,4
0,5
0,6
0
2
4
6
8
10
12
0 1 2 3 4 5 6
NO
2-N
Con
cent
ratio
n (m
g/L
)
NH
4-N
Con
cent
ratio
n (m
g/L
)
Time (min)
NH4-N
NO2-N
B

97
The activation of NO2-N genes when CN- was added to bacterial cultures, could be a confirmation that A.
courvalinii expresses an ANR protein in response to the presence of CN- as a protective mechanism for the
cyanide-resistant bacteria used in this research in order to mitigate against the toxicity of the CN-.
Furthermore, the activation of this protein can lead to the induction of NAR, NIR, NOR, and N2OR
although this was not confirmed in this study (Duan et al., 2015).
6.5. Conclusions
The growth of Acinetobacter courvalinii accession number AB602910.1/NR_148843.1 was not affected by
CN-. Furthermore, this microorganism was shown to carry-out SNaD under higher CN- concentration than
the threshold concentration which is known to completely inhibit SNaD. The predictive ability of the rate
law, Haldane, and Andrews models was assessed with results indicating that the rate law, Haldane, and
Andrew’s models were better models to predict NH4-N removal as the initial step in SNaD, with high R2
and adj R2; thus, the evaluation of models ability to also predict CN- degradation, with the standard deviation
and variance being a criterion for selection of the better predicting model. The Haldane model was found
to have the lowest standard deviation for both CN- and NH4-N removal among all models evaluated. Thus
it’s selection as a model that is suitable to predict the detoxification of TN in wastewater, using SNaD even
under CN- laden conditions.
The influence of CN- on AMO, NaR, and NiR also showed that CN- did not affect the expression and
activity of NH4-N oxidizing enzymes and the assumption was made that non-viable NO3-N and NO2-N
reducing enzymes were expressed. This hypothesis comes from the observation of the slow decrease in
NO2-N after the addition of CN- on crude enzyme extract assays, confirming the activity of NO3-N reducing
enzyme and activation of the denitrification pathway by the CN-. Although A. courvalinii has been shown
to be able to detoxify TN under CN- conditions Physico-chemical parameters still need to be investigated
in order to optimize the degradation efficiency of isolate, A. courvalinii.
98
CHAPTER 7
PREDICTIVE CAPABILITY OF RESPONSE SURFACE METHODOLOGY AND CYBERNETIC MODELS FOR
CYANOGENIC SIMULTANEOUS NITRIFICATION AND AEROBIC DENITRIFICATION (SNAD) FACILITATED
BY CYANIDE-RESISTANT BACTERIA
Submitted as: Ncumisa Mpongwana, Seteno Karabo Obed Ntwampe, Lovasoa Christine
Razanamahandry, Boredi Silas Chidi, Elizabeth Ife Omodanisi. Predictive capability of response surface
methodology and cybernetic models for cyanogenic simultaneous nitrification and aerobic denitrification
(SNaD) facilitated by cyanide-resistant bacteria. Submitted to Microorganisms

99
CHAPTER 7:
PREDICTIVE CAPABILITY OF RESPONSE SURFACE METHODOLOGY AND
CYBERNETIC MODELS FOR CYANOGENIC SIMULTANEOUS NITRIFICATION AND
AEROBIC DENITRIFICATION (SNAD) FACILITATED BY CYANIDE-RESISTANT
BACTERIA
7.1. Introduction
The growth of a microorganism under multiple carbon source conditions can influence its performance
even in large-scale wastewater treatment processes (Van Dedem & Moo-Young, 1975; Narang & Pilyugin,
2007; Solopova et al., 2014). Similarly, wastewater can be composed of different nitrogenous compounds
from several industries. Current methods to treat this type of wastewater consist of traditional two-stage
biological processes known as aerobic nitrification and anoxic denitrification. These treatment processes
have different operating conditions and requirements such as dissolved oxygen concentration, carbon
source requirements and retention time, with throughput rates of the wastewater being treated in the
processes being of outmost importance. Due to high energy consumption associated with the second reactor
dedicated to anaerobic denitrification, some studies have indicated the possibility of simultaneous
nitrification and aerobic denitrification (SNaD).
This process is advantageous than traditional nitrification subsequent to denitrification, providing for cost-
effectiveness (Kim et al., 2008; Zhang et al., 2015; Jin et al., 2014). Moreover, SNaD is a highly effective
method for total nitrogen (TN), i.e. ammonium nitrogen (NH4-N), nitrate-nitrogen (NO3-N) and nitrite-
nitrogen (NO2-N), removal from wastewater (He et al., 2016), although, the microorganism(s) used during
TN removal are highly sensitive to toxicant loading, thus, SNaD is the least effective of industrial
wastewater treatment methods owing to a high concentration of contaminants that may completely inhibit
SNaD (Choi & Hu, 2009; Papirio et al., 2014).
The coking industry is among the industries that produce wastewater containing high quantities of
pollutants such as NH4-N in the form of ammonium sulfate, thiocyanide (SCN), free cyanide (CN-), etc
(Ma et al., 2015). This type of wastewater may result in serious environmental contamination and other
challenges associated with the disposal of such contaminated wastewater if not treated (Feng et al., 2015;
Carrera et al., 2003; Kim et al., 2011a; Kim et al., 2011b) using processes such as SNaD; albeit, some
100
inhibitory pollutants might render this process ineffective. Kim et al. (2008) have reported that CN- does
possess the highest inhibitory effect on SNaD.
CN- containing wastewater is produced in various other industries including mining, steel making, chemical
manufacturing, and petroleum industries. CN- has been known to be more poisonous than other cyanide
compounds. However, some microorganisms have been reported to be able to use CN- and other TN
constituents as nitrogenous sources, thus their suitability to be used in SNaD operations. The mechanism
of CN- tolerance and conversion, as also observed for TN removal, occurs through four general pathways
that are hydrolytic; oxidative; reductive; and substitution/transfer mechanisms (Kapoor et al., 2016; Luque-
Almagro et al., 2016; Razanamahandry et al., 2016).
Moreover, some studies reported the ability of cyanide degrading bacteria to degrade CN- and subsequently
nitrify and aerobically denitrify (Mekuto et al., 2015). An example is that of Mekuto et al. (2018) who
successfully demonstrated the use of cyanide degrading bacteria for nitrification and aerobic denitrification
under cyanogenic conditions. Ryu et al. (2015) also reported complete SNaD and simultaneous SCN
degradation. These findings have led to the proposition of applying cyanide degrading bacteria for SNaD
to eliminate the inhibitory effect of CN- towards SNaD, which can further reduce operational costs
associated with the reactor designated for biological pretreatment of CN- (Han et al., 2013) and for
downstream denitrification.
Moreover, the application of cyanide degrading bacteria will not only resolve the inhibitory effect of CN-
towards SNaD, it will also resolve the challenge of slow-growing microorganisms responsible for SNaD
since cyanide degrading bacteria have higher growth rates (Ojaghi et al., 2018; Kandasamy et al., 2015).
This will likely improve process performance and compensate for biomass washout. In addition, some
cyanide degrading bacteria have been reported to also possess other important genes such as the gene
responsible for polyhydroxyalkanoates (PHA) synthesis which can be used as an energy source when
produced extracellularly during the biodegradation of pollutants, including other aromatic compounds
(Luque-Almagro et al., 2016).
This is another advantageous trait of cyanide degrading bacteria. Han et al. (2013) have recommended the
application of CN- degrading bacteria for TN removal from wastewater containing a high quantity of CN-
as an alternative to mediate the effect of CN- on SNaD with others concurring to such a strategy (Park et
al., 2008; Han et al., 2013a; Han et al., 2013b). However, there is still limited information on the application
of these microorganisms on a full-scale wastewater treatment process due to the possibility of unknown
risks occurring. In a previous study conducted by Mpongwana et al. (2016), it was also indicated that SNaD
is feasible by using CN- tolerant bacteria to treat CN- containing wastewater whereby the bacteria exhibited
multiphase growth pattern phenomenon when supplied with both CN- and NH4-N; albeit, other
physiological conditions might have played a role. Generally, SNaD and CN- degradation is known to be
101
affected by physiological conditions such as pH and temperature, which must be optimal for process
performance efficiency.
Response surface methodology (RSM) has been widely used to predict and optimize cyanide degradation
and SNaD operations (Mekuto et al., 2013), with no study having compared and assessed the capability of
RSM and cybernetic models to predict the performance of SNaD under CN- conditions. CN- was chosen as
the inhibitor in the research reported herein since it possesses a high inhibition capability for nitrification
and denitrification (Inglezakis et al., 2017). This study also determined the optimum physiological
conditions of the bioreactor required to facilitate SNaD in the presence of CN- when cyanide resistant
bacteria are employed. Moreover, the cybernetic models were also developed to assess their predictive
ability of SNaD under CN- conditions in comparison to the RSM model developed.
7.2. Objectives
• Optimisation of Physico-chemical conditions that affect simultaneous nitrification and aerobic
denitrification under high cyanide conditions.
• Development of a simple cybernetic model to predict simultaneous nitrification and aerobic
denitrification under high cyanide conditions.
• Compare the predictive ability of RSM models with cybernetic models towards simultaneous
nitrification and aerobic denitrification under high cyanide conditions.
7.3. Materials and methods
The experimental design for optimization of SNaD under CN- conditions were designed using RSM
software. a 13-run experimental plan with variation in independent variables temperature and pH was
generated by RSM. A basal media mentioned in section 4.1.1 was used for this study. The isolated strain
was grown for 2 days prior to the addition of 20 mg NH4-N/L and 20 mg CN-/L. samples were collected on
a 1 h interval for analysis of CN-, NH4-N, NO2-N, and NO3-N using Merck SA test kits and Merck ANOVA
Spectroquant, all the experiments were conducted in duplicate. Multiple regression analysis was used to
analyse the data. The kinetic experiments were conducted at optimised conditions in 1L batch reactor using
the basal medium previously mentioned in section 4.1.1. The media was inoculated with 100 mL of
overnight culture and was incubated for 168 h prior addition of 42.05 mg CN-/L and 246.5 mg NH4-N/L,
2mL samples were withdrawn on a 24 h interval for analysis of NH4-N, CN-, NO2-N and NO3-N. 5 mL
sample was also collected at the beginning of the experiment to analyse the enzyme. The enzymes were
extracted according to section 4.2.3. Cybernetic models were developed in reference to Fig. 4.1 for the
prediction of SNaD.

102
7.4. Results and discussion 7.4.1. Predictive ability of Response Surface Methodology 7.4.1.1. Analysis of variance (ANOVA) for TN removal
The central composite design was used to study the interaction between the independent variables, pH and
temperature, that affect SNaD for TN removal. Table 3 shows analysis of variance (ANOVA) of the
quadratic model used to describe TN removal. The model F-value of 17.01 for TN removal was higher than
1.0, which indicated that the variation between the model and experimental data was higher.
The predicted values of the RSM were compared with the experimental values, with the p-value being
0.0009 for the model, which is smaller than the alpha level of 0.05. This meant that there was a
consequential relationship between the predicted values and the actual values of TN removal. However,
other parameters such as the deviation of the model values from the actual data points (standard deviation),
R2, adjusted R2 and predicted R2 need to be considered in order to judge the adequacy of the model – see
Table 7.1.
Table 7.1. Analysis of variance (ANOVA) of the quadratic parameters for SNaD process used for TN
removal under CN- conditions
Source Sum of Squares df Mean Square F-value p-value
Model 12482.87 5 2496.57 17.01 0.0009 significant
A-Temperature 1167.65 1 1167.65 7.96 0.0257
B-pH 631.10 1 631.10 4.30 0.0768
AB 70.78 1 70.78 0.4824 0.5097
A² 5558.29 1 5558.29 37.88 0.0005
B² 6434.58 1 6434.58 43.85 0.0003
Residual 1027.19 7 146.74
Lack of Fit 1027.19 3 342.40
Pure Error 0.0000 4 0.0000
Cor Total 13510.06 12
The quadratic model was also used to predict SNaD under CN- conditions. The significance of the
parameters was determined using values of "Prob> F" less than 0.05, thus, in this case, A, A2, and B2 were
found to be significant for the model. Therefore, the model was improved by reducing it from Eq. 29 to Eq.
30.
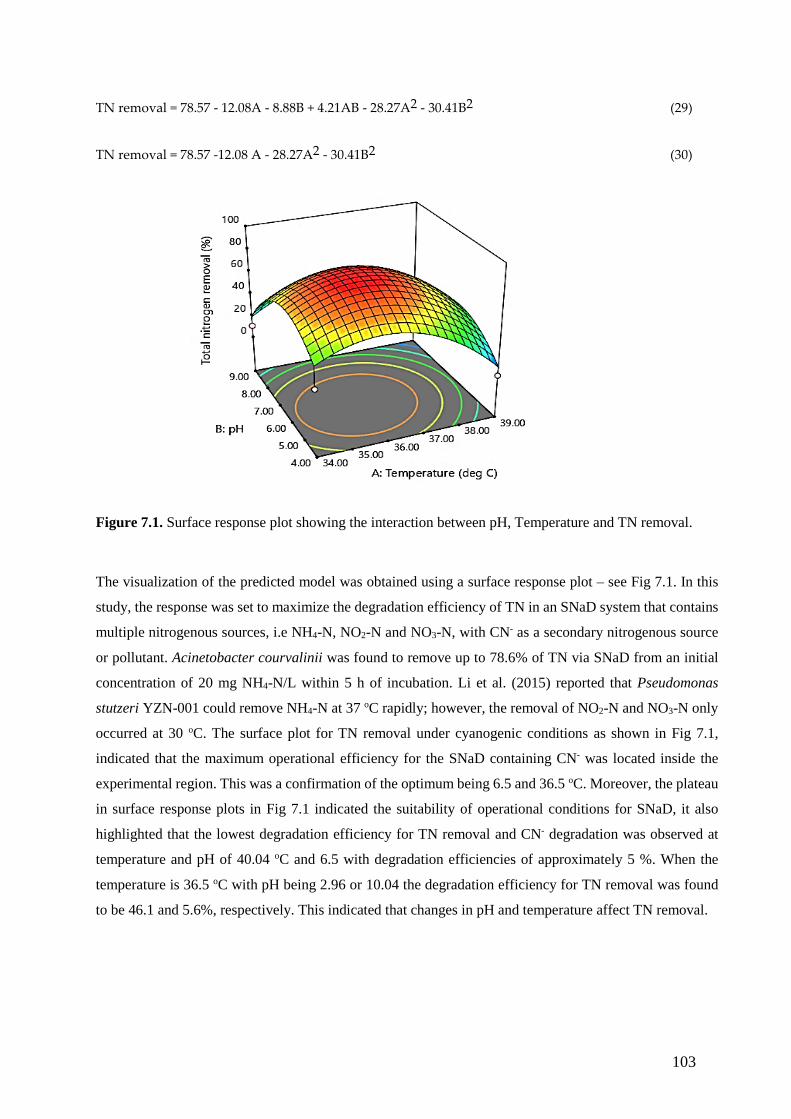
103
TN removal = 78.57 - 12.08A - 8.88B + 4.21AB - 28.27A2 - 30.41B2 (29)
TN removal = 78.57 -12.08 A - 28.27A2 - 30.41B2 (30)
Figure 7.1. Surface response plot showing the interaction between pH, Temperature and TN removal.
The visualization of the predicted model was obtained using a surface response plot – see Fig 7.1. In this
study, the response was set to maximize the degradation efficiency of TN in an SNaD system that contains
multiple nitrogenous sources, i.e NH4-N, NO2-N and NO3-N, with CN- as a secondary nitrogenous source
or pollutant. Acinetobacter courvalinii was found to remove up to 78.6% of TN via SNaD from an initial
concentration of 20 mg NH4-N/L within 5 h of incubation. Li et al. (2015) reported that Pseudomonas
stutzeri YZN-001 could remove NH4-N at 37 oC rapidly; however, the removal of NO2-N and NO3-N only
occurred at 30 oC. The surface plot for TN removal under cyanogenic conditions as shown in Fig 7.1,
indicated that the maximum operational efficiency for the SNaD containing CN- was located inside the
experimental region. This was a confirmation of the optimum being 6.5 and 36.5 oC. Moreover, the plateau
in surface response plots in Fig 7.1 indicated the suitability of operational conditions for SNaD, it also
highlighted that the lowest degradation efficiency for TN removal and CN- degradation was observed at
temperature and pH of 40.04 oC and 6.5 with degradation efficiencies of approximately 5 %. When the
temperature is 36.5 oC with pH being 2.96 or 10.04 the degradation efficiency for TN removal was found
to be 46.1 and 5.6%, respectively. This indicated that changes in pH and temperature affect TN removal.

104
7.4.1.2. Batch reactor experiment and model simulations
Figure 7.2. Degradation kinetics of TN and cyanide in a batch culture reactor. A: TN and CN- degradation
and cell concentration over time. B: model fitting into biomass plot.
To generate data for the models, removal (degradation) kinetics of TN were studied at optimized conditions
in 1L reactors. The initial (higher) concentration of 40 mg CN-/L and 250 mg NH4-N/L were used and the
experiment was conducted for 264 h. The results indicated that up to 70.5 % of TN was removed within
264 h, see Fig. 7.2A. Duan et al. (2015) reported that a nitrification efficiency of 91.82 ± 1.98 % after 42 h
by Vibrio diabolicus SF16 was achievable in a system that does not contain CN-. Furthermore, He et al.
(2015) also reported an NH4-N removal efficiency of 93.6% after 96 h of incubation with Pseudomonas
tolaasii Y-11; albeit, the utilization of pollutants by a specific species might be sequential, with the
organism utilizing the easily biodegradable pollutant with a less complex structure first, subsequent to the
degradation of the second less desirable pollutants which sometimes results in multi-phased growth of the
organism(s) used. The cell concentration was also studied and modeled (Fig. 7.2A). The data points of
predicted growth rate versus actual growth rate were scattered, with numerous outliers from the trend line
(Fig. 7.2B) which signifies that the first-order equation did not adequately represent the growth model.
Moreover, the R2 of 0.5303 was low, thus indicating poor prediction of the growth observed. Overall, the
microorganism used in this study primarily degraded TN including CN- simultaneously, which is an
interesting trait considering that CN- is a known inhibitor to nitrification, with as little as 1 mg CN-/L
completely inhibiting nitrification (Kim et al., 2008).
0
5
10
15
20
25
30
35
40
0
5000000
10000000
15000000
20000000
25000000
30000000
35000000
40000000
45000000
50000000
0
50
100
150
200
250
300
350
400
450
0 50 100 150 200 250 300
Cel
l Con
cent
ratio
n (C
ell/m
l)
TN re
mov
al (m
g/L)
Time (h)
TN CN- Cells Concentration
CN
-de
grad
atio
n (m
g/L)
y = 0,9014x - 6772,9R² = 0,5303
-50000
0
50000
100000
150000
200000
250000
300000
0 100000 200000 300000
Pred
icte
d gr
owht
rate
Actual growth rate
Model
Linear(Model)
A B

105
7.5. Prediction ability of RSM in comparison to cybernetic models
RSM Model
Cybernetic Model
Figure 7.3. A comparison of the prediction ability of RSM and cybernetic models. A: prediction of TN
removal efficiency by RSM model; B: parity plot comparing predicted total nitrogen removal efficiency
and actual total nitrogen removal efficiency by RSM; C: Rate of TN removal predicted by cybernetic model;
D: parity plot for comparing predicted rate of TN removal with actual rate of TN removal by cybernetic
model.
When comparing modeled and actual SNaD performance under optimum conditions, the correlation
coefficient (R2) of 0.92 was observed; although this high R2 was observed, R2 alone cannot verify whether
the model is adequate or not, since R2 can improve with the extension of dependent variables scale
regardless of whether the variable is significant or not. Thus the adjusted R2 (0.87) and predicted R2 (0.46)
were considered (Table 7.3). Adjusted R2 is normally used to compare the explanatory power of a regression
model, while the Adjusted R2 only account for variables that improve the model; therefore, the addition of
0
10
20
30
40
50
60
70
80
90
0 2 4 6 8 10 12 14
Tota
l nitr
ogen
rem
oval
(%)
Experimental run number
Actual Value
Predicted Valuey = 0,9722x
R² = 0,92
0
10
20
30
40
50
60
70
80
90
0 50 100
Pred
icte
d To
tal n
itrog
en ri
mov
al
effic
ieny
Actual Total nitrogen removal efficiency
Model
Linear(Model)
0
0,1
0,2
0,3
0,4
0,5
0,6
0,7
0,8
0,9
0 100 200 300
Rat
e of
tota
l nitr
ogen
rem
oval
(mg/
L/h)
Time (h)
Actual value
Predicted valuey = 0,9913x + 0,0008
R² = 0,9669
0
0,1
0,2
0,3
0,4
0,5
0,6
0,7
0,8
0,9
0 0,5 1
Pred
icte
d ra
te o
f of T
otal
nitr
ogen
re
mov
al
Actual rate of Total nitrogen removal
Model
Linear(Model)
A B
C D
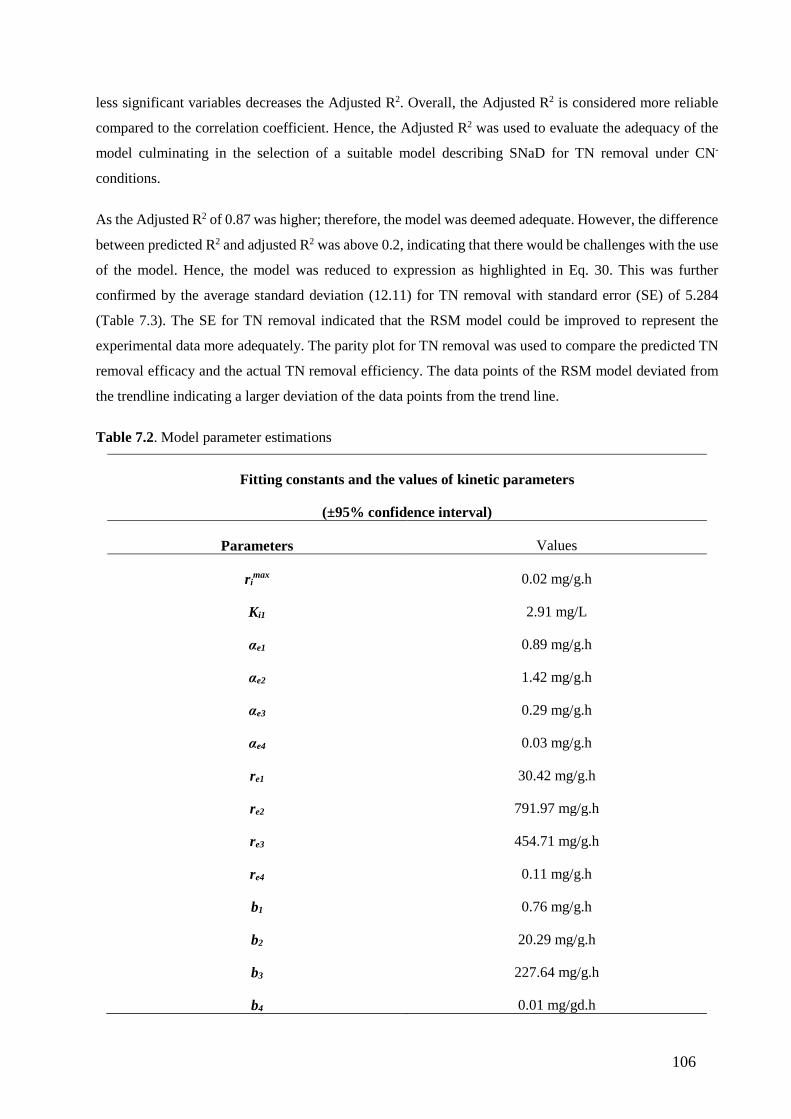
106
less significant variables decreases the Adjusted R2. Overall, the Adjusted R2 is considered more reliable
compared to the correlation coefficient. Hence, the Adjusted R2 was used to evaluate the adequacy of the
model culminating in the selection of a suitable model describing SNaD for TN removal under CN-
conditions.
As the Adjusted R2 of 0.87 was higher; therefore, the model was deemed adequate. However, the difference
between predicted R2 and adjusted R2 was above 0.2, indicating that there would be challenges with the use
of the model. Hence, the model was reduced to expression as highlighted in Eq. 30. This was further
confirmed by the average standard deviation (12.11) for TN removal with standard error (SE) of 5.284
(Table 7.3). The SE for TN removal indicated that the RSM model could be improved to represent the
experimental data more adequately. The parity plot for TN removal was used to compare the predicted TN
removal efficacy and the actual TN removal efficiency. The data points of the RSM model deviated from
the trendline indicating a larger deviation of the data points from the trend line.
Table 7.2. Model parameter estimations
Fitting constants and the values of kinetic parameters
(±95% confidence interval)
Parameters Values
rimax 0.02 mg/g.h
Ki1 2.91 mg/L
αe1 0.89 mg/g.h
αe2 1.42 mg/g.h
αe3 0.29 mg/g.h
αe4 0.03 mg/g.h
re1 30.42 mg/g.h
re2 791.97 mg/g.h
re3 454.71 mg/g.h
re4 0.11 mg/g.h
b1 0.76 mg/g.h
b2 20.29 mg/g.h
b3 227.64 mg/g.h
b4 0.01 mg/gd.h

107
𝒓𝒓𝒈𝒈 0.001 Cell/L/h
Cybernetic models were developed to predict maximum pollutant utilization rates which are presented as
S1 and S2 for TN and CN- respectively via catalysis by numerous enzymes. A cybernetic model was
simulated by estimating unknown parameters using experimental data as listed in Table 7.2. The model
successfully described the rate of TN removal with (R2 of 0.97, indicating a 97% suitability. Moreover, the
Adjusted determination coefficient (Adj R2 = 0.96) was very high with the difference between R2 and the
Adj R2 being 0.006. This difference is minute; therefore, it advocated for the high significance of the model.
Furthermore, the variance (0.002), standard error (0.0035) and standard deviation (0.012) for TN removal
were low, demonstrating that there’s an insignificant difference between the predicted values from the
model and the actual experimental values. Although the RSM model was shown to adequately represent
TN removal, the adjusted R2 of the cybernetic model was higher than that of the RSM model. Thus,
cybernetic models were selected as the best model to predict TN removal using SNaD. Furthermore, the
parity plot for RSM and the cybernetic model were compared. The parity plot of cybernetic model had data
points scattered closer to the trend line as opposed to RSM model which numerous outliers showing a
significant deviation from the trend line (Fig, 7.3B, and D), supporting the statement that cybernetic model
better predicted TN removal better in CN- using SNaD.
Table 7.3. Statistical analysis of RSM and cybernetic models for SNaD under CN- conditions
Model Std Dev SE Mean
R-squared Adjusted R-squared
Predicted R2
RSM 12.11 5.284 0.9240 0.8697 0.46
Cybernetic 0.012391
0.0035 0.966119
0.962731
-
Two-sided Confidence = 95% Population = 99%
7.6. TN/ CN- biocatalysis
02468
1012
0 2 4 6
NH
4-N
/CN
-co
ncen
tratio
n (m
g/L)
Time (min)
NH4-N
CN-
A00,10,20,30,40,50,60,7
012345
0 2 4 6 NO
3-N
con
cent
ratio
n (m
g/L)
NO
2-N
con
cent
ratio
n (m
g/L)
Time (min)
NO3-N
NO2-N
B
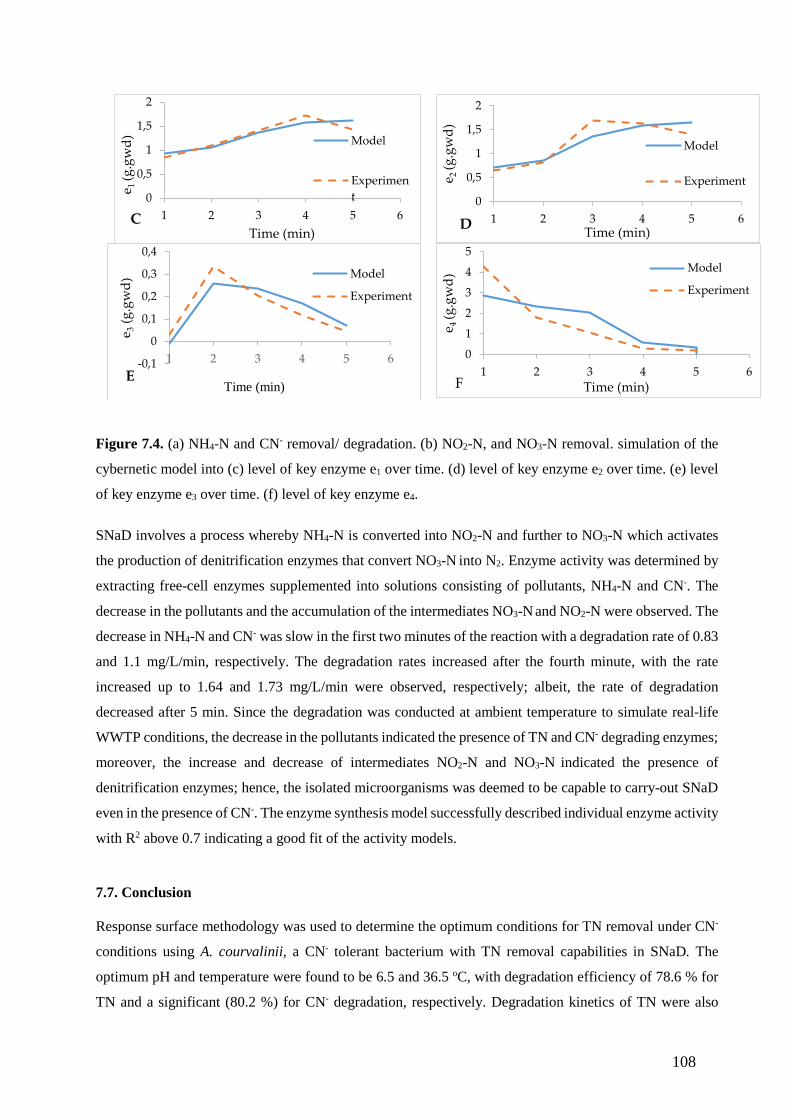
108
Figure 7.4. (a) NH4-N and CN- removal/ degradation. (b) NO2-N, and NO3-N removal. simulation of the
cybernetic model into (c) level of key enzyme e1 over time. (d) level of key enzyme e2 over time. (e) level
of key enzyme e3 over time. (f) level of key enzyme e4.
SNaD involves a process whereby NH4-N is converted into NO2-N and further to NO3-N which activates
the production of denitrification enzymes that convert NO3-N into N2. Enzyme activity was determined by
extracting free-cell enzymes supplemented into solutions consisting of pollutants, NH4-N and CN-. The
decrease in the pollutants and the accumulation of the intermediates NO3-N and NO2-N were observed. The
decrease in NH4-N and CN- was slow in the first two minutes of the reaction with a degradation rate of 0.83
and 1.1 mg/L/min, respectively. The degradation rates increased after the fourth minute, with the rate
increased up to 1.64 and 1.73 mg/L/min were observed, respectively; albeit, the rate of degradation
decreased after 5 min. Since the degradation was conducted at ambient temperature to simulate real-life
WWTP conditions, the decrease in the pollutants indicated the presence of TN and CN- degrading enzymes;
moreover, the increase and decrease of intermediates NO2-N and NO3-N indicated the presence of
denitrification enzymes; hence, the isolated microorganisms was deemed to be capable to carry-out SNaD
even in the presence of CN-. The enzyme synthesis model successfully described individual enzyme activity
with R2 above 0.7 indicating a good fit of the activity models.
7.7. Conclusion
Response surface methodology was used to determine the optimum conditions for TN removal under CN-
conditions using A. courvalinii, a CN- tolerant bacterium with TN removal capabilities in SNaD. The
optimum pH and temperature were found to be 6.5 and 36.5 oC, with degradation efficiency of 78.6 % for
TN and a significant (80.2 %) for CN- degradation, respectively. Degradation kinetics of TN were also
0
0,5
1
1,5
2
1 2 3 4 5 6
e 1 (g
.gw
d)
Time (min)
Model
Experiment
C0
0,5
1
1,5
2
1 2 3 4 5 6
e 2 (g
.gw
d)
Time (min)
Model
Experiment
D
-0,1
0
0,1
0,2
0,3
0,4
1 2 3 4 5 6
e 3(g
.gw
d)
Time (min)
Model
Experiment
E0
1
2
3
4
5
1 2 3 4 5 6
e 4 (g
.gw
d)
Time (min)
Model
Experiment
F
109
studied in a batch reactor under the optimum conditions with the results obtained indicating that TN was
degraded simultaneously with CN- at an efficiency of 70.5 % and 97.3 %, respectively. Moreover,
cybernetic modeling was found to be better at predicting SNaD under cyanogenic conditions with a higher
adjusted R2 (0.96) as opposed to the RSM models with an adjusted R2 of 0.87. The cybernetic models used
in this study were simplified models; thus they do not provide illuminating insights into cellular responses.
Hence, additional experiments are needed to elucidate metabolic flux distributions better and to further
develop models for SNaD process prediction as well as optimisation.

110
CHAPTER 8
SUMMARY AND CONCLUSIONS

111
CHAPTER 8:
SUMMARY AND CONCLUSION
8.1 Summary and Conclusions
Treatment of TN has become the core of WWTP(s) since wastewater containing high quantities of TN
results in eutrophication. Treatment approaches for TN removal involve chemical, physical and biological
treatment technologies, with biological treatment being an ideal method due to its cost-effectiveness.
Traditional biological treatment of TN involves a two-stage process known as aerobic nitrification
subsequent to anoxic denitrification. However, due to high energy consumption resulting from the operation
of multiple reactors, various studies have proven the probability of some microorganisms to perform
denitrification under aerobic conditions. This has led to the proposition to conduct nitrification and
denitrification in a single reactor, giving birth to a process currently known as SNaD. This process is crucial
in the WWTP since it is cost-effective and more sustainable compared to the two-stage aerobic nitrification
subsequent to anoxic denitrification. Due to the significance of this process in WWTP, SNaD has drawn
attention to the scientific world over the past few years.
Thus, a number of studies have been conducted, aiming to improve this process and make it more
sustainable, despite all the improvements which have been done on SNaD, this process still encounters
some challenges that make it difficult to implement under certain conditions such as the presence of high
quantities of other toxic pollutants. Inhibition of SNaD by other pollutants present in the WWTP is one of
the major challenges that hinder the application of the SNaD especially in industrial WWTP which contains
highly toxic chemicals such as ammonium sulfate, SCN, CN-. These pollutants can be lethal to the microbial
population responsible for SNaD. CN- is counted among the most toxic compounds towards SNaD, with as
little as 1 mg/L of CN- known to completely inhibit SNaD. This has led to the application of chemical and
physical pre-treatment methods to treat wastewater containing CN- prior to SNaD; however, these methods
are costly and complicated to operate.
Biological CN- removal has been used as an ideal pre-treatment alternative to detoxify treat CN- prior
wastewater enters SNaD reactor. Although the biological CN- removal has been deemed the best technique
for the treatment of CN-, the operation of the pretreatment reactor may result in accumulation of operational
cost. Hence, some studies have suggested the application of CN- degrading microorganism for SNaD,
although the application of CN- degrading bacteria have been proven to be possible, the cyanide resistant/
tolerant microorganisms have not yet been applied for SNaD in large-scale wastewater operations due to
limited information that is crucial in controlling of the SNaD performed by CN- degrading/ tolerant
microorganisms. Thus, the aim of this study was to investigate a modeling approach suitable to describe
SNaD under CN- conditions since modeling plays an important role in accurate facilitation of SNaD

112
process. Thermodynamic kinetics of SNaD under high CN- loadings were initially investigated to assess
the feasibility of SNaD process performed by cyanide resistant/ degrading mix consortium that was isolated
from cyanogenic environments.
The results obtained indicated that CN- did not affect the performance of a mix consortiums’ nitrification
abilities. The consortia were shown to degrade CN- and sufficiently remove NH4-N and CN- respectively.
A linear relationship was found to exist between nitrification rates and their respective Gibbs free energy
with negative Gibbs free energy observed. This confirmed the feasibility of TN removal under high CN-
conditions. For a proof of concept, from the mix consortia, a single strain was also isolated and was
identified as Acinetobacter courvalinii (accession number AB602910.1). The strain was capable of
degrading CN- and subsequent removal of TN under cyanogenic environments. Furthermore, five
mathematical models (Monod, Moser, rate law, Haldane, and Andrew’s model) were assessed for their
ability to predict SNaD under CN- conditions; albeit, only the Rate law, Haldane, and Andrew models
successfully predicted SNaD under CN- conditions.
Moreover, the rate law and Haldane models were also shown to predict CN- degradation. Overall, the
Haldane model was selected as a better predictor of systems with multiple nitrogenous sources due to low
variance and standard deviation, which indicated an insignificant deviation of the predicted data from the
experimental data for both NH2-N and CN- degradation. Initially, the degradation rates of NH4-N and CN-
by A. courvalinii were low; hence, physiological parameters optimization using RSM. Under optimum
conditions for TN removal and CN- degradation the predictive ability of the RSM model generated was
compared with the cybernetic models, with a cybernetic model being selected as the better predictor for TN
removal in SNaD-CN- systems; although both RSM and cybernetic models were found to adequately
represented TN removal. These results exhibited a promising clarification of the SNaD process under CN-
conditions and provide a solution in the control, management SNaD even under CN- conditions.
8.2 Recommendations for future work
From a consortium able to perform SNaD, a cyanide degrading microorganism capable of degrading CN-
and perform SNaD simultaneously was successfully isolated. This demonstrated that even at an individual
species level, SNaD could be performed even under CN-. The physio-chemical conditions were studied to
optimize CN- degradation and SNaD; moreover, the predictive ability of RSM and cybernetic models was
also studied. Although cybernetic models developed were successfully used to describe SNaD under high
cyanogenic conditions; the metabolic network used to develop the cybernetic models was a simplified
network. It is recommended that a more detailed metabolic network for SNaD under CN- conditions be
constructed for the development of a more robust model which will describe the SNaD even when a
consortium is used for such a system. This model can provide an illuminating insight into cellular response
113
for SNaD. Additional experiments are also needed to be conducted to better understand the metabolic flux
distribution in SNaD-CN- and SNaD-toxicant systems.

114
CHAPTER 9
REFERENCES

115
CHAPTER 9:
REFERENCES Akinpelu, E. A., Ntwampe, S. K. O., Mpongwana, N., Nchu, F., and Ojumu, T. V. 2016.
Biodegradation kinetics of free cyanide in Fusarium oxysporum-Beta vulgaris waste-metal (As, Cu,
Fe, Pb, Zn) cultures under alkaline conditions. BioResources. 11: 2470-2482
Ali, M. & Okabe, S. 2015. Anammox-based technologies for nitrogen removal: Advances in process
start-up and remaining issues. Chemosphere, 141: 144–153.
Alzate Marin, J., Caravelli, A. & Zaritzky, N. 2016. Nitrification and aerobic denitrification in
anoxic–aerobic sequencing batch reactor. Bioresour Technol, 200: 380-387.
Andersson, S., Dalhammar, G. & Rajarao, G.K. 2011. Influence of microbial interactions and
EPS/polysaccharide composition on nutrient removal activity in biofilms formed by strains found in
wastewater treatment systems. Microbiol. Res, 166: 449-457
Angenent, L.T., Karim, K., Al-Dahhan, M.H., Wrenn, B.A. & Domíguez-Espinosa, R. 2004.
Production of bioenergy and biochemicals from industrial and agricultural wastewater. Trends
Biotechnol, 22: 477-485.
Annuar, M.S.M., Tan, I.K.P., Ibrahim, S. & Ramachandran, K.B. 2008. A kinetic model for growth
and biosynthesis of medium-chain-length poly-(3-hydroxyalkanoates) in Pseudomonas putida. Braz
J Chem Eng, 25: 217-228
Ao, P. 2005. Metabolic network modelling: Including stochastic effects. Comput chem eng, 29: 2297-
2303.
Arai, H., Kodama, T. & Igarashi, Y. 1997. Cascade regulation of the two CRP/FNR‐related
transcriptional regulators (ANR and DNR) and the denitrification enzymes in Pseudomonas
aeruginosa. Mol. Microbiol, 25: 1141-1148.
Aslan, S. & Sozudogru, O. 2017. Individual and combined effects of nickel and copper on nitrification
organisms. Ecol. Eng, 99: 126–133.
Aybar, M., Pizarro, G., Boltz, J.P., Downing, L. & Nerenberg, R. 2014. Energy-efficient wastewater
treatment via the air-based, hybrid membrane biofilm reactor (hybrid MfBR). Water Sci. Technol.,
69: 1735–1741.

116
Banning, N.C., Maccarone, L.D., Fisk, L.M. & Murphy, D.V. 2015. Ammonia-oxidising bacteria not
archaea dominate nitrification activity in semi-arid agricultural soil. Sci. Rep, 5: 11146.
Basheer, S., Kut, Ö., Prenosil, J. & Bourne, J. 1992. Kinetics of enzymatic degradation of cyanide.
Biotechnol. Bioeng, 39: 629–634.
Biggs, M.B., Medlock, G.L., Kolling, G.L. & Papin, J.A. 2015. Metabolic network modelling of
microbial communities. WIRES Syst Biol Med, 7: 317-334
Blackall, L.L., Crocetti, G.R., Saunders, A.M. & Bond, P.L. 2002. A review and update of the
microbiology of enhanced biological phosphorus removal in wastewater treatment plants. Anton
Leeuw Int J G, 81: 681-691.
Boyle, N.R. & Morgan, J.A. 2009. Flux balance analysis of primary metabolism in Chlamydomonas
reinhardtii. BMC Syst. Biol, 3: 4.
Carrera, J., Baeza, J., Vicent, T. & Lafuente, J. 2003. Biological nitrogen removal of high-strength
ammonium industrial wastewater with two-sludge system. Water Res, 37: 4211-4221.
Chen, C., Kao, C. & Chen, S. 2008. Application of Klebsiella oxytoca immobilized cells on the
treatment of cyanide wastewater. Chemosphere, 71: 133–139.
Chen, H., Liu, S., Yang, F., Xue, Y. & Wang, T. 2009. The development of simultaneous partial
nitrification, ANAMMOX and denitrification (SNAD) process in a single reactor for nitrogen
removal. Bioresour. Technol, 100: 1548–1554.
Chen, P., Li, J., Li, Q. X., Wang, Y., Li, S., Ren, T. & Wang, L. 2012. Simultaneous heterotrophic
nitrification and aerobic denitrification by bacterium Rhodococcus sp. CPZ24. Bioresour Technol,
116: 266-270.
Chen, Z., Wang, X., Chen, X., Chen, J., Feng, X. & Peng, X. 2018. Nitrogen removal via nitritation
pathway for low-strength ammonium wastewater by adsorption, biological desorption and
denitrification. Bioresour. Technol, 267: 541-549.
Choi, O.K.& Hu, Z.Q. 2009. Nitrification inhibition by silver nanoparticles. Water Sci Technol, 59:
1699-1702.
Chowdhury, Z., Zain, S & Rashid, A. 2011. Equilibrium Isotherm Modeling, Kinetics and
Thermodynamics Study for Removal of Lead from Waste Water. E- J. Chem, 8: 333-339

117
Clough, T.J., Lanigan, G.J., de Klein, C.A., Samad, M.S., Morales, S.E., Rex, D., Bakken, L.R.,
Johns, C., Condron, L.M. & Grant, J. 2017. Influence of soil moisture on codenitrification fluxes from
a urea-affected pasture soil. Sci. Rep, 7: 2185.
Conway, T. 1992. The Entner-Doudoroff pathway: history, physiology and molecular biology. FEMS
Microbiol Rev, 9: 1-27.
Cui, J., Wang, X., Yuan, Y., Guo, X., Gu, X. & Jian, L. 2014. Combined ozone oxidation and
biological aerated filter processes for treatment of cyanide containing electroplating wastewater.
Chem. Eng, 241: 184–189.
Daims, H., Lebedeva, E., Pjevac, P., Han, P., Herbold, C., Albertsen, M., Jehmlich, N., Palatinszky,
M., Vierheilig, J., Bulaev, A., Kirkegaard, R., von Bergen, M., Rattei, T., Bendinger, B., Nielsen, P.
& Wagner, M. 2015. Complete nitrification by Nitrospira bacteria. Nature, 528: 504-509.
Daverey, A., Chen, Y.C., Dutta, K., Huang, Y.T. & Lin, J.G. 2015. Start-up of simultaneous partial
nitrification, anammox and denitrification (SNAD) process in sequencing batch biofilm reactor using
novel biomass carriers. Bioresour. Technol, 190: 480–486.
De Sanctis, D., Ascenzi, P., Bocedi, A., Dewilde, S., Burmester, T., Hankeln, T., Moens, L. &
Bolognesi, M. 2006. Cyanide binding and heme cavity conformational transitions in Drosophila
melanogaster hexacoordinate hemoglobin. Biochemistry, 45: 10054–10061.
Duan, J., Fang, H., Su, B., Chen, J. & Lin, J. 2015. Characterization of halophilic heterotrophic
nitrification–aerobic denitrification bacterium and its application on the treatment of saline
wastewater. Bioresour. Technol, 179: 421–428.
Dwivedi, N., Balomajumder, C. & Mondal, P. 2016. Comparative evaluation of cyanide removal by
adsorption, biodegradation, and simultaneous adsorption and biodegradation (SAB) process using
Bacillus cereus and almond shell. J. Environ. Biol, 37: 551.
Ebeling, J.M., Timmons, M.B. & Bisogni, J.J. 2006, Engineering analysis of the stoichiometry of
photoautotrophic, autotrophic, and heterotrophic removal of ammonia–nitrogen in aquaculture
systems. Aquaculture, 257: 346-358.
Edwards, J.S., Covert, M. & Palsson, B. 2002. Metabolic modelling of microbes: The flux-balance
approach. Environ. Microbiol, 4: 133–140.
Eliasson, J. 2015. The rising pressure of global water shortages. Nature News, 517: 6.
118
Feng, C., Huang, L., Yu, H., Yi, X. & Wei, C. 2015. Simultaneous phenol removal, nitrification and
denitrification using microbial fuel cell technology. Water Res, 76: 160-170.
Gao, D., Peng, Y. & Wu, W.M. 2010. Kinetic model for biological nitrogen removal using shortcut
nitrification-denitrification process in sequencing batch reactor. Environ. Sci. Technol, 44: 5015-
5021.
Ge, Q., Yue, X. & Wang, G. 2015a. Simultaneous heterotrophic nitrification and aerobic
denitrification at high initial phenol concentration by isolated bacterium Diaphorobacter sp. PD-7.
Chin. J. Chem. Eng, 23: 835-841.
Ge, S., Wang, S., Yang, X., Qiu, S., Li, B. & Peng, Y. 2015b. Detection of nitrifiers and evaluation
of partial nitrification for wastewater treatment: A review. Chemosphere, 140: 85–98.
Geissen, V., Mol, H., Klumpp, E., Umlauf, G., Nadal, M., van der Ploeg, M., van de Zee, S.E. &
Ritsema, C.J. 2015. Emerging pollutants in the environment: a challenge for water resource
management. ISWCR, 3: 57-65.
Gernaey, K.V., van Loosdrecht, M.C., Henze, M., Lind, M. & Jørgensen, S.B. 2004. Activated sludge
wastewater treatment plant modelling and simulation: state of the art. Environ Modell Softw, 19: 763-
783.
Gunatilake, S.K. 2015. Methods of removing heavy metals from industrial wastewater. Methods, 1:
14.
Gupta, N., Balomajumder, C. & Agarwal, V. 2010. Enzymatic mechanism and biochemistry for
cyanide degradation: A review. J. Hazard. Mater, 176: 1–13.
Hamed, M.M., Khalafallah, M.G. & Hassanien, 2004. E.A. Prediction of wastewater treatment plant
performance using artificial neural networks. Environ Modell Softw, 19: 919-928.
Han, Y., Jin, X., Wang, F., Liu, Y. & Chen, X. 2013a. Successful startup of a full-scale acrylonitrile
wastewater biological treatment plant (ACN-WWTP) by eliminating the inhibitory effects of toxic
compounds on nitrification. Water Sci. Technol, 69: 553–559.
Han, Y., Jin, X., Wang, Y., Liu, Y & Chen, X. 2013b. Inhibitory effect of cyanide on nitrification
process and its eliminating method in a suspended activated sludge process. Environ sci pollut r, 21:
2706-2713

119
Han, Y., Jin, X., Wang, Y., Liu, Y. & Chen, X. 2014. Inhibitory effect of cyanide on nitrification
process and its eliminating method in a suspended activated sludge process. Environ. Sci. Pollut. Res,
21: 2706–2713.
He, Q., Zhang, W., Zhang, S. & Wang, H. 2017. Enhanced nitrogen removal in an aerobic granular
sequencing batch reactor performing simultaneous nitrification, endogenous denitrification and
phosphorus removal with low superficial gas velocity. Chem. Eng. J, 326: 1223–1231.
He, T., Li, Z., Sun, Q., Xu, Y. & Ye, Q. 2016. Heterotrophic nitrification and aerobic denitrification
by Pseudomonas tolaasii Y-11 without nitrite accumulation during nitrogen conversion. Bioresour
Technol, 200: 493-499.
Hu, M. Wang, X., Wen, X. & Xia, Y. 2012. Microbial community structures in different wastewater
treatment plants as revealed by 454-pyrosequencing analysis. Bioresour. Technol, 117: 72-79.
Huang, X., Urata, K., Wei, Q., Yamashita, Y., Hama, T. & Kawagoshi, Y. 2016. Fast start-up of
partial nitritation as pre-treatment for anammox in membrane bioreactor. Biochem. Eng. J, 105: 371–
378.
Inglezakis, V., Malamis, S., Omirkhan, A., Nauruzbayeva, J., Makhtayeva, Z., Seidakhmetov, T. &
Kudarova, A. 2017. Investigating the inhibitory effect of cyanide, phenol and 4-nitrophenol on the
activated sludge process employed for the treatment of petroleum wastewater. J Environ Manage,
203: 825-830.
Itoba-Tombo, E.F. 2019. Spatial and temporal distribution of pollutants from different land use/land-
cover types of the bottelary river catchment. In New Horizon in wastewater Management Emerging
Monitoring and Remediation Strategies, Fosso-Kankeu, E., Ed., Nova Science Publishers: New York,
NY, USA, Volume 3: 65–86.
Ji, B., Yang, K., Zhu, L., Jiang, Y., Wang, H., Zhou, J. & Zhang, H. 2015. Aerobic denitrification: A
review of important advances of the last 30 years. Biotechnol. Bioproc. Eng, 20: 643–651.
Jin, R., Liu, T., Liu, G., Zhou, J., Huang, J & Wang, A. 2014. Simultaneous Heterotrophic
Nitrification and Aerobic Denitrification by the Marine Origin Bacterium Pseudomonas sp. ADN-42.
Applied Biochemistry and Biotechnology, 175: 2000-2011
120
Kandasamy, S., Dananjeyan, B., Krishnamurthy, K. & Benckiser, G. 2015. Aerobic cyanide
degradation by bacterial isolates from cassava factory wastewater. Braz. J. Microbiol, 46: 659-666.
Kanyenda, G., Ntwampe, S.K.O., Mpongwana, N., Godongwana, B. 2018. Mathematical Exposition
of Simultaneous Nitrification and Aerobic Denitrification. In Proceedings of the 10th lnt’I Conference
on Advances in Science, Engineering, Technology & Healthcare {ASETH-18), Cape Town, South
Africa, 19–20 November, pp. 242–245, ISBN 978-81-938365-2-1. Available online:
https://doi.org/10.17758/EARES4.EAP1118258 (28 October 2019).
Kao, C.M., Liu, J.K., Lou, H.R., Lin, C.S. & Chen, S.C. 2003. Biotransformation of cyanide to
methane and ammonia by Klebsiella oxytoca. Chemosphere, 50: 1055–1061.
Kapoor, V., Elk, M., Li, X. & Santo Domingo, J.W. 2016. Inhibitory effect of cyanide on wastewater
nitrification determined using SOUR and RNA‐based gene‐specific assays. Lett Appl Microbiol, 63:
155-161.
Kapoor, V., Elk, M;Li, X & Santo Domingo, J. 2016. Inhibitory effect of cyanide on wastewater
nitrification determined using SOUR and RNA-based gene-specific assays. Lett Appl Microbiol, 63:
155-161
Kapoor, V., Li, X., Elk, M., Chandran, K., Impellitteri, C. & Santo Domingo, J. 2015. Impact of
Heavy Metals on Transcriptional and Physiological Activity of Nitrifying Bacteria. Environ Sci
Technol, 49: 13454-13462.
Kauffman, K.J., Prakash, P. & Edwards, J.S. 2003. Advances in flux balance analysis. Curr Opin
Biotechnol, 14: 491-496.
Khamar, Z., Makhdoumi-Kakhki, A. & Mahmudy Gharaie, M. 2015. Remediation of cyanide from
the gold mine tailing pond by a novel bacterial co-culture. Int. Biodeterior. Biodegrad, 99: 123–128.
Khardenavis, A., Kapley, A. & Purohit, H. 2007. Simultaneous nitrification and denitrification by
diverse Diaphorobacter sp. Appl. Microbiol. Biotechnol, 77: 403–409.
Khataee, A., Vafaei, F & Jannatkhah, M. 2013. Biosorption of three textile dyes from contaminated
water by filamentous green algal Spirogyra sp.: Kinetic, isotherm and thermodynamic studies. Int
Biodeterior Biodegradation, 83: 33-40
Kim, D., Ryu, H., Kim, M., Kim, J. & Lee, S. 2007. Enhancing struvite precipitation potential for
ammonia nitrogen removal in municipal landfill leachate. J. Hazard. Mater, 146: 81–85.
121
Kim, Y., Cho, H., Lee, D., Park, D. & Park, J. 2011a. Comparative study of free cyanide inhibition
on nitrification and denitrification in batch and continuous flow systems. Desalination, 279: 439-444.
Kim, Y., Lee, D., Park, C., Park, D. & Park, J. 2011b. Effects of free cyanide on microbial
communities and biological carbon and nitrogen removal performance in the industrial activated
sludge process. Water Res, 45: 1267-1279.
Kim, Y., Park, D., Lee, D & Park, J. 2008. Inhibitory effects of toxic compounds on nitrification
process for cokes wastewater treatment. J Hazard Mater, 152: 915-921
Kim, Y., Park, D., Lee, D. & Park, J. 2007. Instability of biological nitrogen removal in a cokes
wastewater treatment facility during summer. J Hazard Mater, 141: 27-32.
Kim, Y., Park, H., Cho, K. & Park, J. 2013. Long term assessment of factors affecting nitrifying
bacteria communities and N-removal in a full-scale biological process treating high strength
hazardous wastewater. Bioresour. Technol, 134: 180–189.
Koch, G., Egli, K., Van der Meer, J.R. & Siegrist, H. 2000. Mathematical modeling of autotrophic
denitrification in a nitrifying biofilm of a rotating biological contactor. Water Sci. Technol, 41: 191–
198.
Kompala, D.S., Ramkrishna, D. & Tsao, G.T. 1984. Cybernetic modeling of microbial growth on
multiple substrates. Biotechnol Bioeng, 26: 1272-1281.
Kushwaha, J., Srivastava, V. & Mall, I. 2010. Treatment of dairy wastewater by commercial activated
carbon and bagasse fly ash: Parametric, kinetic and equilibrium modelling, disposal studies.
Bioresour. Technol, 101: 3474-3483.
Lambert, J. L., Ramasamy, J. & Paukstelis, J. V. 1975. Stable reagents for the colorimetric
determination of cyanide by modified Koenig reactions. Anal Chem, 47: 916-918.
Le, P.P., Bahl, A. & Ungar, L.H. 2004. Using prior knowledge to improve genetic network
reconstruction from microarray data. In silico biology, 4: 335-353.
Levy-Booth, D., Prescott, C. & Grayston, S. 2014. Microbial functional genes involved in nitrogen
fixation, nitrification and denitrification in forest ecosystems. Soil Biol. Biochem, 75: 11–25.
Li, C., Yang, J., Wang, X., Wang, E., Li, B., He, R. & Yuan, H. 2015a. Removal of nitrogen by
heterotrophic nitrification–aerobic denitrification of a phosphate accumulating bacterium
Pseudomonas stutzeri YG-24. Bioresour Technol, 182: 18-25.
122
Li, G., Puyol, D., Carvajal-Arroyo, J., Sierra-Alvarez, R. & Field, J. 2014. Inhibition of anaerobic
ammonium oxidation by heavy metals. J Chem Technol Biotechnol, 90: 830-837.
Li, G., Puyol, D., Carvajal-Arroyo, J.M., Sierra-Alvarez, R. & Field, J.A. 2015b. Inhibition of
anaerobic ammonium oxidation by heavy metals. J. Chem. Technol. Biotechnol, 90: 830–837.
Li, Q., Lu, H., Yin, Y., Qin, Y., Tang, A., Liu, H. & Liu, Y. 2019. Synergic effect of adsorption and
biodegradation enhance cyanide removal by immobilized Alcaligenes sp. strain DN25. J. Hazard.
Mater, 364: 367-375.
Lin, J., Meng, Y., Shi, Y. & Lin, X. 2019. Complete Genome Sequences of Colwellia sp. Arc7-635,
a Denitrifying Bacterium Isolated from Arctic Seawater. Curr. Microbiol,76: 1–5.
Liu, G. & Wang, J. 2012. Probing the stoichiometry of the nitrification process using the respirometric
approach. Water Res, 46: 5954-5962
Liu, Y., Ai, G.M., Miao, L.L. & Liu, Z.P. 2016. Marinobacter strain NNA5, a newly isolated and
highly efficient aerobic denitrifier with zero N2O emission. Bioresour. Technol, 206: 9–15.
Lochmatter, S. & Holliger, C. 2014. Optimization of operation conditions for the startup of aerobic
granular sludge reactors biologically removing carbon, nitrogen, and phosphorous. Water Res, 59:
58–70.
Low, E.W. & Chase, H.A. 1999. Reducing production of excess biomass during wastewater
treatment. Water Res, 33: 1119-1132.
Luque-Almagro, V.M., Blasco, R., Martínez-Luque, M., Moreno-Vivián, C., Castillo, F. & Roldán,
M.D. 2011. Bacterial cyanide degradation is under review: Pseudomonas pseudoalcaligenes
CECT5344, a case of an alkaliphilic cyanotroph. Biochem. Soc. Trans, 39: 269–274.
Luque-Almagro, V.M., Cabello, P., Sáez, L.P., Olaya-Abril, A., Moreno-Vivián, C. & Roldán, M.D.
2018. Exploring anaerobic environments for cyanide and cyano-derivatives microbial degradation.
Appl. Microbiol. Biotechnol, 102: 1067–1074.
Luque-Almagro, V.M., Moreno-Vivián, C. & Roldán, M.D. 2016. Biodegradation of cyanide wastes
from mining and jewellery industries. Curr. Opin. Biotechnol, 38: 9–13.
Lüttge, A. 2006. Crystal dissolution kinetics and Gibbs free energy. J Electron Spectros Relat
Phenomena , 150: 248-259
Lyu, S., Chen, W., Zhang, W., Fan, Y. & Jiao, W. 2016. Wastewater reclamation and reuse in China:
opportunities and challenges. J Environ Sci, 39: 86-96.

123
Ma, Q., Qu, Y., Shen, W., Zhang, Z., Wang, J., Liu, Z., Li, D., Li, H. & Zhou, J. 2015. Bacterial
community compositions of coking wastewater treatment plants in steel industry revealed by Illumina
high-throughput sequencing. Bioresour Technol, 179: 436-443
Ma, W., Han, Y., Ma, W., Han, H., Zhu, H., Xu, C., Li, K. & Wang, D. 2017. Enhanced nitrogen
removal from coal gasification wastewater by simultaneous nitrification and denitrification (SND) in
an oxygen-limited aeration sequencing batch biofilm reactor. Bioresour. Technol, 244: 84–91.
Mahadevan, R., Edwards, J.S. & Doyle III, F.J. 2002. Dynamic flux balance analysis of diauxic
growth in Escherichia coli. Biophys. J, 83: 1331-1340.
Mahvi, A.H. 2008. Sequencing batch reactor: A promising technology in wastewater treatment. J.
Environ. Health Sci, 5: 79–90.
Mandli, A.R., Venkatesh, K.V. & Modak, J.M. 2015. Constraints based analysis of extended
cybernetic models. Biosystems, 137: 45-54.
McLellan, S.L., Huse, S.M., Mueller‐Spitz, S.R., Andreishcheva, E.N. & Sogin, M.L. 2010. Diversity
and population structure of sewage‐derived microorganisms in wastewater treatment plant influent.
Environ. Microbiol, 12: 378-392.
Medhi, K., Singhal, A., Chauhan, D. and Thakur, I. 2017. Investigating the nitrification and
denitrification kinetics under aerobic and anaerobic conditions by Paracoccus denitrificans ISTOD1.
Bioresour Technol, 242: 334-343.
Mekuto, L., Jackson, V.A. & Ntwampe, S.K. 2013. Biodegradation of free cyanide using Bacillus sp.
consortium dominated by Bacillus safensis, Lichenformis and Tequilensis strains: A bioprocess
supported solely with whey. J. Bioremediat. Biodegrad, 2–7, doi:10.4172/2155-6199.S18-004.
Mekuto, L., Kim, Y.M., Ntwampe, S.K., Mewa-Ngongang, M., Mudumbi, N., Baptist, J.,
Dlangamandla, N., Itoba-Tombo, E.F. & Akinpelu, E.A. 2018. Heterotrophic nitrification-aerobic
denitrification potential of cyanide and thiocyanate degrading microbial communities under
cyanogenic conditions. Environ. Eng. Sci, 24: 254–262.
Mekuto, L., Ntwampe, S.K.O. & Jackson, V.A. 2015. Biodegradation of free cyanide and subsequent
utilisation of biodegradation by-products by Bacillus consortia: Optimisation using response surface
methodology. Environ. Sci. Pollut. Res. Int, 22: 10434–10443.
Mirbagheri, S., Poshtegal, M & Parisai, M. 2010. Removing of urea and ammonia from petrochemical
industries with the objective of reuse, in a pilot scale: Surveying of the methods of waste water
treatment. Desalination, 256: 70-76
124
Monod J. 1942. The growth of bacterial cultures. Annu Rev Microbiol, 3: 371–394
Mpongwana, N., Ntwampe, S., Mekuto, L., Akinpelu, E., Dyantyi, S & Mpentshu, Y. 2016. Isolation
of high-salinity-tolerant bacterial strains, Enterobacter sp., Serratia sp., Yersinia sp., for nitrification
and aerobic denitrification under cyanogenic conditions. Water Sci Technol, 73: 2168-75
Mpongwana, N., Ntwampe, S.K.O., Omodanisi, E.I., Chidi, B.S. & Razanamahandry. L.C. 2019.
Sustainable Approach to Eradicate the Inhibitory Effect of Free-Cyanide on Simultaneous
Nitrification and Aerobic Denitrification during Wastewater Treatment. Sustainability, 11: 6180
Murugesan, T., Durairaj, N., Ramasamy, M., Jayaraman, K., Palaniswamy, M. & Jayaraman, A. 2018.
Analeptic agent from microbes upon cyanide degradation. Appl. Microbiol. Biotechnol, 102: 1557–
1565.
Narang, A. & Pilyugin, S. 2007. Bacterial gene regulation in diauxic and non-diauxic growth. J.
Theor. Biol, 244: 326-348.
Narang, A., Konopka, A. & Ramkrishna, D. 1997. Dynamic analysis of the cybernetic model for
diauxic growth. Chem. Eng. Sci, 52: 2567-2578.
Norton-Brandão, D., Scherrenberg, S. & van Lier, J. 2013. Reclamation of used urban waters for
irrigation purposes—A review of treatment technologies. J. Environ. Manag, 122: 85–98.
Ntwampe, S.K. & Santos, B.A. 2013. Potential of agro-waste extracts as supplements for the
continuous bioremediation of free cyanide contaminated wastewater. J. Environ. Chem. Eng, 7: 493–
497.
Ofiţeru, I.D., Lunn, M., Curtis, T.P., Wells, G.F., Criddle, C.S., Francis, C.A. & Sloan, W.T., 2010.
Combined niche and neutral effects in a microbial wastewater treatment community. PNAS, 107:
15345-15350.
Ojaghi, A., Tonkaboni, S.Z.S., Shariati, P. & Ardejani, F.D. 2018. Novel cyanide electro-
biodegradation using Bacillus pumilus ATCC 7061 in aqueous solution. J. environ. health sci. eng,
16: 99-108.
Oller, I., Malato, S. & Sánchez-Pérez, J. 2011. Combination of advanced oxidation processes and
biological treatments for wastewater decontamination—A review. Sci. Total Environ, 409: 4141–
4166.
Özel, Y.K., Gedikli, S., Aytar, P., Ünal, A., Yamaç, M., Çabuk, A. & Kolankaya, N. 2010. New
fungal biomasses for cyanide biodegradation. J. Biosci. Bioeng, 110: 431–435.
125
Pal, R.R., Khardenavis, A.A. & Purohit, H.J. 2015. Identification and monitoring of nitrification and
denitrification genes in Klebsiella pneumoniae EGD-HP19-C for its ability to perform heterotrophic
nitrification and aerobic denitrification. Funct. Integr. Genom, 15: 63–76.
Papirio, S., Zou, G., Ylinen, A., Di Capua, F., Pirozzi, F. & Puhakka, J.A. 2014. Effect of arsenic on
nitrification of simulated mining water. Bioresour. Technol, 164: 149–154.
Park, D., Lee, D., Kim, Y. & Park, J. 2008. Bioaugmentation of cyanide-degrading microorganisms
in a full-scale cokes wastewater treatment facility. Bioresour Technol, 99: 2092-2096.
Patnaik, P.R. 2000. Are microbes intelligent beings?:: An assessment of cybernetic modeling.
Biotechnol. Adv, 18: 267-288
Patton, C. J. & Crouch, S. R. 1977. Spectrophotometric and kinetics investigation of the Berthelot
reaction for the determination of ammonia. Anal Chem, 49: 464-469.
Peng, Y. & Zhu, G. 2006. Biological nitrogen removal with nitrification and denitrification via nitrite
pathway. Appl. Microbiol. Biotechnol, 73: 15-26.
Perez-Garcia, O., Lear, G. & Singhal, N. 2016. Metabolic network modeling of microbial interactions
in natural and engineered environmental systems. Front Microbiol, 7: 673.
Perez-Garcia, O., Villas-Boas, S.G., Swift, S., Chandran, K. & Singhal, N. 2014. Clarifying the
regulation of NO/N2O production in Nitrosomonas europaea during anoxic–oxic transition via flux
balance analysis of a metabolic network model. Water Res, 60: 267-277.
Pradhan, N., Thi, S.S. & Wuertz, S. 2019. Inhibition factors and kinetic model for anaerobic ammonia
oxidation in a granular sludge bioreactor with Candidatus Brocadia. Chem. Eng. J, 123618.
Ramavandi, B. 2016. Adsorption potential of NH4Br-soaked activated carbon for cyanide removal
from wastewater. Indian J. Chem. Technol, 22: 183–193.
Ramkrishna, D. & Song, H.S. 2012. Dynamic models of metabolism: Review of the cybernetic
approach. AIChE Journal, 58: 986-997.
Ramkrishna, D.O.R.A.I.S.W.A.M.I. 1982. A cybernetic perspective of microbial growth. In
Foundations of biochemical engineering Kinetics and Thermodynamics in Biological Systems,
Harvey. W. B., Terry Papoutsakis, E., Stephanopoulos., ACS publictions, University of California,
Berkeley G, 161-178.
126
Razanamahandry, L.C., Andrianisa, H.A., Karoui, H., Kouakou, K.M. & Yacouba, H., 2016.
Biodegradation of free cyanide by bacterial species isolated from cyanide-contaminated artisanal gold
mining catchment area in Burkina Faso. Chemosphere, 157: 71-78.
Richards, D. & Shieh, W. 1989. Anoxic-oxic activated-sludge of cyanides and phenols. Biotechnol.
Bioeng, 33, 32-38.
Rider, B. & Mellon, M. 1946. Colorimetric determination of nitrites. Industrial & Engineering Chem
Anal, 18: 96-99
Rinágelová, A., Kaplan, O., Veselá, A.B., Chmátal, M., Křenková, A., Plíhal, O., Pasquarelli, F.,
Cantarella, M. & Martínková, L. 2014. Cyanide hydratase from Aspergillus niger K10:
Overproduction in Escherichia coli, purification, characterization and use in continuous cyanide
degradation. Process. Biochem, 49: 445–450.
Rodríguez, J., Lema, J & Kleerebezem, R. 2008. Energy-based models for environmental
biotechnology. Trends Biochem Sci, 26: 366-374
Rottenberg, H & Gutman, M. 1977. Control of the rate of reverse electron transport in
submitochondrial particles by the free energy. Biochem J ,16: 3220-3227
Ruser, R. & Schulz, R. 2015. The effect of nitrification inhibitors on the nitrous oxide (N2O) release
from agricultural soils—A review. Plant Nutr. Soil Sci, 178: 171–188.
Ryu, B.G., Kim, W., Nam, K., Kim, S., Lee, B., Park, M.S. & Yang, J.W. 2015. A comprehensive
study on algal–bacterial communities shift during thiocyanate degradation in a microalga-mediated
process. Bioresour. Technol, 191: 496–504.
Safa, Z.J., Aminzadeh, S., Zamani, M. & Motallebi, M. 2017. Significant increase in cyanide
degradation by Bacillus sp. M01 PTCC 1908 with response surface methodology optimization. AMB
Express, 7: 200.
Salazar-Benites, G., Dyer, C., Bott, C., Kennedy, A., Williamson, A. & DeVries, A. 2016. Some
Serious BNR Intensification: Combining cost-effective cyanide treatment, chemically-enhanced
primary treatment, and advanced aeration controls to achieve nitrogen removal in a high-rate activated
sludge plant. Proc. Water Environ. Fed, 2016: 4651–4680.
Samer, M. 2015. Biological and chemical wastewater treatment processes. Wastewater Treatment
Engineering, 1-50.

127
Santos, B.A.Q., Ntwampe, S.K.O., Doughari, J.H. & Muchatibaya, G. 2013. Application of Citrus
sinensis solid waste as a pseudo-catalyst for free cyanide conversion under alkaline conditions.
BioResources, 8: 3461–3467.
Sauer, M., Porro, D., Mattanovich, D. & Branduardi, P. 2008. Microbial production of organic acids:
Expanding the markets. Trends Biotechnol, 26: 100–108.
Seifi, M. & Fazaelipoor, M. 2012. Modeling simultaneous nitrification and denitrification (SND) in
a fluidized bed biofilm reactor. Appl. Math. Model, 36: 5603-5613
Sharma, M., Akhter, Y. & Chatterjee, S. 2019. A review on remediation of cyanide containing
industrial wastes using biological systems with special reference to enzymatic degradation. World J.
Microbiol. Biotechnol, 35: 70.
Sheng, G.P., Yu, H.Q. & Li, X.Y. 2010. Extracellular polymeric substances (EPS) of microbial
aggregates in biological wastewater treatment systems: a review. Biotechnol. Adv, 28: 882-894.
Shoda, M. & Ishikawa, Y. 2014. Heterotrophic nitrification and aerobic denitrification of high-
strength ammonium in anaerobically digested sludge by Alcaligenes faecalis strain No. 4. J. Biosci.
Bioeng, 117: 737–741.
Shoda, M. & Ishikawa, Y. 2015. Heterotrophic nitrification and aerobic denitrification of a
wastewater from a chemical company by Alcaligenes faecalis no. 4. Int. J. Water Wastewater Treat,
1: 1–5.
Show, K.Y., Lee, D.J. & Pan, X. 2013. Simultaneous biological removal of nitrogen–sulfur–carbon:
Recent advances and challenges. Biotechnol. Adv, 31: 409–420.
Sin, G., Kaelin, D., Kampschreur, M.J., Takacs, I., Wett, B., Gernaey, K.V., Rieger, L., Siegrist, H.
& van Loosdrecht, M. 2008. Modelling nitrite in wastewater treatment systems: A discussion of
different modelling concepts. Water Sci. Technol, 58: 1155–1171.
Singh, M. & Srivastava, R.K. 2011. Sequencing batch reactor technology for biological wastewater
treatment: A review. Asia-Pac. J. Chem. Eng, 6: 3–13.
Singh, N. & Balomajumder, C. 2016. Simultaneous removal of phenol and cyanide from aqueous
solution by adsorption onto surface modified activated carbon prepared from coconut shell. J. Water
Process. Eng, 9: 233–245.
Sokic-Lazic, D. & Minteer, S.D. 2008. Citric acid cycle biomimic on a carbon electrode. Biosens
Bioelectron, 24: 939-944.

128
Solopova, A., van Gestel, J., Weissing, F., Bachmann, H., Teusink, B., Kok, J. & Kuipers, O. 2014.
Bet-hedging during bacterial diauxic shift. Proc Natl Acad Sci U S A, 111: 7427-7432.
Stephen F. A., Thomas L. M., Alejandro A. S., Jinghui Z., Zheng Z., Webb M., David J. L. 1997.
Gapped BLAST and PSI-BLAST: a new generation of protein database search programs. Nucleic
Acids Res, 25: 3389-3402.
Suga, K., Van Dedem, G. & Moo‐Young, M. 1975. Degradation of polysaccharides by endo and exo
enzymes: A theoretical analysis. Biotechnol Bioeng, 17: 433-439.
Szabó, E., Hermansson, M., Modin, O., Persson, F. & Wilén, B.M. 2016. Effects of wash-out
dynamics on nitrifying bacteria in aerobic granular sludge during start-up at gradually decreased
settling time. Water, 8: 172.
Tiong, B.E.L.I.N.D.A., Bahari, Z.M., Lee, N.S.I.S., Jaafar, J., Ibrahim, Z. & Shahir, S. 2015. Cyanide
degradation by Pseudomonas pseudoalcaligenes strain W2 isolated from mining effluent. Sains
Malays, 44: 233–238.
Toyoda, S., Yoshida, N. & Koba, K. 2015. Isotopocule analysis of biologically produced nitrous oxide
in various environments. Mass Spectrom. Rev, 36: 135–160.
Van Dedem, G. & Moo-Young, 1975. M. A model for diauxic growth. Biotechnol Bioeng, 17: 1301-
1312.
Vasiliadou, I.A., Pavlou, S. & Vayenas, D.V. 2006. A kinetic study of hydrogenotrophic
denitrification. Process Biochem, 41: 1401-1408.
Wagner, M. 2015. Complete nitrification by Nitrospira bacteria. Nature, 528: 504-509.
Wagner, M., Loy, A., Nogueira, R., Purkhold, U., Lee, N. & Daims, H. 2002. Microbial community
composition and function in wastewater treatment plants. Anton Leeuw Int J G, 81: 665-680.
Wang, X., Wang, S., Xue, T., Li, B., Dai, X. & Peng, Y. 2015. Treating low carbon/nitrogen (C/N)
wastewater in simultaneous nitrification-endogenous denitrification and phosphorous removal
(SNDPR) systems by strengthening anaerobic intracellular carbon storage. Water Res, 77: 191-200.
Wang, X., Wang, S., Zhao, J., Dai, X., Li, B. & Peng, Y. 2016. A novel stoichiometries methodology
to quantify functional microorganisms in simultaneous (partial) nitrification-endogenous
denitrification and phosphorus removal (SNEDPR). Water Res, 95: 319-329.
129
Wang, X., Wang, W., Zhang, Y., Zhang, J., Li, J., Wang, S. & Chen, G. 2019. Isolation and
characterization of Acinetobacter sp. JQ1004 and evaluation of its inhibitory kinetics by free
ammonia. Desalin Water Treat, 147: 316-325.
Watts, M.P. & Moreau, J.W. 2016. New insights into the genetic and metabolic diversity of
thiocyanate-degrading microbial consortia. Appl. Microbiol. Biotechnol, 100: 1101–1108.
Wiechert, W. 2001. 13C metabolic flux analysis. Metab Eng, 3: 195-206.
Wild, S.R., Rudd, T. & Neller, A., 1994. Fate and effects of cyanide during wastewater treatment
processes. Sci. total environ,156: 93-107.
Wu, D., Senbayram, M., Well, R., Brüggemann, N., Pfeiffer, B., Loick, N., Stempfhuber, B., Dittert,
K. & Bol, R. 2017. Nitrification inhibitors mitigate N2O emissions more effectively under straw-
induced conditions favoring denitrification. Soil Biol. Biochem, 104: 197–207.
Ye, L., Zhang, T., Wang, T. & Fang, Z. 2012. Microbial structures, functions, and metabolic pathways
in wastewater treatment bioreactors revealed using high-throughput sequencing. Environ. Technol,
46: 13244-13252.
Yunjie, R., Mohammad, J. T., Dedong, K., Huifeng, L., Heping, Z., Xiangyang, X., Yu, L. & Lei, C.
2020. Nitrogen Removal Performance and Metabolic Pathways Analysis of a Novel Aerobic
Denitrifying Halotolerant Pseudomonas balearica strain RAD-17. Microorganism, 8: 72.
Zhang, J., Wu, P., Hao, B. & Yu, Z. 2011. Heterotrophic nitrification and aerobic denitrification by
the bacterium Pseudomonas stutzeri YZN-001. Bioresour. Technol, 102: 9866-9869.
Zhang, J., Zhou, J., Han, Y. & Zhang, X. 2014. Start-up and bacterial communities of single-stage
nitrogen removal using anammox and partial nitritation (SNAP) for treatment of high strength
ammonia wastewater. Bioresour. Technol, 169: 652–657.
Zhang, Q., Liu, Y., Ai, G., Miao, L., Zheng, H. & Liu, Z. 2012. The characteristics of a novel
heterotrophic nitrification–aerobic denitrification bacterium, Bacillus methylotrophicus strain L7.
Bioresour. Technol, 108: 35–44.
Zhang, T., Ding, L., Ren, H., Guo, Z & Tan, J. 2010. Thermodynamic modeling of ferric phosphate
precipitation for phosphorus removal and recovery from wastewater. J Hazard Mater, 176: 444-450
Zhang, Y., Shi, Z., Chen, M., Dong, X. & Zhou, J. 2015. Evaluation of simultaneous nitrification and
denitrification under controlled conditions by an aerobic denitrifier culture. Bioresour. Technol, 175:
602–605.
130
Zheng, M., He, D., Ma, T., Chen, Q., Liu, S., Ahmad, M., Gui, M. & Ni, J. 2014. Reducing NO and
N2O emission during aerobic denitrification by newly isolated Pseudomonas stutzeri PCN-1.
Bioresour. Technol, 162: 80–88.
Zhou, X.J., Kao, M.C.J., Huang, H., Wong, A., Nunez-Iglesias, J., Primig, M., Aparicio, O.M., Finch,
C.E., Morgan, T.E. & Wong, W.H. 2005. Functional annotation and network reconstruction through
cross-platform integration of microarray data. Nat. Biotechnol, 23, 238.

131
CHAPTER 10
APPENDICES

132
CHAPTER 10:
APPENDIX A
Figure 10.1. Simultaneous nitrification and aerobic denitrification performed by cyanide degrading
mix consortia under high cyanide conditions. (a) NH4-N and CN- degradation profile. (b) NO2-N and
NO3-N degradation and accumulation profile.
0
5
10
15
20
25
0
50
100
150
200
250
0 50 100 150
CN
-co
ncen
trat
ion
(mg/
L)
NH
4-N
con
cent
ratio
n (m
g/L)
Time (h)
NH4-NCN-
00,10,20,30,40,50,60,70,80,9
1
0 50 100 150N
O2- /N
O3- c
once
ntra
tion
(mg/
L)Time (h)
NO2-N
NO3-N
A
A B

133
B
C
D

134
Figure 10.2. metagenomics report for the consortium. (a): Kingdom classification. (b): Phylum
classification. (c): Class classification. (d); Order classification. E: Family classification.
Table 10.1. Estimated values of kinetic parameters for the models for NH4-N degradation, a limiting
step in nitrification
Fitting constants and the values of kinetic Parameter (±95% confidence interval)
Model Vm (h-1) Ki (mgL-1) Ks (mgL-1) N (-) R2 variance Monod 𝒅𝒅𝑪𝑪𝒂𝒂𝒅𝒅𝒅𝒅
= 𝐕𝐕𝐕𝐕∗𝑪𝑪𝒂𝒂𝐊𝐊𝐢𝐢+𝐝𝐝𝐝𝐝
- 1.19 92.91 - - 0.48 0.09
Moser 𝒅𝒅𝑪𝑪𝒂𝒂𝒅𝒅𝒅𝒅
= 𝑽𝑽𝒎𝒎[ 𝑪𝑪𝒂𝒂𝒏𝒏
𝑲𝑲𝒊𝒊+𝑪𝑪𝒂𝒂𝒏𝒏]
0.26 1.55 - -0.24 0.09 0.23
Table 10.2. Estimated values of kinetic parameters for the models for CN- degradation, a limiting
step in nitrification
Fitting constants and the values of kinetic parameter
(±95% confidence interval)
Model Vm (h-1) Ki (mgL-1) Ks (mgL-1) n (-) R2 variance Monod
𝒅𝒅𝑪𝑪𝒂𝒂𝒅𝒅𝒅𝒅
=𝐕𝐕𝐕𝐕 ∗ 𝑪𝑪𝒂𝒂𝐊𝐊𝐢𝐢 + 𝐝𝐝𝐝𝐝
-0.32 -9.50 - - 0.28 0.48
Moser 𝒅𝒅𝑪𝑪𝒂𝒂𝒅𝒅𝒅𝒅
= 𝑽𝑽𝒎𝒎[𝑪𝑪𝒂𝒂𝒏𝒏
𝑲𝑲𝒊𝒊 + 𝑪𝑪𝒂𝒂𝒏𝒏]
0.026 44.43 - 0.98 0.75 0.22
Model with substrate inhibition
E
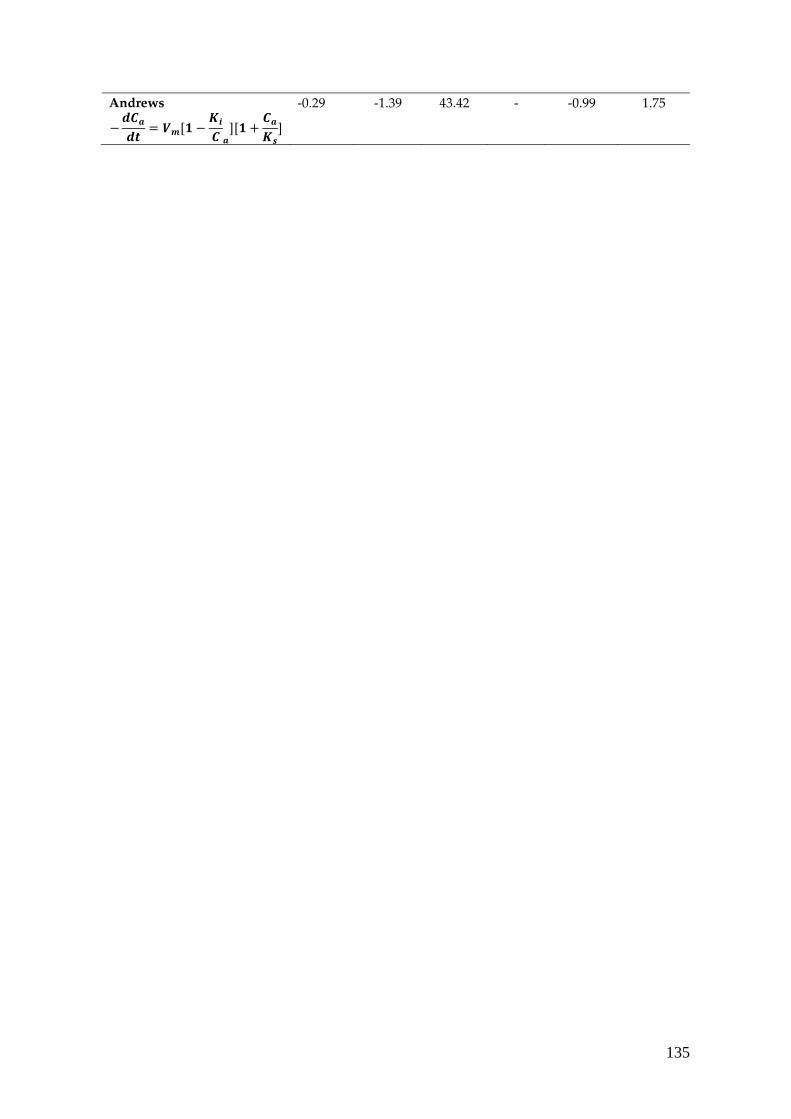
135
Andrews
−𝒅𝒅𝑪𝑪𝒂𝒂𝒅𝒅𝒅𝒅
= 𝑽𝑽𝒎𝒎[𝟏𝟏 −𝑲𝑲𝒊𝒊
𝑪𝑪 𝒂𝒂][𝟏𝟏 +
𝑪𝑪𝒂𝒂𝑲𝑲𝒔𝒔
]
-0.29 -1.39 43.42 - -0.99 1.75
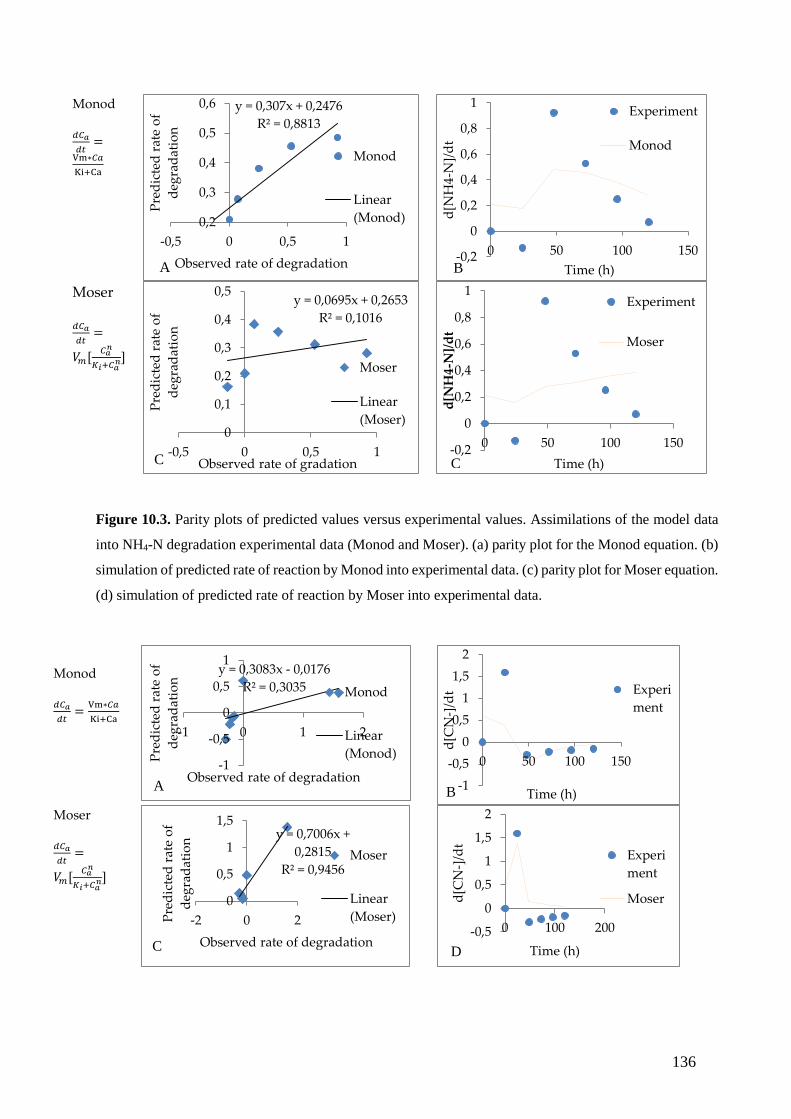
136
Monod 𝑑𝑑𝐶𝐶𝑎𝑎𝑑𝑑𝑑𝑑
=Vm∗𝐶𝐶𝑚𝑚Ki+Ca
Moser 𝑑𝑑𝐶𝐶𝑎𝑎𝑑𝑑𝑑𝑑
=
𝑉𝑉𝑚𝑚[ 𝐶𝐶𝑎𝑎𝑛𝑛
𝐾𝐾𝑖𝑖+𝐶𝐶𝑎𝑎𝑛𝑛]
Figure 10.3. Parity plots of predicted values versus experimental values. Assimilations of the model data
into NH4-N degradation experimental data (Monod and Moser). (a) parity plot for the Monod equation. (b)
simulation of predicted rate of reaction by Monod into experimental data. (c) parity plot for Moser equation.
(d) simulation of predicted rate of reaction by Moser into experimental data.
Monod 𝑑𝑑𝐶𝐶𝑎𝑎𝑑𝑑𝑑𝑑
= Vm∗𝐶𝐶𝑚𝑚Ki+Ca
Moser 𝑑𝑑𝐶𝐶𝑎𝑎𝑑𝑑𝑑𝑑
=
𝑉𝑉𝑚𝑚[ 𝐶𝐶𝑎𝑎𝑛𝑛
𝐾𝐾𝑖𝑖+𝐶𝐶𝑎𝑎𝑛𝑛]
y = 0,307x + 0,2476R² = 0,8813
0,2
0,3
0,4
0,5
0,6
-0,5 0 0,5 1
Pred
icte
d ra
te o
f de
grad
atio
n
Observed rate of degradation
Monod
Linear(Monod)
-0,2
0
0,2
0,4
0,6
0,8
1
0 50 100 150
d[N
H4-
N]/d
t
Time (h)
Experiment
Monod
y = 0,0695x + 0,2653R² = 0,1016
0
0,1
0,2
0,3
0,4
0,5
-0,5 0 0,5 1
Pred
icte
d ra
te o
f de
grad
atio
n
Observed rate of gradation
Moser
Linear(Moser)
-0,2
0
0,2
0,4
0,6
0,8
1
0 50 100 150d[
NH
4-N
]/dt
Time (h)
Experiment
Moser
y = 0,3083x - 0,0176R² = 0,3035
-1
-0,5
0
0,5
1
-1 0 1 2
Pred
icte
d ra
te o
f de
grad
atio
n
Observed rate of degradation
Monod
Linear(Monod)
-1-0,5
00,5
11,5
2
0 50 100 150
d[C
N-]
/dt
Time (h)
Experiment
y = 0,7006x + 0,2815
R² = 0,9456
0
0,5
1
1,5
-2 0 2Pred
icte
d ra
te o
f de
grad
atio
n
Observed rate of degradation
Moser
Linear(Moser)
-0,5
0
0,5
1
1,5
2
0 100 200
d[C
N-]
/dt
Time (h)
Experiment
Moser
A B
C C
A B
C D

137
Figure 10.4. Parity plots of predicted values versus experimental values. Assimilations of the model data
into CN- degradation experimental data (Monod, Moser, and Andrews). (a) parity plot for the Monod
equation. (b) simulation of predicted rate of reaction by Monod into experimental data. (c) parity plot for
Moser equation. (d) simulation of predicted rate of reaction by Moser into experimental data.