genome-scale metabolic modelling of arabidopsis and tomato · genome-scale metabolic modelling of...
TRANSCRIPT

Genome-scale metabolic modelling of Arabidopsis andtomatoCitation for published version (APA):Yuan, H. (2016). Genome-scale metabolic modelling of Arabidopsis and tomato. Eindhoven: TechnischeUniversiteit Eindhoven.
Document status and date:Published: 14/12/2016
Document Version:Publisher’s PDF, also known as Version of Record (includes final page, issue and volume numbers)
Please check the document version of this publication:
• A submitted manuscript is the version of the article upon submission and before peer-review. There can beimportant differences between the submitted version and the official published version of record. Peopleinterested in the research are advised to contact the author for the final version of the publication, or visit theDOI to the publisher's website.• The final author version and the galley proof are versions of the publication after peer review.• The final published version features the final layout of the paper including the volume, issue and pagenumbers.Link to publication
General rightsCopyright and moral rights for the publications made accessible in the public portal are retained by the authors and/or other copyright ownersand it is a condition of accessing publications that users recognise and abide by the legal requirements associated with these rights.
• Users may download and print one copy of any publication from the public portal for the purpose of private study or research. • You may not further distribute the material or use it for any profit-making activity or commercial gain • You may freely distribute the URL identifying the publication in the public portal.
If the publication is distributed under the terms of Article 25fa of the Dutch Copyright Act, indicated by the “Taverne” license above, pleasefollow below link for the End User Agreement:
www.tue.nl/taverne
Take down policyIf you believe that this document breaches copyright please contact us at:
providing details and we will investigate your claim.
Download date: 05. Mar. 2020

Genome-Scale Metabolic
Modelling of Arabidopsis and
Tomato

This work was supported by the Brainbridge project (collaboration between Eind-
hoven University of Technology, Zhejiang University and Philips Asia-Shanghai)
and the China Scholarship Council (CSC).
A catalogue is available from the Eindhoven University of Technology Library
ISBN: 978-90-386-4191-1
Cover Design: Xinwei Wang and Koen Pieterse
Cover image: A picture of the green leaf from Reshma Chowdhury with improved
design.
Printed by: Ipskamp Drukkers, Enschede, the Netherlands
Copyright © 2016 by Huili Yuan

Genome-Scale Metabolic
Modelling of Arabidopsis and
Tomato
PROEFSCHRIFT
ter verkrijging van de graad van doctor
aan de Technische Universiteit Eindhoven,
op gezag van de rector magnificus prof.dr.ir. F.P.T. Baaijens,
voor een commissie aangewezen door het College voor Promoties,
in het openbaar te verdedigen
op woensdag 14 december 2016 om 14:00 uur
door
Huili Yuan
geboren te Henan, China

Dit proefschrift is goedgekeurd door de promotoren en de samenstelling van de pro-
motiecommissie is als volgt:
Voorzitter: prof.dr. C.W.J. Oomens
promotor: prof.dr. P.A.J. Hilbers
copromotor: prof.dr. N.A.W. van Riel
leden: prof.dr. B. Teusink (Universiteit van Amsterdam)
prof.dr. R.G. Ratcliffe (University of Oxford)
prof.dr. J.W.M. Bergmans
prof.dr. G.F. Zhou (TU/e; South China Normal University)
adviseur: dr. M.C.Y. Cheung (Yale-NUS College)
Het onderzoek of ontwerp dat in dit proefschrift wordt beschreven is uitgevoerd in
overeenstemming met de TU/e Gedragscode Wetenschapsbeoefening.

I
Contents
Chapter 1 Introduction .............................................................................. 1
1.1 Plant metabolism and its investigation .................................................... 2
1.2 Constraint-based modelling ..................................................................... 4
1.2.1 Flux balance analysis.................................................................. 5
1.2.2 Flux variability analysis ............................................................. 6
1.2.3 Flux-sum analysis ....................................................................... 6
1.3 Genome-scale metabolic models ............................................................. 6
1.3.1 Reconstruction of GSMs ............................................................ 8
1.3.2 Software for genome-scale metabolic modelling ....................... 9
1.3.3 Applications of GSMs .............................................................. 10
1.4 Organization of this thesis ..................................................................... 11
Chapter 2 Flux balance analysis of plant metabolism: the effect of
biomass composition and model structure on model predictions .............. 13
2.1 Introduction ........................................................................................... 15
2.2 Methods ................................................................................................. 17
2.2.1 Stoichiometric models .............................................................. 17
2.2.2 Biomass equations .................................................................... 18
2.2.3 Model simulations .................................................................... 18
2.3 Results… ............................................................................................... 21
2.3.1 Comparisons between plant flux-balanced models .................. 21

Contents
II
2.3.2 The impact of biomass composition and model structure on
central metabolic fluxes............................................................ 26
2.4 Discussion ............................................................................................. 31
2.5 Conclusions ........................................................................................... 32
2.6 Appendix ............................................................................................... 33
Chapter 3 Constructing a genome-scale metabolic model for
tomato…………….. ....................................................................................... 39
3.1 Introduction ........................................................................................... 41
3.2 Methods ................................................................................................. 42
3.2.1 Software ................................................................................... 42
3.2.2 Metabolic reconstruction .......................................................... 42
3.2.3 Model analysis .......................................................................... 43
3.3 Results and Discussion .......................................................................... 45
3.3.1 General model properties ......................................................... 45
3.3.2 Comparisons with existing plant models .................................. 46
3.3.3 Model validation ...................................................................... 47
3.4 Conclusions ........................................................................................... 52
3.5 Appendix ............................................................................................... 52
Chapter 4 In silico study of photorespiratory metabolism under
drought conditions…………….. ................................................................... 57
4.1 Introduction ........................................................................................... 59
4.2 Methods ................................................................................................. 60
4.2.1 Model analysis .......................................................................... 60
4.2.2 Deletion simulation .................................................................. 60
4.3 Results and Discussion .......................................................................... 60

Contents
III
4.3.1 Differences in metabolically active reactions between normal
and drought conditions ............................................................. 61
4.3.2 Effect of drought stress on the core metabolic pathways ......... 66
4.3.3 Evaluation of reaction deletions ............................................... 68
4.4 Conclusions ........................................................................................... 72
4.5 Appendix ............................................................................................... 72
Chapter 5 Modelling the effects of light intensity and quality on light-
driven metabolism of tomato ........................................................................ 77
5.1 Introduction ........................................................................................... 79
5.2 Methods ................................................................................................. 81
5.2.1 Reconstruction of a tomato light-specific model ...................... 81
5.2.2 Constraint-based flux analysis .................................................. 82
5.2.3 Flux-sum ................................................................................... 83
5.3 Results……….. ..................................................................................... 83
5.3.1 Representation of photosynthetic light reactions in existing plant
GSMs ........................................................................................ 83
5.3.2 Two published light-specific models........................................ 85
5.3.3 Model properties ...................................................................... 87
5.3.4 Growth simulation of tomato cells under different light
conditions ................................................................................. 88
5.3.5 Exploring energy balancing in the light ................................... 90
5.3.6 Flux-sum differences in cofactors ATP, NADH and
NADPH……………………………………………………….93
5.4 Discussion ............................................................................................. 94
5.4.1 Influence of varying light on the cellular growth ..................... 94
5.4.2 Energy balancing under varying light conditions ..................... 95
5.4.3 Potential limitations .................................................................. 96

Contents
IV
5.5 Conclusions ........................................................................................... 98
5.6 Appendix ............................................................................................... 99
Chapter 6 General discussion ................................................................ 103
6.1 Summary of contributions ................................................................... 104
6.2 Limitations of this study ...................................................................... 104
6.3 Future perspective ............................................................................... 106
References………… ........................................................................................... 109
Summary………………… ................................................................................. 135
Publications……….. ........................................................................................... 137
Acknowledgements ............................................................................................. 138
Curriculum Vitae…………. .............................................................................. 141

V
Abbreviations
2-OG α-ketoglutarate
2-PG 2-phosphoglycolate
2-PGA 2-phosphoglycerate
3-PGA 3-phosphoglycerate
6PG 6-phosphogluconate
6PGD 6-Phosphogluconate dehydrogenase
6PGL 6-Phosphogluconolactonase
6PGL 6-phosphogluconolactone
ABA abscisic acid
AcCoA acetyl-CoA
ACET acetate
ACETALD acetaldehyde
ADPG ADP-glucose
AEF alternate electron flow
AGT alanine-glyoxylate transaminase
Ala alanine
ALDH aldehyde dehydrogenase
AOX alternative oxidase
Arg arginine
Asn asparagine
Asp aspartate
ATPase ATP synthase
BOF biomass objective function
BRENDA Braunschweig Enzyme Database
CAT catalase
CBM constraint-based modelling
CEF cyclic electron flow
CIT citrate synthase
Cit citrate
CMP cytidine monophosphate
COBRA COnstraints Based Reconstruction And analysis
COX cytochrome C oxidase
Abbreviations
VI
Cys cysteine
Cytob6f cytochrome b6f complex
Cytox cytochrome oxidized
Cytred cytochrome reduced
DHAP dihydroxyacetone phosphate
DMAPP dimethylallyl pyrophosphate
DPG glycerate-1,3-bisphosphate
DVPCHLDOR divinyl chlorophyllide-a:NADP+ oxidoreductase
DW dry weight
e- electrons
E4P erythrose-4-phosphate
ETC electron transport chain
F6P fructose-6-phosphate
FBA flux balance analysis
FBP fructose-1,6-biphosphate
Fd-GOGAT ferredoxin-dependent glutamate synthase
Fdox ferredoxin oxidized
Fdred ferredoxin reduced
FNR ferredoxin NADP+ reductase
FQR ferredoxin plastoquinone reductase
FSA flux sum analysis
Fum fumarate
FVA flux variability ananlysis
FW fresh weight
G1P glucose-1-phosphate
G6P glucose-6-phosphate
G6PD glucose 6-phosphate dehydrogenase
GAL glutamate-ammonia ligase
GAM growth associated maintenance
GAP glyceraldehyde-3-phosphate
GAPDH glyceraldehyde-3-phosphate dehydrogenase
GDC glycine decarboxylase
GGT glutamate:glyoxylate aminotransferase
GLBE 1,4-alpha-glucan branching enzyme
GLC glucose
Gln glutamine
GLPK Gnu Linear Programming Kit

Abbreviations
VII
Glt glycolate
Glu glutamate
Gly glycine
GLYK glycerate kinase
GOGAT glutamate synthase
GOX glycolate oxidase
Gox glyoxylate
GPR gene-protein-reaction
GS glutamine synthetase
GSM genome-scale metabolic model
GTR glycine transaminase
H2O2 hydrogen peroxide
HPR hydroxypyruvate reductase
IDH isocitrate dehydrogenase
Ile isoleucine
IPP isopentenyl pyrophosphate
IsoCit threo-isocitrate
KEGG Kyoto Encyclopedia of Genes and Genomes
LED light emitting diode
LEF linear electron flow
Leu leucine
LP Linear Programming
LSP light saturation point
Lys lysine
Mal malate
MDH malate dehydrogenase
Mehler Mehler’s reaction
MEP 2C-methyl-D-erythritol-4-phosphate
Met methionine
M-THF methylene-tetrahydrofolate
MVA mevalonate
NDH NADPH dehydrogenase
NGAM non-growth associated maintenance
NiR nitrite reductase
NR nitrate reductase
OAA oxalacetic acid
OGDH 2-oxoglutarate dehydrogenase
OH-PYR hydroxypyruvate

Abbreviations
VIII
PC plastocyanin
PCHLDOR chlorophyllide-a:NADP+ oxidoreductase
PDH pyruvate dehydrogenase
PEP phosphoenol pyruvate
PEPC phosphoenolpyruvate carboxylase
PETs photosynthetic electron transport flows
PGK phosphoglycerate kinase
Phe phenylalanine
PHOTOR photorespiration
Pi inorganic phosphate
PLGP phosphoglycolate phosphatase
PPDK pyruvate orthophosphate dikinase
PPi diphosphate
PQ plastoquinone
Pro proline
PSI photosystem I
PSII photosystem II
PTOX plastoquinol oxidase
Pyr pyruvate
Q ubiquinol
QH2 ubiquinone
R5P ribose-5-phosphate
RPE ribulose-5-phosphate epimerase
RPI ribulose-5-phosphate isomerase
RPK ribulose-5-phosphate kinase
Ru5P ribulose-5-phosphate
RubisCO ribulose-1,5-bisphosphate carboxylase/oxygenase
RuBP ribulose-1,5-bisphosphate
S7P sedoheptulose-7-phosphate
SBML Systems Biology Markup Language
SBP sedoheptulose-1,7-biphosphate
SBPase sedoheptulose bisphosphatase
SDH succinate dehydrogenase
Ser serine
SGT serine-glyoxylate aminotransferase
SHMT serine hydroxymethyl-transferase
STK succinate CoA ligase
Suc succinate

Abbreviations
IX
SucCoA succinyl-CoA
TAL transaldolase
TCA the tricarboxylic acid
THF tetrahydrofolate
Thr threnine
TKT transketolase
TPI triose phosphate isomerase
Tyr tyrosine
UDP uridine-diphosphate
UDPG UDP-α-D-glucose
UMP uridine monophosphate
UTP uridine-triphosphate
Val valine
Vc/Vo the flux ratio of carboxylation to oxygenation of RubisCO
Vi/Vo photon conversion efficiency
X5P xylulose-5-phosphate
фCO2 moles of CO2 fixed per mole of absorbed photons

X

Chapter 1 Introduction
Chapter 1
2
1.1 Plant metabolism and its investigation
Plants are indispensable for human life as they are the major source of food, feed
and fiber for human beings and livestock. Plant cells also serve as pharmaceutical
factories. Many of the drugs currently available on the market are plant-derived nat-
ural products or their derivatives (Rischer et al., 2013; Atanasov et al., 2015).
Additionally, some of the plant natural products are increasingly considered as
health-promoting compounds, such as lycopene in tomatoes and glucosinolates in
broccoli (Dixon, 2005; Hounsome et al., 2008).
The growth and survival of plants rely on metabolism which encompasses all
biochemical reactions mostly catalysed by enzymes within a cell (Smith and Stitt,
2007). Conventionally, metabolism is divided into two broad categories: catabolism
and anabolism. The former produces energy by breaking down organic molecules,
for example, the cellular respiration. The latter, anabolism synthesizes cellular com-
ponents such as sugars and proteins that are used for building the cell structure.
Biochemical reactions are organized into metabolic pathways which shape a
dynamic circuitry commonly referred as metabolic network (Sweetlove et al.,
2008). From a metabolic perspective, plants are highly versatile. They utilise light
energy to convert atmospheric CO2 directly into organic molecules required for life.
Compared to microbes, plant metabolism is extremely complex because of the sub-
cellular compartmentalization of metabolic processes and extensive secondary
metabolism. For instance, bacterial and yeast metabolisms contain only a few hun-
dred metabolites, while a commonly quoted estimate is that plants produce in the
order of 100,000 known plant secondary metabolites, including phenylpropanoids
and flavonoids, terpenoids, glucosinolates and alkaloids (Schwab, 2003). These sec-
ondary metabolites play important roles in cellular function, in signaling and in
adaptation to abiotic, for instance, drought, and biotic stress that cause damage to
plants via living organisms such as fungi, bacteria and insects. Moreover, plants
display enormous diversity in their metabolism in response to different environmen-
tal conditions and genetic conditions, which increases the complexity of plant
metabolism.
Cellular metabolism is regulated at different hierarchical levels (Figure 1.1).
While, fluxomics involves the quantitative analysis of metabolic fluxes through the
operative metabolic network, providing a holistic picture of integrated regulation at
the transcriptional, translational and metabolic levels. Metabolic fluxes, the rates of
metabolic reactions, are considered as ultimate representation of cellular phenotype
and function expressed under a certain condition (Nielsen, 2003). Metabolomics can

Introduction
3
also be useful to demonstrate metabolic signatures and gain a better understanding
on the interaction between plants and their environments (Field and Lake, 2011;
Kim et al., 2015), but typically fluxes are more informative than metabolite concen-
trations themselves, and it is challenging to estimate fluxes from metabolite
concentrations partly because each metabolite involves in multiple metabolic reac-
tions (Kim and Lun, 2014). Comprehensive characterization of plant metabolism
and their functions therefore requires quantitative knowledge of metabolic fluxes.
Over the past few years, much effort has been made to develop approaches for quan-
tifying metabolic fluxes, of which, metabolic flux analyses and constraint-based
modelling are the two most widely used techniques that take advantage of stoichio-
metric information of the metabolic network (Price et al., 2004).
Figure 1.1 Hierarchical layers involved in the final phenotype of an organism.
Metabolic flux analyses (MFA) is an experimental technique to quantify the
rates of material movement through complicated networks using isotopic labeling.
In this approach, the intracellular fluxes are calculated based on a stoichiometric
model for the major intracellular reactions and applying isotopic mass balances

Chapter 1
4
around intracellular metabolites. A set of fluxes that can be measured directly, typ-
ically the uptake rates of substrates into the cells and the rates of metabolites that
secreted from the cells (i.e. exchange fluxes), are used as input to do the calculations.
Various methods of MFA have been developed, the advantages and limitations of
each method have been discussed in the work of Antoniewicz (2015). MFA has been
applied to several plant studies and has been recognized as a valuable tool for ana-
lysing metabolic fluxes in plants (Kruger and Ratcliffe, 2009; Sweetlove and
Ratcliffe, 2011), however, the application of MFA to eukaryotic systems still re-
mains challenging due to a number of critical limitations such as the small size of
the networks studied (Sweetlove and Ratcliffe, 2011; Antoniewicz, 2015; Colombié
et al., 2015).
1.2 Constraint-based modelling
A complementary approach for quantifying metabolic flux is provided by in silico
constraint-based modeling (CBM), also known as structural metabolic modeling.
Constraint-based flux analysis rely on metabolic models that systematize biochem-
ical, genetic and genomic knowledge into a mathematic form, i.e. stoichiometry
matrix, and the steady-state mass balance assumption, does not require kinetic pa-
rameters. CBM enables the modelling of very large metabolic networks with a
minimum amount of input information and therefore has been the method of choice
for representing genome-scale reconstructed metabolic networks. In this thesis, the
constraint-based modeling approach was also used to study the metabolic behaviors
of tomato leaves. Therefore, here I introduce the basic concepts in the constraint-
based modelling and its combination with other techniques.
Stoichiometric matrix 𝑵, consists of rows corresponding to metabolites, col-
umns corresponding to reactions and each element 𝑵(𝑖, 𝑗) corresponding to the
stoichiometric coefficient of metabolite i in reaction j. The positive and negative
coefficients indicate the product and reactant metabolites, respectively. Stoichio-
metric matrix describes how the various reactions of the network are connected,
thus, is one of the most important predictors in the analysis of constraint-based mod-
els.
Steady-state assumption is the first principle of CBM to investigate the me-
tabolism of living cells, where net rate of any internal metabolite is zero. It is worth
noting that when modelling a metabolic system, metabolites are often classified into
two categories: internal metabolites and external metabolites. External metabolites
can be assumed as water or other species from the environment, such as photon and

Introduction
5
CO2, all the remaining intermediates are internal metabolites. The steady-state as-
sumption holds only for internal metabolites because each internal metabolite must
not accumulate or decrease in time. This assumption is supported by the observation
that intracellular dynamics are much faster than extracellular dynamics (Kauffman
et al., 2003). Therefore, it is sensible to disregard its transient behavior and consider
that they rapidly reach the steady state. The general equation for steady-state mass
balance assumption is described by:
𝑵𝒗 = 0
where 𝑵 is the stoichiometric matrix of the model and 𝒗 is a vector of metabolic
fluxes representing each feasible steady-state. As the number of reactions (columns)
is typically larger than the number of metabolites (rows) within a metabolic network
(Klamt et al., 2002), the system is thus underdetermined, resulting multiple possible
flux states that satisfy the steady-state assumption. To reduce the possible flux so-
lution space, additional constraints are generally imposed to the system, such as
information about the rates of substrate consumption and biomass synthesis.
1.2.1 Flux balance analysis
Optimization-based approaches seek to find the optimal solution that can be attained
by the cells, of which, flux balance analysis (FBA) is the most widely used one. It
uses linear programming (LP) to identify a specific (extreme) pattern of metabolic
fluxes based on the steady-state assumption and additional constraints such as reac-
tion capacities (Orth et al., 2010). The characteristic assumption of FBA is the
optimal function of the metabolic network termed as objective function, i.e. cells
regulate their fluxes toward optimal flux states. Therefore, the objective function
plays a crucial role in constraint-based flux analysis. The implemented objective
functions range from growth over ATP production and total flux minimization to
combined objectives. To evaluate the consequences of objective functions in FBA,
studies have been carried out to examine the choice of objective function optimiza-
tion with metabolic networks for predicting metabolic phenotypes (Schuetz et al.,
2007; Feist and Palsson, 2010; Cheung et al., 2013). In most cases, the biomass
objective function (growth rate or the rate of biomass production) that describes the
rate of which all of the biomass components (amino acids, nucleotides, etc.) are
made in their proportions has been widely used, in particular for micro-organisms.
The formulation of the biomass objective function for genome-scale network recon-
struction can be in previous studies (Becker et al., 2007; Feist and Palsson, 2010).

Chapter 1
6
The influence of biomass composition in the biomass objective function was exam-
ined in this thesis, using Arabidopsis models. The respective part is described in
Chapter 2.
1.2.2 Flux variability analysis
As FBA typically only provduces a unique steady-state flux distribution through a
metabolic network, and neglects the existences of multiple alternative flux solutions
exist that satisfy the optimization of a predefined objective function.Flux variability
analysis (FVA), an extension of FBA, has been proposed to determine all the possi-
ble flux ranges for each reaction flux that meet the optimal objective function
(Mahadevan and Schilling, 2003). Such alternative flux solutions refer to alternative
metabolic routes for achieving the same optimal behavior, and reveal the flexibility
and robustness of the underlying metabolic network.
1.2.3 Flux-sum analysis
At steady state, the net accumulation of internal metabolites is zero in the constraint-
based flux analysis, but the turnover rate, i.e. the overall consumption or production
rate of the intermediates, can be nonzero. To quantify the metabolite turnover rates,
flux-sum analysis (FSA) was proposed (Chung and Lee, 2009). The flux-sum of a
metabolite is calculated by halving the absolute sum of all incoming or outgoing
fluxes around the metabolite. The flux-sum for a metabolite can be used as a proxy
for the metabolite turnover and regarded as a measure for the overall flux through a
metabolic pool at a feasible steady state. Recently, it has been used to characterize
the variation in cellular metabolism under different conditions (Simons et al., 2014;
Basler et al., 2016).
1.3 Genome-scale metabolic models
The utility of constraint-based modelling in biological studies and the availability
of genome annotations allow the development of genome-scale metabolic networks.
It should be noted that there are two types of plant genome-scale metabolic networks
available: descriptive and predictive. The metabolic networks discussed in this the-
sis refer to the later, predictive genome-scale metabolic models (GSMs). The
descriptive genome-wide metabolic networks are not predictive and therefore have
limited capabilities that facilitate metabolic engineering, but they have been used

Introduction
7
for many studies (Bassel et al., 2012; Dharmawardhana et al., 2013; Kim et al.,
2015).
A GSM accounts for reaction stoichiometry and directionality, gene-protein-
reaction associations (GPR) associations, reaction compartmentalized localization
and transporter information as well as biomass composition. As an increasing num-
ber of the complete genome sequences of organisms become available, a large
number of GSMs have been constructed for several organisms in the domains of
bacteria, archaea and eukarya (Feist et al., 2009; Kim et al., 2012). GSMs have also
been successfully applied to plants, including Arabidopsis (Poolman et al., 2009; de
Oliveira Dal’Molin et al., 2010a; Cheung et al., 2013; Arnold and Nikoloski, 2014),
and food crops such as barley (Grafahrend-Belau et al., 2009; Grafahrend-Belau et
al., 2013) and rice (Poolman et al., 2013). Among these plant species, Arabidopsis
thaliana is the most extensively studied as Arabidopsis was the first plant to have
its genome sequenced (The Arabidopsis Genome Initiative, 2000). Moreover, Ara-
bidopsis serves as a model organism for research in plant biology and genetics
because of its important features, including a short generation time, small size, large
number of offspring and a relatively small genome. Since 2009, a handful of ge-
nome-scale/large-scale metabolic models for Arabidopsis have been published. In
this thesis, the published Arabidopsis GSMs were exploited, and the respective work
was described in Chapter 2.
Tomato (Solanum lycopersicum L.) is a high-value vegetable crop grown
worldwide in greenhouse as well as in open field. Tomato has always drawn much
attention owing to its high economic value in the market, and its high content in
health-promoting antioxidant compounds such as ascorbic acid (vitamin C) (Dixon,
2005; Story et al., 2010), as well as its distinct developmental features, for example,
compound leaves. In addition, tomato is widely used as an excellent model system
for addressing the fruit development and metabolism because of its ease of cultiva-
tion, and short life cycles (Klee and Giovannoni, 2011). The growth, yield and fruit
quality can be affected by several environmental factors, such as water deficit and
light, which induce the metabolic changes in cellular metabolism. Over the last few
decades, much effort has been made towards understanding the cellular behavior of
tomato, ranging from physiology and biochemistry to molecular and genetics by
conventional experimental techniques (Haupt-Herting et al., 2001; Lieberman et al.,
2004; Liu et al., 2004). However, the adaptive mechanisms of tomato under differ-
ent growth conditions are still not completely understood. The availability of tomato
genome allows systems-level studies of this commercial crop using constraint-based
approaches (Consortium, 2012). In this thesis, a genome-scale metabolic network

Chapter 1
8
of tomato was constructed, then was used to investigate metabolic behaviors under
drought and varying light conditions.
1.3.1 Reconstruction of GSMs
The reconstruction process of GSMs has been extensively reviewed (Feist et al.,
2009; Durot et al., 2009; Thiele and Palsson, 2010), of which, the most comprehen-
sive and detailed protocol was reported by Thiele and Palsson (2010). To
summarize, the steps toward a reconstruction of GSMs can be grouped into two
stages: initial reconstruction and model refinement (Figure 1.2).
Figure 1.2 Illustration of the GSMs’ reconstruction process. Adopted from (Durot et al., 2009).
Initial reconstruction. The reconstruction of a GSM initiates with the auto-
mated generation of a draft model based on the genome annotation of the target
organism. These genome information can be obtained from metabolic databases
such as KEGG (Kyoto Encyclopedia of Genes and Genomes; Kanehisa and Goto,
2000), BRENDA (Schomburg et al., 2004) and BioCyc (Karp et al., 2005). An au-
tomatically constructed metabolic network is, in essence, a collection of metabolic
reactions, always has gaps, errors and inconsistencies. Moreover, some information

Introduction
9
that is needed for the metabolic reconstruction such as subcellular localization, re-
action directionality and transporters, are not or falsely included in the metabolic
databases. Thus, the obtained draft model need to be manually curated in the next
stage.
Model refinement. In this stage, the obtained draft model is curated with re-
gard to the removal of metabolites and reactions, reaction stoichiometry, reaction
reversibility, mass conservation as well as energy consistency. The removed metab-
olites from the draft model are mainly non-metabolic and generic compounds.
Accordingly, reactions involved with ill-defined metabolites mentioned above were
removed. Reactions with wrong stoichiometry and reversibility were manually cor-
rected and replaced the correct ones based on literature study. Missing inter-
compartmental transport reactions were added based on an extensive literature
search.
Ensuring mass conservation is an important consideration during the develop-
ment of stoichiometric metabolic models. It is trivial to determine the atomic
balance of reactions for which the empirical formulas of all metabolites are known.
However, for those for which the empirical formula is not available must be treated
with some caution. Commonly, these reactions involve polymeric species such as
starch and cellulose. To solve this issue, the smallest monomeric subunit is defined,
and used for rescaling stoichiometric coefficients. For example, glucose is assumed
to be the monomeric subunit of starch and cellulose. Additionally, energy and redox
conservation was also tested during the refinement process. We ensured that ATP
and NAD(P)H could not be produced without nutrient inputs. The implement of
checking energy consistency has been detailed elsewhere (Thiele and Palsson, 2010;
Hartman et al., 2014).
Further in the model refinement process, the model is validated by examining
its ability of producing biomass metabolites, reproducing known metabolic behav-
iors and predicting growth phenotypes such as genotype-phonotype relationship.
Missing reactions and mistakenly included information can also be identified in
these analyses. In contrast to the rapid automated reconstruction step, the manual
curation process is very laborious as well as time-consuming, and it is usually an
iterative cycle. Previous publications, textbooks work are the main resources for the
manual curation step.
1.3.2 Software for genome-scale metabolic modelling
Due to the successful application of GSMs to investigate cellular metabolism, a
large number of software packages have been developed to aid and speed up the

Chapter 1
10
construction of new GSMs, thereby alleviating much of the manual effort previously
required. Features of these platforms have been extensively reviewed elsewhere
(Hamilton and Reed, 2014; Koussa et al., 2014; Lakshmanan et al., 2014; Martins
Conde et al., 2016). Here, I only discuss two software packages used in the thesis
work, which are Constraint-based reconstruction and analysis (COBRA; Becker et
al., 2007) and ScrumPy (Poolman, 2006).
COBRA methods are currently widely used in the field of genome-scale meta-
bolic modelling. The COBRA toolbox developed on MATLAB and also available
as a package for (Ebrahim et al., 2013) Python provides a high-level interface to a
variety of methods for constraint-based modelling of GSMs. Detailed documenta-
tions of COBRA are available at https://opencobra.github.io/. The structural
analyses of the Arabidopsis metabolic models in this study was performed using
COBRA toolbox.
ScrumPy is a metabolic modelling software package written in Python pro-
gramming language (Poolman, 2006). For detailed instructions of ScrumPy and its
usage, it is available from the main ScrumPy website
(http://mudshark.brookes.ac.uk/index.php/Software/ScrumPy). In this thesis work,
the construction of a genome-scale metabolic model of tomato and the subsequent
constraint-based analysis were carried out using ScrumPy.
1.3.3 Applications of GSMs
More and more GSMs have been reconstructed over the last decade (Kim et al.,
2012). These models have guided research in a variety of ways, including (1) con-
textualize high-throughput data (Lakshmanan et al., 2015; Mohanty et al., 2016),
(2) guide metabolic engineering (Basler et al., 2016), (3) direct hypothesis-driven
discovery, (4) interrogate multispecies relationships (de Oliveira Dal’Molin et al.,
2015), (5) analyze biological network properties (Oberhardt et al., 2009; McCloskey
et al., 2013) and (6) predict cellular phenotypes (Lakshmanan et al., 2013; Simons
et al., 2014; Seaver et al., 2015). In addition, GSMs allow integrating additional
data such as transcriptomics and proteomics data sets, which together with bioinfor-
matics approaches can support a better understanding of metabolic behavior in
plants (Töpfer et al., 2013). Altogether, these studies have established mechanistic
understandings of genotype–phenotype relationships and metabolic characteristics
of cellular metabolism, at a genome-scale level.

Introduction
11
1.4 Organization of this thesis
As mentioned earlier, the growth, yield and fruit quality of tomato can be affected
by several environmental factors. To better understand the cellular behavior under
drought and varying light conditions, this thesis aims to develop an in silico model
to characterize tomato’s metabolic behavior. In addition, the impact of the model-
ling parameters such as the biomass compositions and maintenance in flux-balance
modelling of plant metabolism was assessed. The remainder of this thesis is orga-
nized as follows:
Chapter 2 describes how flux solutions predicted by FBA are sensitive to the
biomass composition and model structure. The analyses are applied to Arabidopsis
which is the best-investigated plant model organism. We found that the structure of
the metabolic model has a large impact on FBA predictions in comparison with the
biomass composition. This chapter also provides a succinate review of the existing
plant GSMs.
Chapter 3 describes the reconstruction of the first genome-scale metabolic
model of tomato using ScrumPy. The model is then tested by comparing the activity
of well characterized pathways in silico with biochemical evidence in the literature.
In Chapter 4, the reconstructed tomato model described in Chapter 3 is applied
to characterize the metabolic behaviors of leaves for photorespiration and other rel-
evant metabolic processes under drought conditions. The essential
reactions/enzymes under both normal and drought conditions are also presented.
Chapter 5 describes the extension of the tomato model to a light-specific model
by incorporating the light-driven photophosphorylation reactions in a wavelength-
specific manner. The model is then used to investigate how changes in light intensity
and quality affect cellular growth and how the energy ATP and the reducing equavi-
lant NADPH is regulated accordingly. Moreover, the model is applied to evaluate
the light source efficiency.
Chapter 6 summarizes the main contributions made in this thesis and discusses
potential extensions of the present work.


Chapter 2 Flux balance analysis of
plant metabolism: the effect of
biomass composition and model
structure on model predictions1
1 This chapter has been published:
Yuan, H., Cheung, C.Y.M., Hilbers, P.A.J. and van Riel, N.A.W. (2016) Flux
balance analysis of plant metabolism: the effect of biomass composition and
model structure on model predictions. Front. Plant Sci.7, 537.

Abstract
The biomass composition represented in constraint-based metabolic models is a key
component for predicting cellular metabolism using flux balance analysis (FBA).
Despite major advances in analytical technologies, it is often challenging to obtain
a detailed composition of all major biomass components experimentally. Studies
examining the influence of the biomass composition on the predictions of metabolic
models have so far mostly been done on models of microorganisms. Little is known
about the impact of varying biomass composition on flux prediction in FBA models
of plants, whose metabolism is very versatile and complex because of the presence
of multiple subcellular compartments. Also, the published metabolic models of
plants differ in size and complexity. In this chapter, we examined the sensitivity of
the predicted fluxes of plant metabolic models to biomass composition and model
structure. These questions were addressed by evaluating the sensitivity of predic-
tions of growth rates and central carbon metabolic fluxes to varying biomass
compositions in three different genome-/large-scale metabolic models of Arabidop-
sis thaliana. Our results showed that fluxes through the central carbon metabolism
were robust to changes in biomass composition. Nevertheless, comparisons between
the predictions from three models using identical modelling constraints and objec-
tive function showed that model predictions were sensitive to the structure of the
models, highlighting large discrepancies between the published models.

Sensitivity in plant metabolic models
15
2.1 Introduction
Flux balance analysis (FBA), a constraint-based modelling approach, is widely used
in predicting metabolic fluxes based on stoichiometric metabolic models, in partic-
ular, large-scale or genome-scale metabolic models (GSMs) (Orth et al., 2010).
Stoichiometric metabolic models are typically underdetermined because the number
of reactions in the model is usually larger than the number of metabolites (Bonarius
et al., 1997; Kauffman et al., 2003). Therefore, in most cases, constraint-based anal-
ysis yields multiple feasible flux solutions. To narrow down the space of feasible
solutions, additional constraints can be imposed by specifying the range of fluxes
through any particular reaction. In addition to the application of constraints, an ob-
jective function is usually defined for identifying biologically relevant flux
solutions. The most commonly used objective function for FBA is the biomass ob-
jective function (BOF), which is to maximize the efficiency of biomass production,
i.e. growth rate (Feist and Palsson, 2010). Biomass production is mathematically
represented by a so called ‘biomass reaction’ which, in essence, is a collection of all
individual biomass constituents together with their fractional contributions to the
overall cellular biomass, and energetic requirements for the biomass generation.
Knowledge of the biomass composition is crucial for predicting flux distribu-
tion in metabolic models using FBA because the intracellular fluxes are dependent
on the fluxes contributing to biomass synthesis (Pramanik and Keasling, 1997;
Schwender and Hay, 2012). Therefore, an important consideration during the devel-
opment of GSMs is to define the biomass composition, ideally for the condition
under study. Experimental evidence indicates that the biomass composition varies
between species, cell types and physiological conditions (Novák and Loubiere,
2000; Hay and Schwender, 2011). However, due to a lack of organism-specific
and/or condition-specific experimental information, the biomass compositions used
in plant GSMs are often collected from diverse types of measurements, experiments,
research groups, and even different cell types and plant species (Collakova et al.,
2012).
Some computational methods have been developed to estimate the fractional
contribution of a precursor to the biomass reaction in microorganisms, e.g. calculat-
ing the coefficients of deoxy-nucleotide triphosphates (dNTPs) and nucleotide
triphosphates (NTPs) according to the fraction of DNA and RNA (Orth et al., 2010;
Thiele and Palsson, 2010). Nevertheless, these approaches can only be used for
amino acids, NTPs (ATP, GTP, CTP, UTP), and dNTPs (dATP, dGTP, dCTP,

Chapter 2
16
dTTP). Given the existence of multiple organelles in plants, one needs to be cautious
when applying these approaches to plant models.
With the increasing use of network reconstructions and constraint-based ap-
proaches, a need has arisen to clearly define and demonstrate the relevance of the
modeling parameters, such as biomass composition, for predicting metabolic fluxes.
Work examining the influence of the biomass composition on the predicted fluxes
has mostly been done on models of microorganisms, in particular E. coli (Pramanik
and Keasling, 1997; Feist et al., 2007). Most recently, a sensitivity analysis of a
yeast model suggested that model predictions are sensitive to variations in biomass
composition (Dikicioglu et al., 2015). These observations naturally lead to questions
about the sensitivity of flux predictions in plant metabolic networks to biomass com-
position and the robustness of plant metabolic models. Thus far, there are very
limited studies exploring the effects of changes in biomass composition on the flux
distributions in plants. Plant metabolic networks are significantly more complex
than those of microorganisms due to the presence of multiple compartments and
parallel metabolic pathways. A study on a model of oilseed rape suggested that flux
predictions are sensitive to the contents of oil and protein, which are the major stor-
age components in oil seed (Schwender and Hay, 2012). However, in a study of
Arabidopsis heterotrophic cell culture, central carbon metabolism has been ob-
served to be robust to different conditions despite the significant differences in the
resulting biomass compositions (Williams et al., 2010). Given that plants are
adapted to grow in diverse environmental conditions, plant metabolism is expected
to be flexible in face of perturbations. Thus, it deserves theoretical exploration on
basis of constraint-based metabolic models to assess the influence of changing bio-
mass composition on predicted fluxes.
Arabidopsis, a model organism for plant biology, has been studied extensively
with systems-biology approaches. In this study, we started by reviewing the pub-
lished Arabidopsis metabolic models followed by an investigation of the impact of
changing the biomass composition on the flux predictions in large- or genome-scale
plant metabolic models, in particular, the fluxes through central metabolic pathways
(i.e. glycolysis, pentose phosphate pathway (PPP), TCA cycle, and mitochondrial
electron transport chain (ETC)). This is because these existing large-scale metabolic
networks of plants provided mostly qualitative predictions of intracellular fluxes for
primarily central carbon metabolism. Furthermore, previous work has shown that
fluxes of central carbon metabolism dominate the FBA results, with little to no flux
through the secondary metabolic pathways (Collakova et al., 2012). In this chapter,
we focused on study on three published models of Arabidopsis, which have different

Sensitivity in plant metabolic models
17
biomass compositions and network structures. We systematically evaluated the in-
fluence of biomass composition on the outcome of FBA simulations in three ways:
(1) using different biomass compositions with the same model; (2) using the same
biomass composition with different models; (3) varying individual components of
the biomass composition and maintenance cost. Our analyses indicate that i) the
central metabolic fluxes are relatively stable in face of varying biomass composi-
tion, regardless of model structure; and ii) the model structure is the main factor in
determining the variation in computational results generated by using FBA.
2.2 Methods
2.2.1 Stoichiometric models
In this study, we compared and investigated three published stoichiometric models
of Arabidopsis, denoted as Poolman (Poolman et al., 2009), AraGEM (de Oliveira
Dal’Molin et al., 2010a) and AraCore (Arnold and Nikoloski, 2014). The Systems
Biology Markup Language (SBML) format for the Poolman and AraCore model
were available from supplementary files of the corresponding paper. The direction
of the phenylpyruvate carboxylase reaction in the Poolman model has been cor-
rected as reported in their subsequent publication (Williams et al., 2010). For the
AraGEM model, an updated version was obtained from
http://web.aibn.uq.edu.au/cssb/resources/Genomes.html. In this study, we simu-
lated the cellular metabolism of Arabidopsis cells growing on glucose as carbon and
energy sources under aerobic heterotrophic conditions.
Although all major biomass components (i.e. cell wall, protein, lipid, carbohy-
drate, DNA and RNA) were taken into account in the three models via representative
metabolites or corresponding precursors, the biomass components included in these
three models are not exactly the same. For example, xylose and γ-aminobutyric acid
(GABA) were not considered in Poolman model, but were included in AraGEM and
AraCore models. Similarly, soluble metabolites were only considered in AraCore
model, but not in Poolman and AraGEM models. To keep the list of biomass com-
ponents as consistent as possible between the three models, we added some
additional biomass transporters to the models if required. It is noted that not all
newly added biomass components can be produced by all models, e.g. maltose, xy-
lose and GABA cannot be produced in Poolman model, coniferyl-alcohol,
coumaryl-alchol, sinapyl-alcohol and xylose cannot be produced by AraCore model
as these metabolites are not present in AraCore. Therefore, in this study, we only

Chapter 2
18
added new biomass components that can be produced by all the three Arabidopsis
models. In total, we added 9 new biomass transporters to Poolman model and 7 for
AraGEM (Appendix 2.6.1).
2.2.2 Biomass equations
The biomass compositions used in this study were extracted from previous studies,
hereafter referred to as PoolmanBOF, AraGEMBOF, and AraCoreBOF, corre-
sponding to the biomass composition used in Poolman, AraGEM and AraCore
model, respectively (Appendix 2.6.2). Since three condition-specific biomass com-
positions (reflecting carbon-limiting, nitrogen-limiting and optimal growth
conditions) have been employed in the AraCore model, here we chose the carbon-
limiting biomass reaction to represent AraCoreBOF. The original biomass compo-
sition of each model, together with the calculation of weight percentage of biomass
components (Figure 2.1) is provided in Appendix 2.6.2.
Due to the different units originally used in the three studies (mmol/g/L in
Poolman and mmol/g DW in AraGEM and AraCore), the biomass compositions
were normalized to enable a fair comparison. These calculations were performed by
weight, defining 1 unit of flux through the biomass equation equals to 1g of biomass.
The details of these calculations are provided in Appendix 2.6.2. Finally, we used
the normalized biomass equations to perform our model simulations.
2.2.3 Model simulations
FBA was used to determine the flux solutions at steady-state condition. All simula-
tions were performed using FBA in geometric mode (Smallbone and Simeonidis,
2009) as implemented in the COBRA toolbox (Becker et al., 2007) executed in
MATLAB (The MathWorks, version R2012a). Geometric FBA enables a unique
optimal solution that is central to the range of possible flux distributions. The Gurobi
Optimizer (http://www.gurobi.com, version 5.0.2) solver in combination with the
COBRA toolbox were used to solve the linear programming problems. In our study,
the biomass equation was maximized to obtain the optimal solution of the metabolic
model as described elsewhere (Orth et al., 2010a). Formally, the FBA problem can
be stated as follows:

Sensitivity in plant metabolic models
19
Maximize: 𝒗𝒈𝒓𝒐𝒘𝒕𝒉
GAM 1i
growth
ii
vBiomassc X
Subject to 𝑺𝒗 = 0
and 𝒗𝒎𝒊𝒏 ≤ 𝒗 ≤ 𝒗𝒎𝒂𝒙
where 𝒗𝒈𝒓𝒐𝒘𝒕𝒉 is the flux that the biomass reaction carries, representing growth rate,
𝑐 is the vector of biomass coefficients, whose component ci indicates the ratio of
metabolite Xi required for the formation of a unit of biomass, 𝑺 is the stoichiometric
matrix, 𝒗 is a vector of all reaction fluxes in the system, also referred to as the flux
distribution, 𝒗𝒎𝒊𝒏 and 𝒗𝒎𝒂𝒙 represent lower and upper bounds for the flux of each
reaction, respectively. GAM refers to growth associated maintenance.
Figure 2.1 Weight percentage of the biomass components. The original and modified (used for simulations) weight
percentage for each class of metabolites contributing to biomass synthesis is displayed. The composition is dis-
played for Poolman model (a), AraGEM model (b), and AraCore model (c). The calculations for each class of
metabolites are shown in Appendix 2.6.2.
To simulate the cellular behavior of Arabidopsis cells, we constrained the glu-
cose uptake rates at 10 flux units, which was the only source of carbon and energy.
AraCore represents a photoautotrophic cell, which does not have organic sources
for heterotrophic scenarios, but it can also be utilized to simulate heterotrophic con-
ditions by adapting the energy source (Arnold and Nikoloski, 2014). Consequently,

Chapter 2
20
we added an additional glucose exchange reaction ‘Im_Glc’ to AraCore model. Am-
monia (NH3) and hydrogen sulfide (H2S) were constrained to be utilized as the sole
N and S sources, respectively, because AraGEM and AraCore can only grow with
H2S and NH3 as the S and N sources, respectively. Since SO42- is the sole S source
in the Poolman model, it does not have an H2S transporter. We therefore added an
H2S transporter to Poolman model, namely ‘H2S_tx’, enabling H2S as sole sulfur
source in all models. Pi is the sole P source input in all three models. Additionally,
non-growth associated maintenance (NGAM) was included in all simulations with
a value of 2.02, which is a normalized flux unit referring to the value reported in
Poolman model (Appendix 2.6.2). Similarly, GAM was fixed at 53.26 flux units in
this study, which was scaled based on the value reported in AraGEM model. Im-
ported or exported metabolites are always freely exchangeable across the system
boundary to provide the necessary nutrients and remove secreted substances.
The biomass equation (i.e. BOF) is generated by defining all of the biomass
constituents, in which all the precursor metabolites are assembled in one single re-
action with corresponding coefficients (Feist and Palsson, 2010; Thiele and Palsson,
2010). For a fair comparison, we only considered the biomass components which
can be produced by all three models in the three biomass equations (Appendix
2.6.2). This results in new biomass compositions for AraGEM and AraCore models
because some biomass metabolites such as xylose and maltose that cannot be pro-
duced by all 3 models are not taken into account in our biomass reaction. The
modified weight percentages of biomass compositions that are included in our bio-
mass reactions differs slightly from the original ones for the three models (Figure
2.1).
To investigate the influence of biomass composition on the predicted fluxes,
we performed three scenarios in each model with the biomass equations of
PoolmanBOF, AraGEMBOF and AraCoreBOF, respectively. We replaced the co-
efficient of each biomass component in the biomass equation with the corresponding
values in the other two models. In total, 9 scenarios were simulated in the study,
namely ‘Poolman-PoolmanBOF’, ‘Poolman-AraGEMBOF’, ‘Poolman-AraCore-
BOF’, ‘AraGEM-PoolmanBOF’, ‘AraGEM-AraGEMBOF’, ‘AraGEM-
AraCoreBOF’, ‘AraCore-PoolmanBOF’, ‘AraCore-AraGEMBOF’, and ‘AraCore-
AraCoreBOF’. To assess the differences between predicted fluxes obtained from
different scenarios, we define the biomass composition given in each model as the
‘reference’ scenario. Thus, ‘Poolman-PoolmanBOF’, ‘AraGEM-AraGEMBOF’,
and ‘AraCore-AraCoreBOF’ are the ‘reference’ scenarios in Poolman, AraGEM,
and AraCore model, respectively.

Sensitivity in plant metabolic models
21
To confirm the confidence of the predictions, flux variability analysis (FVA)
was conducted for the 9 model-biomass combinations, which determines the range
of possible solutions for each reaction while giving rise to the same optimal value
for the objective function (Mahadevan and Schilling, 2003).
2.3 Results
2.3.1 Comparisons between plant flux-balanced models
Origins and uses of biomass compositions in plant flux-balanced models
To understand how the biomass composition data is obtained in published metabolic
models, we surveyed the source of data used in formulating biomass equations in
the existing large-scale metabolic models of plants (Table 2.1). From the survey, it
was verified that only 5 out of 21 models had their biomass compositions measured
by the research group that constructed the model, whereas, the remaining 16 studies
either do not include any biomass information or adopted from other research
groups, some of which were from other organisms. Furthermore, within the sur-
veyed plant metabolic networks, 6 of 21 (29%) used biomass data as the objective
function, 11 of 21 (52%) used biomass data as constraints, whereas the rest did not
perform any FBA simulations.
General properties of published Arabidopsis flux-balanced models
To investigate the variability of the biomass compositions and structure of the mod-
els for the same species, we chose Arabidopsis since eight metabolic models were
published since 2009. The general statistics of the available Arabidopsis models to
date is summarised in Table 2.2. In general, we observed an increase in the number
of genes, metabolites, reactions and transporters included in Arabidopsis metabolic
models over time, but this increase was not uniform. For example, the number of
metabolites and reactions in the model of Mintz-Oron et al. (2012) is much larger
than that of AraGEM (de Oliveira Dal’Molin et al., 2010a), but the latter has more
genes than the former. Towards the compartmentalization, the organelles included
in each model are relatively invariant over time. The various Arabidopsis genome-
scale models were reviewed more extensively elsewhere (Collakova et al., 2012; de
Oliveira Dal’Molin and Nielsen, 2013; Baghalian et al., 2014; Arnold et al., 2015).

Chapter 2
22
Table 2.1 Summary of the origin of biomass data in the existing large-scale metabolic models of plants.
Besides the general statistics, these models differ in several aspects, for in-
stance, the inclusion of cellular maintenance costs (Table 2.3). The models are quite
different regarding cell maintenance, because its experimental quantification is a
major challenge (Sweetlove et al., 2013).
Species No. Model Biomass composition data Biomass
used as
Arabidopsis
(Arabidopsis
thaliana)
1 Poolman et al.,
2009 Experimental Constraint
2
de Oliveira
Dal’Molin et al.,
2010a
Literature Guinn, 1966; Poorter and Bergkotte, 1992;
Niemann et al., 1995) Constraint
3 Radrich et al., 2010 No biomass No
simulation
4 Saha et al., 2011
Literature (Spector, 1956; Muller et al., 1970; Pen-
ning de Vries et al., 1974 ; Wedig et al., 1987) or
other related organisms
No
simulation
5 Mintz-Oron et al.,
2012
Literature (Weise et al., 2000; Reinders et al., 2005;
Poolman et al., 2009; de Oliveira Dal’Molin et al.,
2010a)
No
simulation
6 Chung et al., 2013 No biomass No
simulation
7 Cheung et al., 2013 Experimental Constraint
8 Arnold and
Nikoloski, 2014
Literature (Döermann et al., 1995; Sharrock and
Clack, 2002; Mooney et al., 2006; DeBolt et al.,
2009; Tschoep et al., 2009; Pyl et al., 2012; Sulpice
et al., 2013)
Objective
Barley
(Hordeum vul-
gare)
9 Grafahrend-Belau
et al., 2009 Literature (OECD, 2004) Objective
10 Grafahrend-Belau
et al., 2013
Literature (Antongiovanni and Sargentini, 1991;
Bonnett and Incoll, 1993a,b)
Constraint
Rapeseed
(Brassica
napus)
11 Hay and
Schwender, 2011
Biomass macromolecules determined experimen-
tally, the composition of biomass macromolecules
obtained from literature (Katterman and Ergle, 1966;
Norton, 1989; Schwender and Ohlrogge, 2002; Town
et al., 2006)
Constraint
12 Pilalis et al., 2011 Literature (Schwender et al., 2004; Schwender et al.,
2006) Objective
Maize
(Zea mays)
13
de Oliveira
Dal’Molin et al.,
2010b
Literature (Guinn 1966; Poorter et al.,1992; Niemann
et al., 1995) Constraint
14 Saha et al., 2011
Literature (Spector, 1956; Muller et al., 1970; Pen-
ningd et al., 1974; Wedig et al., 1987) or other
related organisms
Objective
15 Simons et al., 2014 Experimental Objective
Sorghum
(Sorghum
bicolor)
16
de Oliveira
Dal’Molin et al.,
2010b
Literature (Guinn, 1966; Poorter and Bergkotte,
1992; Niemann et al., 1995) Constraint
Sugarcane
(Saccharum
officinarum)
17
de Oliveira
Dal’Molin et al.,
2010b
Literature (Guinn, 1966; Poorter and Bergkotte,
1992) Constraint
Rice
(Oryza
sativa)
18 Poolman et al.,
2013 Literature (Juliano, 1985; Kwon and Soh, 1985) Constraint
19 Lakshmanan et al.,
2013 Literature (Juliano, 1985; Edwards et al., 2012) Objective
Tomato
(Solanum
lycopersicum)
20 Colombié et al.,
2015 Experimental Constraint
21 Yuan et al., 2016
Literature (Sheen, 1983; Roessner-Tunali et al.,
2003; Schauer et al., 2005; Nunes-Nesi et al., 2007;
Sánchez-Rodríguez et al., 2010; EI-Sayed, 2013)
Constraint

Sensitivity in plant metabolic models
23
Three Arabidopsis models have different biomass compositions
Poolman, AraGEM and AraCore models each use a different biomass composition
to simulate cell growth. Although the relative amounts of each biomass component
for all three models were derived from experimental data, they relied entirely on
different sources. Poolman model used measurements from their own group for
modelling a heterotrophic cell culture, while, AraGEM and AraCore used data for
various tissues for Arabidopsis or related species. As a further comparison, we ana-
lysed the macromolecular compositions for each model (Appendix 2.6.2), finding
the three models differ significantly in the composition of biomass macromolecules
(Figure 2.1). In Poolman model, cell wall comprised more than half of cell biomass.
In contrast, cells contain higher amounts of protein in AraGEM and AraCore model.
Experimental evidence indicates that the distributions of biomass components are
very tissue-specific (Mueller et al., 2003). One would expect that the biomass com-
positions of AraGEM and AraCore to be similar as both models represent
photosynthetic leaf cells. While there are some similarities in terms of the propor-
tions of cell wall, carbohydrate and protein, there are also major differences. For
example, the proportion of lipid in AraCore biomass is much larger than in AraGEM
biomass (18.4% versus 1.1%). This could be explained by the fact that biomass data
in AraGEM model is collected from different organisms.
Differences in central metabolism between the three Arabidopsis models
Going beyond merely comparing general network characteristics, we compared the
models at the individual reaction level, concentrating on the compartmentation and
reversibility of reactions in central carbon metabolism, which is an essential biolog-
ical process to sustain growth and biomass synthesis (Appendix 2.6.3). We focused
on three and biomass synthesis (Appendix 2.6.3). We focused on three Arabidopsis
models, Poolman, AraGEM and AraCore models, which have distinct model struc-
tures and biomass compositions. Generally, the three models covered all the listed
central metabolic reactions (Appendix 2.6.4). Compared with the other two models,
AraGEM did not include PPi-dependent phosphofructokinase (EC 2.7.1.90),

Chapter 2
24
Table 2.2 Structure comparison of the reconstructed metabolic models for Arabidopsis.
Symbol ‘-‘indicates information is unknown; ‘a’ indicates information is extracted from the original models, ‘b’ indicates information is retrieved from papers. Exchange reactions
allow for exchange of specific metabolites with the extracellular space. Transporters indicate metabolites can move between intracellular organelles. ‘c’, cytosol; ‘m’, mitochon-
dria; ‘p’, plastid; ‘x’, peroxisome; ‘v’, vacuole; ‘g’, Golgi; ‘e’, endoplasmic reticulum.
Reference Abbreviation Year Organelles Number of
genes
Number of
metabolites
Number of
reactions
Number of
exchange reactions
Number of intracellular
transporters
Poolman et al. (2009) Poolman[a] 2009 2
(c,m) Not available 1,253 1,406 42 -
de Oliveira Dal’Molin et al. (2010) AraGEM[a] 2010 5
(c,m,p,x,v) 1,419 1,737 1,601 18 81
Radrich et al. (2010) Radrich[a] 2010 - 1,571 2,328 2,315 - -
Saha et al. (2011) iRS1597[a] 2011 5
(c,m,p,x,v) 1,597 1,820 1,844 18 81
Mintz-Oron et al. (2012) Mintz-Oron[a] 2012 7
(c,m,p,x,v,g,e) 1,223 2,930 3,508 101 772
Chung et al. (2013) iAT1475[b] 2013 4
(c,m,p,x) 1,475 1,761 1,895 22 86
Cheung et al. (2013) Cheung[a] 2013 5
(c,m,p,x,v) 2,857 2,739 2,769 20 192
Arnold and Nikoloski, 2014 AraCore[a] 2014 4
(c,m,p,x) 634 407 549 98 124

Sensitivity analysis of plant metabolic models
25
Table 2.3 Network characteristics and FBA simulations in Arabidopsis GSMs.
‘PoolmanBOF’ indicates the biomass objective function included in the Poolman model; ‘AraGEMBOF’ indicates
the biomass objective function included in the AraGEM model; ‘AraCoreBOF’ indicates the biomass objective
function included in the AraCore model. GAM, growth associated maintenance; NGAM, non-growth associated
maintenance. [a]5 objective functions are minimization of overall flux, maximization of biomass, minimization of
glucose consumption, maximization of ATP production and maximization of NADPH production.
NADP-dependent non-phosphorylating glyceraldehyde-3-phosphate dehydrogen-
ase (EC 1.2.1.9) or NAD-dependent 6-phosphogluconate dehydrogenase (EC
1.1.1.343). Moreover, AraGEM uses two lumped reactions to represent the electron
transport chain (ETC) reactions, which are referred to as alternative oxidase path-
way (AOX) and cytochrome C oxidase pathway (COX). In contrast, Poolman and
AraCore models incorporate separate reactions to describe the ETC. Beyond these
differences, the localization and directionality of central metabolic reactions in the
three models are not always consistent. For example, the reaction catalyzed by phos-
phoenolpyruvate carboxylase (EC 4.1.1.31) in Poolman model operates in the
opposite direction compared to other two models, which was corrected in a subse-
quent publication (Williams et al., 2010). For AraCore, some reactions known to be
reversible, such as aconitase (EC 4.2.1.3) and fumarase (EC 4.2.1.2), are set as irre-
versible. Poolman model is not fully compartmentalized, so most of the reactions
involved in central carbon metabolic pathways are assigned to the cytosol.
Items
Model Cell type
Model
format
Cell
maintenance
Objective
function
BOF
included
Poolman Heterotrophic ScrumPy &
SBML NGAM Minimize total flux PoolmanBOF
AraGEM Photosynthetic &
Heterotrophic SBML GAM
Minimize photon/su-
crose uptake of
growth rate
AraGEMBOF
Radrich Unknown SBML Not included Not included Not included
iRS1597 Photosynthetic &
Heterotrophic Excel GAM Maximize biomass AraGEMBOF
Mintz-Oron Photosynthetic &
Heterotrophic SBML GAM
Minimize metabolic
adjustment (MOMA) AraGEMBOF
iAT1475 Photosynthetic &
Heterotrophic Excel GAM
Maximize IPP
production AraGEMBOF
Cheung Photosynthetic &
Heterotrophic
ScrumPy &
SBML GAM & NGAM
5 objective
functions[a]
Biomass as
constraints
AraCore Photosynthetic &
Heterotrophic SBML Not included
Maximize biomass &
energy efficiency AraCoreBOF

Chapter 2
26
2.3.2 The impact of biomass composition and model structure on
central metabolic fluxes
Central carbon metabolism is robust to changes in biomass compositions
To test the sensitivity of FBA solutions to the biomass composition, nine scenarios
described in the Methods section were simulated with three flux-balanced metabolic
models of Arabidopsis, Poolman, AraGEM and AraCore models, in combination
with their respective biomass compositions. The maximization of growth rate is
used as the objective function subjecting to mass-balance constraints, and setting
the glucose uptake rates as 10 flux units (section 2.2.3 Model simulations). In par-
ticular, we analysed how central metabolic reactions listed in Appendix 2.6.4
respond to a change in biomass composition. The results are illustrated in Figure 2
in which the differences in color intensity between columns (compare horizontally)
reflects the differences in flux values of each reaction calculated by the three bio-
mass compositions. It can be seen that for the majority of the reactions, in particular
the glycolytic reactions, the flux patterns were very similar. This indicates a high
stability of the central carbon metabolism in Arabidopsis with respect to biomass
composition, regardless of model structures.
Some reactions showed larger flexibility in our predictions. The flux distribu-
tion predicted by AraCore model with AraGEMBOF resulted in flux through 2-
oxoglutarate dehydrogenase reaction (reaction 17), a reaction belonging to the TCA
cycle, whereas this reaction did not carry flux with PoolmanBOF and AraCoreBOF.
The flux distributions through the TCA cycle reflect the function of the metabolic
network, and its operation largely depends on the cell type and the considered phys-
iological context (Sweetlove et al., 2010). In addition, 2-oxoglutarate (2-OG) is an
essential intermediate for the biosynthesis of amino acids such as glutamine and
glutamate (Appendix 2.6.3). Given that AraGEMBOF contains a much higher
amount of glutamine and glutamate (Appendix 2.6.2), itit is not surprising that 2-
oxoglutarate dehydrogenase reaction carried non-zero flux implemented with Ar-
aGEMBOF in AraCore model. For AraGEM model, the biomass composition
greatly affected the fluxes through glyceraldehyde-3-phosphate dehydrogenase (EC
1.2.1.9/1.2.1.12; reaction 7 and 8), phosphoglyate kinase (EC 2.7.2.3; reaction 9),
phosphoglycerate hydratase (EC 4.2.1.11; reaction 11), pyruvate kinase (EC
2.7.1.40; reaction 12) and malate dehydrogenase (EC 1.1.1.37; reaction 21). For ex-
ample, the use of PoolmanBOF on the AraGEM model gave rise to higher fluxes
through malate dehydrogenase compared to using AraGEMBOF, which is due to a

Sensitivity in plant metabolic models
27
Figure 2.2 Flux maps of central carbon metabolism predicted from three Arabidopsis models: Poolman model,
AraGEM model and AraCore model. Fluxes were predicted using three different biomass compositions in each
model: PoolmanBOF, the biomass composition included in Poolman model; AraGEMBOF, biomass composition
included in AraGEM model; AraCoreBOF, biomass composition included in AraCore model. Each reaction is
numbered, referencing Appendix 2.6.4, and the color intensity of each box corresponds to the flux value (mmol g-
1 DW hr-1) for the respective labeled reaction in each scenario. The results calculated by different biomass compo-
sitions with the same model can be interpreted by comparing between columns (compare horizontally). The results
calculated by the same biomass composition with different models can be interpreted by comparing between rows
(compare vertically). DW, Dry cell weight. Metabolite abbreviations are as follows: GLC, glucose; 2-OG, 2-ox-
oglutarate; 3-PGA, 3-phosphoglycerate; 2-PG, 2-phosphoglycolate; G6P, glucose-6-phosphate; F6P, fructose-6-
phosphate; 6PGL, 6-phosphogluconolactone; 6PG, 6-phosphogluconate; Ru5P, ribulose-5-phosphate; R5P, ribose-
5-phosphate; X5P, xylulose-5-phosphate; S7P, sedoheptulose-7-phosphate; E4P, erythrose-4-phosphate; FBP,
fructose-1,6-biphosphate; DHAP, dihydroxyacetone phosphate; DPG, glycerate-1,3-bisphosphate; PEP, phosphoe-
nol pyruvate; OAA, oxalacetic acid; GAP, glyceraldehyde-3-phosphate; 2-PGA, 2-phosphoglycerate; Pyr,
pyruvate; Cit, citrate; IsoCit, threo-isocitrate; Suc, succinate; SucCoA, succinyl-CoA; Fum, fumarate; Mal, malate;
QH2, ubiquinone; Q, ubiquinol; Cytred, cytochrome reduced; Cytox, cytochrome oxidized; Fdred, ferredoxin reduced;
Fdox, ferredoxin oxidized.

Chapter 2
28
reaction cycle that malate dehydrogenase involves in with PoolmanBOF. Com-
monly, the great changes occurred at the branch points of glycolysis and the TCA
cycle, where there were drains for the synthesis of cellular constituents. Under het-
erotrophic conditions, it is generally thought that the oxidative PPP (OPPP)
predominately provides reducing power for the production of biomass, in particular
for fatty acid synthesis. As a result, we would expect the OPPP reactions to be active
in our simulations. However, OPPP reactions carried no flux in any of the predicted
solutions of Poolman and AraGEM model. Interestingly, for AraCore model, using
AraGEMBOF resulted in small flux through OPPP reactions such as glucose 6-
phosphate (EC 1.1.1.49; reaction 22), 6-phosphogluconolactonase (EC 3.1.1.31; re-
action 23) and 6-phosphogluconate dehydrogenase (EC 1.1.1.44/1.1.1.343; reaction
24, 25). Previously, Williams et al. (2010) showed that the OPPP was poorly pre-
dicted by Poolman model, which was suggested to be caused by the error in
assigning the reversibility of the NADP+-dependent glyceraldehyde-3-phosphate
dehydrogenase (EC 1.2.1.13) (Cheung et al., 2013).
Model structure has a large impact on model predictions
Furthermore, we assessed the effects of model structures on the flux predictions by
comparing the model predictions from the same biomass equation with different
models (Figure 2.2, comparisons between rows; compare vertically). It is apparent
that the vast majority of central metabolic reactions carried different fluxes from
each other, despite the application of identical biomass composition and boundary
constraints. For example, the hexokinase reaction (reaction 1), which converts glu-
cose to glucose-6-phosphate for entry into glycolysis, carried significantly different
fluxes in three Arabidopsis models, irrespective of the biomass equation used. Based
on 10 flux units of glucose, the Poolman model produces 2.84 units of biomass by
using the biomass equation of Poolman model (i.e. PoolmanBOF), while the models
of AraGEM and AraCore synthesize 1.53 and 1.42 biomass units respectively. Sim-
ilarly, Poolman model yields the highest biomass by using AraGEMBOF and
AraCoreBOF (2.40 and 2.12 flux units, respectively), while, AraGEM generates the
lowest biomass (1.29 and 1.13 flux units, respectively; Figure 2.2). This indicates
that the Poolman model predicts more efficient conversion of glucose into biomass
compared to the other two models. Overall, model structure has a large impact on
the model prediction made with FBA, which highlights the importance of the quality
of metabolic models on the variation of model predictions.
To quantify the variation of fluxes in face of changing biomass composition
and model structure, we calculated the standard deviation, a robust measure for the

Sensitivity in plant metabolic models
29
dispersion within a set of data, for each reaction fluxes that were predicted from
nine model-biomass equation combinations. We then compared the median of the
standard deviation (Appendix 2.6.5). The medians of the standard deviations of re-
action fluxes for the cases with the same biomass composition but different models
(4.59, 3.35 and 3.22 for PoolmanBOF, AraGEMBOF and AraCoreBOF combina-
tions, respectively) were systematically higher than that of simulations with the
same metabolic network (0.29, 0.53 and 1.98 for Poolman, AraGEM and AraCore
combinations). This indicates that the predicted fluxes were considerably more dis-
persed when using different models, despite of the same biomass equation, revealing
that model structure has a larger impact on the FBA predictions.
For further confirmation, FVA was performed to examine the flux capacity for
each reaction under the 9 model-biomass combinations (Appendix 2.6.6). FVA
analysis showed that 10 of 33 considered reactions (pyruvate dehydrogenase, reac-
tion 13; citrate synthase, reaction 14; succinate thiokinase, reaction 18; complex II,
reaction 19; glucose 6-phosphate dehydrogenase, reaction 22; 6-phosphogluco-
nolactonase, reaction 23; ribulose-phosphate 3-epimerase, reaction 26; ribulose 5-
phosphate epimerase, reaction 27; transketolase 1, reaction 28; and transketolase 2,
reaction 29) have non-overlapping flux variability ranges in the compared scenarios
and agreed with the FBA analysis. However, the rest have a large range of possible
flux values in, at least one of considered scenarios, resulting in overlapping flux
variability ranges in the compared scenarios, which are not comparable.
Robustness of growth rate predictions with respect to changes in individual
biomass component and maintenance cost
From Figure 2.2, we observed that growth rate is not sensitive to the biomass com-
position. Considering the biomass objective function is the employed objective in
this study, which is the most commonly used objective for FBA (Feist and Palsson,
2010), we further analysed the impact of changing the fractional contribution of
each single biomass component on the growth rates with the ‘reference’ scenarios -
Poolman-PoolmanBOF, AraGEM-AraGEMBOF and AraCore-AraCoreBOF three
scenarios. The coefficient of each compound in the biomass equation was inde-
pendently varied 30% up or down (this value referred to Pinchuk et al., 2010) in
each ‘reference’ scenario, while the composition of the rest of the biomass compo-
nents was kept unchanged. The resulting model predictions of the growth rates were
compared with that of ‘reference’ biomass equation. Overall, our analyses showed
that the predicted growth rates were not sensitive to changes in the ratios of biomass

Chapter 2
30
components. For instance, growth rates in AraGEM and AraCore models were al-
tered by, at most, 4% and 6%, respectively (Appendix 2.6.7). The only exception is
in the Poolman model where a 30% decrease or increase of the composition of cell
wall led to 19.9% and 14.3% variation in growth rate, respectively (Appendix 2.6.7).
This discrepancy is not unexpected as cell wall is the largest part (66.6%) of the
overall biomass composition in the Poolman model (Figure 2.1).
Our analysis preferentially revealed that growth rate has a larger change at
higher coefficient in terms of C atom. Given that glucose, which is the carbon and
energy source, was used as the limiting nutrient in the analyses in this study, we
would expect growth rate correlates to the fractional coefficient of C atom. To quan-
tify this effect, we calculated the Pearson correlation coefficient (PCC), a measure
of the linear dependence between two variables, for all predicted growth rates sim-
ulated by decreasing and increasing of each single biomass component by 30%
(Appendix 2.6.8). We also calculated the correlation coefficients between changes
in growth rate and the coefficient in terms of weight (Appendix 2.6.9). We found
that the correlations among the coefficient in terms of weight were systematically
similar to the observed correlations among the coefficient in terms of C atoms (Ap-
pendix 2.6.8), indicating that when the fractional contribution of C atoms were
altered, the growth rates were increased or decreased in a synchronized fashion.
In addition to the structure of the metabolic network and biomass composition,
the in silico growth rate can also be influenced by the maintenance cost, i.e. GAM
and NGAM. Therefore, we evaluated the influence of maintenance on the predicted
growth rates with three ‘reference’ scenarios characterized by constraints on: (i) no
maintenance, (ii) sole GAM, (iii) sole NGAM, and (iv) GAM and NGAM. We then
compared the growth rates of scenario (i), (ii) and (iii) with that of scenario (iv),
separately. The analyses showed that the influence of maintenance parameters var-
ies with the used model. The exclusion of GAM and/or NGAM changes the growth
rate by, at most, 29.6% and 1.3% in AraGEM model and AraCore model, respec-
tively (Appendix 2.6.10). Given that AraGEM and AraCore models describe the
ETC reactions quite differently (section 2.3.1), it is unsurprising to observe large
discrepancies between the influences of maintenance cost on growth rate predictions
for these two models. It is worth mentioning that the growth rate predicted from the
Poolman model did not change with the maintenance, which is biologically implau-
sible. This is because there exist futile cycles in Poolman model (Arnold et al.,
2015).

Sensitivity in plant metabolic models
31
2.4 Discussion
In this chapter, we investigated the effect of biomass composition and model struc-
ture on steady-state flux predictions in the metabolic models of Arabidopsis.
Different combinations (3 models and 3 biomass equations) were tested to cover
multiple possibilities for biomass composition. Our results demonstrated that flux
predictions of the central metabolic network are fairly insensitive to changes in bi-
omass composition, regardless of the employed metabolic networks (Figure 2.2).
Biomass demands are a principal drive of the flux distributions in metabolic models,
therefore one would expect the flux distributions to be sensitive to changes in the
biomass composition. However, several experimental studies provided evidence
that central carbon metabolism is rather stable when the substrate source remains
unchanged (Rontein et al., 2002; Spielbauer et al., 2006; Junker et al., 2007; Willi-
ams et al., 2008; Williams et al., 2010). In a study of heterotrophic Arabidopsis cell
culture, fluxes through the central metabolic network measured by metabolic flux
analysis (MFA) were observed to be unchanged under different physiological con-
ditions, despite under which the biomass composition altered (Williams et al.,
2008). Consistently, Spielbauer et al. (2006) found that flux distributions of central
carbon metabolism were stable in maize endosperm. Nonetheless, under conditions
with different substrates provided, the flux distribution in the central carbon metab-
olism altered significantly (Junker et al., 2007). The noticeable stability of central
carbon metabolism has been extensively demonstrated in many microorganism
studies (Pramanik and Keasling, 1997; Pramanik and Keasling, 1998; Feist et al.,
2007).
Our results also showed that 30% variations in individual biomass precursor
had a minor effect on the growth rates with Arabidopsis models (Appendix 2.6.7).
This observation is in agreement with the previously reported findings (Pramanik
and Keasling, 1998; Puchałka et al., 2008). Puchalka et al. (2008) reported that var-
ying a single biomass component by 20% up or down has a negligible effect (less
than 1%) on the growth rate. Due to the large number of macromolecules such as
protein and carbohydrate in the cell, it is not surprising that single biomass compo-
nent, which makes up the macromolecules did not significantly affect the growth
rate. However, in other studies, it was found that varying the macromolecular com-
position had considerable effect on the flux simulations (Feist et al., 2007; Nookaew
et al., 2008). Similarly, our analyses showed that the effect of maintenance cost on
growth rate was limited (Appendix 2.6.10), which contradicts previous results of E.
coli model that maintenance cost had larger impact on growth rate prediction (Feist
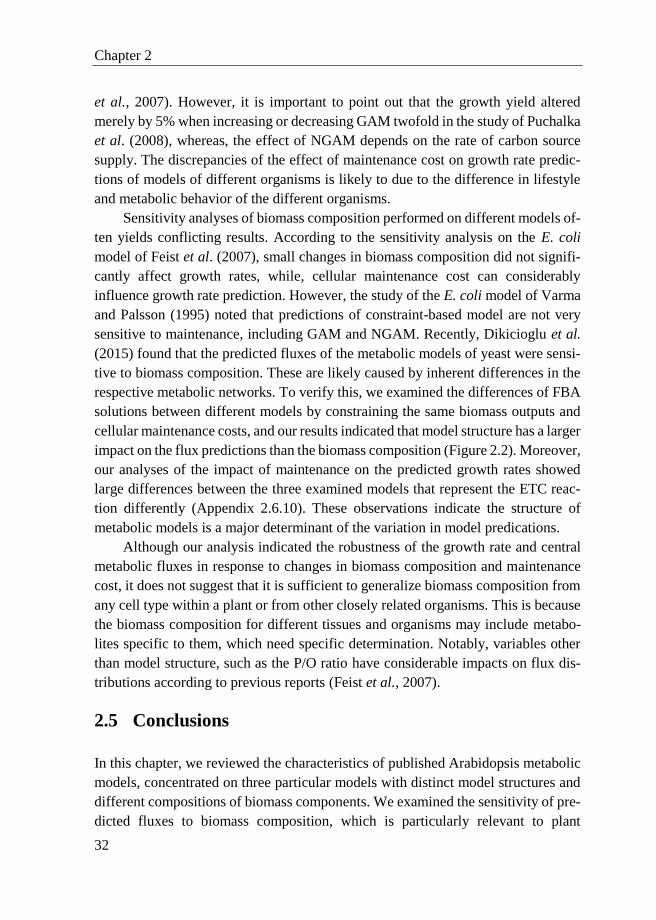
Chapter 2
32
et al., 2007). However, it is important to point out that the growth yield altered
merely by 5% when increasing or decreasing GAM twofold in the study of Puchalka
et al. (2008), whereas, the effect of NGAM depends on the rate of carbon source
supply. The discrepancies of the effect of maintenance cost on growth rate predic-
tions of models of different organisms is likely to due to the difference in lifestyle
and metabolic behavior of the different organisms.
Sensitivity analyses of biomass composition performed on different models of-
ten yields conflicting results. According to the sensitivity analysis on the E. coli
model of Feist et al. (2007), small changes in biomass composition did not signifi-
cantly affect growth rates, while, cellular maintenance cost can considerably
influence growth rate prediction. However, the study of the E. coli model of Varma
and Palsson (1995) noted that predictions of constraint-based model are not very
sensitive to maintenance, including GAM and NGAM. Recently, Dikicioglu et al.
(2015) found that the predicted fluxes of the metabolic models of yeast were sensi-
tive to biomass composition. These are likely caused by inherent differences in the
respective metabolic networks. To verify this, we examined the differences of FBA
solutions between different models by constraining the same biomass outputs and
cellular maintenance costs, and our results indicated that model structure has a larger
impact on the flux predictions than the biomass composition (Figure 2.2). Moreover,
our analyses of the impact of maintenance on the predicted growth rates showed
large differences between the three examined models that represent the ETC reac-
tion differently (Appendix 2.6.10). These observations indicate the structure of
metabolic models is a major determinant of the variation in model predications.
Although our analysis indicated the robustness of the growth rate and central
metabolic fluxes in response to changes in biomass composition and maintenance
cost, it does not suggest that it is sufficient to generalize biomass composition from
any cell type within a plant or from other closely related organisms. This is because
the biomass composition for different tissues and organisms may include metabo-
lites specific to them, which need specific determination. Notably, variables other
than model structure, such as the P/O ratio have considerable impacts on flux dis-
tributions according to previous reports (Feist et al., 2007).
2.5 Conclusions
In this chapter, we reviewed the characteristics of published Arabidopsis metabolic
models, concentrated on three particular models with distinct model structures and
different compositions of biomass components. We examined the sensitivity of pre-
dicted fluxes to biomass composition, which is particularly relevant to plant

Sensitivity in plant metabolic models
33
metabolic models for which the biomass data is often collected from various
sources. Our analysis showed that central metabolic fluxes as well as growth rates
were insensitive to the variations in biomass composition, but were significantly
affected by model structure. This work represents a thorough set of analyses per-
formed in plants by means of constraint-based modelling, thereby providing
relevant information about how critical FBA solutions can be affected by biomass
composition, and more importantly by the structure of the models. Despite differ-
ences in several aspects such as model structure and number of metabolites and
reactions included, each of the evaluated models has its own merits. Comparative
analysis of the models paves the way for exploring the existence of principles that
are relevant for the regulation and robustness of plant central carbon metabolism.
2.6 Appendix

Chapter 2
34
Appendix 2.6.1 Newly added transporters in three Arabidopsis models
Model ReactionID Reaction Name Reaction Equation Classification
Poolman GLC_bm_tx' Glucose biomass transporter GLC -> Biomass transporter
Suc_bm_tx' Sucrose biomass transporter SUCROSE -> Biomass transporter
'Fru_bm_tx' Fructose biomass transporter FRU -> Biomass transporter
'Trehalose_bm_tx' Trehalose biomass transporter TREHALOSE -> Biomass transporter
'Succinate_bm_tx' Succinate biomass transporter SUC -> Biomass transporter
'Fumarate_bm_tx' Fumarate biomass transporter FUM -> Biomass transporter
'Malate_bm_tx' Malate biomass transporter MAL -> Biomass transporter
'Shikimate_bm_tx' Shikimate biomass transporter SHIKIMATE -> Biomass transporter
'Urea_bm_tx' Urea biomass transporter UREA -> Biomass transporter
H2S_tx' H2S transporter -> HS Nutrient uptake
AraGEM 'Ornithine_bm_tx' Ornithine biomass transporter S_L_45_Ornithine[c] -> S_Ornithine_biomass Biomass transporter
'Trehalose_bm_tx' Trehalose biomass transporter S_alpha_44_alpha_45_Trehalose[c] -> S_Trehalose_biomass Biomass transporter
'Succinate_bm_tx' Succinate biomass transporter S_Succinate[c] -> S_Succinate_biomass Biomass transporter
'Fumarate_bm_tx' Fumarate biomass transporter S_Fumarate[c] -> S_Fumarate_biomass Biomass transporter
'Malate_bm_tx' Malate biomass transporter S__40_S_41__45_Malate[c] -> S_Malate_biomass Biomass transporter
'Shikimate_bm_tx' Shikimate biomass transporter S_Shikimate[c] -> S_Shikimate_biomass Biomass transporter
'Urea_bm_tx' Urea biomass transporter S_Urea[c] -> S_Urea_biomass Biomass transporter
AraCore 'Im_Glc' Glucose exchange -> Glc[c] Nutrient uptake

Sensitivity in plant metabolic models
35
Appendix 2.6.2 The calculation of the weight percentage of each biomass
constitute. Can be found online at: http://journal.frontiersin.org/arti-
cle/10.3389/fpls.2016. 00537
Appendix 2.6.3 Schematic representation of the central carbon metabolic
network and related metabolism.
Each reaction is numbered, referencing Appendix 2.6.4. Metabolite abbreviations are as follows: GLC, glucose; 2-
OG, 2-oxoglutarate; 3-PGA, 3-phosphoglycerate; 2-PG, 2-phosphoglycolate; G6P, glucose-6-phosphate; F6P, fruc-
tose-6-phosphate; 6PGL, 6-phosphogluconolactone; 6PG, 6-phosphogluconate; Ru5P, ribulose-5-phosphate; R5P,
ribose-5-phosphate; X5P, xylulose-5-phosphate; S7P, sedoheptulose-7-phosphate; E4P, erythrose-4-phosphate;
FBP, fructose-1,6-biphosphate; DHAP, dihydroxyacetone phosphate; DPG, glycerate-1,3-bisphosphate; PEP,
phosphoenol pyruvate; OAA, oxalacetic acid; GAP, glyceraldehyde-3-phosphate; 2-PGA, 2-phosphoglycerate;
Pyr, pyruvate; Cit, citrate; IsoCit, threo-isocitrate; Suc, succinate; SucCoA, succinyl-CoA; Fum, fumarate; Mal,
malate; QH2, ubiquinone; Q, ubiquinol; Cytred, cytochrome reduced; Cytox, cytochrome oxidized; Fdred, ferredoxin
reduced; Fdox, ferredoxin oxidized; BOF, biomass objective function; Ala, alanine; Arg, arginine; Asn, asparagine;
Asp, aspartate; Cys, cysteine; Gln, glutamine; Glu, glutamate; Gly, glycine; Ile, isoleucine; Leu, leucine; Lys, ly-
sine; Met, methionine; Phe, phenylalanine; Pro, proline; Ser, serine; Thr, threnine; Tyr, tyrosine; Val, valine.

Chapter 2
36
Appendix 2.6.4 Central carbon metabolic reactions included in three Ara-
bidopsis models. Can be found online at:
http://journal.frontiersin.org/article/10.3389/fpls.2016. 00537
Appendix 2.6.5 The calculation of the standard deviation for scenarios. Can
be found online at: http://journal.frontiersin.org/article/10.3389/fpls.2016.
00537
Appendix 2.6.6 FVA results. Can be found online at: http://journal.fron-
tiersin.org/article/10.3389/fpls.2016. 00537
Appendix 2.6.7 Influence of individual biomass component on the growth
rate. Can be found online at: http://journal.frontiersin.org/arti-
cle/10.3389/fpls.2016. 00537
Appendix 2.6.8 The correlation analysis between the change of growth rate
and the coefficient in terms of C atoms.
(a) Poolman, (b) AraGEM and (c) AraCore model. The Pearson Pearson correlation coefficient was calculated
using the changes in growth rate for + 30% variations of a single biomass component.

Sensitivity in plant metabolic models
37
Appendix 2.6.9 The correlation analysis between the change of growth rate
and the coefficient in terms of weight.
(a) Poolman, (b) AraGEM and (c) AraCore model. The Pearson Pearson correlation coefficient was calculated
using the changes in growth rate for + 30% variations of a single biomass component.
Appendix 2.6.10 Influence of maintenance on the growth rate.
Scenarioes % Change in growth rate
No maintenance GAM NGAM
Poolman-PoolmanBOF 0 0 0
AraGEM-AraGEMBOF 29.59 0.66 28.75
AraCore-AraCoreBOF 1.34 0.57 1.34


Chapter 3 Constructing a genome-
scale metabolic model for tomato1
1 Part of this this chapter has been published:
Yuan, H., Cheung, C.Y.M., Poolman, M.G., Hilbers, P.A.J. and van Riel,
N.A.W. (2016) A genome-scale metabolic network reconstruction of to-
mato (Solanum lycopersicum L.) and its application to photorespiratory
metabolism. Plant J., 85, 289–304.

Abstract
Tomato (Solanum lycopersicum L.) has been studied extensively owing to its high
economic value in the market, and high content in health-promoting antioxidant
compounds. Tomato is also considered as an excellent model organism for studying
the development and metabolism of fleshy fruits. In this chapter, we reconstructed
iHY3410, a genome-scale metabolic model of tomato, which represents a growing
leaf cell. The resulting model consists of 3,410 genes and 2,143 biochemical and
transport reactions distributed across five intracellular organelles including cytosol,
plastid, mitochondrion, peroxisome and vacuole. The model can be used to simulate
cellular metabolic behaviors under heterotrophic and phototrophic conditions.

Constructing a genome-scale metabolic model for tomato
41
3.1 Introduction
Tomato (Solanum lycopersicum L.) is one of the most important vegetable crops
grown in the world. An estimated worldwide production is 161.8 million tons fresh
weight on 4.8 million hectares each year (FAO, 2014). In addition to its high eco-
nomic value in the market, tomato has always drawn much attention owing to its
high content in health-promoting antioxidant compounds such as ascorbic acid (vit-
amin C), carotenoids, and flavonoid (Dixon, 2005; Story et al., 2010). Among the
plentiful plant species bearing fleshy fruits, tomato serves as an excellent model
system for addressing the fruit development and metabolism because of its ease of
cultivation, and short life cycles (Klee and Giovannoni, 2011). Of particular interest
is that the tomato fruit undergoes a shift from partially photosynthetic to truly het-
erotrophic metabolism during development (Kahlau and Bock, 2008; Lytovchenko
et al., 2011). Furthermore, tomato plant has a number of distinct developmental fea-
tures, such as compound leaves and the branching behavior of its inflorescence,
which make it an attractive system to study desirable traits. Therefore, tomato is
considered to be an ideal model plant for both basic and applied studies.
In the past two decades, much effort has been made towards understanding the
metabolic properties of tomato, ranging from physiology and biochemistry to mo-
lecular and genetics by conventional experimental techniques (Haupt-Herting et al.,
2001; Lieberman et al., 2004; Liu et al., 2004). However, its metabolic behavior
and the interactions between different metabolic pathways across the whole system
are still not completely understood. A recent emerging modelling approach, namely
constraint-based modelling, has shown to be particularly promising as it offers a
powerful tool to systematize our current knowledge of the complex metabolic net-
work (Bordbar et al., 2014). Flux balance analysis (FBA), a constraint-based
modelling approach, is able to predict the metabolic fluxes with stoichiometric met-
abolic models, some of which are at genome-scale (Orth et al., 2010). Genome-scale
metabolic models (GSMs) are constructed by extracting the metabolic reactions en-
coded by the genomes of the target organisms. Large-scale metabolic models have
been reconstructed for a variety of plants thus far (Figure 3.1), including Arabidop-
sis (Poolman et al., 2009; de Oliveira Dal’Molin et al., 2010a; Cheung et al., 2013;
Arnold and Nikoloski, 2014), barley (Grafahrend-Belau et al., 2009; Grafahrend-
Belau et al., 2013), rice (Poolman et al., 2013), oilseed rape (Hay and Schwender,
2011), and C4 plants (de Oliveira Dal’Molin et al., 2010b; Saha et al., 2011; Simons
et al., 2014). Most recently, a stoichiometric model was developed to describe the

Chapter 3
42
developing process of tomato fruit by modelling central metabolism (Colombié et
al., 2015), but at a medium-scale level. Nevertheless, no large-scale model of tomato
metabolism has been published to date. With the recent completion of the tomato
genome in 2012 (Tomato Genome Consortium, 2012), it is timely to expand the
scope to a genome-scale model of tomato metabolism for better understanding its
metabolic behavior by integrating biochemical, physiological, and proteomic data
derived from the literature and databases.
A general overview of the genome-scale metabolic reconstruction has been
given in Chapter 1 (section 1.3.1). In this chapter, we describe the reconstruction of
a compartmentalized genome-scale metabolic model for tomato, we then use this
model to simulate tomato leaf metabolism. We evaluated the model by simulating
several well-studied metabolic scenarios and showed that the simulation results
were in good agreement with the main biochemical properties of plant metabolism
as described in the literature.
3.2 Methods
3.2.1 Software
In this thesis work, all modeling work of tomato was carried out using ScrumPy,
which is an open source, metabolic modeling software package written in Python
programming language (Poolman, 2006). For detailed instructions of ScrumPy and
its usage, it is available from the main ScrumPy website
(http://mudshark.brookes.ac.uk/index.php/Software/ScrumPy).
3.2.2 Metabolic reconstruction
In this chapter, an initial draft model of tomato was generated from a tomato meta-
bolic pathway database LycoCyc (version 3.0;
http://pathway.iplantcollaborative.org/lycocyc.html) released by the Solanaceae
Genomics Network (SGN, http://sgn.cornell.edu/). This database is available as part
of BioCyc collection of databases (Karp et al., 2005). The draft model was manually
curated with regard to atomic balance, energy conservation, reaction stoichiometry,
reversibility, and subsequently assigned to respective subcellular localization. Mass
conservation was achieved by checking the atomic balance of each reaction for
which the empirical formulas of all metabolites are known, and by identifying un-
conserved metabolites through stoichiometric consistency analysis (Gevorgyan et

Constructing a genome-scale metabolic model for tomato
43
al., 2008). All reactions were atomically balanced with respect to carbon (C), nitro-
gen (N), phosphorus (P), and sulfur (S), but not hydrogen (H), and oxygen (O). The
inconsistency regarding H and O was assumed to have minimal effect on the model
predictions as water and stoichiometric protons were defined as external metabolites
as in Poolman et al. (2009) and Cheung et al. (2013).
Information on reaction directionality was primarily extracted from the Meta-
Cyc database (http://metacyc.org) wherever possible as it contains comprehensive
metabolic pathways and enzymes which have been experimentally determined and
reported in the literature (Caspi et al., 2008). For the remaining reactions, the direc-
tionality data was adopted from the LycoCyc database. Intracellular
compartmentalization was determined according to a published genome-scale
model of Arabidopsis (Cheung et al., 2013). Reactions were distributed in 5 intra-
cellular compartments, cytosol (‘_Cyto’), plastid (‘_Plas’), mitochondrion
(‘_Mito’), peroxisome (‘_Pero’) and vacuole (‘_Vacu’). Transport reactions were
also defined based on the model of Cheung et al. (2013). Transporters were repre-
sented using the subscripts ‘_Cyto_tx’, ‘_Plas_tx’, ‘_Mito_tx’, ‘Pero_tx’ and
‘_Vacu_tx’, for exchange with the environment (also termed exchange reactions
elsewhere), plastidic, mitochondrial, peroxisomal and vacuolar transporters, respec-
tively. To enable biomass production from the given substrates, biomass drains were
assigned using the subscript ‘_bm_tx’ independently accounting for protein, sugars,
nucleotides, soluble metabolites, cell wall, fatty acids, and pigments (Appendix
3.5.1).
The inclusion of protons in the model was defined as ‘Pumped-PROTON’ and
‘PROTON’, which represent energetic protons and stoichiometric protons, respec-
tively, in accordance with the published Arabidopsis models (Poolman et al., 2009;
Cheung et al., 2013). Pumped-PROTON is used to drive ATP synthesis and/or me-
tabolite transfer across membranes; PROTON is the stoichiometric protons, which
is regarded as external in all compartments.
3.2.3 Model analysis
In this chapter, flux balance analysis (FBA) was carried out using the Gnu linear
programming kit (GLPK, http://www.gnu.org/software/glpk) and the ScrumPy met-
abolic modelling package (Poolman, 2006). The objective function of total flux
minimization was used in this study as a proxy for minimizing the total enzyme
costs (Holzhütter, 2004), subject to several different types of constraints: (i) steady

Chapter 3
44
state, (ii) the requirement for production of individual biomass components (Appen-
dix 3.5.1), and (iii) the energy demand for cell maintenance. Mathematically, the
linear programming problem can be represented as follows:
Minimize:|v|
Subject to Sv = 0 (i)
vi = t (ii)
vATPase = 𝑚 (iii)
where S is the stoichiometric matrix, v is a vector of all reaction fluxes in the system,
i are the transporters of the biomass components, t is the corresponding flux that
each biomass transporter carries, vATPase represents the flux that a generic ATPase
reaction carries to sustain cellular functions that are not associated with biomass
accumulation and growth, and 𝑚 is the flux value that the generic ATPase reaction
carries. It has been shown that a large amount of cellular ATP is used for cellular
maintenance in plant cells, for example, more than 85% of cellular ATP was esti-
mated for the non-growth associated maintenance in Arabidopsis (Masakapalli et
al., 2010). Since no information is available regarding the ATP maintenance energy
for tomato, the ATP maintenance of 7.1 mmol g-1 DW h-1 reported in an Arabidopsis
model has been exploited (Poolman et al., 2009). As most plants uptake nitrogen in
the form of nitrate and ammonium, nitrogen input was set to be 50% nitrate and
50% ammonium for simulating the photoautotrophic scenario. Photorespiratory me-
tabolism was simulated by additionally setting the flux ratio of carboxygenic to
oxygenic of RubisCO (Vc/Vo), which is 3 under ambient conditions. Other con-
straints for simulating the photoautotrophic scenario are listed in Appendix 3.2.
FBA uses these constraints to identify a flux distribution which optimizes a defined
objective function (Orth et al., 2010), such as total flux minimization.
FBA was also applied to test the production of each biomass component inde-
pendently, while minimizing total flux to simulate growth. To characterize the
optimal flux solution space, flux variability analysis (FVA) was used to determine
a possible flux range for each reaction while giving rise to the same optimal value
for the objective function (Mahadevan and Schilling, 2003). This range denotes the
minimum and maximum flux values each reaction can take among all alternative
optimal solutions.

Constructing a genome-scale metabolic model for tomato
45
3.3 Results and Discussion
3.3.1 General model properties
In this chapter, we aimed to build a genome-scale metabolic network for tomato by
making use of the recent availability of the tomato genome (Tomato Genome Con-
sortium, 2012). The metabolic reconstruction was based on information in LycoCyc
(http://pathway.iplantcollaborative.org/lycocyc.html), published literature and
known biochemical knowledge in plants from textbook. The resulting model,
iHY3410, comprises 3,410 genes, 1,998 metabolites and 2,143 reactions, of which
1,211 could carry a non-zero flux given the defined nutrients input and the specified
biomass components. Among the 2,143 reactions, 1,885 represent biochemical con-
versions and 258 represent metabolite transporter processes indicating the high
interconnectivity among the intracellular compartments (i.e. cytosol, mitochondria,
plastid, peroxisome, and vacuole) and with the environment. There were 11 ex-
change reactions with the environment, of which O2 and CO2 can freely exchange
with the environment. Biomass synthesis was represented by a set of independent
transporters, one for each representative of biomass components: protein (amino
acids), sugars, nucleotides, soluble metabolites, cell wall (cellulose, xylan and lig-
nin), fatty acids and pigments (chlorophyll a and chlorophyll b). The model was able
to simulate biomass synthesis of leaf using starch or CO2, NO3- and/or NH4
+, SO42-,
and Pi as the C, N, S, and P sources, respectively. A graphical overview of the re-
constructed network is shown in Figure 3.1.
Figure 3.1 Schematic overview of iHY3410. Different compartments are indicated along with the number of asso-
ciated reactions. Grey arrows denote transporters across membranes or as biomass drains, with the number of
reactions indicated.

Chapter 3
46
The definition of the photosynthetic light reactions in iHY3410 was consider-
ably expanded over previous models of other plant species (de Oliveira Dal’Molin
et al., 2010a; Lakshmanan et al., 2013; Poolman et al., 2013). Rather than using
aggregate reactions for the photosynthetic electron transport, we provided sufficient
detail in iHY3410 to define all individual electron transport reactions including pho-
tosystem II (PSII), cytochrome b6f complex, photosystem I (PSI), and ferredoxin
NADP+ reductase (FNR) as components of the linear electron chain, the plastidic
ATP synthase and the cyclic electron transfer ferredoxin plastoquinone reductase
(FQR) reaction around PSI. The reconstruction was provided in SBML (System Bi-
ology Markup Language (Hucka et al., 2003)) format, ScrumPy format and Excel
format Appendix 3.5.3, 3.5.4 and 3.5.5, respectively. The inclusion of gene-protein-
reaction (GPR) associations enables iHY3410 to be used for the integration and
contextualization of proteomic and transcriptomic data.
3.3.2 Comparisons with existing plant models
The model properties of iHY3410 were compared with genome-scale metabolic
models of two plant species, Arabidopsis (Cheung et al., 2013) and rice (Poolman
et al., 2013). Our tomato model contained more unique reactions and metabolites
than the rice model but fewer than the Arabidopsis model. One possible reason for
the higher number of reactions and metabolites in the Arabidopsis model is that the
biochemical databases from which the construction of the Arabidopsis model is
based on is more comprehensively annotated. Of all the unique reactions and me-
tabolites in iHY3410, 1,417 reactions (72% overall) and 1,344 metabolites (81%
overall) were also present in Arabidopsis model (Figure 3.2a). Similarly, we sys-
tematically compared iHY3410 to a rice model (Figure 3.2b). Our tomato model
shared 1,155 reactions (64% overall) and 1,043 metabolites (63% overall) with the
rice model. This overlap was smaller than that with the Arabidopsis model, which
reflects the divergence between eudicots, including Arabidopsis and tomato, and
monocots such as rice (Considine et al., 2002; Tomato Genome Consortium, 2012).
Irrespective of the Arabidopsis or rice models, a total of 269 reactions and 240 me-
tabolites are specific to our tomato model. These reactions were predominately
involved in secondary metabolism such as volatiles, alkaloids and phytoalexins bi-
osynthesis. For example in iHY3410, reactions 'RXN-6721', '2.1.1.146-RXN',
'RXN-6741' and 'RXN-6742' described the biosynthesis of volatile ester, which has
no counterpart in Arabidopsis or rice. While iHY3410 was applied to model a grow-
ing tomato leaf cell in this chapter, the inclusion of reactions that are dedicated to

Constructing a genome-scale metabolic model for tomato
47
the tomato fruits enables future investigations and characterization of fruit metabo-
lism using our model. Phytoalexins have been considered as plant antibiotics in the
plant defense systems, which are induced and accumulated in plants in response to
microbial infection or abiotic stress (Kuc, 1995). Our tomato model contains a se-
quence of four reactions, 'RXN-4843’, 'RXN-4823','RXN-4844' and 'RXN-4848',
which are responsible for sesquiterpenoid phytoalexins biosynthesis. Although phy-
toalexins are not synthesized in healthy plants (Back et al., 1998), the inclusion of
these reactions provides a platform for the future in silico investigation of disease
states in tomato.
Figure 3.2 Venn diagram for reactions and metabolites of different genome-scale metabolic models for plants. (a)
The number of unique reactions and metabolites shared between and specific for the Arabidopsis model of Cheung
et al. (2013) and iHY3410, (b) The number of unique reactions and metabolites shared between and specific for the
rice model of Poolman et al. (2013) and iHY3410. All of the models were de-compartmentalized so that only the
unique reactions and the cytosolic transporters including biomass transporters were compared. The numbers in the
black shaded areas indicate the number of metabolites or reactions unique to iHY3410, while the numbers in the
empty areas represent the number of metabolites or reactions unique to the Arabidopsis or rice models, the numbers
in the grey regions represent the number of common metabolites or reactions between iHY3410 and Arabidopsis
or rice.
3.3.3 Model validation
The functional capabilities of iHY3410 were examined by predicting cell growth
under heterotrophic, phototrophic and photorespiratory conditions using FBA with
minimization of total flux as the objective function subjecting to mass-balance con-
straints for all internal metabolites and to the flux constraints of biomass production
and ATP maintenance cost (see 3.2.2 Metabolic reconstruction). In total, between

Chapter 3
48
359 and 371 (16.8%-17.3%) of all reactions carried a non-zero flux in the examined
conditions, while the majority of the reactions were not used in the simulations. Our
observation did not stand alone as similar observations had also been reported in
previous studies. For example, only 232 of 1,406 reactions (16.5%), 309 of 1,736
reactions (17.8%), and 248 out of 1,097 reactions (22.6%) were used for biomass
synthesis in a genome-scale model of Arabidopsis (Poolman et al., 2009), rice
(Poolman et al., 2013), and Salmonella. Typhimurium (Hartman et al., 2014), re-
spectively. Given that secondary metabolites were not considered in the biomass
constraints, it is not surprising that only a subset of reactions were active in our
model prediction.were not considered in the biomass constraints, it is not surprising
that only a subset of reactions were active in our model prediction.
Heterotrophic conditions
During the dark period, cellular metabolism of leaves is supported by the catabolism
of stored compounds that are accumulated during the light period. In this study, the
metabolic behavior of a growing tomato leaf was simulated by considering starch
as the sole carbon source in the dark. As expected, the model predicted that starch
was degraded to form maltose and glucose-1-phosphate (G1P). The glucose-6-phos-
phate (G6P) generated from G1P was predicted to be oxidized via the oxidative
pentose phosphate (OPP) pathway, which predominately provides reducing power
for the production of biomass, in particular for fatty acid synthesis (Figure 3.3a).
The model also predicted that the mitochondrial pyruvate dehydrogenase (PDH) is
active in darkened leaves, providing acetyl-CoA for fatty acid biosynthesis and as a
substrate for the TCA cycle. Thereby, the TCA reactions operate in a conventional
cyclic manner. The TCA cycle functions not only to generate ATP and reducing
equivalents but also to provide carbon skeletons for the biosynthesis of amino acids.
The operation of a complete cyclic flux through the TCA cycle was thought to be
favorable to provide efficient energy in the dark, which is in line with the previous
reports (Tcherkez et al., 2005).
Phototrophic conditions
In photoautotrophic growth conditions, biomass synthesis is supported by the as-
similation of CO2 by the enzyme ribulose-1, 5-bisphosphate carboxylase/oxygenase
(RubisCO) using light as the energy source. Under this imposed mass balance and
with the fixed biomass, minimization of total flux predicted a photon influx of 9.84
mmol g-1 DW h-1. The production of ATP and reducing power by the photosynthetic

Constructing a genome-scale metabolic model for tomato
49
light reaction liberates OPP pathway from supplying reducing power. The flux map
obtained under illumination therefore exhibited a completely different flux distribu-
tion compared with heterotrophic conditions (Figure 3.3b). Not surprisingly, the
pentose phosphate pathway shifted to the reductive mode as ribulose-5-phosphate
kinase (PRK) and RubisCO became active in the presence of light, which then drove
the subsequent reactions of the Calvin cycle.
Compared with the cyclic mode of the TCA cycle in heterotrophic conditions,
the TCA cycle reactions shifted to a noncyclic mode in phototrophic conditions in
our prediction, where the reactions from α-ketoglutarate (2-OG) to malate carry no
flux. The enzyme 2-oxoglutarate dehydrogenase (OGDH) plays an essential role in
overall metabolic activity, in particular nitrogen assimilation (Bunik and Fernie,
2009). Nevertheless, the genetic manipulation of OGDH in tomato plants revealed
little impact on the photosynthetic capacity (Araújo et al., 2012). Given the fact that
multiple cytosolic isoforms exist for the mitochondrial TCA reactions, it would not
be surprising that some mitochondrial isoforms were not used in our model predic-
tion (Sweetlove et al., 2010), e.g. fumarase operates in the form of cytosolic bypass
in the prediction. Succinate dehydrogenase (SDH, also known as Complex II) has a
dual function as a component of the TCA cycle and the electron transport chain
(ETC). As yet, the role of SDH has been studied in tomato plants employing muta-
genic approach, showing that inhibition of the iron-sulfur subunit of Complex II had
a favorable effect on the photosynthesis (Araújo et al., 2011). Thus, it is not unex-
pected that in our prediction, Complex II was not used under light conditions (Figure
3.3b). The operation of an incomplete TCA cycle in the light by our tomato model
is supported by a study in French bean leaves (Phaseolus vulgaris), which indicated
that the TCA cycle was almost completely inhibited in the light (Tcherkez et al.,
2005). Similarly, Poolman et al. (2013) reported that the TCA cycle did not function
as a conventional cycle at high light conditions in rice.
Photorespiratory conditions
To investigate specific features of photorespiratory metabolism in tomato plants, we
simulated the reconstructed model by setting a 3:1 carboxylation to oxygenation
ratio (Vc/Vo=3) based on experimental evidence (Leegood, 2007), with other con-
straints including biomass synthesis unchanged. Not surprisingly, the photon input
was 10.89 mmol g-1 DW h-1, higher than that of non-photorespiratory conditions
(9.84 mmol g-1 DW h-1) as photorespiration is generally thought of as a process
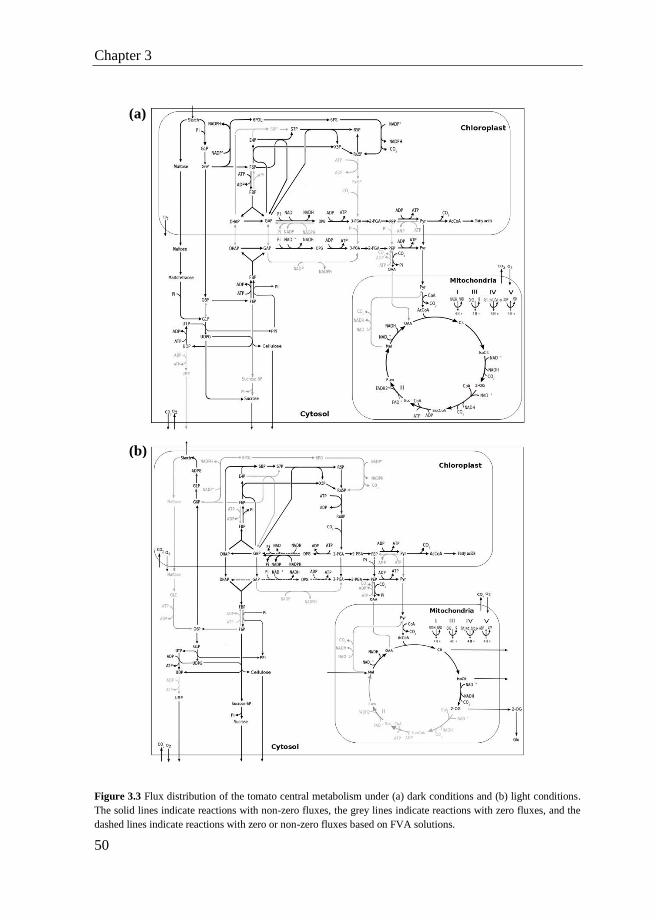
Chapter 3
50
Figure 3.3 Flux distribution of the tomato central metabolism under (a) dark conditions and (b) light conditions.
The solid lines indicate reactions with non-zero fluxes, the grey lines indicate reactions with zero fluxes, and the
dashed lines indicate reactions with zero or non-zero fluxes based on FVA solutions.
(a)
(b)
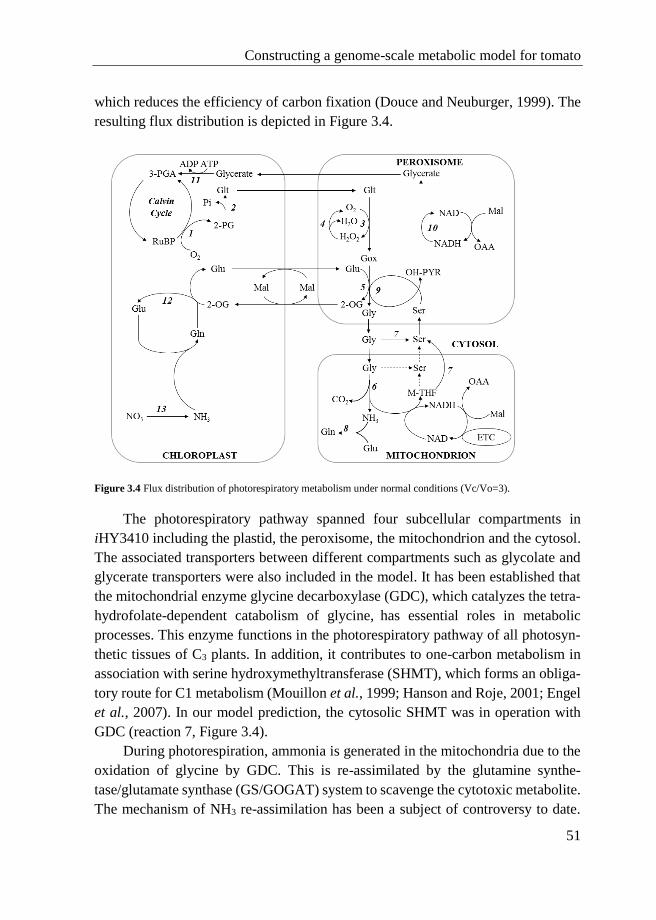
Constructing a genome-scale metabolic model for tomato
51
which reduces the efficiency of carbon fixation (Douce and Neuburger, 1999). The
resulting flux distribution is depicted in Figure 3.4.
Figure 3.4 Flux distribution of photorespiratory metabolism under normal conditions (Vc/Vo=3).
The photorespiratory pathway spanned four subcellular compartments in
iHY3410 including the plastid, the peroxisome, the mitochondrion and the cytosol.
The associated transporters between different compartments such as glycolate and
glycerate transporters were also included in the model. It has been established that
the mitochondrial enzyme glycine decarboxylase (GDC), which catalyzes the tetra-
hydrofolate-dependent catabolism of glycine, has essential roles in metabolic
processes. This enzyme functions in the photorespiratory pathway of all photosyn-
thetic tissues of C3 plants. In addition, it contributes to one-carbon metabolism in
association with serine hydroxymethyltransferase (SHMT), which forms an obliga-
tory route for C1 metabolism (Mouillon et al., 1999; Hanson and Roje, 2001; Engel
et al., 2007). In our model prediction, the cytosolic SHMT was in operation with
GDC (reaction 7, Figure 3.4).
During photorespiration, ammonia is generated in the mitochondria due to the
oxidation of glycine by GDC. This is re-assimilated by the glutamine synthe-
tase/glutamate synthase (GS/GOGAT) system to scavenge the cytotoxic metabolite.
The mechanism of NH3 re-assimilation has been a subject of controversy to date.

Chapter 3
52
GOGAT, either in the form of Fd-GOGAT or NADH-GOGAT, is exclusively pre-
sent in the plastid to produce glutamate (Coschigano et al., 1998). Therefore, it was
assumed that the photorespiratory NH3 is transported to plastids, which is then re-
assimilated into glutamate by GS and GOGAT (Wingler et al., 2000). On the con-
trary, an isoform of GS was found to be dual targeted to the chloroplast and the
mitochondria in Arabidopsis leaves (Taira et al., 2004). Based on this, Linka and
Weber (2005) hypothesized a possible metabolite route where the NH3 is assimi-
lated by the mitochondrial GS, which does not require more energy than the plastidic
GS route. Our model prediction supports the hypothesis that NH3 generated by GDC
during photorespiration could be re-assimilated by the mitochondrial GS, rather than
being transported to the chloroplast.
For further confirmation, FVA was performed to examine the flux capacity for
each reaction under the simulated conditions (Appendix 3.5.6). As expected, light-
dependent reactions such as photosystem II and photosystem I in the photosynthetic
light reactions, PRK and RubisCO from the Calvin cycle, nitrate reductase (NR),
nitrite reductase (NiR), plastidic GS and Fd-GOGAT involved in nitrogen assimila-
tion were activated by light. These reactions characterize the metabolic response
that must be appropriately regulated in order to adapt to the available energy/carbon
source.
3.4 Conclusions
The aim of this chapter was to construct a genome-scale metabolic network for
tomato, representing a growing leaf cell. The GSM of tomato reconstructed in this
chapter was initially extracted from the LycoCyc database, then was manually
curated in an iterative cycle. In addition, the ability of the model was tested by
predicting cellular behaviours under hetertrophic, phototrophic and
photorespiratory growth conditions. Eventually, the resulting model, iHY3410, in-
cludes 3,410 genes and 2,143 biochemical and transport reactions distributed across
five intracellular organelles including cytosol, plastid, mitochondrion, peroxisome
and vacuole. The model successfully described the known metabolic behavior of
tomato leaf under heterotrophic and phototrophic conditions, which provides a
sound framework for investigating tomato metabolism.
3.5 Appendix
Appendix 3.5.1 Detailed information on the biomass composition of to-
mato leaves.

Constructing a genome-scale metabolic model for tomato
53
Table 1: Concentration of biomass components in tomato leaves.
Component Concentration
(µmol/g FW)
Concentration
(mmol/g DW)
Reference
Amino acids
Alanine 1.26 1.48 × 10⁻² Schauer et al., 2005
Arginine 0.24 2.82 × 10⁻³ Schauer et al., 2005
Aspargine 0.23 2.71 × 10⁻³ Schauer et al., 2005
Aspartate 6.36 7.48 × 10⁻² Schauer et al., 2005
β-Alanine 0.11 1.29 × 10⁻³ Schauer et al., 2005
GABA 1.45 1.71 × 10⁻² Schauer et al., 2005
Glutamate 11.51 0.135 Schauer et al., 2005
Glutamine 3.39 3.99 × 10⁻² Schauer et al., 2005
Glycine 1.89 2.22 × 10⁻² Schauer et al., 2005
Isoleucine 0.93 1.09 × 10⁻² Schauer et al., 2005
Leucine 0.53 6.24 × 10⁻³ Schauer et al., 2005
Lysine 0.06 0.71 × 10⁻³ Schauer et al., 2005
Methionine 0.05 0.59 × 10⁻³ Schauer et al., 2005
Ornithine 0.31 3.65 × 10⁻³ Schauer et al., 2005
Phenylalanine 0.74 8.71 × 10⁻³ Schauer et al., 2005
Proline 18.59 0.219 Schauer et al., 2005
Serine 4.88 5.74 × 10⁻² Schauer et al., 2005
Threonine 14.97 0.176 Schauer et al., 2005
Tryptophan 2.80 3.29 × 10⁻² Schauer et al., 2005
Tyrosine 0.15 1.76 × 10⁻³ Schauer et al., 2005
Valine 1.10 1.29 × 10⁻² Schauer et al., 2005
Sugars
Starch 42.73 0.503 Roessner-Tunali et al., 2003
Glucose 59.97 0.706 Schauer et al., 2005
Fructose 26.20 0.308 Schauer et al., 2005
Sucrose 16.70 0.196 Schauer et al., 2005
Nucletides
ATP 117.20 1.38 Roessner-Tunali et al., 2003
UTP 51.24 0.603 Roessner-Tunali et al., 2003
Soluble metabolites
Glucose-6-P 1.00 1.18 × 10⁻² Schauer et al., 2005
Citrate 4.06 4.78 × 10⁻² Schauer et al., 2005
Fumarate 0.14 1.65 × 10⁻³ Schauer et al., 2005
Glycolate 0.07 0.82 × 10⁻³ Schauer et al., 2005
Isocitarte 0.06 0.71 × 10⁻³ Schauer et al., 2005
α-Ketoglutarate 0.30 3.53 × 10⁻³ Schauer et al., 2005
L-Ascorbate 1.50 1.77 × 10⁻² Schauer et al., 2005
Malate 28.93 0.340 Schauer et al., 2005
Succinate 2.16 2.54 × 10⁻² Schauer et al., 2005
Glycerol 0.32 3.76 × 10⁻³ Schauer et al., 2005
Uracil 1.00 1.18 × 10⁻² Schauer et al., 2005
5-Oxoproline 6.33 7.45 × 10⁻² Schauer et al., 2005
Cell wall
Cellulose - 1.77 Sheen, 1983; Table 2
Hemicellulose (Xylan) - 1.74 × 10⁻² Schauer et al., 2005; Table 2
Lignin
Coumaryl alcohol - 0.12 Sheen, 1983; Table 2
Coniferyl alcohol - 0.10 Sheen, 1983; Table 2

Chapter 3
54
Sinapyl alcohol - 0.0890 Sheen, 1983; Table 2
Fatty acids
FA 1.00 1.78 × 10⁻² Schauer et al., 2005
Pigments
Chlorophyll a 4.1 4.82 × 10⁻² Nunes-Nesi et al., 2007
Chlorophyll b 1.3 1.53 × 10⁻² Nunes-Nesi et al., 2007
Note that the biomass compositions used here are experimentally determined from plant fresh weight, subsequently,
converted into dry weight (DW) based on the dry matter content (g DW/g FW, 0.085) of tomato (El-Sayed, 2013).
Since no information is available regarding the cellulose and lignin composition for tomato, the data were collected
from tobacco reported by Sheen (1983).
Table 2: Cellulose and lignin precursors.
Original data
(mg/g DW)
Average
(mg/g DW) WT %
MW
(g/mol) mmol/g DW
Cellulose (Glc dimer)
309.00
319.20 100 180.156 1.77
333.60
316.30
279.10
331.20
320.20
321.20
300.30
345.90
335.20
Lignin
55.90
56.10
40.70
81.00
Coumaryl alcohol 47.50 33.33 150.0681 0.12
Coniferyl alcohol 49.90 33.33 180.0786 0.10
Sinapyl alcohol 52.80 33.33 210.0892 0.0890
56.70
44.60
61.4
70.50
Table 3: Hemicellulose precursors.
Hemicellulose Components
Arabinose Xylose Mannose Galactose Galacturonate
µmol/ g FW 0.11 0.28 0.16 0.17 0.76
mmol/g DW 1.29 × 10⁻³ 3.29 × 10⁻³ 1.88 × 10⁻³ 2.00 × 10⁻³ 8.94 × 10⁻³
Total 1.74 × 10⁻² mmol/g DW

Constructing a genome-scale metabolic model for tomato
55
Table 4: Condition-specific growth rates of tomato leaves.
Biomass concentrations (Table 3) are scaled to flux units (µmol/g DW/h) for normal and drought conditions, re-
spectively, based on the growth rates of tomato for normal and drought conditions (Sánchez-Rodríguez et al., 2010).
Other biomass precursors which are not listed in Table 3 were set to carry zero flux. ‘Original data’ refers to the
data derived from Sánchez-Rodríguez et al. (2010).
Appendix 3.5.2 Boundary constraints for simulating the photoautotrophic
scenario.
Columns marked with lb and ub represent the default lower and upper boundary, respectively.
NO3_Cyto_tx and NH4_Cyto_tx were constrained to a ratio of 1:1. ‘m’ is the flux value that the generic ATPase
reaction carries to sustain cellular functions that are not associated with biomass accumulation and growth.
Appendix 3.5.3 Genome-scale metabolic model of iHY3410 in SBML for-
mat. Can be found at:
http://onlinelibrary.wiley.com/doi/10.1111/tpj.13075/abstract
Items Original data
(mg/g DW/day)
Average
(mg/g DW/day) (mg/g DW/h)
Cultivar Kosaco Josefina Katalina Salomé Zarina
Normal 87.23 82.05 87.25 100.09 93.85 90.09 3.75
Drought 64.74 54.84 64.38 76.25 80.28 68.10 2.84
lb ub
Photon_tx 0 +infinity
NO3_Cyto_tx 0 +infinity
NH4_Cyto_tx 0 +infinity
SO4_Cyto_tx 0 +infinity
Pi_Cyto_tx 0 +infinity
K_Cyto_tx 0 +infinity
Ca_Cyto_tx 0 +infinity
Mg_Cyto_tx 0 +infinity
Fe_Cyto_tx 0 +infinity
O2_Cyto_tx -infinity +infinity
CO2_Cyto_tx -infinity +infinity
ATPase_Cyto m m
NADPHox_Cyto 0 +infinity
NADHox_Cyto 0 +infinity
NADPHox_Mito 0 +infinity
NADPHox_Plas 0 +infinity
NADPHox_Pero 0 +infinity

Chapter 3
56
Appendix 3.5.4 Genome-scale metabolic model of iHY3410 in ScrumPy
format. Can be found at: http://onlineli-
brary.wiley.com/doi/10.1111/tpj.13075/abstract
Appendix 3.5.5 Genome-scale metabolic model of iHY3410 in Excel for-
mat. Can be found at:
http://onlinelibrary.wiley.com/doi/10.1111/tpj.13075/abstract
Appendix 3.5.6 FBA and FVA results of dark, light and photorespiratory
scenarios for minimizing total flux. Can be found at: http://onlineli-
brary.wiley.com/doi/10.1111/tpj.13075/abstract

Chapter 4 In silico study of
photorespiratory metabolism
under drought conditions1
1 Part of this chapter has been published:
Yuan, H., Cheung, C.Y.M., Poolman, M.G., Hilbers, P.A.J. and van Riel,
N.A.W. (2016) A genome-scale metabolic network reconstruction of to-
mato (Solanum lycopersicum L.) and its application to photorespiratory
metabolism. Plant J., 85, 289–304.

Abstract
In this chapter, the reconstructed metabolic model of tomato described in Chapter 3
was used to investigate the metabolic characteristics for photorespiration and other
relevant metabolic processes under drought stress. Our results suggested that: (1)
the flux distributions through the mevalonate (MVA) pathway under drought were
distinct from that under normal conditions; (2) the changes in fluxes through core
metabolic pathways with varying flux ratio of RubisCO carboxylase to oxygenase
may contribute to the adaptive stress response of plants. In addition, previous studies
of reaction essentiality analysis for leaf metabolism were improved by including
potential alternative routes for compensating reaction knockouts. Altogether, the
genome-scale model gives valuable insights into the functional consequences of abi-
otic stresses.

Modelling photorespiratory metabolism under drought conditions
59
4.1 Introduction
The growth, yield and fruit quality of tomatoes can be affected by several environ-
mental factors, among which drought is a widespread abiotic stress, limiting the
growth and yield of crop plants (Haupt-Herting et al., 2001; Pinheiro and Chaves,
2011; Nakashima et al., 2014). Under drought conditions, photosynthesis is inhib-
ited mainly by stomatal limitation (Cornic, 2000; Flexas et al., 2007; Chaves et al.,
2009). Moreover, the occurrence of photorespiration dramatically increases under
drought stress as the leaf stomata are closed to prevent water loss, resulting in re-
duced CO2 concentration in leaves (Bauwe et al., 2012). Photorespiration is a
process in which O2 competes with CO2 to react with ribulose-1, 5-bisphosphate
(RuBP), thereby producing 3-phosphoglycerate (3-PGA) and 2-phosphoglycolate
(2-PG). Although this process represents a potential limitation on photosynthetic
efficiency and, ultimately, crop production, it has also been suggested that pho-
torespiration plays an important role in other metabolic processes such as energy
dissipation under stress conditions (Wingler et al., 2000).
Genome-scale metabolic modelling has been successfully used to predict met-
abolic states of plant metabolism (Williams et al., 2010; Simons et al., 2014). Thus
far, most modelling contributions have been made in the area of plant growth and
primary metabolism with very little work focusing on changes in metabolism in
response to abiotic stress such as drought. However, the effect of drought stress via
water deficit cannot be directly modelled using flux balance analysis (FBA). Con-
sidering the changes in biomass composition and growth rates caused by drought
(Boyer, 1982), the condition-specific growth rate that accounts for biomass accu-
mulation in drought conditions was introduced to mimics the effect of drought.
Simultaneously, the flux ratio of carboxylation to oxygenation of RubisCO (Vc/Vo)
was set to a value of 1 to represent drought stress (Jordan and Ogren, 1984).
In this chapter, the tomato model described in Chapter 3 was used to investigate
the cellular metabolic characteristics, in particular the interplay of photorespiration
with other pathways, under drought stress by identifying changes in reaction fluxes.
The model predicted that the flux distributions through the mevalonate (MVA) path-
way under drought conditions significantly differed from that under normal
conditions, which gave hints to possible adaptive metabolic responses to drought
stresses.

Chapter 4
60
4.2 Methods
4.2.1 Model analysis
The tomato model was analysed using the same methods as described in Chapter 3,
section 3.2.3. Photorespiratory metabolism was simulated by additionally setting the
flux ratio of carboxygenic to oxygenic of RubisCO (Vc/Vo), which is 3 under am-
bient conditions, and 1 under drought stressed conditions. For the simulations of
drought conditions, the biomass outputs were constrained using the drought-specific
growth rate (Appendix 3.5.1). Other constraints for simulating the photorespiratory
scenario are the same as described in Chapter 3, section 3.2.3.
4.2.2 Deletion simulation
Large-scale metabolic models serve as platforms for rapidly predicting growth phe-
notypes in response to reaction knockouts in silico. In order to simulate reaction
deletions, the flux through the corresponding reaction was constrained to zero in
addition to the constraints on biomass production, ATP maintenance, nitrogen input
and Vc/Vo. With the constraints of biomass synthesis, a reaction was categorized as
essential if its deletion resulted in no feasible steady-state solution. In contrast, re-
actions were defined as non-essential if a feasible solution could be found.
4.3 Results and Discussion
As previously mentioned, drought is a common abiotic stress that limits tomato
growth, yield and fruit quality. To elucidate the metabolic response of tomato plants
to water-limited conditions, the drought stress was modelled using our reconstructed
model by incorporating the drought-specific growth rate of tomato (2.84 mg g-1 DW
h-1) based on the work of Sánchez-Rodríguez et al. (2010) while constraining the
ratio of Vc/Vo to a value of 1 (i.e. Vc/Vo=1), which results from the stomata closure
in response to drought stress that leads to a reduced CO2 concentration in leaves
(Bauwe et al., 2012; Lakshmanan et al., 2013b). The metabolic characteristics of
drought conditions was then compared with that of normal conditions with a growth
rate of 3.75 mg g-1 DW h-1 (Sánchez-Rodríguez et al., 2010), and the ratio of Vc/Vo
was set to 3 (i.e. Vc/Vo=3). In total, 376 and 371 reactions were found to be active
under drought and normal conditions, respectively. A set of 358 active reactions
were common between the two flux solutions. It is expected that the photon uptake

Modelling photorespiratory metabolism under drought conditions
61
rate under stressed conditions (13.32 mmol g-1 DW h-1) was higher than that under
normal conditions (10.89 mmol g-1 DW h-1) as more energy is required for the recy-
cling of higher amounts of 2-PG produced under drought stress.
4.3.1 Differences in metabolically active reactions between normal
and drought conditions
Sets of reactions which were only used either in normal or in drought conditions
were identified according to results from FVA (Appendix 4.5.1), and these reactions
were investigated in more detail. A total of 10 reactions were identified to carry non-
zero flux only under normal conditions, which implies these reactions were always
inactive under drought conditions. Among these reactions, 8 reactions (EC 2.2.1.7;
1.1.1.267; 2.7.7.60; 2.7.1.148; 4.6.1.12; 1.17.1.2; 1.17.7.1) are involved in the 2C-
methyl-D-erythritol-4-phosphate pathway or MEP pathway (Table 4.1). On the
other hand, 14 reactions were found to be active under drought conditions, of which
7 (EC 6.2.1.16; 1.1.1.34; 2.7.1.36; 2.7.4.2; 4.1.1.33; 2.3.1.9; 4.1.3.4) belong to
MVA pathway, whilst, 3 are the related metabolite transporters (‘CPD-
499_Pero_tx’, ‘DELTA3-IPP_Pero_tx’ and ‘DELTA3-IPP_Plas_tx’). In plants,
both the MEP pathway and the MVA pathway are predominantly used to synthesize
isopentenyl pyrophosphate (IPP) and dimethylallyl pyrophosphate (DMAPP),
which can be further utilized for the biosynthesis of isoprenoids (Vranová et al.,
2013). Isoprenoids, also called terpenoids, are required for the production of a vari-
ety of important compounds such as chlorophylls, carotenoids, and plant hormones.
The MEP pathway utilizes pyruvate and D-glyceraldehyde-3-phosphate (GAP) for
IPP production, which takes place in the plastid. Isoprenoid biosynthesis through
the MEP pathway depends on the availability of reduced carbon, ATP and NADPH,
which are contributed by photosynthesis in unstressed plants (Loreto and Schnitzler,
2010). In contrast, the MVA pathway in the cytosol and the peroxisome uses acetyl-
CoA as the precursor for IPP synthesis. Ultimately, IPP generated either via the
MEP pathway or the MVA pathway was used for the biosynthesis of chlorophylls
in our model (Figure 4.1).

Chapter 4
62
Table 4.1 List of unique reactions carrying non-zero flux under either normal or drought conditions.
Vc/Vo=3
Identifier Description Identifier Description
DXS-RXN_Plas EC 2.2.1.7; MEP path-
way 1.1.1.34-RXN_Cyto
EC 1.1.1.34; MVA
pathway
DXPREDISOM-
RXN_Plas
EC 1.1.1.267; MEP
pathway
MEVALONATE-KINASE-
RXN_Cyto
EC 2.7.1.36; MVA
pathway
2.7.7.60-RXN_Plas EC 2.7.7.60; MEP path-
way
PHOSPHOMEVALONATE-
KINASE-RXN_Pero
EC 2.7.4.2 ; MVA
pathway
2.7.1.148-
RXN_Plas
EC 2.7.1.148; MEP
pathway IPPISOM-RXN_Plas
EC 5.3.3.2;
MVA/MEP pathway
RXN0-302_Plas EC 4.6.1.12; MEP path-
way
DIPHOSPHOMEVALONTE-
DECARBOXYLASE-RXN_Pero
EC 4.1.1.33 ; MVA
pathway
RXN0-884-
(NADP)_Plas
EC 1.17.1.2; MEP path-
way
ACETYL-COA-
ACETYLTRANSFER-RXN_Cyto
EC 2.3.1.9; MVA
pathway
RXN0-882_Plas EC 1.17.7.1; MEP path-
way
HYDROXYMETHYLGLUTARYL-
COA-LYASE-RXN_Cyto
EC 4.1.3.4 ; MVA
pathway
ISPH2-RXN-
(NADP)_Plas
EC 1.17.1.2; MEP path-
way CPD-499_Pero_tx
peroxisomal phos-
phomevalonate
transporter
CDPKIN-
RXN_Plas
EC 2.7.4.6; CMP phos-
phorylation pathway DELTA3-IPP_Plas_tx
plastidic isopentenyl
pyrophosphate trans-
porter
CMPKI-RXN_Plas EC 2.7.4.14; CMP phos-
phorylation pathway DELTA3-IPP_Pero_tx
peroxisomal isopen-
tenyl pyrophosphate
transporter
Vc/Vo=1 CO2_Pero_tx peroxisomal CO2
transporter
ACETOACETATE-
-COA-LIGASE-
RXN_Cyto
EC 6.2.1.16; MVA path-
way
ATP_ADP_Pero_tx peroxisomal ATP
transporter
ATP-CITRATE-
PRO-S--LYASE-
RXN_Cyto
EC 2.3.3.8; acetyl-CoA
biosynthesis pathway

Modelling photorespiratory metabolism under drought conditions
63
Figure 4.1 Subcellular compartmentalization of the MVA and MEP pathways and ABA biosynthesis. Red lines
indicate the corresponding reactions are only active under normal conditions (Vc/Vo=3); blue lines indicate reac-
tions are only active under drought conditions (Vc/Vo=1); black solid lines indicate reactions are active both under
normal and drought conditions; dashed lines indicate those reactions are not active in the prediction. 3-PGA, 3-
phosphoglycerate; PEP, phosphoenol pyruvate; OAA, oxalacetic acid; GAP, glyceraldehyde-3-phosphate; MEP,
2C-methyl-D-erythritol-4-phosphate; IPP, isopentenyl pyrophosphate; MVA, mevalonate; MVA-5P, mevalonate-
5-phosphate; ABA, abscisic acid.
Compartmentalization of IPP-generating pathways would enable plants to op-
timize isoprenoid biosynthesis and regulation according to fixed carbon, available
ATP and reducing power in diverse environmental conditions. Previous studies have
shown that chlorophylls and carotenoid-related pigments are derived from the plas-
tidic MEP pathway (Lichtenthaler et al., 1997), while MVA-derived precursors can
be transported into the plastid and used for the isoprenoids biosynthesis in the plastid
(Wang et al., 2003; Rodríguez-Concepción et al., 2004). Under normal conditions,
our model predicted that IPP was synthesised via the chloroplastic MEP pathway,
which supports previous findings that isoprenoid is produced primarily using carbon
skeletons directly derived from the Calvin cycle via the photosynthesis-dependent

Chapter 4
64
MEP pathway under stress-free conditions (Affek and Yakir, 2002; Fortunati et al.,
2008). However, under drought conditions, our model predicted that the MVA path-
way predominated over the MEP pathway for producing IPP for chlorophyll
biosynthesis. The precursor for IPP biosynthesis through the MVA pathway is cy-
tosolic acetyl-CoA. A detailed investigation of the flux solution under drought
conditions revealed a metabolic route that produces acetyl-CoA from primary pho-
tosynthates via phosphoenolpyruvate carboxylase (PEPC) and threonine aldolase
(Figure 4.1). For each molecule of 3-PGA converted into oxaloacetate (OAA) via
phosphoenolpyruvate (PEP), one molecule of CO2 is fixed by PEPC. OAA is then
used as carbon skeleton to form threonine. Threonine aldolase splits threonine into
acetaldehyde, which is converted into acetyl-CoA after oxidation to acetate, and
glycine, which is recycled through the photorespiratory pathway to produce 3-PGA.
For each molecule of glycine recycled, 0.5 molecule of CO2 is released and 0.5
molecule of 3-PGA is produced. In summary, the carbon of acetyl-CoA comes from
0.5 molecule of 3-PGA and 0.5 molecule of CO2 of which one molecule is fixed by
PEPC and 0.5 molecule is released from the photorespiratory pathway. While this
route appears to be inefficient in normal conditions, it could become favorable under
drought condition when the leaf internal CO2 concentration is so low that the cost
of fixing CO2 by Rubisco coupled with a high level of photorespiration becomes
higher than the cost of the PEPC-threonine aldolase route in which some of the car-
bon for IPP synthesis is fixed by PEPC. The PEPC-threonine aldolase route has also
been proposed as a possible route for producing acetyl-CoA for citrate synthesis in
leaves growing under constant illumination (Cheung et al., 2014).
It is evident that drought stress leads to a substantial reduction in the rate of
photosynthetic CO2 assimilation, resulting in limited photosynthate accumulation
and an increased supply of photosynthetic energy and reducing power to non-pho-
tosynthetic carbon reduction sinks such as photorespiration. It has been proposed
that the MEP pathway competes with other sinks such as photorespiration for the
reducing power, which is not invested in carbon assimilation for primary metabo-
lism (Dani et al., 2014; Morfopoulos et al., 2014). However, the reducing power
requirement by the MEP pathway is relatively small compared to that of photorespi-
ration (Sharkey et al., 2008; Dani et al., 2014). When photosynthate is limiting,
alternate carbon sources such as intermediates from the MVA pathway and pho-
torespiration could directly contribute to isoprenoid production in plants (Flügge
and Gao, 2005; Jardine et al., 2014). Isoprenoid emissions can even continue in the
complete absence of photosynthesis under severe drought conditions (Pegoraro et
al., 2004; Fortunati et al., 2008). Furthermore, it has been suggested that genes en-
coding in the MVA pathway are activated and highly expressed in response to

Modelling photorespiratory metabolism under drought conditions
65
oxidative stress (Vranová et al., 2013), which also supports our model prediction
that the MVA pathway was used for IPP biosynthesis under drought conditions.
Given that minimization of total flux was used as objective function in this
study, it can be inferred that the MEP pathway is more efficient in terms of amount
of flux for the biosynthesis of IPP than the MVA pathway under normal conditions,
and vice versa for drought conditions. To confirm this, four scenarios were simu-
lated, in which IPP can only be produced either via MEP pathway or MVA pathway.
The 4 scenarios were denoted as MEP:Normal, MVA:Normal, MEP:Drought, and
MVA:Drought. As expected, the sum of total flux for MEP:Normal scenario was
lower than that for MVA:Normal scenario, which were 65.85 and 65.95 mmol g-1
DW h-1, respectively. Likewise, the total flux of MVA:Drought scenario was lower
than that of MEP:Drought scenario, which were 77.86 and 77.89 mmol g-1 DW h-1,
respectively. Regarding the photon influx, MEP:Normal scenario required less pho-
tons than that for MVA:Normal scenario (10.89 and 10.90 mmol g-1 DW h-1,
respectively), despite a higher total Rubisco flux with the MEP pathway (0.320 and
0.318 mmol g-1 DW h-1, respectively). By contrast, MEP:Drought scenario required
more photons than that for MVA:Drought scenario (13.34 and 13.32 mmol g-1 DW
h-1, respectively) because the photon requirement for the net fixation of CO2 was
higher under drought conditions (total Rubisco flux was 0.604 and 0.600 mmol g-1
DW h-1 for MEP:Drought scenario and MVA:Drought scenario, respectively).
It is noteworthy that abscisic acid (ABA), belonging to isoprenoids, derives
from the intermediate IPP (Figure 4.1). A wealth of evidence supports the hypothe-
sis that ABA is a regulator triggering plant responses to numerous abiotic stresses
such as drought (Cornish and Zeevaart, 1985; Harris and Outlaw, 1991). During
drought stress, the synthesis of ABA was induced rapidly, whereas the increased
amounts of ABA promoted stomatal closure to reduce water loss (Bray, 1988). ABA
in higher plants is derived from carotenoid precursors through an oxidative cleavage
reaction in plastid, followed by a two-step conversion of the xanthoxin to ABA via
ABA-aldehyde (Xiong and Zhu, 2003). However, because carotenoids are not in the
output constraints of the model, this ABA biosynthetic route was not active in our
model prediction, whilst, the observations that reactions in the MVA pathway were
activated for biomass synthesis may relate to an increase in ABA biosynthesis in
response to drought stress.
As sessile organism, plants have evolved several mechanisms that allow them
to cope with drought stress, for example, increased accumulation of secondary me-
tabolites such as phenols and isoprenoids (Wilhelm and Selmar, 2011). It has been
documented that isoprenoids can provide protection from abiotic stresses, e.g.
through quenching the accumulation of reactive oxygen species (ROS), which result

Chapter 4
66
in oxidative damage (Loreto and Velikova, 2001). One of the inevitable conse-
quences caused by drought stress is the over accumulation of ROS (Smirnoff, 1993).
The switch from the MEP pathway to the MVA pathway could also be due to iso-
prenoid production, which allows plants to protect against the deleterious effects
caused by drought stress.
To test if the operation of the MVA pathway under drought conditions is related
to the choice of the objective function, flux solutions were calculated using minimi-
zation of photon uptake as the objective function as well (Appendix 4.5.2).
Minimization of photon uptake gave similar flux solutions to those from minimiza-
tion of total flux in regard to IPP biosynthesis, which strengthens our hypothesis
that IPP is produced via the MEP pathway under normal conditions, but switched to
the MVA pathway in drought conditions.
4.3.2 Effect of drought stress on the core metabolic pathways
Photorespiratory metabolism affects many parts of cellular metabolism, including
the Calvin cycle, the TCA cycle as well as nitrogen assimilation (Foyer et al., 2009).
To understand the coordinated function of photorespiration with other metabolic
pathways, the change in fluxes between normal and drought conditions for reactions
involved in several important metabolic processes was investigated (Table 4.2).
With exposure to drought stress, sharp increases in fluxes through the Calvin cycle
and photorespiration were observed to support the biomass synthesis. Growth re-
duction under water-deficit conditions has been well documented (Sánchez-
Rodríguez et al., 2010; Pinheiro and Chaves, 2011).
In the model flux solutions, reactions involved in ammonia assimilation (the
mitochondrial GS and Fd-GOGAT) showed significant differences in fluxes be-
tween normal and drought conditions. Large amounts of ammonia released during
photorespiration via GDC in the mitochondria, were re-assimilated via mitochon-
drial GS. Similar to the flux distribution under non-photorespiratory light conditions
(Chapter 3, Figure 3.3b), reactions through the OPP pathway were inactive, and the
TCA cycle exhibited a noncyclic flux mode under stressed conditions. Haupt-Hert-
ing et al. (2001) have showed that the rate of mitochondrial respiration in the light
is reduced under drought stress in tomato mature leaves, while, a growing leaf cell
was modellied. Though a growing body of evidence from tomato and Arabidopsis
suggests that the activity of the TCA cycle was considerably higher in the light than
reported by Tcherkez et al. (2005), the degree of inhibition of the TCA cycle in the
light is still controversial (Araújo et al., 2012). Compared with other TCA reactions,
the reaction catalyzed by malate dehydrogenase (MDH) carried a relatively high

Modelling photorespiratory metabolism under drought conditions
67
flux in both normal and drought conditions in our prediction. This could be because
MDH functions in redox perturbation but also acts as a component of the malate-
aspartate and malate-oxaloacetate shuttles for the exchange of reducing equivalents
between the mitochondria and the cytosol.
Table 4.2 Predicted flux levels (µmol/g DW/h) of the main metabolic reactions under normal (Vc/Vo=3) and
drought conditions (Vc/Vo=1).
Enzyme name EC Biochemical reaction Vc/Vo=3 Vc/Vo=1
Calvin Cycle
RubisCO carboxylase 4.1.1.39 RuBP +CO2 -> 2 3-PGA 239.67 300.11
PGK 2.7.2.3 3-PGA + ATP <-> DPG + ADP 576.23 1,037.85
GAPDH 1.2.1.13 DPG + NADPH -> GAP + NADP + Pi 576.23 1,038.23
TPI 5.3.1.1 GAP <-> DHAP 232.72 404.30
Aldolase 4.1.2.13 GAP + DHAP <-> FBP -110.01 -202.65
FBPase 3.1.3.11 FBP -> F6P + Pi 110.01 202.65
TKT 2.2.1.1 GAP + F6P <-> E4P + X5P -110.01 -202.65
Aldolase 4.1.2.13 DHAP + E4P -> SBP 108.69 201.65
SBPase 3.1.3.37 SBP -> S7P + Pi 108.69 201.65
TKT 2.2.1.1 GAP + S7P <-> R5P + X5P -108.69 -201.65
RPE 5.1.3.1 X5P <-> Ru5P -218.75 -404.34
RPI 5.3.1.6 R5P <-> Ru5P 101.07 195.88
PRK 2.7.1.19 Ru5P + ATP -> RuBP + ADP 319.82 600.22
Photorespiration
RubisCO oxygenase 4.1.1.39 RuBP + O2 -> 3-PGA + 2-PG 79.96 300.11
PLGP 3.1.3.18 2-PG -> Glt + Pi 79.96 300.11
GOX 1.1.3.15 Glt + O2 -> Gox + H2O2 79.96 300.11
CAT 1.11.1.6 2 H2O2-> 2 H2O + O2 39.97 150.05
GTR 2.6.1.4 Glu + Gox -> Gly + 2-OG -46.54 -153.95
AGT 2.6.1.44 Ala + Gox -> Gly + Pyr - -
GDC
1.4.4.2;
2.1.2.10;
1.8.1.4
Gly + THF + NAD+ -> CO2 + NH3 +NADH + M-THF 45.55 155.35
SHMT 2.1.2.1 Gly + M-THF <-> Ser + THF - -
SGT 2.6.1.45 Ser + Gox -> OH-PYR + Gly 33.51 146.23
HPR 1.1.1.29 OH-PYR + NADH -> Glycerate + NAD 33.51 146.23
GLYK 2.7.1.31 Glycerate + ATP -> 3-PGA + ADP 33.51 146.23
TCA
PDH - Pyr + NAD+ + CoA -> AcCoA + NADH + H+ + CO2 - -
CIT 2.3.3.1 OAA + AcCoA + H2O -> Cit + CoA - -
Aconitase 4.2.1.3 Cit <-> IsoCit 3.77 2.84
IDH 1.1.1.41 IsoCit + NAD+ -> 2-OG + NADH + H+ +CO2 3.77 2.84
OGDH
1.2.4.2;
1.8.1.4
2-OG + NAD+ + CoA -> SucCoA + NADH + H+ + CO2 - -
STK 6.2.1.5 SucCoA + Pi + ADP + H+ -> Suc + ATP +CoA - -

Chapter 4
68
Complex II
1.3.99.1;
1.3.5.1 Suc + Q -> Fum + QH2 - -
Fumarase 4.2.1.2 Fum + H2O -> Mal - -
MDH 1.1.1.37 Mal + NAD+ <-> OAA + NADH + H+ 1,969.48 1,921.19
OPPP
G6PD 1.1.1.49 G6P + NADP+ -> 6PGL + NADPH + H+ - -
6PGL 3.1.1.31 6PGL + H2O -> 6PG - -
6PGD 1.1.1.44 6PG + NAD(P)+ <-> Ru5P + NAD(P)H + CO2 + H+ - -
ETC
Complex I 1.6.5.3 NADH + Q + 5 H+ -> NAD+ + QH2 + 4 H+ 2,018.80 2,079.37
Complex III 1.10.2.2 QH2 + 2Cytox + 2 H+ -> Q + 2Cytred + 4 H+ 2,021.11 2,081.13
Complex IV 1.9.3.1 4Cytred + O2 + 8 H+ -> 4 Cytox + 2H2O + 4 H+ 1,010.59 1,040.59
Complex V 3.6.3.14 ADP + Pi + 4 H+ <-> ATP + H2O + 4 H+ 1,557.50 1,612.28
Nitrogen assimilation
NiR 1.7.7.1 NO3 + NADH -> NO2 + NAD+ 17.62 13.34
NR 1.7.1.2 Fdred + NO2 -> Fdox + NH4+ 17.62 13.34
GS_Plas 6.3.1.2 NH3 + Glu + ATP -> Gln + ADP + Pi + H+
35.10 26.56
GS_Mito 45.55 155.35
GOGAT 1.4.1.14 Gln + 2-OG + NADH + H+ -> 2 Glu + NAD+ - -
1.4.7.1 Gln + 2-OG + 2Fdred + H+ -> 2 Glu +2Fdox 70.01 173.86
‘-’ indicates no flux. ‘GS_Plas’ indicates the plastidic GS, ‘GS_Mito’ indicates the mitochondrial GS.
4.3.3 Evaluation of reaction deletions
A genome-scale metabolic model is a powerful tool to assess the metabolic capabil-
ities of an organism. Aiming to examine the phenotypes of genetic manipulations
with the model, a reaction essentiality analysis for normal (Vc/Vo=3) and drought
stressed conditions (Vc/Vo=1) was performed. To investigate the essentiality of
each reaction, an additional constraint was added by setting each reaction except the
biomass transporters to carry zero flux in addition to the general constraints de-
scribed in section 4.2.2.
In total, 146 and 149 lethal reaction knockouts were identified for normal and
drought conditions, respectively, indicating that these reactions must carry non-zero
fluxes to support biomass synthesis under the simulated conditions (Appendix
4.5.3). All 146 essential reactions identified for normal conditions were also indis-
pensable for drought conditions. With respect to the ability to produce biomass,
approximately 93% of the reactions in the model were non-essential, reflecting that
the metabolic network was robust to random knockout mutations. A number of key
enzymes mainly from the Calvin cycle and the photorespiratory pathway were se-
lected, and their essentiality in models of tomato, rice, Arabidopsis and maize were

Modelling photorespiratory metabolism under drought conditions
69
compared for further verification (Table 4.3). In general, these predictions are sup-
ported by the existing experimental evidence available in other plants such as
Arabidopsis and barley.
Although a few of the essential reactions are common across all 4 plants, such
as RubisCO, ribulose-5-phosphate epimerase and PGLP, our predictions showed
significant difference from that of rice, Arabidopsis and maize (Table 4.3). The es-
sential reactions of iHY3410 listed in Table 4.3 were identified as essential in rice
as well (Lakshmanan et al., 2013b). However, most of photorespiratory reactions
including glutamate:glyoxylate aminotransferase (GGT), serine:glyoxylate ami-
notransferase (SGT), SHMT, hydroxypyruvate reductase (HPR), glycerate kinase
(GLYK) and catalase (CAT) can be bypassed by other isoforms or pathways in
iHY3410, but were regarded as essential in the core rice model (Lakshmanan et al.,
2013b). Importantly, the predictions of essentiality are critically dependent on the
coverage and completeness of the model. In the case of rice, these simulation results
were obtained from a core metabolic network with 417 reactions and only three
subcellular compartments (cytosol, chloroplast, and mitochondrion) without the pe-
roxisome. In comparison, our tomato model was not only constructed at the genome-
scale level but also more compartmentalized. It is likely that the addition of com-
partmentation in a model will give raise to parallel and alternative pathways
(Sweetlove and Ratcliffe, 2011). For example, glyoxylate oxidized from glycolate
by GOX is subsequently metabolized by aminotransferases which redistributes the
nitrogen to a range of amino acids, which then are used for synthesis of the other
amino acids. The assignment of the reactions involved in photorespiratory metabo-
lism in our tomato model and the rice model were illustrated in Figure 3.4 (Chapter
3) and Appendix 4.5.4, respectively, and were summarized in Appendix 4.5.5.
Though the directionality of these reactions was consistent between the two models,
the assigned compartments were different for most of the reactions. In the peroxi-
some of iHY3410, there were three aminotransferases involved in the redistribution
of amino group in the photorespiratory pathway, namely SGT, GGT and ala-
nine:glyoxylate aminotransferase (AGT). As a result, unlike other photorespiratory
mutants (e.g. PGLP), mutants defective in SGT, GGT or AGT activity did not result
in a lethal phenotype in our predictions from iHY3410. By contrast, SGT was clas-
sified as essential in the core rice model in which AGT was not included. Likewise,
our simulations showed that knockout of RPI (Vc/Vo=3) and HPR can be comple-
mented by alternative routes (Figure 4.2 and Figure 4.3, respectively). These
examples illustrate that the application of essentiality analysis on a core metabolic
network could give an overestimation of essential reactions as potential alternative

Chapter 4
70
Table 4.3 Comparisons of essential reactions with other models. ‘+’, essential; ‘-’, non-essential; ‘Unknown’, not reported; ‘#’, essential only under stressed conditions.
Enzyme
EC Pathway iHY3410 Rice Arabidopsis Maize
References
Lakshmanan et al. (2013a) Wang et al., 2012
RubisCO 4.1.1.39 Calvin cycle + + + + Quick et al. (1991)
PRK 2.7.1.19 Calvin cycle + + + + Moll and Levine (1970)
RPE 5.1.3.1 Calvin cycle/PPP + + + +
RPI 5.3.1.6 Calvin cycle/PPP # + + + Xiong et al. (2009)
TKT 2.2.1.1 Calvin cycle/PPP + + + +
SBPase 3.1.3.37 Calvin cycle - + Unknown Unknown
PEPC 4.1.1.31 C4 photosynthesis - - - + Rademacher et al. (2002)
PPDK 2.7.9.1 C4 photosynthesis - Unknown - - Mechin et al. (2007)
PLGP 3.1.3.18 Photorespiration + + - - Schwarte and Bauwe (2007)
GOX 1.1.3.15 Photorespiration + + + + Xu et al. (2009)
GGT 2.6.1.4 Photorespiration - Unknown Unknown Unknown
SGT 2.6.1.45 Photorespiration - + Unknown Unknown Liepman and Olsen (2001)
GDC
1.4.4.2;
2.1.2.10;
1.8.1.4
Photorespiration # + Unknown Unknown Engel et al. (2007)
SHMT 2.1.2.1 Photorespiration - # Unknown Unknown
HPR 1.1.1.29 Photorespiration - Unknown Unknown Unknown
GLYK 2.7.1.31 Photorespiration - + Unknown Unknown
CAT 1.11.1.6 Photorespiration - + Unknown Unknown
GS 6.3.1.2 GS/GOGAT cycle - + Unknown Unknown
Fd-GOGAT 1.4.7.1 GS/GOGAT cycle - + Unknown Unknown
GLBE 2.4.1.18 Starch biosynthesis + + + + Hernández et al. (2008)
TAL 2.2.1.2 PPP - Unknown - -
Aconitase 4.2.1.3 TCA - Unknown + + Carrari et al. (2003)

Modelling photorespiratory metabolism under drought condtions
71
routes that may compensate the reaction deletion were not included in the core
model.
Figure 4.2 The bypass of RPI knockout under normal conditions (Vc/Vo=3) in iHY3410. Grey line indicates the
reaction is blocked.
The model predictions on reaction essentiality may also differ depending on
the conditions simulated. For example, in Arabidopsis and maize, 1,4-alpha-glucan
branching enzyme (EC 2.4.1.18) was essential when optimizing biomass produc-
tion, while in the same networks, its knockout had no lethal effect regarding CO2
fixation (Wang et al., 2012). A handful of photorespiratory mutants in C3 species
have been generated, notably Arabidopsis and barley, but a very limited set has been
generated for tomato (Foyer et al., 2009). Thus, the majority of the in silico pho-
torespiratory mutants predicted from our tomato model remain to be validated
experimentally.

Chapter 4
72
Figure 4.3 The bypass of HPR knockout in iHY3410. Numbered reactions are catalyzed by the following enzymes:
1, serine dehydratase (EC 4.3.1.17); 2, pyruvate phosphate dikinase (EC 2.7.9.1); 3, phosphopyruvate hydratase
(EC 4.2.1.11); 4, phosphoglycerate mutase (EC 5.4.2.12).
4.4 Conclusions
The reconstructed genome-scale metabolic model of tomato, iHY3410 allowed us
to simulate the metabolic behavior under various environmental conditions,
including normal and drought conditions using flux balance analysis. Our model
simulations predicted that the flux distributions through the MVA pathway under
drought stressed conditions were distinct from that under normal conditions. In
addition, the change in fluxes through the core metabolic pathways between normal
and drought conditions reflected the plant adaptive response to drought stress. The
application of genome-scale networks to the abiotic stresses in plants is still in its
infancy, and the presented tomato model can serve as a starting point for studying
the functional consequences of abiotic stresses. While iHY3410 was used for
analysing the behaviour of leaves in this study, it could also be used for exploring
the metabolic behaviour of tomato fruit in future studies.
4.5 Appendix
Appendix 4.5.1 FBA and FVA results of photorespiratory scenarios in nor-
mal and drought conditions for minimizing total flux. Can be found at:
http://onlinelibrary.wiley.com/doi/10.1111/tpj.13075/abstract
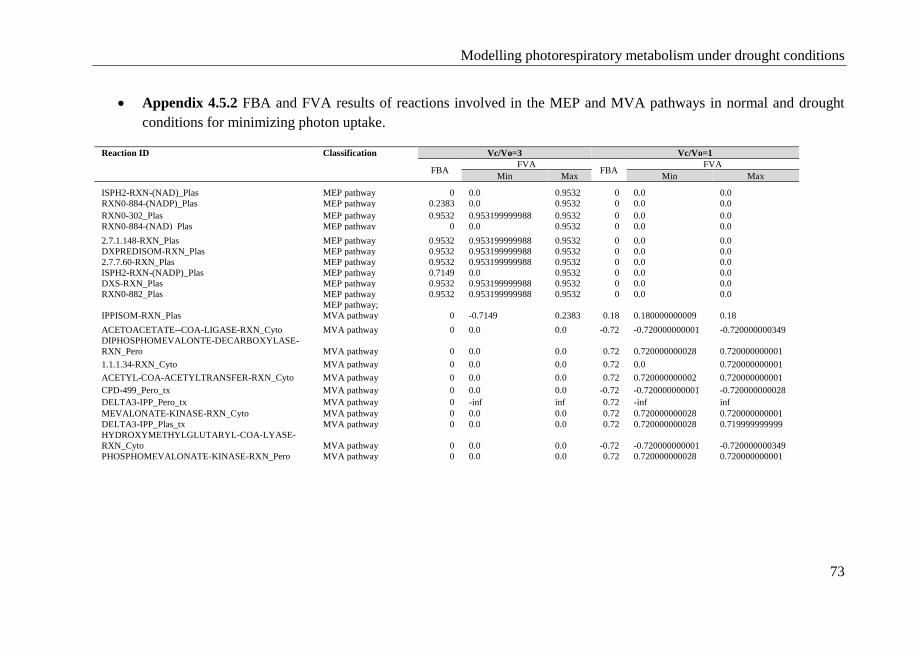
Modelling photorespiratory metabolism under drought conditions
73
Appendix 4.5.2 FBA and FVA results of reactions involved in the MEP and MVA pathways in normal and drought
conditions for minimizing photon uptake.
Reaction ID Classification Vc/Vo=3 Vc/Vo=1
FBA FVA
FBA FVA
Min Max Min Max
ISPH2-RXN-(NAD)_Plas MEP pathway 0 0.0 0.9532 0 0.0 0.0
RXN0-884-(NADP)_Plas MEP pathway 0.2383 0.0 0.9532 0 0.0 0.0
RXN0-302_Plas MEP pathway 0.9532 0.953199999988 0.9532 0 0.0 0.0
RXN0-884-(NAD)_Plas MEP pathway 0 0.0 0.9532 0 0.0 0.0
2.7.1.148-RXN_Plas MEP pathway 0.9532 0.953199999988 0.9532 0 0.0 0.0
DXPREDISOM-RXN_Plas MEP pathway 0.9532 0.953199999988 0.9532 0 0.0 0.0
2.7.7.60-RXN_Plas MEP pathway 0.9532 0.953199999988 0.9532 0 0.0 0.0
ISPH2-RXN-(NADP)_Plas MEP pathway 0.7149 0.0 0.9532 0 0.0 0.0
DXS-RXN_Plas MEP pathway 0.9532 0.953199999988 0.9532 0 0.0 0.0
RXN0-882_Plas MEP pathway 0.9532 0.953199999988 0.9532 0 0.0 0.0
IPPISOM-RXN_Plas
MEP pathway;
MVA pathway 0 -0.7149 0.2383 0.18 0.180000000009 0.18
ACETOACETATE--COA-LIGASE-RXN_Cyto MVA pathway 0 0.0 0.0 -0.72 -0.720000000001 -0.720000000349
DIPHOSPHOMEVALONTE-DECARBOXYLASE-
RXN_Pero MVA pathway 0 0.0 0.0 0.72 0.720000000028 0.720000000001
1.1.1.34-RXN_Cyto MVA pathway 0 0.0 0.0 0.72 0.0 0.720000000001
ACETYL-COA-ACETYLTRANSFER-RXN_Cyto MVA pathway 0 0.0 0.0 0.72 0.720000000002 0.720000000001
CPD-499_Pero_tx MVA pathway 0 0.0 0.0 -0.72 -0.720000000001 -0.720000000028
DELTA3-IPP_Pero_tx MVA pathway 0 -inf inf 0.72 -inf inf
MEVALONATE-KINASE-RXN_Cyto MVA pathway 0 0.0 0.0 0.72 0.720000000028 0.720000000001
DELTA3-IPP_Plas_tx MVA pathway 0 0.0 0.0 0.72 0.720000000028 0.719999999999
HYDROXYMETHYLGLUTARYL-COA-LYASE-
RXN_Cyto MVA pathway 0 0.0 0.0 -0.72 -0.720000000001 -0.720000000349
PHOSPHOMEVALONATE-KINASE-RXN_Pero MVA pathway 0 0.0 0.0 0.72 0.720000000028 0.720000000001
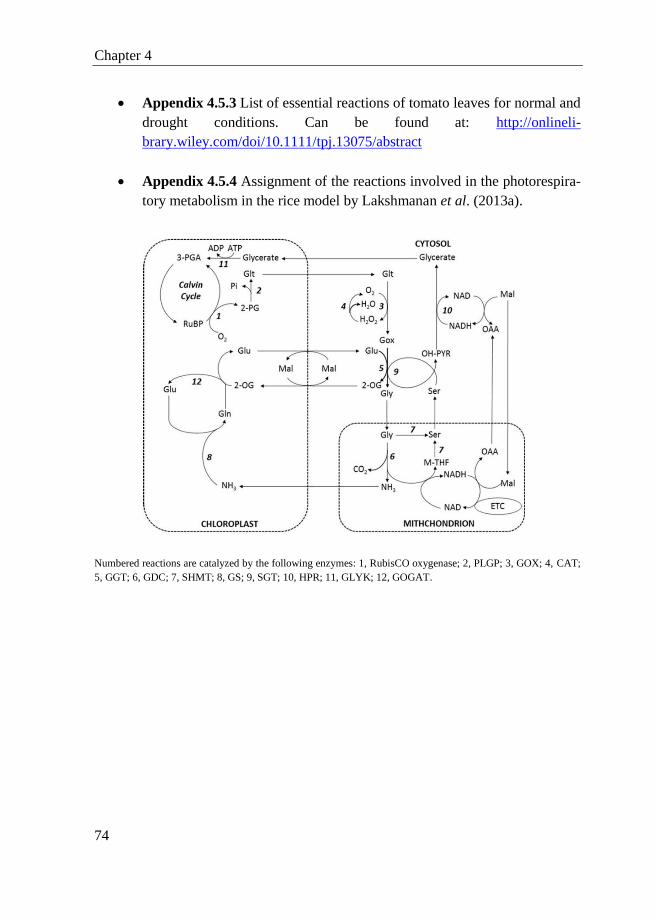
Chapter 4
74
Appendix 4.5.3 List of essential reactions of tomato leaves for normal and
drought conditions. Can be found at: http://onlineli-
brary.wiley.com/doi/10.1111/tpj.13075/abstract
Appendix 4.5.4 Assignment of the reactions involved in the photorespira-
tory metabolism in the rice model by Lakshmanan et al. (2013a).
Numbered reactions are catalyzed by the following enzymes: 1, RubisCO oxygenase; 2, PLGP; 3, GOX; 4, CAT;
5, GGT; 6, GDC; 7, SHMT; 8, GS; 9, SGT; 10, HPR; 11, GLYK; 12, GOGAT.

Modelling photorespiratory metabolism under drought conditions
75
Appendix 4.5.5 Comparisons of photorespiratory reactions between iHY3410 and a rice core model.
Reaction
Name EC Reaction Stoichiometry
iHY3410 Rice (Lakshmanan et al., 2013a)
Reaction ID Compartment Directionality Reaction ID Compartment Directionality
RubisCO
oxygenase 4.1.1.39 RuBP + O2 -> 3-PGA + 2-PG RXN-961_Plas plastid -> RBCS_O_p_ plastid ->
PLGP 3.1.3.18 2-PG -> Glt + Pi GPH-RXN_Plas plastid -> PGP_p_ plastid ->
GOX 1.1.3.15 Glt + O2 -> Gox + H2O2 RXN-969_Pero peroxisome -> GOX_c_ cytosol ->
CAT 1.11.1.6 2 H2O2-> 2 H2O + O2 CATAL-RXN_Pero peroxisome -> CAT_c_ cytosol ->
GGT 2.6.1.4 Glu + Gox -> Gly + 2-OG GLYCINE-AMINOTRANSFERASE-
RXN_Pero peroxisome -> GGAT_c_ cytosol ->
AGT 2.6.1.44 Ala + Gox -> Gly + Pyr ALANINE--GLYOXYLATE-
AMINOTRANSFERASE-RXN_Pero peroxisome -> Not included Not included Not included
GDC
1.4.4.2;
2.1.2.10;
1.8.1.4
Gly + THF + NAD -> CO2 + NH3
+NADH + M-THF GCVMULTI-RXN_Mito mitochondria -> GDC_m_ mitochondria ->
SHMT 2.1.2.1 Gly + M-THF <-> Ser + THF GLYOHMETRANS-RXN_Mito mitochondria <=> SHM1_m_ mitochondria <=>
SGT 2.6.1.45 Ser + Gox -> OH-PYR + Gly SERINE-GLYOXYLATE-
AMINOTRANSFERASE-RXN_Pero peroxisome -> SGAT_c_ cytosol ->
HPR 1.1.1.29 OH-PYR + NADH -> Glycerate + NAD GLYCERATE-DEHYDROGENASE-
RXN_Pero peroxisome -> HPR_c_ cytosol ->
GLYK 2.7.1.31 Glycerate + ATP -> 3-PGA + ADP GLY3KIN-RXN_Plas plastid -> GLYK_p_ plastid ->
GS 6.3.1.2 NH3 + Glu + ATP -> Gln + ADP + Pi +
H+ GLUTAMINESYN-RXN_Mito mitochondria -> GLN2_p_ plastid ->


Chapter 5 Modelling the effects of
light intensity and quality on
light-driven metabolism of
tomato1
1 Part of this chapter is described in:
Yuan, H., Cheung, C.Y.M., Hilbers, P.A.J. and van Riel, N.A.W. Modelling the
effects of light intensity and quality on the light-driven metabolism of to-
mato. In preparation

Abstract
The light environment of plants can highly vary in intensity and quality, both of
which markedly impact plant growth and development. Such influences have been
studied extensively, but often independently. Thus, very little is known about the
influence of changing light intensity on the cellular growth and photosynthetic pro-
cess of plants grown under different light sources. In this chapter, the cellular growth
and its metabolic properties in response to changing light intensity and quality were
studied using a light-specific metabolic model of tomato. The in silico analysis of
the light-driven process was conducted under low light (LL, 50 µmol/m2/s) and high
light intensity (HL, 700 µmol/m2/s) for seven different light sources, respectively.
The model successfully described the different responses of leaf cells to quantitative
and qualitative changes in light. The in-depth investigation of energy balancing
highlights the importance of mitochondrial respiration in regulating the
ATP/NADPH ratio for optimal growth. Our model predictions showed that, in the
LL state of yellow light, aldehyde dehydrogenase (ALDH) may represent an im-
portant metabolic interaction between plastid and other intracellular organelles. This
may help in a better understanding of photosynthetic response and adaption to the
changing light condition.

Modelling the effects of light intensity and quality
79
5.1 Introduction
Plants live in fluctuating light conditions, in which both light intensity and light
quality change by several orders of magnitude during the day and throughout the
year (Eaton-Rye et al., 2011). Such variations markedly affect growth, development
and yield. Regarding the effect of light quality, numerous publications have been
published in the last decades (Wang et al., 2010; Liu et al., 2011; Liu et al., 2014;
Lorente, et al., 2016). In addition to plant growth and development, light quality
also affects fruit ripening. For this reason, much attention has been paid to improve
the nutritional quality of fruit such as tomato using the genetic and molecular apprby
manipulating light signal transduction machinery (Liu et al., 2014; Lorente, et al.,
2016).
Tomato is one of the most popular vegetables in the world, which can be grown
in the field, but increasingly, greenhouse tomato production occurs very commonly.
In some countries, tomatoes are almost exclusively grown in greenhouse (Brazaitytè
et al., 2009). With rapid advances in lighting technology, tomato can be grown all
year around in greenhouse, thus, allowing for stable tomato production to meet its
highly market demand, regardless of the environmental conditions. Among the var-
ious artificial light sources, light-emitting diodes (LEDs) is the most promising
supplemental lighting technology for greenhouse crop production due to its small
size, long lifetime, narrow bandwidths and cool emitting temperature (Muneer et
al., 2014).
Plants require light for photosynthesis as the primary energy source. Changes
in light intensity and quality directly influence the ability of phototrophs to fix CO2
and thus require photosynthetic cells to adjust their cellular metabolism accordingly.
As sessile organisms, plants have tremendous capacity to adjust their metabolism in
response to changes in growth conditions. To obtain a holistic picture of the light-
driven metabolism, it is highly needed to develop a systematic approach to under-
stand the metabolic changes and adjustments of plants. In this regard, constraint-
based modelling (CBM) has proven to be a very promising tool for the systems-
level analysis of cellular metabolism, yielding new insights into condition-depend-
ent metabolic flux distributions and cellular physiology. As yet, such constraint-
based metabolic models have been constructed for a variety of biological systems,
including photosynthetic organisms. Moreover, to characterize metabolic properties
underlying changing light conditions, attempts have already been made (Chang et
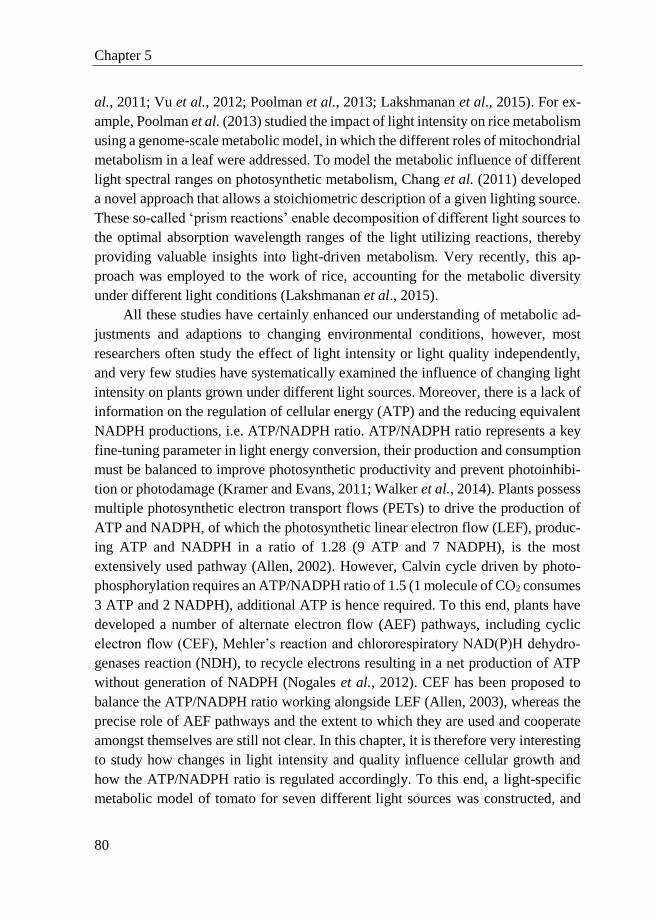
Chapter 5
80
al., 2011; Vu et al., 2012; Poolman et al., 2013; Lakshmanan et al., 2015). For ex-
ample, Poolman et al. (2013) studied the impact of light intensity on rice metabolism
using a genome-scale metabolic model, in which the different roles of mitochondrial
metabolism in a leaf were addressed. To model the metabolic influence of different
light spectral ranges on photosynthetic metabolism, Chang et al. (2011) developed
a novel approach that allows a stoichiometric description of a given lighting source.
These so-called ‘prism reactions’ enable decomposition of different light sources to
the optimal absorption wavelength ranges of the light utilizing reactions, thereby
providing valuable insights into light-driven metabolism. Very recently, this ap-
proach was employed to the work of rice, accounting for the metabolic diversity
under different light conditions (Lakshmanan et al., 2015).
All these studies have certainly enhanced our understanding of metabolic ad-
justments and adaptions to changing environmental conditions, however, most
researchers often study the effect of light intensity or light quality independently,
and very few studies have systematically examined the influence of changing light
intensity on plants grown under different light sources. Moreover, there is a lack of
information on the regulation of cellular energy (ATP) and the reducing equivalent
NADPH productions, i.e. ATP/NADPH ratio. ATP/NADPH ratio represents a key
fine-tuning parameter in light energy conversion, their production and consumption
must be balanced to improve photosynthetic productivity and prevent photoinhibi-
tion or photodamage (Kramer and Evans, 2011; Walker et al., 2014). Plants possess
multiple photosynthetic electron transport flows (PETs) to drive the production of
ATP and NADPH, of which the photosynthetic linear electron flow (LEF), produc-
ing ATP and NADPH in a ratio of 1.28 (9 ATP and 7 NADPH), is the most
extensively used pathway (Allen, 2002). However, Calvin cycle driven by photo-
phosphorylation requires an ATP/NADPH ratio of 1.5 (1 molecule of CO2 consumes
3 ATP and 2 NADPH), additional ATP is hence required. To this end, plants have
developed a number of alternate electron flow (AEF) pathways, including cyclic
electron flow (CEF), Mehler’s reaction and chlororespiratory NAD(P)H dehydro-
genases reaction (NDH), to recycle electrons resulting in a net production of ATP
without generation of NADPH (Nogales et al., 2012). CEF has been proposed to
balance the ATP/NADPH ratio working alongside LEF (Allen, 2003), whereas the
precise role of AEF pathways and the extent to which they are used and cooperate
amongst themselves are still not clear. In this chapter, it is therefore very interesting
to study how changes in light intensity and quality influence cellular growth and
how the ATP/NADPH ratio is regulated accordingly. To this end, a light-specific
metabolic model of tomato for seven different light sources was constructed, and

Modelling the effects of light intensity and quality
81
the metabolic states under low light (LL, 50 µmol/m2/s) and high light (HL, 700
µmol/m2/s) were predicted for each light source, respectively.
5.2 Methods
5.2.1 Reconstruction of a tomato light-specific model
The tomato light-specific model was reconstructed by expanding our model
iHY3410 described in Chapter 3 to describe the photon-utilising reactions and prism
reactions in a wavelength-specific manner as implemented by Chang et al. (2011)
and Lakshmanan et al. (2015), respectively. In the tomato light-specific model, the
photosynthetic active light spectrum (PAR, 400-700 nm) was divided into 30 parts,
each denoting 10 nm cumulative region. For instance, the first part denoted by 405
nm covers the region from 400 to 410 nm, the second part denoted by 415 nm covers
from 410 to 420 nm, and so on. The prism reaction, which represents the wave-
length-specific photon composition of a given light source, was generated according
to the approach developed by Chang et al. (2011). Mathematically, it can be repre-
sented as below:
where C is the ratio of photon available in that particular range to total photons in
the visible spectrum of a given light source (Chang et al., 2011). In this manner, it
is possible to distinguish the amount of emitted wavelength-specific photons that
drive different metabolic reactions.
Prism reactions for 7 distinct light sources were generated, including solar
light, white light, blue, green, yellow, and red peak at 640nm (Red640) as well as
red peak at 660nm (Red660) LEDs using the manufacturer’s spectral irradiance
graphs. The spectral distribution of white light, blue, green, yellow and Red640 were
obtained from Liu et al. (2011), while the spectrum of Red660 was collected from
Yang et al. (2014). For solar light, its spectral irradiance was collected from an
online resource (http://www.mv.helsinki.fi/aphalo/photobio/lamps.html). The re-
sulting prism reaction equations were then added to iHY3410 to enable light source-
specific simulations.
PhotonVis 410 420 430 440 450
400 410 420 430 440
460 470 480 490 500
450 460 470 480 490
510
500
C photon405 C photon415 C photon425 C photon435 C photon445
C photon455 C photon465 C photon475 C photon485 C photon495
C photon505
520 530 540 550
510 520 530 540
560 570 580 590 600
550 560 570 580 590
610 620
600 610 6
C photon515 C photon525 C photon535 C photon545
C photon555 C photon565 C photon575 C photon585 C photon595
C photon605 C photon615 C
630 640 650
20 630 640
660 670 680 690 700
650 660 670 680 690
photon625 C photon635 C photon545
C photon655 C photon665 C photon675 C photon685 C photon695

Chapter 5
82
Accordingly, the light-utilising reactions, including photosystems I (PSI), pho-
tosystems II (PSII) and protochlorophyllide oxidoreductase were drafted, in a
wavelength-specific manner. For example, PSII at 405 nm is written as follows:
4.0 photon405_Plas + 2.0 PLASTOQUINONE_Plas --> OXYGEN-
MOLECULE_Plas + 2.0 PLASTOQUINOL-1_Plas + 4.0 Pumped-PROTON_Plas
The available wavelength-specific photons for each light-utilising reaction was
constrained by the maximal absolute amount of usable photons which is derived
based on the absorptivity graphs (Shioi and Sasa, 1984; Nield et al., 2000; Kargul
et al., 2003) multiplied with the total actual photons (320 µmol/m2/s; Liu et al.,
2011). More information is given in Appendix 5.6.1. Excess wavelength-specific
photons which are not metabolically utilised by light-utilising reactions leave the
network via so-called sink reactions, for example, ‘DM_Photon405’.
5.2.2 Constraint-based flux analysis
All simulations in this chapter were performed using ScrumPy package for Linux.
FBA and FVA were performed as described in Chapter 3 (section 3.2.3). A two-step
optimization procedure was applied, where the first step is to maximize growth and
the second step is to minimize total flux. The computation is performed by adding
the objective value, i.e. growth rate of the first optimization as an additional con-
straint to the second optimization. The model was constrained with values for
sucrose and amino acid export to the phloem, chlorophyll turnover (Appendix
5.6.1), nitrate uptake, ATP maintenance cost, a 3:1 ratio for the carboxylase and
oxygenase activities of Rubisco, and other C3-specific constraints as described in
Chapter 3. Due to the scarcity of the experimental data for different light sources,
the phloem composition was assumed remain constant for each light source, thus,
allowing to assess the metabolic changes under different light sources in order to
produce the required metabolites. It should be noted that chlorophylls are also taken
into account in the output demand, although they are not stored in the phloem sap.
This is because chlorophyll can be damaged at high light intensities, resulting in
photoinhinition by decreasing the photosynthetic capacity. Thus, we assumed there
is a constant need to synthesize chlorphyll, i.e. chlorophyll turnover. Chlorophyll
turnover rate were obtained from a previous publication (Nunes-Nesi et al., 2007),
and assumed to be constant under each light source. In addition, fluxes through the
chloroplastic NADPH dehydrogenase (NDH) and plastoquinol oxidase (PTOX)
were set to zero as chlororespiration, involved in NDH and PTOX, is thought to

Modelling the effects of light intensity and quality
83
occur primarily in the dark (Josse et al., 2000; Yamamoto et al., 2011). As men-
tioned above, a set of constraints for the absorption of light-utilising reactions, at
specific wavelength were also defined (detailed in Appendix 5.6.1).
To relate the model predictions to physiological values, the light saturation
point (LSP) of each light source was scaled to a respective experimentally measured
LSP for tomato plants grown under approximate 320 µmol/m2/s (Liu et al., 2011).
5.2.3 Flux-sum
At steady-state, the net rate for internal metabolite consumption and production is
zero, but its turnover rate is not. To compare the metabolite turnover rates among
different light conditions, the ‘flux-sum’ of metabolite i, is used as a proxy for
metabolite turnover. In mathematical, the flux-sum can be formulated as:
where Sij is the stoichiometric coefficient of metabolite i involved in reaction j, vj
denotes metabolic flux of reaction j (Chung and Lee, 2009).
5.3 Results
5.3.1 Representation of photosynthetic light reactions in existing
plant GSMs
As mentioned earlier, plants possess multiple PETs such as LEF and AEF to main-
tain the variability of ATP/NADPH ratio. However, representing these
photosynthetic light reactions as biochemical reactions is a big challenge for con-
structing the metabolic network of photosynthetic organisms because of the
complicity of light capture. This would lead to the representation of light reactions
nonstandard and non-conserved. As shown in Table 5.1, the reconstructed plant
metabolic networks do differ in the representation of light reactions, in particular,
on the degree of details in representing light reactions. Among the 22 surveyed plant
metabolic networks, only 2 models accounted for all the possible PETs and detailed
i
0.5 | |i ij j
j
S v
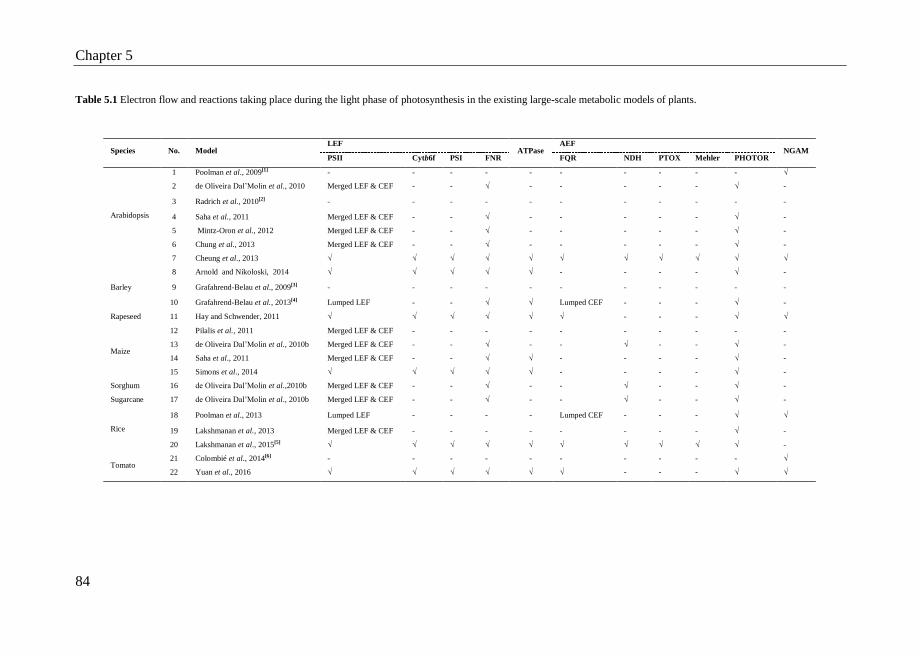
Chapter 5
84
Table 5.1 Electron flow and reactions taking place during the light phase of photosynthesis in the existing large-scale metabolic models of plants.
Species No. Model LEF
ATPase AEF
NGAM PSII Cytb6f PSI FNR FQR NDH PTOX Mehler PHOTOR
Arabidopsis
1 Poolman et al., 2009[1] - - - - - - - - - - √
2 de Oliveira Dal’Molin et al., 2010 Merged LEF & CEF - - √ - - - - - √ -
3 Radrich et al., 2010[2] - - - - - - - - - - -
4 Saha et al., 2011 Merged LEF & CEF - - √ - - - - - √ -
5 Mintz-Oron et al., 2012 Merged LEF & CEF - - √ - - - - - √ -
6 Chung et al., 2013 Merged LEF & CEF - - √ - - - - - √ -
7 Cheung et al., 2013 √ √ √ √ √ √ √ √ √ √ √
8 Arnold and Nikoloski, 2014 √ √ √ √ √ - - - - √ -
Barley
9 Grafahrend-Belau et al., 2009[3] - - - - - - - - - - -
10 Grafahrend-Belau et al., 2013[4] Lumped LEF - - √ √ Lumped CEF - - - √ -
Rapeseed
11 Hay and Schwender, 2011 √ √ √ √ √ √ - - - √ √
12 Pilalis et al., 2011 Merged LEF & CEF - - - - - - - - - -
Maize
13 de Oliveira Dal’Molin et al., 2010b Merged LEF & CEF - - √ - - √ - - √ -
14 Saha et al., 2011 Merged LEF & CEF - - √ √ - - - - √ -
15 Simons et al., 2014 √ √ √ √ √ - - - - √ -
Sorghum 16 de Oliveira Dal’Molin et al.,2010b Merged LEF & CEF - - √ - - √ - - √ -
Sugarcane 17 de Oliveira Dal’Molin et al., 2010b Merged LEF & CEF - - √ - - √ - - √ -
Rice
18 Poolman et al., 2013 Lumped LEF - - - - Lumped CEF - - - √ √
19 Lakshmanan et al., 2013 Merged LEF & CEF - - - - - - - - √ -
20 Lakshmanan et al., 2015[5] √ √ √ √ √ √ √ √ √ √ -
Tomato 21 Colombié et al., 2014[6] - - - - - - - - - - √
22 Yuan et al., 2016 √ √ √ √ √ √ - - - √ √

Modelling the effects of light intensity and quality
85
Symbol “-” indicates information is not included; “√”indicates information is included. LEF, linear electron flow;
AEF, alternative electron flow; PSII, photosystem II; Cytob6f, cytochrome b6f complex; PSI, photosystem I; FNR,
ferredoxin NADP+ oxidoreductase; ATPase, plastidic ATP synthethase; FQR, ferredoxin PQ reductase; NDH,
NAD(P)H dehydrogenase; PTOX, plastid terminal oxidase; Mehler, Mehler’s reaction; PHOTOR, photorespira-
tion. [1] the model represents a heterotrophic cell; [2] the work aimed at presenting a methodology for integration of dif-
ferent databases, rather than FBA simulation; [3] the model was used for studying the seed metabolism; [4] the study
constructed an tissue-specific models (including barley leaf, stem and seed) on a whole-plant scale. The indicated
light-dependent reactions are present in the leaf and stem models; [5] the model is an extension of a core model
published by Lakshmanan et al. (2013); [6] the model was used to investigate the heterotrophic metabolism of tomato
fruit.
them into several reactions (Cheung et al., 2013; Lakshmanan et al., 2015). Notice-
ably, 10 models simply used an aggregate reaction to describe
photophosphorylation, in which photons convert H2O into ATP and NADPH with a
fixed ratio of 1.5. Although such representation accounts for both LEF and AEF,
however, it is not sufficient to infer which AEF exactly contributes to the additional
ATP production in these studies. In some other studies, light reactions are detailed
into several reactions, but only accounting for LEF and CEF (Arnold and Nikoloski,
2014; Yuan et al., 2016).
Undoubtedly, an accurate representation of photophosphorylation will promote
to better understand photosynthetic processes. Therefore, it necessitates to take into
account all possible PETs. To this end, the tomato genome-scale model, iHY3410
described in Chapter 3 was extended by adding the ferredoxin plastoquinone reduc-
tase (FQR) reaction as well as the Mehler and related reactions, e.g., NDH and
PTOX as putative additional alternate electron transport pathways (Appendix 5.6.2).
5.3.2 Two published light-specific models
To build a light-specific model of tomato, two references from published models
were exploited: one is for Chlamydomonas (iRC1080; Chang et al., 2011), and the
other is for rice (iOS2164; Lakshmanan et al., 2015). Both of the models accounted
for the light-driven photophosphorylation reaction in a wavelength-specific way,
and permitted growth simulations under different light sources. The modelling ap-
proaches used in algae and rice (illustrated in Figure 5.1) are quite similar, but with
a few differences that are discussed in detail below.

Chapter 5
86
Figure 5.1 Comparison of light-specific modelling approaches between algal model and rice model.
In addition to the traditional reactions (e.g., transporters and metabolic reac-
tions) included in metabolic networks, 3 types of reactions, i.e. prism reaction,
photon-utilising reaction and sink reaction, were introduced to account for the reac-
tions that associate with light in the light-specific models. Prism reaction described
in a stoichiometric way represents the spectral composition of a given lighting
source. Either in Chang et al. (2011) or Lakshmanan et al. (2015), the calculation
of the coefficient for each photon wavelength bandwidth in prism reaction (denoted
as C) is the same, defined as the number of photons available at a particular wave-
length bandwidth divided by the total available photons in PAR emitted by a given
light source, however, the two models differed in decomposing the lighting spec-
trum. In Chang et al. (2011) approach, the spectrum of light source is decomposed
by the most efficient spectral bandwidths (blue and red regions) based on the reac-
tion activity of photon-utilising reactions in an unequal and non-continues way. It
should be noted that this binning manner results in overlapping regions, hence, light
sources are distinguished by the amount of photons that are utilised by metabolic
reactions. In contrast, the rice model iOS2164 divided the lighting spectrum into
equal parts through the whole visible light range in a continuous way. Thus, the sum
of C (i.e. 1) remain constant among all the light sources, indicating that light sources
are distinguished by the amounts of wavelength-specific photons rather than by the
amount of photons.
Photon-utilising reaction represents the reactions that are dependent on light
such as photosystem I (PSI) and photosystem II (PSII). Given that not all absorbed
photons are utilised by metabolic reactions and these photons must be leaked from
the system to avoid photodamage to the cells, sink reaction denoting the absorbed

Modelling the effects of light intensity and quality
87
but not utilised photons is added to the light-specific model. Additionally, light ab-
sorption reaction is added to the model of Lakshmanan et al. (2015), in a
wavelength-specific manner as described the prism reaction. Light absorption reac-
tion is the intermediate step between light input and the respective photon-utilising
metabolic reactions in the rice model, which is combined into photon-utilising re-
action in the alga model. One thing that needs to be pointed out is that in rice model,
wavelength-specific photons that are not absorbed by one light absorption reaction
will directly leave the system via sink reaction, which is actually not realistic in
planta because photons that are not absorbed by one light absorption reaction could
be absorbed by other photon absorption reactions. Consequently, changes to the ap-
proach introduced in rice model were made, by combing the light absorption
reaction with light-utilising reaction as implemented by Chang et al. (2011), mean-
while, light-utilising reac-tions are constrained by the maximal usable photons, at
specific wavelength (section 5.2.1).
5.3.3 Model properties
The genome-scale metabolic model of tomato was extended, iHY3410 described in
Chapter 3, to a light-specific model. In total, the developed model includes 127 re-
actions denoting the wavelength-specific spectral decomposition (for detailed
procedure see section 5.2.1). As the photo-synthetic reactions are of particular im-
portance, all photosynthetic reactions in the iHY3410 were corrected where
necessary. Specifically, the protochllidelide reductase reactions were corrected,
changing from the cytosol to the plastid. The resulting tomato light-specific model
is given in Appendix 5.6.3, and a simplified scheme of the tomato light-specific
model is shown in Figure 5.2.

Chapter 5
88
Figure 5.2 Schematic overview of the light-specific model of tomato mature leaves. The numbers (15 and 2) indi-
cate the number of associated reactions.
5.3.4 Growth simulation of tomato cells under different light
conditions
On the basis of the reconstructed light-specific model, the metabolism of mature
non-growing leaves was studied by maximizing growth rate as a function of light
influx. Optimal growth rates were computed under changing light intensity for a
given light source while subject to constraints mentioned above (section 5.2.2). Ba-
sically, constraining the upper limit on wavelength-specific photons is quite similar
to setting an upper limit on CO2 uptake rate as implemented in previous studies
(Nogales et al., 2012; Maarleveld et al., 2014). While in this case, both maximal
light absorption and utilisation are taken into account in model constraints.
According to the LSP, two unique states are identified for each given light
source: (1) low light (LL) in which light is limiting for growth, and (2) high light
(HL) in which light is excess, but CO2 is limiting for growth (correspond to carbon-
limiting sate as carbon fixation becomes light-saturated). To enable a fair compari-
son among different light sources, a light intensity of 50 µmol/m2/s, which is lower
than the LSPs of all considered light sources to represent LL state, was selected for
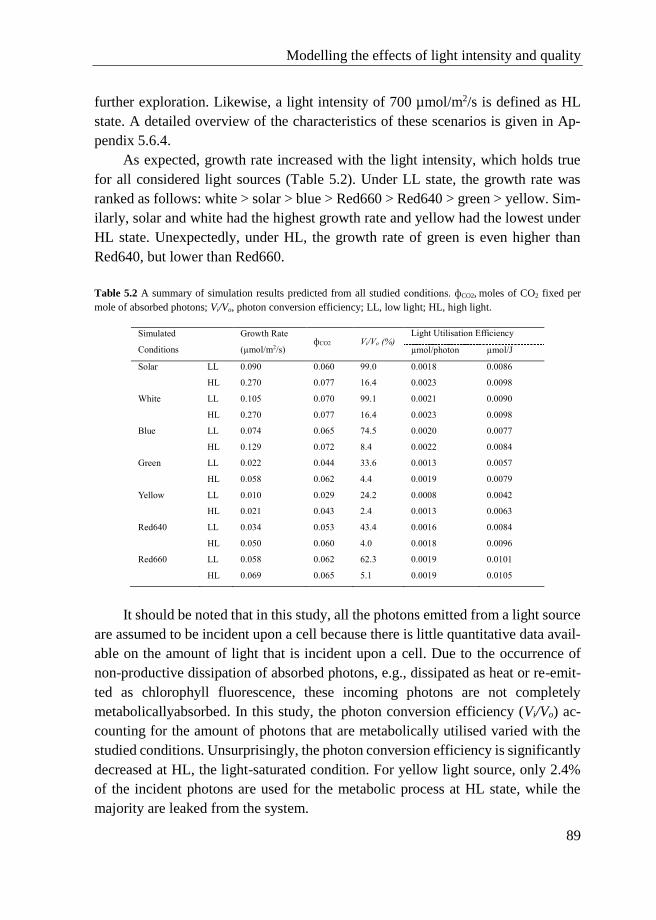
Modelling the effects of light intensity and quality
89
further exploration. Likewise, a light intensity of 700 µmol/m2/s is defined as HL
state. A detailed overview of the characteristics of these scenarios is given in Ap-
pendix 5.6.4.
As expected, growth rate increased with the light intensity, which holds true
for all considered light sources (Table 5.2). Under LL state, the growth rate was
ranked as follows: white > solar > blue > Red660 > Red640 > green > yellow. Sim-
ilarly, solar and white had the highest growth rate and yellow had the lowest under
HL state. Unexpectedly, under HL, the growth rate of green is even higher than
Red640, but lower than Red660.
Table 5.2 A summary of simulation results predicted from all studied conditions. фCO2, moles of CO2 fixed per
mole of absorbed photons; Vi/Vo, photon conversion efficiency; LL, low light; HL, high light.
Simulated
Conditions
Growth Rate
(µmol/m2/s) фCO2 Vi/Vo (%)
Light Utilisation Efficiency
µmol/photon µmol/J
Solar LL 0.090 0.060 99.0 0.0018 0.0086
HL 0.270 0.077 16.4 0.0023 0.0098
White LL 0.105 0.070 99.1 0.0021 0.0090
HL 0.270 0.077 16.4 0.0023 0.0098
Blue LL 0.074 0.065 74.5 0.0020 0.0077
HL 0.129 0.072 8.4 0.0022 0.0084
Green LL 0.022 0.044 33.6 0.0013 0.0057
HL 0.058 0.062 4.4 0.0019 0.0079
Yellow LL 0.010 0.029 24.2 0.0008 0.0042
HL 0.021 0.043 2.4 0.0013 0.0063
Red640 LL 0.034 0.053 43.4 0.0016 0.0084
HL 0.050 0.060 4.0 0.0018 0.0096
Red660 LL 0.058 0.062 62.3 0.0019 0.0101
HL 0.069 0.065 5.1 0.0019 0.0105
It should be noted that in this study, all the photons emitted from a light source
are assumed to be incident upon a cell because there is little quantitative data avail-
able on the amount of light that is incident upon a cell. Due to the occurrence of
non-productive dissipation of absorbed photons, e.g., dissipated as heat or re-emit-
ted as chlorophyll fluorescence, these incoming photons are not completely
metabolicallyabsorbed. In this study, the photon conversion efficiency (Vi/Vo) ac-
counting for the amount of photons that are metabolically utilised varied with the
studied conditions. Unsurprisingly, the photon conversion efficiency is significantly
decreased at HL, the light-saturated condition. For yellow light source, only 2.4%
of the incident photons are used for the metabolic process at HL state, while the
majority are leaked from the system.

Chapter 5
90
Going beyond merely comparing the growth rate under different light condi-
tions, the light utilisation efficiency of these light sources was evaluated in terms of
three criteria, including quantum field (фCO2), and growth rate on numbers of pho-
tons as well as on photon energy. The quantum yield of photosynthesis is regarded
as a definitive and also generic measure of the energetic efficiency of phototrophs.
In this study, the quantum yield is defined by the moles of CO2 fixed (by Rubisco
carboxylase) per mole of absorbed photons (Appendix 5.6.5). The computed quan-
tum yields are in a range of 0.029 to 0.077 in the studied conditions, within which
the larger value is obtained from white, followed by solar and blue, and yellow is
the lowest, irrespective of LL or HL. In term of the growth rate on the number of
photons, similar results are obtained for the studied conditions. However, from the
perspective of energy, it reveals a different story, showing the two red lights (espe-
cially Red660) are more efficient compared to other light sources no matter the LL
or HL state.
5.3.5 Exploring energy balancing in the light
Analyses of light utilisation efficiency gave us additional information on the cellular
metabolism, e.g., flux distributions between PSII and PSI. The same amount of
fluxes were predicted to flow into PSI and PSII (i.e. PSI/PSII = 1) in all the simu-
lated conditions (Appendix 5.6.5), suggesting ATP is synthesized in the plastid
entirely through LEF, i.e. CEF around PSI is inactive. As aforementioned, LEF
alone is unable to satisfy the ATP/NADPH ratio requirement. Hence, there should
be other routes that contribute to the balance of ATP and NADPH in the model
predictions. Both FBA and FVA results showed no AEF is active in each simulated
condition. However, knocking out mitochondrial complexes would substantially de-
crease the growth rate, take LL state of white light as an example (Table 5.3),
revealing mitochondrial respiration is directly involved in optimizing growth per-
formance in the light. Further analyses showed that the energetic interaction
between plastid and mitochondria proceed by three shuttles that export excess re-
ducing equivalents from the chloroplast to the cytosol, then balance the
ATP/NADPH ratio in the plastid, rather than by the mitochondrial ADP/ATP trans-
locator that exports ATP out of the mitochondria in exchange for ADP.

Modelling the effects of light intensity and quality
91
Table 5.3 Effects of mitochondrial ETC knockouts (KO) on fluxes through the compared reactions (in case of white
at LL state).
ATPase_Mito, mitochondrial ATP synthase, i.e. Complex V; ATPase_Plas, plastidic ATP synthase; symbol “-”
indicates no flux. Predicted fluxes are in µmol/m2/s.
Malate-Oxaloacetate shuttle
The malate-oxaloacetate (Mal-OAA) shuttle is a malate valve, comprised of a mal-
ate/OAA transporter and some isozymes of malate dehydrogenase (MDH). In the
Mal-OAA shuttle, excess plastidic NADPH reduces OAA to malate, which is then
transported to the mitochondria and further used in the mitochondrial electron
transport chains (ETCs). Our model predicted that NADP+-dependent MDH con-
verts OAA to malate in the plastid, whereas an NAD+-MDH operates in the
mitochondria, generating NADH which is directly oxidized via the ETCs (Figure
5.3). This shuttle was found in all studied conditions.
Figure 5.3 Mal-OAA exchange among plastid in all scenarios. OAA, oxaloacetate; MDH, malate dehydrogenase;
Mal, malate; ETC, electron transport chain.
Exchange of carbon compound among plastid
Growth Rate ATPase_Mito ATPase_Plas AEF
Wild type 0.105 1.362 5.305 -
KO Complex I 0.099 1.119 5.305 -
KO Complex III 0.094 0.917 5.305 -
KO Complex IV 0.094 0.917 5.305 -
KO ATP/ADP translocator 0.105 1.362 5.305 -

Chapter 5
92
In addition to the Mal-OAA shuttle, our model simulations showed that, at HL states
of solar and white lights, chloroplasts can also interconnect with other organells by
exchanging carbon compounds (Figure 5.4). During this exchange, the malate-cit-
rate shuttle exports carbon from the peroxisome. The 2-oxoglutarate (2-OG)
produced by cytosolic citrate dehydrogenase serves as a substrate for synthesis of
glutamate in the chloroplast. The FVA results confirmed that this route is always
active in the HL state of solar and white, but is optional for other conditions.
Mitochondrial aldehyde dehydrogenase
In the LL state of yellow light, the model predicted that the aldehyde dehydrogenase
(LADH) involved in the energetic coupling between the plastid and the mitochon-
dria (Figure 5.5). LADH metabolizes acetaldehyde produced from threonine into
acetate. The NADH produced by mitochondrial ALDH goes to the mitochondrial
ETC.
Figure 5.4 Carbon compound exchange among plastid in HL of solar and white. OAA, oxaloacetate; MDH, malate
dehydrogenase; Mal, malate; ETC, electron transport chain; 2-OG, 2-oxoglutarate; Glu, glutamate; Fdred, ferredoxin
reduced; Fdox, ferredoxin oxidized; GOGAT, glutamate synthase.
Figure 5.5 Function of ALDH under LL state of yellow. ETC, electron transport chain; CS, citrate synthase; Ac-
CoA, acetyl CoA; ACET, acetate; ACETALD, acetaldehyde; ALDH, aldehyde dehydrogenase.

Modelling the effects of light intensity and quality
93
5.3.6 Flux-sum differences in cofactors ATP, NADH and NADPH
The flux-sum for a metabolite (see section 5.2.3) can be considered as a proxy for
the metabolic pool size at steady-state (Chung and Lee, 2009). This approach has
been used to elucidate the metabolic state of plant systems (Simons et al., 2014;
Basler et al., 2016). In this chapter, the flux-sum range of compartmentalized spe-
cific cofactors ATP, NADPH and NADPH were computed from the resulting flux
distributions at the optimal solution under different light conditions (Appendix
5.6.5). We observed that the flux-sum of the mitochondrial and peroxisomal
NADPH were observed to be 0 at the optimal solutions, which implies that NADPH
is not consumed nor produced by any of respective reactions in the mitochondria
and peroxisome. For the remainder of selected metabolites, the highest level for the
flux-sum was obtained from HL state of solar and white light, nonetheless, the low-
est was from LL state of yellow light.
The flux-sum levels for the compartmentalized-specific cofactors were sub-
stantially higher in the HL scenarios for each light source. However, for all the
considered light sources, the flux-sum levels of mitochondrial NADH and mito-
chondrial ATP were relatively higher in the LL states compared to those of cells in
HL states, reflecting the contributions of mitochondria to energy balance is bigger
under LL state (Table 5.4).
Table 5.4 The flux-sum ranges of mitochondrial cofactors. lb, lower bound; ub, upper bound.
Light Source Cofactor LL HL
lb ub lb ub
Solar NADH_Mito 2.24 2.25 1.74 1.74
ATP_Mito 5.32 5.32 3.34 3.34
White NADH_Mito 1.68 1.70 1.74 1.74
ATP_Mito 4.09 4.09 3.34 3.34
Blue NADH_Mito 7.05 7.06 6.68 6.71
ATP_Mito 16.44 16.44 15.84 15.84
Green
NADH_Mito 0.48 0.48 0.44 0.44
ATP_Mito 1.15 1.15 1.08 1.08
Yellow NADH_Mito 1.95 1.95 1.92 1.92
ATP_Mito 4.51 4.51 4.46 4.46
Red640 NADH_Mito 1.88 1.88 1.83 1.84
ATP_Mito 4.40 4.40 4.33 4.33
Red660
NADH_Mito 1.81 1.82 1.78 1.79
ATP_Mito 4.30 4.30 4.25 4.25

Chapter 5
94
5.4 Discussion
In this chapter, we aim to in silico study the effects of light intensity and light quality
on the cellular growth and metabolism of tomato leaves. To this end, a light-specific
model for tomato was built by describing the photon-utilising reactions in a wave-
length-specific way. Similarly, the given light sources (in total, seven) were
metabolically represented in a wavelength-specific manner.
5.4.1 Influence of varying light on the cellular growth
The model predicted that the growth rate at HL states for each given light source is
higher than its respective value at LL states (Table 5.2). Irrespective of the changes
in light intensity (LL or HL), the higher growth rate was obtained from solar, white
and blue lights, while the lowest value was found from yellow light. These predic-
tions were supported by previous findings that the growth of tomato plants irradiated
with monochromatic lights, in particular, yellow and green lights, was inhibited as
compared with that of plants grown under full spectrum lights such as white (Wu et
al., 2014; O’Carrigan et al., 2014; Liu et al., 2014). For example, Wu et al. (2014)
found that tomato plants under white light showed higher growth rate compared
with other monochromatic light treatments including blue, green, yellow and red,
whereas, the growth of tomato plants under green and yellow light treatments were
severely inhibited. Liu et al. (2014) reported that tomato plants with yellow light
treatment had lowest fresh weight and dry weight. These effects of monochromatic
lights on tomato plants have also been observed in other plants (Yu and Ong, 2003;
Wang et al., 2009). For instance, the results of Wang et al. (2009) showed that all
cucumber plants grown under monochromatic lights had reduced growth and CO2
assimilation rate as compared with plants grown under white light.
It is notable that the light spectra in many reported experiments, which were
produced either by fluorescents or LEDs, were often inconsistent, thus often leading
to mixed results. For example, the results of Wu et al. (2014) showed that the growth
of tomato plants had no significant differences between white and red lights (with a
maximum intensity at 660 nm, i.e. Red660), although plants treated with white light
had relatively higher growth than those of plants irritated with red light; however,
in the work of Liu et al. (2014), the growth reduction of tomato plants under red
light (with a peak at 640 nm, whereby Red640) was more significant in comparison
with those of white light. Previous evidence has proved that early LEDs were red
with the most efficient emitting at 660 nm, which is close to an absorption peak of
chlorophyll (Sager and McFarlane, 1997). Not unexpectedly, our model predicted

Modelling the effects of light intensity and quality
95
that the cellular growth rate of Red640 differed from that of Red660 (Table 5.2).
Given that the influence of monochromatic lights on photosynthetic capacity was
relatively limited compared with full spectrum light such as solar and white, at-
tempts have been made toward investigating the response of plants to the
combination of different light qualities such as red, blue and green lights. And nu-
merous studies have proven that the combination of red and blue LEDs is an
effective lighting source for several plants (Yorio et al., 2001; Kim et al., 2005; Fan
et al., 2013).
As mentioned earlier, the quantum yield is a measure of light utilization effi-
ciency. A theoretical maximal value of фCO2 is 0.111 for C3 plants, while, the average
actual value was reported to be 0.052 under ambient conditions (Skillman, 2008).
Variation in light environments such as light intensity and light quality is expected
to affect the quantum yield. Unsurprisingly, some computed фCO2 (e.g., of green and
yellow) was lower than the value of 0.052. Our prediction that white light had a
higher quantum yield is in line with other studies (Zhang et al., 1997). Despite solar
and white lights had higher growth rate relative to monochromatic light treatments,
while the latter, e.g., red lights are more efficient for converting electricity to pho-
tosynthetically fixed carbon because the conversion of electrical power to photons
increased with wavelength.
Apart from the growth, it is known that the monochromatic lights had signifi-
cant influences on morphogenesis of plants (Wang et al., 2009; Wu et al., 2014).
However, the structure and physiology of plants are regulated, in part, by light sig-
nals, which is not considered in this present study.
5.4.2 Energy balancing under varying light conditions
Chloroplasts and mitochondria play important roles in meeting the energy demands
and maintaining cellular redox balance (Griffin and Turnbull, 2012). In an illumi-
nated plant cells, metabolic processes occurred in these two organelles are
interdependent but also mutually beneficial. The metabolic interactions between
these two organelles have been reported in several studies (Bailleul et al., 2015;
Cheung et al., 2015; Kim et al., 2016; Levering et al., 2016). Consistent with these
reported findings, our model predictions also support the essential role of mitochon-
drial metabolism in dissipating excess redox equivalents from chloroplast, thus
regulating the ATP/NADPH ratio for sustaining photosynthetic carbon assimilation
(Table 5.3). Additionally, the performed flux-sum analysis of cofactors revealed that
the contribution of mitochondrial respiration is bigger at LL state compared to that
of HL state (Table 5.4).

Chapter 5
96
The possible routes for interaction between chloroplasts and mitochondria have
been proposed (Hoefnagel et al., 1998; Blanco et al., 2014). In this study, the mech-
anisms that are used to balance the ATP/NADPH ratio during the communication
were extensively explored. As reported in the other studies (Bailleul et al., 2015;
Levering et al., 2016), the Mal-OAA shuttle was predicted to be involved in redox
shuttling between the chloroplast, mitochondria, and cytosol, in all the modelled
conditions (Figure 5.3). Nonetheless, the ATP produced by mitochondrial ETC was
not transported back to chloroplast via the plastidic ADP/ATP translocator in our
predicted results (Table 5.3).
In addition to the Mal-OAA shuttle, our model predictions indicated that the
balancing of ATP/NADPH ratio can also be accomplished through the exchange of
carbon compound among the plastid at HL states for solar and white lights (Figure
5.4), and the mitochondrial ALDH at LL state of yellow (Figure 5.5). ALDH was
reported to play a beneficial role when plants suffer abiotic stress, in particular,
drought and flood (Nakazono et al., 2000; Brocker et al., 2013). Generally, lower
light is not a well-studied abiotic stress compared with other stresses such as drought
because its effect is not fatal to plants. ALDH reaction produces NADH during the
conversion of acetaldehyde to acetate. Considering that plants under yellow light
treatment often had lower growth and photosynthetic capacity, it is likely that the
enzyme is active when cells require regeneration of reducing power.
In summary, the discussions above demonstrate that plant cells possess multi-
ple mechanisms to cope with fluctuations in the light environment, implying the
metabolic flexibility of plant cells in response to different growth conditions.
5.4.3 Potential limitations
In constraint-based metabolic models, maintenance energy is divided into two major
components: the growth-associated maintenance (GAM) and non-growth-associ-
ated maintenance (NGAM). It is relatively easy to estimate GAM, but the
experimental determination of NGAM is more difficult (Sweetlove et al., 2013),
thus resulting in a large variation in NGAM within the published plant flux-balance
metabolic models (Table 5.1).
The accuracy of FBA predictions highly depends on the model structure and
constraints, of which NGAM has the strongest effect on model prediction compared
with the remaining constraints (Cheung et al., 2013). NGAM accounts for energetic
cost for biosynthesis-related processes, including metabolite transport, protein and
nucleic acids polymerisation and processing and protein translocation. In many or-
ganisms, a significant amount of cellular ATP is expected to be used to sustain

Modelling the effects of light intensity and quality
97
cellular functions that are not directly associated with biomass synthesis and growth.
Hay and Schwender (2011) reported that NGAM consumes up to about 50% of the
total ATP production. Masakapalli et al. (2010) estimated this fraction to be larger
than 85% for Arabidopsis cell cultures. In a study of tomato fruit, the ATP con-
sumption used for maintenance was reported to be in a range of 22-29%, regardless
of the development stage (Colombié et al., 2015). Given the substantial effect of
NGAM on predicted flux distributions (Feist et al., 2007; Poolman et al., 2009;
Cheung et al., 2013; Kim et al., 2016), it would result in an even larger uncertainty
in model predictions to neglect NGAM as done by many plant metabolic models
(Table 5.1).
In this chapter, ATP maintenance cost, a value of 7.1 mmol g-1 DW h-1 reported
in an Arabidopsis model was exploited (Poolman et al., 2009), and was assumed to
be the same in all the studied conditions because no information is available regard-
ing the ATP maintenance energy for tomato. The proportion of the fixed
maintenance cost accounts for 19-79% of all cellular ATP all the studied conditions.
However, according to the results of Imam et al. (2015), photosynthetic mainte-
nance energy requirements were significantly affected by light intensity. Such an
observation that maintenance cost varies with the environmental conditions is also
reported by Cheung et al. (2013).
In order to investigate how changes in ATP maintenance alter the predicted
flux solutions, as well as flux through PETs and mitochondrial ETCs, the studied
conditions were examined by performing sensitivity analysis of ATP maintenance
implemented as described by Hartman et al. (2014). The model predicted that
changing the ATP maintenance value led to the flux distribution to change. At the
lower ATP maintenance (< 0.60) in LL state of white light, there is no flux through
mitochondrial ETCs, and the fluxes through the mitochondrial ETCs increased with
increasing ATP maintenance (Appendix 5.6.6). Surprisingly, AEFs did not carry
fluxes either at the lower ATP maintenance conditions, implying the energy gener-
ated by LEF in plastid is sufficient for supporting the energy burden. It is worth
noting that only ~1-8% of cellular ATP was used for other purposes than biomass
production under lower ATP maintenance. Obviously, this value is much less that
those reported by other studies (Alonso et al., 2007; Masakapalli et al., 2010; Hay
and Schwender, 2011; Colombié et al., 2015), indicating that the model predictions
obtained from a value of 7.1 mmol g-1 DW h-1 for ATP maintenance are not unreli-
able.
Another limitation of this study is the actual light absorption for metabolic use.
The need to provide an accurate definition of the metabolic light absorption for the
light condition of interest is obvious. However, there is little information on actual

Chapter 5
98
photon absorption flux for metabolic use because such measurements are not prac-
tical. Typically, much of the incident light is reflected or scattered before it is
utilised in photosynthesis, particularly, at high light. In this study, the same upper
limit on wavelength-specific photons were set for all the studied conditions, which
is not realistic actually.
Despite the limitations in this study discussed above, the reconstructed light-
specific model strikingly predicted the different metabolic actives under changing
light conditions using very limited experimental data as constraints. This gives hope
of attaining the goal of addressing both the metabolic response of leaf cells and the
mechanisms regulating ATP/NADPH ratio under various light conditions.
5.5 Conclusions
This work clearly demonstrates the utility of constraint-based modelling to study
the metabolic activities of light-stimulated assimilation in leaf cells and moves our
thinking forward. The present study highlights the importance of mitochondrial res-
piration in optimizing growth in light. In addition, our model predictions suggested
ALDH may represent an important metabolic interaction between plastid and other
intracellular. Nonetheless, it must be stated that the present study should not be con-
sidered the last word in respect of light-driven metabolism investiagtion, but as an
initial step analysing photosynthetic behaviors of plants. Further studies are required
to simulate the effects of different ratios of selected light qualities on the cellular
metabolism. Furthermore, additional information on light quality and phytochemi-
cal production will help us in accurately modelling the effects of light quality on
light-driven metabolism, and also designing the most efficient lightings to promote
plant growth and accumulation of phytochemical concentrations.

Modelling the effects of light intensity and quality
99
5.6 Appendix
Appendix 5.6.1 Model constraints
Table 1: Relative amino-acid composition in phloem sap of tomato leaves. Values obtained from Valle et al. (1998)
are shown as relative molar % of the total amino acids in the phloem, sorted from the most to the less abundant.
Amino-acid molar % of amino-acid in phloem
Glutamine 30.4
Glutamate 15.7
Threonine 8.7
Aspartate 7.6
Phenylalanine 7.2
Serine 5.0
Alanine 4.9
Valine 3.5
GABA[1] 2.9
Lysine 2.8
Leucine 2.6
Isoleucine 2.2
Asparagine 1.9
Glycine 0.9
[1] GABA, γ-aminobutyric acid

Chapter 5
100
Table 2: Constraints for the absorption of light-utilising reactions at specific wavelength (µmol/m2/s).
Wavelength
(nm)
Light-utilising reactions
PSI PSII PCHLDOR DVPCHLDOR
405 3.65408026 3.571196 1.032251 1.032251
415 4.57122079 5.762609 2.709219 2.709219
425 5.09505344 6.411913 3.869828 3.869828
435 6.02854023 7.122096 4.7722 4.7722
445 4.29092208 6.736565 4.290922 4.290922
455 2.91386204 4.463993 2.913862 2.913862
465 2.89691067 4.078462 4.724813 4.724813
475 2.453918 4.200212 2.743555 2.743555
485 2.02729613 3.75381 1.580109 1.580109
495 1.60064973 3.124793 1.105274 1.105274
505 0.94127968 2.029087 0.845721 0.845721
515 0.518035 1.075419 1.274583 1.274583
525 0.38644719 0.689887 1.574335 1.574335
535 0.38589114 0.608729 1.573019 1.573019
545 0.36898065 0.588433 1.743841 1.743841
555 0.41761875 0.547857 2.000655 2.000655
565 0.54817623 0.588433 2.343444 2.343444
575 0.61324236 0.710183 2.255948 2.255948
585 0.71100919 0.852213 2.211398 2.211398
595 0.79242158 0.892797 2.941722 2.941722
605 0.93936621 0.93338 3.671947 3.671947
615 1.0698828 1.13629 4.44521 4.44521
625 1.39654635 1.280821 5.476611 5.476611
635 1.39654635 0.943525 6.852403 6.852403
645 2.00231473 1.623268 8.177219 8.177219
655 3.21445661 1.988503 6.203999 6.203999
665 3.98406376 3.672651 4.136659 4.136659
675 1.64015388 5.072713 2.456764 2.456764
685 0.47608587 3.003051 1.422525 1.422525
695 0.18057753 0.426107 0.947691 0.947691
PSI, photosystem I; PSII, photosystem II; PCHLDOR, chlorophyllide-a:NADP+ oxidoreductase; DVPCHLDOR, divinyl chlorophyllide-a:NADP+ oxi-
doreductase.

Modelling the effects of light intensity and quality
101
Appendix 5.6.2 Schematic representation of photosynthetic machinery
Abbreviations: PSI, photosystem I; PSII, photosystem II; b6f, cytochrome b6f complex; Fd, Ferredoxin; FNR, fer-
redoxin NADP+ reductase; FQR, ferredoxin quinone reductase, NDH, NADPH dehydrogenase; PTOX,
plastoquinol oxidase; Mehler, Mehler’s reaction; PQ, plastoquinone; PC, plastocyanin; Pi, inorganic phosphate. e-
, electrons.
Appendix 5.6.3 Light-specific metabolic model of tomato in ScrumPy and
SBML format. Availabe on the attached files.
Appendix 5.6.4 FBA and FVA results for all the studied conditions. Avail-
abe on the attached files.
Appendix 5.6.5 The calculation of light utilisation efficiency and flux-sum
levels of cofactors. Availabe on the attached files.

Chapter 5
102
Appendix 5.6.6 Responses of mitochondrial ETCs to varying ATP demand
(LL state of white light).

Chapter 6 General discussion

Chapter 6
104
6.1 Summary of contributions
Constraint-based metabolic modelling approach has been proven a powerful tool to
study cellular metabolism at systems-level. With such motivation, this thesis has
initiated a systems modelling approach to understand the metabolic behavior of
plant cells under various growth conditions. The following sections presents the
main contributions of this thesis work.
The examination of how the modelling parameters commonly used in flux-bal-
anced analysis influence the flux distributions in plant metabolic networks (Chapter
2), highlights the significance of model structure when studying the plant metabolic
behavior using flux balance analysis (FBA).
The constructed metabolic model of tomato, iHY3410 (Chapter 3), to our
knowledge, is the first genome-scale metabolic model for simulating tomato leaf
metabolism. The model is capable of successfully describing the metabolic activities
of well-known biochemical pathways for leaf cells under heterotrophic and photo-
trophic conditions.
The application of iHY3410 to investigate the metabolic characteristics under
drought stressed conditions (Chapter 4), presents a starting point for studying the
functional consequences of abiotic stresses. The model predictions that the meta-
bolic flux through the mevalonate (MVA) pathway under drought conditions
significantly differed from that under normal conditions, gave hints to possible
adaptive metabolic responses to drought stresses.
Finally, in Chapter 5, the extension of iHY3410 to a light-specific model allows
us to explore the metabolic changes of tomato leaves in response to changing light
intensity and quality. The comprehensive analyses indicate mitochondrial respira-
tion plays an important role in regulating the balance between ATP and NADPH in
plastid, thus enabling optimal growth performance in varying light conditions. The
interaction between the plastid and other organells is achieved by metabolite shuttles
that differ with the light condition.
6.2 Limitations of this study
Essentially, all models are wrong because they are simplified representations of re-
ality containing limitations and assumptions (Sterman, 2002). Unexceptionally,
constrained-based modelling approach, the central framework of this thesis work,
also has limitations, in particular, when applying it to study phototrophic organisms,

General discussion
105
whose metabolism typically exhibits a diurnal, rather than time-invariant behavior
(Orth et al., 2010; Sweetlove and Ratcliffe, 2011; Ip et al., 2014; Rügen et al., 2015).
Yet, a few attempts have been made to describe temporal variations in phototrophic
metabolism work (Muthuraj et al., 2013; Cheung et al., 2014; Rügen et al., 2015).
In this section, some of the limitations of this thesis work that have not been dis-
cussed earlier are highlighted.
The accurate predictions of flux distributions by FBA highly depends on the
model structure and constraints, amongst which maintenance costs that are not re-
lated to growth is an important parameter. The maintenance costs not only include
the ATP demand but also the reductant expenditure. Including both the ATP and
NADPH maintenance costs has been proved to be important for generating accurate
flux predictions (Cheung et al., 2013). However, this thesis primarily consider the
maintenance costs in terms of ATP consumption, neglecting the NADPH consump-
tion. Moreover, as the values are not known for tomato, the ATP maintenance cost
was set to be the same as that of Arabidopsis in the thesis, irrespective of the study-
ing conditions (see Chapter 5, section 5.4.3).
Additionally, this thesis does not account for secondary metabolites in the bio-
mass constraints. In Chapter 4, our model predicted that isopentenyl pyrophosphate
(IPP), the precursor for the biosynthesis of isoprenoids, is predominantly synthe-
sized via the 2C-methyl-D-erythritol-4-phosphate (MEP) pathway and the
mevalonate (MVA) pathway under the normal and drought stressed conditions, re-
spectively. Isoprenoids, also called terpenoids, are one of the most diverse groups
of secondary metabolites, and have multiple functions, such as carotenoid biosyn-
thesis, and protection from abiotic stresses (Heldt and Heldt, 2005). Although
possible explanations of our predictions are given, it is still unclear why the MVA
pathway predominates over the MEP pathway for the IPP biosynthesis under
drought conditions. Incorporating additional information of secondary metabolism
into the model constraints could greatly improve the accuracy of the model predic-
tions.
Lastly, numerous evidences suggested that light quality alters the accumulation
of flavonoids which are important secondary metabolites and important determi-
nants of fruit quality (Fu et al., 2016; Miao et al., 2016). Further curating the MEP
and MVA pathways in the metabolic model, and incorporating condition-specific
data will provide more insights into metabolic pathways influenced by light quality.
However, despite these limitations discussed above, this study provides a plat-
form for investigating metabolic activities under various growth conditions.

Chapter 6
106
6.3 Future perspective
Computational modelling is an iterative process with the aim of further improving
the model for better reflecting the biological phenomena in nature. Consequently,
in the future, it would be very interesting to experimentally test the hypotheses gen-
erated in this thesis, in particular, the results presented in Chapter 4. In addition to
experimental validations, the tasks that would be interesting and worthwhile pursu-
ing are as follows:
Improving gene-protein-reaction associations
Advances in high-throughput technologies have led to the generation of massive
amounts of omics data that must be interpreted in a biological meaningful way. With
the aid of metabolic models, the gene-protein-reactions (GPR) associations provide
the means to integrate and contextualize omics data such as proteomic and tran-
scriptomic data. In a recent study of rice, omics data integration and modelling was
used to explore the light-specific transcriptional signatures of cellular metabolism
(Lakshmanan et al., 2015). Transcriptomic and proteomic data has also been inte-
grated to a maize leaf genome-scale model as constraints for predicting metabolic
fluxes under different nitrogen conditions (Simons et al., 2014). In the last few
years, several computational methods have been developed to integrate omics data
into metabolic models to produce improved predictions of flux distribution (Kim
and Lun, 2014; Machado and Herrgård, 2014; Saha et al., 2014). These methods
depend extensively on the accuracy with which genes have been mapped to the bi-
ochemical reactions in the metabolic networks.
The determination of the GPR associated with each metabolic reaction is typi-
cally conducted by a laborious and time-consuming literature research. In the
presented tomato model, the GPR associations are included by listing gene(s) and
enzyme(s) involved in a specific reaction, but not refined with reliable evidence for
gen-reaction associations. In the future, it is necessary to improve GPR associations
in a new model for utilizing available tomato omics profiles to either produce new
tissue-specific models or constrain the behaviors of individual reaction in a meta-
bolic network.
Developing a fruit-specific model for tomato

General discussion
107
In the present work, the main focus was to study how the metabolic activity of leaf
cells varies in response to different growth condtions. Given that tomato is the most
studied model system of fleshy fruit ripening, and it contains several classes of an-
tioxidants such as carotenoids and phenolic compounds, it would be highly
interesting to model the metabolic behaviour of tomato fruit in future studies. To do
so, the approach proposed in other studies can be utilized to develop a fruit-specific
model (Grafahrend-Belau et al., 2009; Jerby et al., 2010; Mintz-Oron et al., 2012;
Seaver et al., 2015). Moreover, a stoichiometric model at medium-scale has been
published for tomato fruit (Colombié et al., 2015), which provides a reference to
build a new fruit-specific model at a large/genome-scale.
Multi-tissue modelling at whole-plant level
Another extension of the current work is to develop multi-tissue models at whole-
plant level. In planta, most of its metabolic functions depend on interactions be-
tween different tissues and organs, for instance, source-sink interactions, in which
the balance between source and sink is important for plant growth and yield (Osorio
et al., 2014; Li et al., 2015). Therefore, a whole-plant level understanding of plant
metabolism is required. In this regard, efforts toward modelling whole plant metab-
olism have already been made in barley (Grafahrend-Belau et al., 2013) and
Arabidopsis (de Oliveira Dal’Molin et al., 2015), respectively (see a review paper
by Martins Conde et al. (2016)). Basically, the two presented whole-plant metabolic
models are developed by integrating multiple tissue-specific models, such as leaf
model and stem model. A whole-plant model framework for tomato can also be
developed by implementing such an approach. In this multi-tissue context, it will be
interesting to explore resource allocation (e.g., carbon) in leaf (source) and fruit
(sink) in response to different light conditions.
Modelling plant-pathogen metabolic interactions
Constraint-based metabolic modelling has also opened new horizons in studying
metabolic interactions between species, including microbe-microbe and host-mi-
crobe interactions. Yet, there exist a few of examples in the literature (Jain and
Srivastava, 2009; Raghunathan et al., 2009; Heinken et al., 2013; Greenblum et al.,
2013; Manor et al., 2014). For example, Stolyar et al. (2007) examined the
syntrophic interactions between Desulfovibrio vulgaris and Methanococcus
maripaludis by using constraint-based modelling. In the study of Heinken et al.

Chapter 6
108
(2013), the metabolic interactions between a gut microbe Bacteroides thetaiotaomi-
cron and a mouse host was investigated using the constraint-based modelling
framework. Taken together, all these studies allow us to systematically investigate
complex metabolic interactions between species.
In addition to abiotic stresses such as drought and high light, the plant growth,
its health and crop yield can also be severely affected by biotic stresses. Among
these pathogens, root-knot nematodes (RKNs; Meloidogyne spp.) are major agricul-
tural pests in tomato. It was reported that more than 27% yield losses in tomato is
caused by root-knot nematodes (Kaur et al., 2011). Therefore, unraveling the plant-
pathogen metabolic interactions is a promising aspect to understand the pathogenic
effect of pathogens on host metabolic capacity and crop improvement. Following
the approaches proposed in previous studies (Heinken et al., 2013; Jamshidi and
Raghunathan, 2015), the metabolic interactions between tomato and RKNs can also
be modelled. For this purpose, efforts should be made towards: (1) constructing a
genome-scale metabolic model (GSM) for RKNs based on its annotated genome
(Abad et al., 2008); (2) integrating the two GSMs of PKNs and tomato with the
addition of a joint external compartment allowing metabolite exchanges; (3) per-
forming FBA simulations by employing appropriate objective functions with the
imposed constraints.

109
References
Abad, P., Gouzy, J., Aury, J.-M., et al. (2008) Genome sequence of the metazoan
plant-parasitic nematode Meloidogyne incognita. Nat. Biotechnol., 26,
909–915.
Affek, H.P. and Yakir, D. (2002) Protection by isoprene against singlet oxygen in
leaves. Plant Physiol., 129, 269–277.
Allen, J. (2002) Photosynthesis of ATP-electrons, proton pumps, rotors, and poise.
Cell, 110, 273–276.
Allen, J.F. (2003) Cyclic, pseudocyclic and noncyclic photophosphorylation: new
links in the chain. Trends Plant Sci., 8, 15–19.
Alonso, A.P., Goffman, F.D., Ohlrogge, J.B. and Shachar-Hill, Y. (2007) Carbon
conversion efficiency and central metabolic fluxes in developing sunflower
(Helianthus annuus L.) embryos. Plant J., 52, 296–308.
Antongiovanni, M. and Sargentini, C. (1991).Variability in chemical composition
of straws. Opt. Méditerranéen. Série-Sémin. 16, 49–53.
Antoniewicz, M.R. (2015) Methods and advances in metabolic flux analysis: a
mini-review. J. Ind. Microbiol. Biotechnol., 42, 317–325.
Araújo, W.L., Nunes-Nesi, A., Osorio, S., et al. (2011) Antisense inhibition of the
iron-sulphur subunit of succinate dehydrogenase enhances photosynthesis
and growth in tomato via an organic acid-mediated effect on stomatal aper-
ture. Plant Cell, 23, 600–627.
Araújo, W.L., Nunes-Nesi, A., Nikoloski, Z., Sweetlove, L.J. and Fernie, A.R. (2012a) Metabolic control and regulation of the tricarboxylic acid cycle in
photosynthetic and heterotrophic plant tissues. Plant Cell Environ., 35, 1–
21.
Araújo, W.L., Tohge, T., Osorio, S., et al. (2012b) Antisense inhibition of the 2-
oxoglutarate dehydrogenase complex in tomato demonstrates its im-
portance for plant respiration and during leaf senescence and fruit
maturation. Plant Cell, 24, 2328–2351.

References
110
Arnold, A. and Nikoloski, Z. (2014) Bottom-up metabolic reconstruction of Ara-
bidopsis and its application to determining the metabolic costs of enzyme
production. Plant Physiol., 165, 1380–1391.
Arnold, A., Sajitz-Hermstein, M. and Nikoloski, Z. (2015) Effects of varying ni-
trogen sources on amino acid synthesis costs in Arabidopsis thaliana under
different light and carbon-source conditions. PLoS One, 10, e0116536.
Atanasov, A.G., Waltenberger, B., Pferschy-Wenzig, E.-M., et al. (2015) Dis-
covery and resupply of pharmacologically active plant-derived natural
products: A review. Biotechnol. Adv., 33, 1582–1614.
Back, K., He, S., Kim, K.U. and Shin, D.H. (1998) Cloning and bacterial expres-
sion of sesquiterpene cyclase, a key branch point enzyme for the synthesis
of sesquiterpenoid phytoalexin capsidiol in UV-challenged leaves of Cap-
sicum annuum. Plant Cell Physiol., 39, 899–904.
Baghalian, K., Hajirezaei, M.-R. and Schreiber, F. (2014) Plant metabolic mod-
eling: achieving new insight into metabolism and metabolic engineering.
Plant Cell, 26, 3847–3866.
Bailleul, B., Berne, N., Murik, O., et al. (2015) Energetic coupling between plas-
tids and mitochondria drives CO2 assimilation in diatoms. Nature, 524,
366–369.
Basler, G., Küken, A., Fernie, A.R. and Nikoloski, Z. (2016) Photorespiratory
bypasses lead to increased growth in Arabidopsis thaliana: are predictions
consistent with experimental evidence? Synth. Biol., 31.
Bassel, G.W., Gaudinier, A., Brady, S.M., Hennig, L., Rhee, S.Y. and De Smet,
I. (2012) Systems analysis of plant functional, transcriptional, physical in-
teraction, and metabolic networks. Plant Cell, 24, 3859–3875.
Bauwe, H., Hagemann, M., Kern, R. and Timm, S. (2012) Photorespiration has
a dual origin and manifold links to central metabolism. Curr. Opin. Plant
Biol., 15, 269–275.
Becker, S.A., Feist, A.M., Mo, M.L., Hannum, G., Palsson, B.Ø. and Herrgard,
M.J. (2007) Quantitative prediction of cellular metabolism with constraint-
based models: the COBRA Toolbox. Nat. Protoc., 2, 727–738.
Blanco, N.E., Guinea-Díaz, M., Whelan, J. and Strand, Å. (2014) Interaction
between plastid and mitochondrial retrograde signalling pathways during
changes to plastid redox status. Philos. Trans. R. Soc. B., 369, 20130231.

References
111
Bonarius, H.P.J., Schmid, G. and Tramper, J. (1997) Flux analysis of underde-
termined metabolic networks: the quest for the miss in constraints. Trends
Biotechnol., 15, 308–314.
Bonnett, G.D. and Incoll, L.D. (1993a) Effects on the stem of winter barley of
manipulating the source and sink during grain-filling I. Changes in accu-
mulation and loss of mass from internodes.. J. Exp. Bot., 44, 75–82.
Bonnett, G.D. and Incoll, L.D. (1993b) Effects on the stem of winter barley of
manipulating the source and sink during grain-filling II. Changes in the
composition of water-souble carbohydrate of internodes. J. Exp. Bot., 44,
83–91.
Bordbar, A., Monk, J.M., King, Z.A. and Palsson, B.O. (2014) Constraint-based
models predict metabolic and associated cellular functions. Genetics, 15,
107–120.
Boyer, J.S. (1982) Plant productivity and environment. Science, 218, 443–448.
Bray, E.A. (1988) Drought- and ABA-induced changes in polypeptide and mRNA
accumulation in tomato leaves. Plant Physiol., 88, 1210–1214.
Brazaitytè, A., Duchovskis, P., Urbonavičiūtė, A., et al. (2009) The effects of
light-emitting diodes lighting on cucumber transplants and after effect on
yield. Zemdirbyste-Agriculture, 96,102–118.
Brocker, C., Vasiliou, M., Carpenter, S., et al. (2013) Aldehyde dehydrogenase
(ALDH) superfamily in plants: gene nomenclature and comparative ge-
nomics. Planta, 237, 189–210.
Bunik, V.I. and Fernie, A.R. (2009) Metabolic control exerted by the 2-oxoglu-
tarate dehydrogenase reaction: a cross-kingdom comparison of the
crossroad between energy production and nitrogen assimilation. Biochem.
J., 422, 405–421.
Carrari, F., Nunes-Nesi, A., Gibon, Y., Lytovchenko, A., Loureiro, M.E. and
Fernie, A.R. (2003) Reduced expression of aconitase results in an enhanced
rate of photosynthesis and marked shifts in carbon partitioning in illumi-
nated leaves of wild species tomato. Plant Physiol., 133, 1322–1335.
Caspi, R., Foerster, H., Fulcher, C.A., et al. (2008) The MetaCyc Database of
metabolic pathways and enzymes and the BioCyc collection of Path-
way/Genome Databases. Nucleic Acids Res., 36, D623–D631.

References
112
Chang, R.L., Ghamsari, L., Manichaikul, A., et al. (2011) Metabolic network
reconstruction of Chlamydomonas offers insight into light-driven algal me-
tabolism. Mol. Syst. Biol., 7, 518.
Chaves, M.M., Flexas, J. and Pinheiro, C. (2009) Photosynthesis under drought
and salt stress: regulation mechanisms from whole plant to cell. Ann. Bot.,
103, 551–560.
Cheung, C.Y.M., Poolman, M.G., Fell, D.A., Ratcliffe, R.G. and Sweetlove, L.J. (2014) A diel flux balance model captures interactions between light and
dark metabolism during day-night cycles in C3 and Crassulacean acid me-
tabolism leaves. Plant Physiol., 165, 917–929.
Cheung, C.Y.M., Ratcliffe, R.G. and Sweetlove, L.J. (2015) A method of ac-
counting for enzyme costs in flux balance analysis reveals alternative
pathways and metabolite stores in an illuminated Arabidopsis leaf. Plant
Physiol., 169, 1671–1682.
Cheung, C.Y.M., Williams, T.C.R., Poolman, M.G., Fell, D.A., Ratcliffe, R.G.
and Sweetlove, L.J. (2013) A method for accounting for maintenance costs
in flux balance analysis improves the prediction of plant cell metabolic phe-
notypes under stress conditions. Plant J., 75, 1050–1061.
Chung, B.K.-S., Lakshmanan, M., Klement, M., Mohanty, B. and Lee, D.-Y. (2013) Genome-scale in silico modeling and analysis for designing syn-
thetic terpenoid-producing microbial cell factories. Chem. Eng. Sci., 103,
100–108.
Chung, B.K.S. and Lee, D.-Y. (2009) Flux-sum analysis: a metabolite-centric ap-
proach for understanding the metabolic network. BMC Syst. Biol., 3, 117.
Collakova, E., Yen, J.Y. and Senger, R.S. (2012) Are we ready for genome-scale
modeling in plants? Plant Sci., 191–192, 53–70.
Colombié, S., Nazaret, C., Bénard, C., et al. (2015) Modelling central metabolic
fluxes by constraint-based optimization reveals metabolic reprogramming
of developing Solanum lycopersicum (tomato) fruit. Plant J., 81, 24–39.
Considine, M.J., Holtzapffel, R.C., Day, D.A., Whelan, J. and Millar, A.H. (2002) Molecular distinction between alternative oxidase from monocots
and dicots. Plant Physiol., 129, 949–953.
Cornic, G. (2000) Drought stress inhibits photosynthesis by decreasing stomatal
aperture – not by affecting ATP synthesis. Trends Plant Sci., 5, 187–188.

References
113
Cornish, K. and Zeevaart, J.A. (1985) Abscisic acid accumulation by roots of
Xanthium strumarium L. and Lycopersicon esculentum Mill. in relation to
water stress. Plant Physiol., 79, 653–658.
Coschigano, K.T., Melo-Oliveira, R., Lim, J. and Coruzzi, G.M. (1998) Ara-
bidopsis gls mutants and distinct Fd-GOGAT genes. Implications for
photorespiration and primary nitrogen assimilation. Plant Cell, 10, 741–
752.
Dani, K.G.S., Jamie, I.M., Prentice, I.C. and Atwell, B.J. (2014) Increased ratio
of electron transport to net assimilation rate supports elevated isoprenoid
emission rate in eucalypts under drought. Plant Physiol., 166, 1059–1072.
DeBolt, S., Scheible, W.-R., Schrick, K., et al. (2009) Mutations in UDP-
Glucose:sterol glucosyltransferase in Arabidopsis cause transparent testa
phenotype and suberization defect in seeds. Plant Physiol., 151, 78–87.
de Oliveira Dal’Molin, C.G., Quek, L.-E., Palfreyman, R.W., Brumbley, S.M.
and Nielsen, L.K. (2010a) AraGEM, a genome-scale reconstruction of the
primary metabolic network in Arabidopsis. Plant Physiol., 152, 579–589.
de Oliveira Dal’Molin, C.G., Quek, L.-E., Palfreyman, R.W., Brumbley, S.M.
and Nielsen, L.K. (2010b) C4GEM, a genome-scale metabolic model to
study C4 plant metabolism. Plant Physiol., 154, 1871–1885.
de Oliveira Dal’Molin, C.G. and Nielsen, L.K. (2013) Plant genome-scale meta-
bolic reconstruction and modelling. Curr. Opin. Biotechnol., 24, 271–277.
de Oliveira Dal’Molin, C.G, Quek, L.-E., Saa, P.A. and Nielsen, L.K. (2015) A
multi-tissue genome-scale metabolic modeling framework for the analysis
of whole plant systems. Front. Plant Sci., 6, 4.
Dharmawardhana, P., Ren, L., Amarasinghe, V., Monaco, M., Thomason, J.,
Ravenscroft, D., McCouch, S., Ware, D. and Jaiswal, P. (2013) A ge-
nome scale metabolic network for rice and accompanying analysis of
tryptophan, auxin and serotonin biosynthesis regulation under biotic stress.
Rice, 6, 15.
Dikicioglu, D., Kırdar, B. and Oliver, S.G. (2015) Biomass composition: the “el-
ephant in the room” of metabolic modelling. Metabolomics, 11, 1690–1701.
Döermann, P., Hoffmann-Benning, S., Balbo, I. and Be ning, C. (1995) Isolation
and characterization of an Arabidopsis mutant deficient in the thylakoid li-
pid digalactosyl diacylglycerol. Plant Cell, 7, 1801–1810.

References
114
Douce, R. and Neuburger, M. (1999) Biochemical dissection of photorespiration.
Curr. Opin. Plant Biol., 2, 214–222.
Dixon, R.A. (2005) A two-for-one in tomato nutritional enhancement. Nat. Biotech-
nol., 23, 825–826.
Durot, M., Bourguignon, P.-Y. and Schachter, V. (2009) Genome-scale models
of bacterial metabolism: reconstruction and applications. FEMS Microbiol.
Rev., 33, 164–190.
Eaton-Rye, J.J., Tripathy, B.C. and Sharkey, T.D. (2011) Photosynthesis: plas-
tid biology, energy conversion and carbon assimilation, Springer Science
& Business Media.
Ebrahim, A., Lerman, J.A., Palsson, B.O. and Hyduke, D.R. (2013) COBRApy:
COnstraints-based reconstruction and analysis for Python. BMC Syst. Biol.,
7, 74.
Edwards, J.M., Roberts, T.H. and Atwell, B.J. (2012) Quantifying ATP turnover
in anoxic coleoptiles of rice (Oryza sativa) demonstrates preferential allo-
cation of energy to protein synthesis. J. Exp. Bot., ers114.
El-Sayed, H.E.A. (2013) Exogenous application of ascorbic acid for improve ger-
mination, growth, water relations, organic and inorganic components in
tomato (Lycopersicon esculentum Mill.) plant under salt-stress. NY Sci. J.,
6, 123–139.
Engel, N., Daele, K. van den, Kolukisaoglu, Ü., Morgenthal, K., Weckwerth,
W., Pärnik, T., Keerberg, O. and Bauwe, H. (2007) Deletion of glycine
decarboxylase in Arabidopsis is lethal under nonphotorespiratory condi-
tions. Plant Physiol., 144, 1328–1335.
Fan, X.-X., Xu, Z.-G., Liu, X.-Y., Tang, C.-M., Wang, L.-W. and Han, X. (2013)
Effects of light intensity on the growth and leaf development of young to-
mato plants grown under a combination of red and blue light. Sci. Hortic.,
153, 50–55.
Feist, A.M., Henry, C.S., Reed, J.L., Krummenacker, M., Joyce, A.R., Karp,
P.D., Broadbelt, L.J., Hatzimanikatis, V. and Palsson, B.Ø. (2007) A
genome-scale metabolic reconstruction for Escherichia coli K-12 MG1655
that accounts for 1260 ORFs and thermodynamic information. Mol. Syst.
Biol., 3, 121.

References
115
Feist, A.M., Herrgård, M.J., Thiele, I., Reed, J.L. and Palsson, B.Ø. (2009) Re-
construction of biochemical networks in microorganisms. Nat. Rev.
Microbiol., 7, 129–143.
Feist, A.M. and Palsson, B.O. (2010) The biomass objective function. Curr. Opin.
Microbiol., 13, 344–349.
Field, K.J. and Lake, J.A. (2011) Environmental metabolomics links genotype to
phenotype and predicts genotype abundance in wild plant populations.
Physiol. Plant., 142, 352–360.
Flexas, J., Diaz-Espejo, A., Galmés, J., Kaldenhoff, R., Medrano, H. and Ribas-
Carbo, M. (2007) Rapid variations of mesophyll conductance in response
to changes in CO2 concentration around leaves. Plant Cell Environ., 30,
1284–1298.
Food and Agriculture Organization of the United Nations (FAO) (2014) Avail-
able online: http://faostat3.fao.org/home/E.
Flügge, U.-I. and Gao, W. (2005) Transport of isoprenoid intermediates across
chloroplast envelope membranes. Plant Biol. (Stuttgart), 7, 91–97.
Fortunati, A., Barta, C., Brilli, F., Centritto, M., Zimmer, I., Schnitzler, J.-P.
and Loreto, F. (2008) Isoprene emission is not temperature-dependent dur-
ing and after severe drought-stress: a physiological and biochemical
analysis. Plant J., 55, 687–697.
Foyer, C.H., Bloom, A.J., Queval, G. and Noctor, G. (2009) Photorespiratory
metabolism: genes, mutants, energetics, and redox signaling. Annu. Rev.
Plant Biol., 60, 455–484.
Fu, B., Ji, X., Zhao, M., He, F., Wang, X., Wang, Y., Liu, P. and Niu, L. (2016)
The influence of light quality on the accumulation of flavonoids in tobacco
(Nicotiana tabacum L.) leaves. J. Photochem. Photobiol. B, 162, 544–549.
Gevorgyan, A., Poolman, M.G. and Fell, D.A. (2008) Detection of stoichiometric
inconsistencies in biomolecular models. Bioinformatics, 24, 2245–2251.
Grafahrend-Belau, E., Junker, A., Eschenröder, A., Müller, J., Schreiber, F.
and Junker, B.H. (2013) Multiscale metabolic modeling: dynamic flux
balance analysis on a whole-plant scale. Plant Physiol., 163, 637–647.

References
116
Grafahrend-Belau, E., Schreiber, F., Koschützki, D. and Junker, B.H. (2009)
Flux balance analysis of barley seeds: a computational approach to study
systemic properties of central metabolism. Plant Physiol., 149, 585–598.
Greenblum, S., Chiu, H.-C., Levy, R., Carr, R. and Borenstein, E. (2013) To-
wards a predictive systems-level model of the human microbiome:
progress, challenges, and opportunities. Curr. Opin. Biotechnol., 24, 810–
820.
Griffin, K.L. and Turnbull, M.H. (2012) Out of the light and into the dark: post-
illumination respiratory metabolism. New Phytol., 195, 4–7.
Guinn, G. (1966) Extraction of nucleic acids from lyophilized plant material. Plant
Physiol., 41, 689–695.
Hamilton, J.J. and Reed, J.L. (2014) Software platforms to facilitate reconstruct-
ing genome-scale metabolic networks. Environ. Microbiol., 16, 49–59.
Hanson, A.D. and Roje, S. (2001) One-carbon metabolism in higher plants. Annu.
Rev. Plant Biol., 52, 119–137.
Harris, M.J. and Outlaw, W.H. (1991) Rapid adjustment of guard-cell abscisic
acid levels to current leaf-water status 1. Plant Physiol., 95, 171–173.
Hartman, H.B., Fell, D.A., Rossell, S., et al. (2014a) Identification of potential
drug targets in Salmonella enterica sv. Typhimurium using metabolic mod-
elling and experimental validation. Microbiology, 160, 1252–1266.
Haupt-Herting, S., Klug, K. and Fock, H.P. (2001) A new approach to measure
gross CO2 fluxes in leaves. Gross CO2 assimilation, photorespiration, and
mitochondrial respiration in the light in tomato under drought stress. Plant
Physiol., 126, 388–396.
Hay, J. and Schwender, J. (2011) Metabolic network reconstruction and flux var-
iability analysis of storage synthesis in developing oilseed rape (Brassica
napus L.) embryos. Plant J., 67, 526–541.
Heinken, A., Sahoo, S., Fleming, R.M.T. and Thiele, I. (2013) Systems-level
characterization of a host-microbe metabolic symbiosis in the mammalian
gut. Gut Microbes, 4, 28–40.
Heldt, H.-W. and Heldt, F. (2005) Plant Biochemistry, Academic Press.

References
117
Hernández, J.M.G.M., Castignolles, P., Gidley, M.J., Myers, A.M. and Gilbert,
R.G. (2008) Mechanistic investigation of a starch-branc hing enzyme using
hydrodynamic volume SEC analysis. Biomacromolecules, 9, 954–965.
Hoefnagel, M.H.N., Atkin, O.K. and Wiskich, J.T. (1998) Interdependence be-
tween chloroplasts and mitochondria in the light and the dark. Biochim.
Biophys. Acta, Bioenerg., 1366, 235–255.
Holzhütter, H.-G. (2004) The principle of flux minimization and its application to
estimate stationary fluxes in metabolic networks: flux minimization. Eur. J.
Biochem., 271, 2905–2922.
Hounsome, N., Hounsome, B., Tomos, D. and Edwards-Jones, G. (2008) Plant
metabolites and nutritional quality of vegetables. J. Food Sci., 73, R48-65.
Hucka, M., Finney, A., Sauro, H.M., et al. (2003) The systems biology markup
language (SBML): a medium for representation and exchange of biochem-
ical network models. Bioinformatics, 19, 524–531.
Imam, S., Fitzgerald, C.M., Cook, E.M., Donohue, T.J. and Noguera, D.R. (2015) Quantifying the effects of light intensity on bioproduction and
maintenance energy during photosynthetic growth of Rhodobacter
sphaeroides. Photosynth. Res., 123, 167–182.
Ip, K., Donoghue, N., Kim, M.K. and Lun, D.S. (2014) Constraint-based model-
ing of heterologous pathways: application and experimental demonstration
for overproduction of fatty acids in Escherichia coli. Biotechnol. Bioeng.,
111, 2056–2066.
Jamshidi, N. and Raghunathan, A. (2015) Cell scale host-pathogen modeling: an-
other branch in the evolution of constraint-based methods. Infect. Dis.,
1032.
Jardine, K., Chambers, J., Alves, E.G., et al. (2014) Dynamic balancing of iso-
prene carbon sources reflects photosynthetic and photorespiratory
responses to temperature stress. Plant Physiol., 166, 2051–2064.
Jerby, L., Shlomi, T. and Ruppin, E. (2010) Computational reconstruction of tis-
sue-specific metabolic models: application to human liver metabolism. Mol.
Syst. Biol., 6, 401.
Jordan, D.B. and Ogren, W.L. (1984) The CO2/O2 specificity of ribulose 1,5-
bisphosphate carboxylase/oxygenase. Planta, 161, 308–313.
References
118
Josse, E.-M., Simkin, A.J., Gaffé, J., Labouré, A.-M., Kuntz, M. and Carol, P. (2000) A plastid terminal oxidase associated with carotenoid desaturation
during chromoplast differentiation. Plant Physiol., 123, 1427–1436.
Juliano, B.O. (1985) “Rice hull and rice straw,” in Rice: Chemistry and Technol-
ogy, ed B. O. Julano (St. Paul, MN: The American Asso ciation of Cereal
Chemists Incorporated), 699.
Junker, B.H., Lonien, J., Heady, L.E., Rogers, A. and Schwender, J. (2007) Par-
allel determination of enzyme activities and in vivo fluxes in Brassica napus
embryos grown on organic or inorganic nitrogen source. Phytochemistry,
68, 2232–2242.
Kahlau, S. and Bock, R. (2008) Plastid transcriptomics and translatomics of tomato
fruit development and chloroplast-to-chromoplast differentiation: chromo-
plast gene expression largely serves the production of a single protein. Plant
Cell, 20, 856–874.
Kanehisa, M. and Goto, S. (2000) KEGG: Kyoto Encyclopedia of Genes and Ge-
nomes. Nucleic Acids Res., 28, 27–30.
Kargul, J., Nield, J. and Barber, J. (2003) Three-dimensional reconstruction of a
light-harvesting complex I-photosystem I (LHCI-PSI) supercomplex from
the green alga Chlamydomonas reinhardtii. Insights into light harvesting for
PSI. J. Biol. Chem., 278, 16135–16141.
Karp, P.D., Ouzounis, C.A., Moore-Kochlacs, C., et al. (2005) Expansion of the
BioCyc collection of pathway/genome databases to 160 genomes. Nucleic
Acids Res., 33, 6083–6089.
Katterman, F.R. and Ergle, D.R. (1966) RNA composition in cotton. Plant Phys-
iol., 41, 553–556.
Kauffman, K.J., Prakash, P. and Edwards, J.S. (2003) Advances in flux balance
analysis. Curr. Opin. Biotechnol., 14, 491–496.
Kaur, D.N., Sharma, S.K. and Sultan, M.S. (2011) Effect of different chemicals
on root knot nematode in seed beds of tomato. Plant Dis. Res., 26, 170-170.
Kim, H.-H., Wheeler, R.M., Sager, J.C., Yorio, N.C. and Goins, G.D. (2005)
Light-emitting diodes as an illumination source for plants: a review of re-
search at Kennedy Space Center. Habitation (Elmsford, NY, U. S.), 10, 71–
78.

References
119
Kim, J., Fabris, M., Baart, G., Kim, M.K., Goossens, A., Vyverman, W.,
Falkowski, P.G. and Lun, D.S. (2016) Flux balance analysis of primary
metabolism in the diatom Phaeodactylum tricornutum. Plant J., 85, 161–
176.
Kim, M.K. and Lun, D.S. (2014) Methods for integration of transcriptomic data in
genome-scale metabolic models. Comput. Struct. Biotechnol. J., 11, 59–65.
Kim, T., Dreher, K., Nilo-Poyanco, R., et al. (2015) Patterns of metabolite
changes identified from large-scale gene perturbations in Arabidopsis using
a genome-scale metabolic network. Plant Physiol., 167, 1685–1698.
Kim, T.Y., Sohn, S.B., Kim, Y.B., Kim, W.J. and Lee, S.Y. (2012) Recent ad-
vances in reconstruction and applications of genome-scale metabolic
models. Curr. Opin. Biotechnol., 23, 617–623.
Klamt, S., Schuster, S. and Gilles, E.D. (2002) Calculability analysis in underde-
termined metabolic networks illustrated by a model of the central
metabolism in purple nonsulfur bacteria. Biotechnol. Bioeng., 77, 734–751.
Klee, H.J. and Giovannoni, J.J. (2011) Genetics and control of tomato fruit ripen-
ing and quality attributes. Annu. Rev. Genet., 45, 41–59.
Koussa, J., Chaiboonchoe, A. and Salehi-Ashtiani, K. (2014) Computational ap-
proaches for microalgal biofuel optimization: a review. BioMed Res. Int.,
2014, 649453.
Kramer, D.M. and Evans, J.R. (2011) The importance of energy balance in im-
proving photosynthetic productivity. Plant Physiol., 155, 70–78.
Kruger, N.J. and Ratcliffe, R.G. (2009) Insights into plant metabolic networks
from steady-state metabolic flux analysis. Biochimie, 91, 697–702.
Kuc, J. (1995) Phytoalexins, stress metabolism, and disease resistance in plants.
Annu. Rev. Phytopathol., 33, 275–297.
Kwon, Y.W. and Soh, C.H. (1985) Characteristics of nuclear DNA in rice roots of
Japonica and Indica × Japonicavarieties. Agric. Res. Seoul Natl. Univ. 10,
63–68.
Lakshmanan, M., Koh, G., Chung, B.K.S. and Lee, D.-Y. (2014) Software ap-
plications for flux balance analysis. Brief. Bioinform., 15, 108–122.
References
120
Lakshmanan, M., Lim, S.-H., Mohanty, B., Kim, J.K., Ha, S.-H. and Lee, D.-
Y. (2015) Unraveling the light-specific metabolic and regulatory signatures
of rice through combined in silico modeling and multiomics analysis. Plant
Physiol., 169, 3002–3020.
Lakshmanan, M., Mohanty, B. and Lee, D.-Y. (2013b) Identifying essential
genes/reactions of the rice photorespiration by in silico model-based analy-
sis. Rice, 6, 20.
Lakshmanan, M., Zhang, Z., Mohanty, B., Kwon, J.-Y., Choi, H.-Y., Nam, H.-
J., Kim, D.-I. and Lee, D.-Y. (2013a) Elucidating rice cell metabolism un-
der flooding and drought stresses using flux-based modeling and analysis.
Plant Physiol., 162, 2140–2150.
Leegood, R.C. (2007) A welcome diversion from photorespiration. Nat. Biotech-
nol., 25, 539–540.
Levering, J., Broddrick, J., Dupont, C.L., et al. (2016) Genome-scale model re-
veals metabolic basis of biomass partitioning in a model diatom. PloS One,
11, e0155038.
Li, T., Heuvelink, E. and Marcelis, L.F.M. (2015) Quantifying the source–sink
balance and carbohydrate content in three tomato cultivars. Front. Plant
Sci., 6.
Lichtenthaler, H.K., Schwender, J., Disch, A. and Rohmer, M. (1997) Biosyn-
thesis of isoprenoids in higher plant chloroplasts proceeds via a mevalonate-
independent pathway. Eur. J. Biochem., 400, 271–274.
Lieberman, M., Segev, O., Gilboa, N., Lalazar, A. and Levin, I. (2004) The to-
mato homolog of the gene encoding UV-damaged DNA binding protein 1
(DDB1) underlined as the gene that causes the high pigment-1 mutant phe-
notype. Theor. Appl. Genet., 108, 1574–1581.
Liepman, A.H. and Olsen, L.J. (2001) Peroxisomal alanine: glyoxylate ami-
notransferase (AGT1) is a photorespiratory enzyme with multiple substrates
in Arabidopsis thaliana. Plant J., 25, 487–498.
Linka, M. and Weber, A.P.M. (2005) Shuffling ammonia between mitochondria
and plastids during photorespiration. Trends Plant Sci., 10, 461–465.
Liu, Y., Roof, S., Ye, Z., Barry, C., Tuinen, A. van, Vrebalov, J., Bowler, C. and
Giovannoni, J. (2004) Manipulation of light signal transduction as a means

References
121
of modifying fruit nutritional quality in tomato. Proc. Natl. Acad. Sci. U. S.
A., 101, 9897–9902.
Llorente, B., D’Andrea, L., Ruiz-Sola, M.A., Botterweg, E., Pulido, P., Andilla,
J., Loza-Alvarez, P. and Rodriguez-Concepcion, M. (2016) Tomato fruit
carotenoid biosynthesis is adjusted to actual ripening progression by a light-
dependent mechanism. Plant J., 85, 107–119.
Loreto, F. and Schnitzler, J.-P. (2010) Abiotic stresses and induced BVOCs.
Trends Plant Sci., 15, 154–166.
Loreto, F. and Velikova, V. (2001) Isoprene produced by leaves protects the pho-
tosynthetic apparatus against ozone damage, quenches ozone products, and
reduces lipid peroxidation of cellular membranes. Plant Physiol., 127,
1781–1787.
Lytovchenko, A., Eickmeier, I., Pons, C., et al. (2011) Tomato fruit photosynthe-
sis is seemingly unimportant in primary metabolism and ripening but plays
a considerable role in seed development. Plant Physiol., 157, 1650–1663.
Maarleveld, T.R., Boele, J., Bruggeman, F.J. and Teusink, B. (2014) A data in-
tegration and visualization resource for the metabolic network of
Synechocystis sp. PCC 6803. Plant Physiol., 164, 1111-1121.
Machado, D. and Herrgård, M. (2014) Systematic evaluation of methods for in-
tegration of transcriptomic data into constraint-based models of
metabolism. PLoS Comput. Biol., 10, e1003580.
Mahadevan, R. and Schilling, C.H. (2003) The effects of alternate optimal solu-
tions in constraint-based genome-scale metabolic models. Metab. Eng., 5,
264–276.
Manor, O., Levy, R. and Borenstein, E. (2014) Mapping the Inner Workings of
the Microbiome: Genomic- and Metagenomic-Based Study of Metabolism
and Metabolic Interactions in the Human Microbiome. Cell Metab., 20,
742–752.
Martins Conde, P. do R., Sauter, T. and Pfau, T. (2016) Constraint based mod-
eling going multicellular. Front. Mol. Biosci., 3.
Masakapalli, S.K., Le Lay, P., Huddleston, J.E., Pollock, N.L., Kruger, N.J.
and Ratcliffe, R.G. (2010) Subcellular flux analysis of central metabolism
in a heterotrophic Arabidopsis cell Suspension using steady-state stable iso-
tope labeling. Plant Physiol., 152, 602–619.

References
122
McCloskey, D., Palsson, B.Ø. and Feist, A.M. (2013) Basic and applied uses of
genome-scale metabolic network reconstructions of Escherichia coli. Mol.
Syst. Biol., 9, 661.
Mechin, V., Thevenot, C., Le Guilloux, M., Prioul, J.L. and Dame val, C. (2007)
Developmental analysis of maize endosperm proteome suggests a pivotal
role for pyruvate orthophosphate dikinase. Plant Physiol. 143, 1203–1219.
Miao, L., Zhang, Y., Yang, X., Xiao, J., Zhang, H., Zhang, Z., Wang, Y. and
Jiang, G. (2016) Colored light-quality selective plastic films affect antho-
cyanin content, enzyme activities, and the expression of flavonoid genes in
strawberry (Fragaria × ananassa) fruit. Food Chem., 207, 93–100.
Mintz-Oron, S., Meir, S., Malitsky, S., Ruppin, E., Aharoni, A. and Shlomi, T. (2012) Reconstruction of Arabidopsis metabolic network models account-
ing for subcellular compartmentalization and tissue-specificity. Proc. Natl.
Acad. Sci. U. S. A., 109, 339–344.
Mohanty, B., Kitazumi, A., Cheung, C.Y.M., Lakshmanan, M., Reyes, B.G. de
los, Jang, I.-C. and Lee, D.-Y. (2016) Identification of candidate network
hubs involved in metabolic adjustments of rice under drought stress by in-
tegrating transcriptome data and genome-scale metabolic network. Plant
Sci., 242, 224–239.
Moll, B. and Levine, R.P. (1970) Characterization of a photosynthetic mutant
strain of Chlamydomonas reinhardii deficient in phosphoribulokinase activ-
ity. Plant Physiol., 46, 576–580.
Mooney, B.P., Miernyk, J.A., Michael Greenlief, C. and Thelen, J.J. (2006) Us-
ing quantitative proteomics of Arabidopsis roots and leaves to predict
metabolic activity. Physiol. Plant., 128, 237–250.
Morfopoulos, C., Sperlich, D., Peñuelas, J., et al. (2014) A model of plant iso-
prene emission based on available reducing power captures responses to
atmospheric CO₂. New Phytol., 203, 125–139.
Mouillon, J.M., Aubert, S., Bourguignon, J., Gout, E., Douce, R. and Rébeillé,
F. (1999) Glycine and serine catabolism in non-photosynthetic higher plant
cells: their role in C1 metabolism. Plant J., 20, 197–205.
Muller, F., Dijkhuis, D.J. and Heida, Y.S. (1970) On the relationship between
chemical composition and digestibility in vivo of roughages. Agric. Res.
Rep., 736, 1–27.

References
123
Mueller, L.A., Zhang, P. and Rhee, S.Y. (2003) AraCyc: a biochemical pathway
database for Arabidopsis. Plant Physiol., 132, 453–460.
Muneer, S., Kim, E.J., Park, J.S. and Lee, J.H. (2014) Influence of green, red and
blue light emitting diodes on multiprotein complex proteins and photosyn-
thetic activity under different light intensities in lettuce leaves (Lactuca
sativa L.). Int. J. Mol. Sci., 15, 4657–4670.
Muthuraj, M., Palabhanvi, B., Misra, S., Kumar, V., Sivalingavasu, K. and
Das, D. (2013) Flux balance analysis of Chlorella sp. FC2 IITG under pho-
toautotrophic and heterotrophic growth conditions. Photosynth. Res., 118,
167–179.
Nakashima, K., Yamaguchi-Shinozaki, K. and Shinozaki, K. (2014) The tran-
scriptional regulatory network in the drought response and its crosstalk in
abiotic stress responses including drought, cold, and heat. Front. Plant Sci.,
5.
Nakazono, M., Tsuji, H., Li, Y., Saisho, D., Arimura, S., Tsutsumi, N. and Hi-
rai, A. (2000) Expression of a gene encoding mitochondrial aldehyde
dehydrogenase in rice increases under submerged conditions. Plant Phys-
iol., 124, 587–598.
Nield, J., Kruse, O., Ruprecht, J., Fonseca, P. da, Büchel, C. and Barber, J. (2000) Three-dimensional structure of Chlamydomonas reinhardtii and
Synechococcus elongatus photosystem II complexes allows for comparison
of their oxygen-evolving complex organization. J. Biol. Chem., 275,
27940–27946.
Niemann, G.J., Pureveen, J.B.M., Eijkel, G.B., Poorter, H. and Boon, J.J.
(1995) Differential chemical allocation and plant adaptation: a Py-MS study
of 24 species differing in relative growth rate. Plant Soil, 175, 275–289.
Nielsen, J. (2003) It is all about metabolic fluxes. J. Bacteriol., 185, 7031–7035.
Nogales, J., Gudmundsson, S., Knight, E.M., Palsson, B.O. and Thiele, I. (2012)
Detailing the optimality of photosynthesis in cyanobacteria through systems
biology analysis. Proc. Natl. Acad. Sci. U. S. A., 109, 2678–2683.
Nookaew, I., Jewett, M.C., Meechai, A., Thammarongtham, C., Laoten, K.,
Cheevadhanarak, S., et al. (2008).The genome-scale metabolic model
ilN800 of Saccharomyces cerevisiae and its validation: a scaffold to query
lipid metabolism. BMC Syst. Biol., 2, 71.

References
124
Norton, G. (1989) “Nature and biosynthesis of storage proteins,” in Oil Crops of
the World, ed G. Röbbelen, R.K. Downey, and A. Ashri (New York, NY:
McGraw-Hill), 165–191.
Novák, L. and Loubiere, P. (2000) The metabolic network of Lactococcus lactis:
distribution of (14)C-labeled substrates between catabolic and anabolic
pathways. J. Bacteriol., 182, 1136–1143.
Nunes-Nesi, A., Carrari, F., Gibon, Y., et al. (2007) Deficiency of mitochondrial
fumarase activity in tomato plants impairs photosynthesis via an effect on
stomatal function. Plant J., 50, 1093–1106.
Oberhardt, M.A., Palsson, B.Ø. and Papin, J.A. (2009) Applications of genome-
scale metabolic reconstructions. Mol. Syst. Biol., 5, 320.
O’Carrigan, A., Babla, M., Wang, F., Liu, X., Mak, M., Thomas, R., Bellotti,
B. and Chen, Z.-H. (2014) Analysis of gas exchange, stomatal behaviour
and micronutrients uncovers dynamic response and adaptation of tomato
plants to monochromatic light treatments. Plant Physiol. Biochem., 82,
105–115.
OECD (2004) “Consensus document on compositional considerations for new va-
riety of barley (Hordeum vulgare): key food and nutrients,” in Series on the
Safety of Novel Foods and Feeds, ed OECD (Paris: OECD Environmental
Health and Safety Publications), 1–42.
Ohlrogge, J. and Browse, J. (1995) Lipid biosynthesis. Plant Cell, 7, 957–970.
Orth, J.D., Thiele, I. and Palsson, B.Ø. (2010) What is flux balance analysis? Nat.
Biotechnol., 28, 245–248.
Osorio, S., Ruan, Y.-L. and Fernie, A.R. (2014) An update on source-to-sink car-
bon partitioning in tomato. Front. Plant Sci., 5, 516.
Pegoraro, E., Rey, A., Greenberg, J., Harley, P., Grace, J., Malhi, Y. and Guen-
ther, A. (2004) Effect of drought on isoprene emission rates from leaves of
Quercus virginiana Mill. Atmos. Environ., 38, 6149–6156.
Penning de Vries, F.W., Brunsting, A.H. and Laar, H.H. van (1974) Products,
requirements and efficiency of biosynthesis: a quantitative approach. J.
Theor. Biol., 45, 339–377.
Pilalis, E., Chatziioannou, A., Thomasset, B. and Kolisis, F. (2011) An in silico
compartmentalized metabolic model of Brassica napus enables the systemic

References
125
study of regulatory aspects of plant central metabolism. Biotechnol. Bio-
eng., 108, 1673–1682.
Pinchuk, G.E., Hill, E.A., Geydebrekht, O.V., Ingeniis, J.D., Zhang, X., Oster-
man, A., et al. (2010) Constraint-based model of Shewanella oneidensis
MR-1 metabolism: a tool for data analysis and hypothesis generation. PLoS
Comput. Biol., 6:e1000822.
Pinheiro, C. and Chaves, M.M. (2011) Photosynthesis and drought: can we make
metabolic connections from available data? J. Exp. Bot., 62, 869–882.
Poolman, M.G. (2006) ScrumPy: metabolic modelling with Python. Syst. Biol.
(Stevenage), 153, 375.
Poolman, M.G., Kundu, S., Shaw, R. and Fell, D.A. (2013) Responses to Light
Intensity in a Genome-Scale Model of Rice Metabolism. Plant Physiol.,
162, 1060–1072.
Poolman, M.G., Miguet, L., Sweetlove, L.J. and Fell, D.A. (2009) A genome-
scale metabolic model of Arabidopsis and some of its properties. Plant
Physiol., 151, 1570–1581.
Poorter, H. and Bergkotte, M. (1992) Chemical composition of 24 wild species
differing in relative growth rate. Plant Cell Environ., 15, 221–229.
Pramanik, J. and Keasling, J.D. (1998) Effect of Escherichia coli biomass com-
position on central metabolic fluxes predicted by a stoichiometric model.
Biotechnol. Bioeng., 60, 230–238.
Pramanik, J. and Keasling, J.D. (1997) Stoichiometric model of Escherichia coli
metabolism: incorporation of growth-rate dependent biomass composition
and mechanistic energy requirements. Biotechnol. Bioeng., 56, 398–421.
Price, N.D., Reed, J.L. and Palsson, B.Ø. (2004) Genome-scale models of micro-
bial cells: evaluating the consequences of constraints. Nat. Rev. Microbiol.,
2, 886–897.
Puchałka, J., Oberhardt, M.A., Godinho, M., Bielecka, A., Regenhardt, D.,
Timmis, K.N., Papin, J.A. and Martins dos Santos, V.A.P. (2008) Ge-
nome-scale reconstruction and analysis of the Pseudomonas putida KT2440
metabolic network facilitates applications in biotechnology. PLoS Comput.
Biol., 4, e1000210.

References
126
Pyl, E.-T., Piques, M., Ivakov, A., Schulze, W., Ishihara, H., Stitt, M. and Sul-
pice, R. (2012) Metabolism and growth in Arabidopsis depend on the
daytime temperature but are temperature-compensated against cool nights.
Plant Cell, 24, 2443–2469.
Quick, W.P., Schurr, U., Scheibe, R., Schulze, E.D., Rodermel, S.R., Bogorad,
L. and Stitt, M. (1991) Decreased ribulose-1,5-bisphosphate carboxylase-
oxygenase in transgenic tobacco transformed with “antisense” rbcS: I.
Impact on photosynthesis in ambient growth conditions. Planta, 183, 542–
554.
Rademacher, T., Hausler, R.E., Hirsch, H.J., Zhang, L., Lipka, V., Weier, D.,
Kreuzaler, F. and Peterhansel, C. (2002) An engineered phosphoenolpy-
ruvate carboxylase redirects carbon and nitrogen flow in transgenic potato
plants. Plant J., 32, 25–39.
Radrich, K., Tsuruoka, Y., Dobson, P., Gevorgyan, A., Swainston, N., Baart,
G. and Schwartz, J.-M. (2010) Integration of metabolic databases for the
reconstruction of genome-scale metabolic networks. BMC Syst. Biol., 4,
114.
Raghunathan, A., Reed, J., Shin, S., Palsson, B. and Daefler, S. (2009) Con-
straint-based analysis of metabolic capacity of Salmonella typhimurium
during host–pathogen interaction. BMC Syst. Biol., 3, 38.
Reinders, A., Panshyshyn, J.A. and Ward, J.M. (2005) Analysis of transport ac-
tivity of Arabidopsis sugar alcohol permease homolog AtPLT5. J. Biol.
Chem., 280, 1594–1602.
Rischer, H., Häkkinen, S.T., Ritala, A., Seppänen-Laakso, T., Miralpeix, B.,
Capell, T., Christou, P. and Oksman-Caldentey, K.-M. (2013) Plant
cells as pharmaceutical factories. Curr. Pharm. Des., 19, 5640–5660.
Rodríguez-Concepción, M., Forés, O., Martinez-García, J.F., González, V.,
Phillips, M.A., Ferrer, A. and Boronat, A. (2004) Distinct light-mediated
pathways regulate the biosynthesis and exchange of isoprenoid precursors
during Arabidopsis seedling development. Plant Cell, 16, 144–156.
Roessner-Tunali, U., Hegemann, B., Lytovchenko, A., Carrari, F., Bruedigam,
C., Granot, D. and Fernie, A.R. (2003) Metabolic profiling of transgenic
tomato plants overexpressing hexokinase reveals that the influence of hex-
ose phosphorylation diminishes during fruit development. Plant Physiol.,
133, 84–99.

References
127
Rontein, D., Dieuaide-Noubhani, M., Dufourc, E.J., Raymond, P. and Rolin, D. (2002) The metabolic architecture of plant cells. Stability of central metab-
olism and flexibility of anabolic pathways during the growth cycle of
tomato cells. J. Biol. Chem., 277, 43948–43960.
Rügen, M., Bockmayr, A. and Steuer, R. (2015) Elucidating temporal resource
allocation and diurnal dynamics in phototrophic metabolism using condi-
tional FBA. Sci. Rep., 5, 15247.
Sager, J.C. and McFarlane, J.C. (1997) in Plant growth chamber handbook, Ra-
diation, eds Langhans R.W., Tibbitts T.W. (Iowa State Univ. Press: North
Central Region Research Publication No. 340, Iowa Agriculture and Home
Economics Experiment Station Special Report no. 99, Ames, IA), pp 1–29.
Saha, R., Chowdhury, A. and Maranas, C.D. (2014) Recent advances in the re-
construction of metabolic models and integration of omics data. Curr. Opin.
Biotechnol., 29, 39–45.
Saha, R., Suthers, P.F. and Maranas, C.D. (2011) Zea mays i RS1563: A com-
prehensive genome-scale metabolic reconstruction of maize metabolism.
PLoS One, 6, e21784.
Sánchez-Rodríguez, E., Rubio-Wilhelmi, M., Cervilla, L.M., Blasco, B., Rios,
J.J., Rosales, M.A., Romero, L. and Ruiz, J.M. (2010) Genotypic differ-
ences in some physiological parameters symptomatic for oxidative stress
under moderate drought in tomato plants. Plant Sci., 178, 30–40.
Schauer, N., Zamir, D. and Fernie, A.R. (2005) Metabolic profiling of leaves and
fruit of wild species tomato: a survey of the Solanum lycopersicum com-
plex. J. Exp. Bot., 56, 297–307.
Schomburg, I., Chang, A., Ebeling, C., Gremse, M., Heldt, C., Huhn, G. and
Schomburg, D. (2004) BRENDA, the enzyme database: updates and major
new developments. Nucleic Acids Res., 32, D431–D433.
Schuetz, R., Kuepfer, L. and Sauer, U. (2007) Systematic evaluation of objective
functions for predicting intracellular fluxes in Escherichia coli. Mol. Syst.
Biol., 3.
Schwab, W. (2003) Metabolome diversity: too few genes, too many metabolites?
Phytochemistry, 62, 837–849.
Schwarte, S. and Bauwe, H. (2007) Identification of the photorespiratory 2-phosp

References
128
hoglycolate phosphatase, PGLP1, in Arabidopsis. Plant Physiol., 144,
1580–1586.
Schwender, J., Goffman, F., Ohlrogge, J.B. and Shachar-Hill, Y. (2004) Rubisco
without the Calvin cycle improves the carbon efficiency of developing
green seeds. Nature, 432, 779–782.
Schwender, J. and Hay, J.O. (2012) Predictive modeling of biomass component
tradeoffs in Brassica napus developing oilseeds based on in silico manipu-
lation of storage metabolism. Plant Physiol., 160, 1218–1236.
Schwender, J. and Ohlrogge, J.B. (2002) Probing in vivo metabolism by stable
isotope labeling of storage lipids and proteins in developing Brassica napus
embryos. Plant Physiol., 130, 347–361.
Schwender, J., Shachar-Hill, Y. and Ohlrogge, J.B. (2006) Mitochondrial metab-
olism in developing embryos of Brassica napus. J. Biol. Chem., 281, 34040–
34047.
Seaver, S.M.D., Bradbury, L.M.T., Frelin, O., Zarecki, R., Ruppin, E., Hanson,
A.D. and Henry, C.S. (2015) Improved evidence-based genome-scale met-
abolic models for maize leaf, embryo, and endosperm. Front. Plant Sci., 6,
142.
Sharkey, T.D., Wiberley, A.E. and Donohue, A.R. (2008) Isoprene emission from
plants: why and how. Ann. Bot., 101, 5–18.
Sharrock, R.A. and Clack, T. (2002) Patterns of expression and normalized levels
of the five Arabidopsis phytochromes. Plant Physiol., 130, 442–456.
Sheen, S.J. (1983) Biomass and chemical composition of tobacco plants under high
density growth. Beitr. Tabakforsch. Int., 12, 35–42.
Shioi, Y. and Sasa, T. (1984) Chlorophyll formation in the YG-6 mutant of chlo-
rella regularis: spectral characterization of protochlorophyllide
phototransformation. Plant Cell Physiol., 25, 139–149.
Simons, M., Saha, R., Amiour, N., et al. (2014) Assessing the metabolic impact
of nitrogen availability using a compartmentalized maize leaf genome-scale
model. Plant Physiol., 166, 1659–1674.
Skillman, J.B. (2008) Quantum yield variation across the three pathways of photo-
synthesis: not yet out of the dark. J. Exp. Bot., 59, 1647–1661.

References
129
Smallbone, K. and Simeonidis, E. (2009) Flux balance analysis: a geometric per-
spective. J. Theor. Biol., 258, 311–315.
Smirnoff, N. (1993) The role of active oxygen in the response of plants to water
deficit and desiccation. New Phytol., 125, 27–58.
Smith, A.M. and Stitt, M. (2007) Coordination of carbon supply and plant growth.
Plant Cell Environ., 30, 1126–1149.
Spector, W.S. (1956) Handbook of Biological Data. Washington, DC:National
Academy of Science.
Spielbauer, G., Margl, L., Hannah, L.C., Römisch, W., Ettenhuber, C., Bacher,
A., Gierl, A., Eisenreich, W. and Genschel, U. (2006) Robustness of cen-
tral carbohydrate metabolism in developing maize kernels. Phytochemistry,
67, 1460–1475.
Sterman, J.D. (2002) All models are wrong: reflections on becoming a systems
scientist. Syst. Dyn. Rev., 18, 501–531.
Stolyar, S., Van Dien, S., Hillesland, K.L., Pinel, N., Lie, T.J., Leigh, J.A. and
Stahl, D.A. (2007) Metabolic modeling of a mutualistic microbial commu-
nity. Mol. Syst. Biol., 3, 92.
Story, E.N., Kopec, R.E., Schwartz, S.J. and Harris, G.K. (2010) An update on
the health effects of tomato lycopene. Annu. Rev. Food Sci. Technol., 1,
189–210.
Sulpice, R., Nikoloski, Z., Tschoep, H., et al. (2013) Impact of the carbon and
nitrogen supply on relationships and connectivity between metabolism and
biomass in a broad panel of Arabidopsis accessions. Plant Physiol., 162,
347–363.
Sweetlove, L.J., Beard, K.F.M., Nunes-Nesi, A., Fernie, A.R. and Ratcliffe,
R.G. (2010) Not just a circle: flux modes in the plant TCA cycle. Trends
Plant Sci., 15, 462–470.
Sweetlove, L.J., Fell, D. and Fernie, A.R. (2008) Getting to grips with the plant
metabolic network. Biochem. J., 409, 27–41.
Sweetlove, L.J. and Ratcliffe, R.G. (2011) Flux-balance modeling of plant metab-
olism. Front. Plant Sci., 2, 38.

References
130
Sweetlove, L.J., Williams, T.C.R., Cheung, C.Y.M. and Ratcliffe, R.G. (2013)
Modelling metabolic CO₂ evolution--a fresh perspective on respiration.
Plant Cell Environ., 36, 1631–1640.
Taira, M., Valtersson, U., Burkhardt, B. and Ludwig, R.A. (2004) Arabidopsis
thaliana GLN2-encoded glutamine synthetase is dual targeted to leaf mito-
chondria and chloroplasts. Plant Cell, 16, 2048–2058.
Tcherkez, G., Cornic, G., Bligny, R., Gout, E. and Ghashghaie, J. (2005) In vivo
respiratory metabolism of illuminated leaves. Plant Physiol., 138, 1596–
1606.
Thiele, I. and Palsson, B.Ø. (2010) A protocol for generating a high-quality ge-
nome-scale metabolic reconstruction. Nat. Protoc., 5, 93–121.
Tomato Genome Consortium (2012) The tomato genome sequence provides in-
sights into fleshy fruit evolution. Nature, 485, 635–641.
Töpfer, N., Caldana, C., Grimbs, S., Willmitzer, L., Fernie, A.R. and Nikoloski,
Z. (2013) Integration of genome-scale modeling and transcript profiling re-
veals metabolic pathways underlying light and temperature acclimation in
Arabidopsis. Plant Cell, 25, 1197–1211.
Town, C.D., Cheung, F., Maiti, R., et al. (2006) Comparative genomics of Bras-
sica oleracea and Arabidopsis thaliana reveal gene loss, fragmentation, and
dispersal after polyploidy. Plant Cell, 18, 1348–1359.
Tschoep, H., Gibon, Y., Carillo, P., Armengaud, P., Szecowka, M., Nunes-Nesi,
A., Fernie, A.R., Koehl, K. and Stitt, M. (2009) Adjustment of growth
and central metabolism to a mild but sustained nitrogen-limitation in Ara-
bidopsis. Plant Cell Environ., 32, 300–318.
Valle, E.M., Boggio, S.B. and Heldt, H.W. (1998) Free Amino Acid Composition
of Phloem Sap and Growing Fruit of Lycopersicon esculentum. Plant Cell
Physiol., 39, 458–461.
Varma, A. and Palsson, B.O. (1995) Parametric sensitivity of stoichiometric flux
balance models applied to wild-type Escherichia coli metabolism. Biotech-
nol. Bioeng., 45, 69–79.
Vranová, E., Coman, D. and Gruissem, W. (2013) Network analysis of the MVA
and MEP pathways for isoprenoid synthesis. Annu. Rev. Plant Biol., 64,
665–700.

References
131
Vu, T.T., Stolyar, S.M., Pinchuk, G.E., et al. (2012) Genome-scale modeling of
light-driven reductant partitioning and carbon fluxes in diazotrophic unicel-
lular cyanobacterium Cyanothece sp. ATCC 51142. PLoS Comput. Biol., 8,
e1002460.
Walker, B.J., Strand, D.D., Kramer, D.M. and Cousins, A.B. (2014) The re-
sponse of cyclic electron flow around photosystem I to changes in
photorespiration and nitrate assimilation. Plant Physiol., 165, 453–462.
Wang, C., Guo, L., Li, Y. and Wang, Z. (2012) Systematic comparison of C3 and
C4 plants based on metabolic network analysis. BMC Syst. Biol., 6, 1–14.
Wang, H., Gu, M., Cui, J., Shi, K., Zhou, Y. and Yu, J. (2009) Effects of light
quality on CO2 assimilation, chlorophyll-fluorescence quenching, expres-
sion of Calvin cycle genes and carbohydrate accumulation in Cucumis
sativus. J. Photochem. Photobiol. B, 96, 30–37.
Wang, H., Jiang, Y.P., Yu, H.J., Xia, X.J., Shi, K., Zhou, Y.H. and Yu, J.Q. (2010) Light quality affects incidence of powdery mildew, expression of
defence-related genes and associated metabolism in cucumber plants. Eur.
J. Plant Pathol., 127, 125–135.
Wang, X., Heifetz, P.B., Gruissem, W. and Lange, M. (2003) Cross talk between
cytosolic and plastidial pathways of isoprenoid biosynthesis in Arabidopsis
thaliana. Proc. Natl Acad. Sci. U.S.A., 100, 6866–6871.
Wedig, C.L., Jaster, E.H. and Moore, K.J. (1987) Hemicellulose monosaccharide
compositionand in vitro disappearance of orchard grass and alfalfa hay. J.
Agr. Food Chem., 35, 214–218.
Weise, A., Barker, L., Kühn, C., Lalonde, S., Buschmann, H., Frommer, W.B.
and Ward, J.M. (2000) A new subfamily of sucrose transporters, SUT4,
with low affinity/high capacity localized in enucleate sieve elements of
plants. Plant Cell, 12, 1345–1355.
Wilhelm, C. and Selmar, D. (2011) Energy dissipation is an essential mechanism
to sustain the viability of plants: The physiological limits of improved pho-
tosynthesis. J. Plant Physiol., 168, 79–87.
Williams, T.C.R., Miguet, L., Masakapalli, S.K., Kruger, N.J., Sweetlove, L.J.
and Ratcliffe, R.G. (2008) Metabolic network fluxes in heterotrophic Ar-
abidopsis cells: stability of the flux distribution under different oxygenation
conditions. Plant Physiol., 148, 704–718.

References
132
Williams, T.C.R., Poolman, M.G., Howden, A.J.M., Schwarzlander, M., Fell,
D.A., Ratcliffe, R.G. and Sweetlove, L.J. (2010) A genome-scale meta-
bolic model accurately predicts fluxes in central carbon metabolism under
stress conditions. Plant Physiol., 154, 311–323.
Wingler, A., Lea, P.J., Quick, W.P. and Leegood, R.C. (2000) Photorespiration:
metabolic pathways and their role in stress protection. Philos. Trans. R. Soc.
Lond. Biol. Sci., 355, 1517–1529.
Wu, Q., Su, N., Shen, W. and Cui, J. (2014) Analyzing photosynthetic activity
and growth of Solanum lycopersicum seedlings exposed to different light
qualities. Acta Physiol. Plant., 36, 1411–1420.
Xiaoying, L., Shirong, G., Taotao, C., Zhigang, X. and Tezuka, T. (2014) Reg-
ulation of the growth and photosynthesis of cherry tomato seedlings by
different light irradiations of light emitting diodes (LED). Afr. J. Biotech-
nol., 11, 6169–6177.
XiaoYing, L., ShiRong, G., ZhiGang, X., XueLei, J. and Tezuka, T. (2011) Reg-
ulation of chloroplast ultrastructure, cross-section anatomy of leaves, and
morphology of stomata of cherry tomato by different light irradiations of
light-emitting diodes. HortScience, 46, 217–221.
Xiong, L. and Zhu, J.-K. (2003) Regulation of abscisic acid biosynthesis. Plant
Physiol., 133, 29–36.
Xiong, Y., DeFraia, C., Williams, D., Zhang, X. and Mou, Z. (2009) Deficiency
in a cytosolic ribose-5-phosphate isomerase causes chloroplast dysfunction,
late flowering and premature cell death in Arabidopsis. Physiol. Plant., 137,
249–263.
Xu, H., Zhang, J., Zeng, J., Jiang, L., Liu, E., Peng, C., He, Z. and Peng, X. (2009) Inducible antisense suppression of glycolate oxidase reveals its
strong regulation over photosynthesis in rice. J. Exp. Bot., 60, 1799–1809.
Yamamoto, H., Peng, L., Fukao, Y. and Shikanai, T. (2011) An Src homology 3
domain-like fold protein forms a ferredoxin binding site for the chloroplast
NADH dehydrogenase-like complex in Arabidopsis. Plant Cell, 23, 1480–
1493.
Yang, Y.-X., Wang, M.-M., Ren, Y., et al. (2014) Light-induced systemic re-
sistance in tomato plants against root-knot nematode Meloidogyne
incognita. Plant Growth Regul., 76, 167–175.

References
133
Yorio, N.C., Goins, G.D., Kagie, H.R., Wheeler, R.M. and Sager, J.C. (2001)
Improving spinach, radish, and lettuce growth under red light-emitting di-
odes (LEDs) with blue light supplementation. HortScience, 36, 380–383.
Yu, H. and Ong, B.-L. Effect of radiation quality on growth and photosynthesis of
Acacia mangium seedlings. Photosynthetica, 41, 349–355.
Yuan, H., Cheung, C.Y.M., Poolman, M.G., Hilbers, P.A.J. and Riel, N.A.W.
van (2016) A genome-scale metabolic network reconstruction of tomato
(Solanum lycopersicum L.) and its application to photorespiratory metabo-
lism. Plant J., 85, 289–304.
Zhang, X., Brammer, E., Pedersén, M. and Fei, X. (1997) Effects of light photon
flux density and spectral quality on photosynthesis and respiration in
Porphyra yezoensis (Bangiales, Rhodophyta). Phycol. Res., 45, 29–37.


135
Summary
Cellular metabolism is a complex process which encompasses all biochemical reac-
tions taking place within a cell. These biochemical reactions are organized into
numerous metabolic pathways which are often interconnected, shaping a dynamic
circuitry commonly referred as metabolic network. In living organisms, metabolic
network plays an important role in the cell survival. Studying the regulation of the
metabolic network will eventually contribute to understanding cellular mechanisms.
In this regard, mathematical and computational approaches, in particular, flux bal-
ance analysis (FBA), and related methods, are increasingly recognized as a powerful
tool to systematically study the organization of metabolic networks. In the present
thesis, we used the constraint-based modelling framework to investigate the func-
tions of plant biological processes and the effects of environmental perturbations,
such as availability of water and light.
Firstly, we examined how the modelling parameters commonly used in flux-
balanced analysis affect the flux distributions in plant metabolic networks (Chapter
2). The analyses were applied to Arabidopsis which is the best-investigated plant
model organism. Our analyses suggested that model structure has a large impact on
FBA predictions in comparison with the biomass composition when studying the
plant metabolic behavior using FBA. In addition, comparative analysis of the Ara-
bidopsis models paves the way for exploring the existence of principles that are
relevant for the regulation and robustness of plant central carbon metabolism.
Tomato (Solanum lycopersicum L.) is one of the most important vegetable
crops grown in the world. With the genome sequence available for tomato in 2012,
it is possible perform systems-level studies of this high-value vegetable crop. In this
thesis, we constructed a genome-scale metabolic model for tomato, iHY3410, which
is used for simulating tomato leaf metabolism (Chapter 3). The model is capable of
successfully describing the metabolic activities of well-known bio-chemical path-
ways for leaf cells under heterotrophic and phototrophic conditions.
Subsequently, we used the reconstructed tomato model iHY3410 to investigat-
ing the metabolic characteristics under drought stressed conditions (Chapter 4). The
model predictions suggested that the metabolic flux through the mevalonate (MVA)
pathway under drought conditions significantly differed from that under normal
conditions, which gave hints to possible adaptive metabolic responses to drought

Summary
136
stresses. The application of genome-scale networks to the abiotic stresses in plants
is still in its infancy, and we believe our tomato model can serve as a starting point
for studying the functional consequences of abiotic stresses.
Finally, the tomato model iHY3410 was extended to a light-specific model,
which was employed to explore the metabolic changes of tomato leaves in response
to changing light intensity and quality (Chapter 5). The comprehensive analyses in-
dicate mitochondrial respiration plays an important role in regulating the balance
between ATP and NADPH in plastid, thus enabling optimal growth performance in
varying light conditions. The interaction between the plastid and other organelles is
achieved by metabolite shuttles that differ with the light condition.
Additionally, this thesis discusses the potential extensions of the present work
(Chapter 6). Overall, the thesis work provides a systematic computational frame-
work for investigating metabolic activities under various growth conditions.

137
Publications
Yuan, H., Cheung, C.Y.M., Hilbers, P.A.J. and van Riel, N.A.W. Modelling the
effects of light intensity and quality on the light-driven metabolism of tomato. In
preparation.
Yuan, H., Cheung, C.Y.M., Hilbers, P.A.J. and van Riel, N.A.W. (2016) Flux bal-
ance analysis of plant metabolism: the effect of biomass composition and model
structure on model predictions. Front. Plant Sci.7, 537
Yuan, H., Cheung, C.Y.M., Poolman, M.G., Hilbers, P.A.J. and van Riel, N.A.W.
(2016) A genome-scale metabolic network reconstruction of tomato (Solanum lyco-
perscum L.) and its application to photorespiratory metabolism. Plant J., 85, 289–
304
Other publication outside the scope of this thesis
Golam Jalal Ahammed, Hui-Li Yuan, Joshua Otieno Ogweno, Yan-Hong Zhou,
Xiao-Jian Xia, Wei-Hua Mao, Kai Shi, Jing-Quan Yu (2016) Brassinosteroid alle-
viates phenanthrene and pyrene phytotoxicity by increasing detoxification activity
and photosynthesis in tomato. Chemosphere, 86, 546–555

138
Acknowledgements
Four years ago, I have never thought I would do a PhD abroad, nor switch my field
of study in experimental plant biology. But right now, I am completing my PhD in
computational biology at TU/e. I cannot believe it happened! This thesis would not
have been possible without the support and help from many people. I take this op-
portunity to express my gratitude to all the people who have helped and encouraged
me during my PhD.
First, I would like to thank my promoter prof.dr. Peter Hilbers for offering me
the opportunity to do my PhD study at Computational Biology group (CBio). Your
enthusiasm towards work has always impressed me and positively influenced me.
Both your broad knowledge and important insights greatly improved my work. Per-
haps, I was the most ignorant of my colleagues at the CBio group, but your trust and
encouragement kept me going during times I doubted it could be done.
I also would like to express my sincere gratitude to my daily supervisor prof.dr.
Natal van Riel, for his mentorship and support when I needed. I still remembered
the first conversations we had at Zhejiang University, China in 2012. When I told
you my worries for switching to a different filed, you said: I’m not telling you it’s
going to be easy, I’m telling you you can make it if you are really willing to learn.
Indeed, it was a challenging journey to me, which gets me frustrated and disap-
pointed with myself. But, your support and inspiration kept me going through this
tough journey. I truly appreciate the possibilities to attend conferences and to visit
other groups you provided, from which I have benefited a lot.
There is one person that contributed significantly to my PhD work and without
whom I would not be at this point, this person is Dr. Maurice Cheung from Yale-
NUS College, Singapore. Maurice, I was impressed by your rigor and enthusiasm
towards work. It was the ambition of being like you one day that motivated me and
gave me the strength to go beyond my limits. I have bothered you with so many
questions, but you were always patient with me. I cannot express more appreciation
for your guidance on my work, encouraging words in moments of self-doubt and
support whenever I needed. Without these, I would have had a much harder time. I
think I am fortunate enough to know you and work with you.
I also want to extend my gratitude to all my committee members: George
Ratcliffe, Bas Teusink, Jan Bergmans, Guofu Zhou and Maurice Cheung, thank all

Acknowledgements
139
of you for your time on reading my dissertation and valuable comments on my dis-
sertation. Dick de Ridder and Cees Oomens, thanks for serving on the public defense
of my dissertation.
I would like to acknowledge Dr. Mark Poolman from Oxford Brookes Univer-
sity, UK. Mark, thanks a lot for hosting me at Oxford Brookes University and for
the technique help on metabolic modelling in ScrumPy. I also want to thank all the
people in his group, especially, Hassan Hartman, Dipali Singh and Kailash Adhikari
for the instructions on ScrumPy and fruitful discussions. Dipali, thanks very much
for your help and caring during my stay in Oxford. It was always enjoyable to talk
with you and to do adventures with you. Kailash, thanks for sharing so many beau-
tiful songs with me, which I enjoyed a lot. I will never forget my wonderful time in
Oxford.
I also want to thank all my CBio group members, including the former mem-
bers, for sharing and for creating such a friendly atmosphere for work. Special
thanks to: Bram Wijnen, Joep Vanlier, Ceylan, Rik, Anne, Fianne, Yvonne, Zandra,
Sander, Ymke and Daniela for discussions on scientific or unscientific topics and
the PhD gatherings, from which I had a lot of fun, and of course, the nice foods.
Bram, I am very thankful for your valuable contribution to the project startup.
Thanks very much for picking me up from Schiphol airport and helping to settle
down when I moved to the Netherlands. More impressively, you prepared the Chi-
nese food for my first meals, which made me feel cared for. I also want to extend
my appreciation to your parents for their lovely hand-made Christmas cards, and for
the dinners we had together, which made me feel welcome.
Joep, many thanks for sharing your valuable experience and for giving helpful
suggestions for my PhD study. Doing a PhD, sometimes, doesn’t go smoothly, but
as you said, funfun
Ceylan, you like a sister for me, your caring gave me a lot of warmth, which
really alleviated me from feeling homesick, especially, in the first few months after
I came to the Netherlands. Many thanks for your inspirations when I was lost and
feeling down, and for sharing so many delicious desserts and candies with me.
Rik, you have a really good sense of humor. I had a lot of fun from your humor
and jokes. Thanks for inviting me for your spareribs, which I always miss a lot
Fianne, I am always impressed by your neat and appealing slides and/or posters
every time you presented. I think you are really skilled at that. You are always very
kindly and patient whenever I needed a favor. And it is always joyful to listen to
you while you talk about your Chinese courses.
Yvonne, thank you for inviting me to attend your wedding ceremony, wish you
and your husband a wonderful life together

Acknowledgements
140
Zandra, I always wonder how you can manage so many things in your life.
Your enthusiasm towards life and work is impressive. It was very great to do run-
nings with you, which were the cherished memories to me.
I also would like to acknowledge Rina, the secretary of our group for her ex-
cellent administrative support. Rina, your work really made our life much simpler.
Koen, thanks for all your effort in coordinating the laboratory. I highly appreciate
your help in improving the cover design. Dragan, thank you so much for all your
suggestions on my growth and your kindness to me.
My gratitude also goes to my friends Xuemin, Yuanyuan, Yu, Xuan and Wenya
(out of the Netherlands), Guiling, Xuefang, Zihan and all the people I met in Eind-
hoven. Thanks for all you have done for me throughout this journey. My thanks and
appreciation also go to Loka and Geremy from National University of Singapore for
their help and caring during my stay in Singapore. Thanks for bearing my craziness
and stubborn You guys made my stay in Singapore very joyful.
I acknowledge the Brainbridge project and China Scholarship Council (CSC)
for the financial support.
Finally, I would like to dedicate this thesis to my dearest parents for their sup-
port and love throughout all these years. I also want to thank my brothers, my sisters-
in-law, my sister and my brother-in-law for spoiling me, and for their support in all
my pursuits. I feel so lucky to have such a big family and to be your younger sister.
Completing a PhD is just the beginning, not the end. I am looking forward to
my next adventure.
Huili Yuan
October, 2016
Eindhoven, the Netherlands

141
Curriculum Vitae
Huili Yuan was born in Henan Province, China in 1986. She
received her Bachelor degree in Agronomy at Henan Agri-
cultural University, China in 2009. In the same year, she
started her master study in Horticulture in the group of
prof.dr. Jingquan Yu at Zhejiang University, China, and ob-
tained her Master degree in 2012. Her master thesis focused
on the effects of light quality on vegetable crops’ growth,
nutritional quality and disease resistance. From September
2012, she switched from discipline and started her PhD
study in Computational Biology group of prof.dr. Peter Hilbers at Eindhoven Uni-
versity of Technology (TU/e), the Netherlands, with a scholarship from China
Scholarship Council (CSC). She worked on the genome-scale metabolic modelling
of plant metabolism, under the supervision of prof.dr. Natal van Riel. During the
PhD study, she also collaborated with the research groups of dr. Mark Poolman at
Oxford Brookes University (UK) and dr. Maurice Cheung at Yale-NUS College
(Singapore) and visited these groups occasionally. The results of her PhD work are
presented in this dissertation.