multi -omics and metabolic modelling pipelines: challenges ... · pdf filea general review of...
TRANSCRIPT
Multi -omics and metabolic modelling pipelines: challenges and tools for systems microbiology
Marco Fondi1,2* and Pietro Liò3
1 Computational Biology group (ComBo), University of Florence, Via Madonna del Piano 6, Sesto Fiorentino, Florence, 50019, Italy
2 Laboratory of Microbial and Molecular Evolution, Department of Biology, University of Florence, Via Madonna del Piano 6, Sesto Fiorentino, Florence, 50019, Italy.
3 University of Cambridge, Computer Laboratory, 15 JJ Thomson Avenue, CB3 0FD Cambridge, UK
*Corresponding author
Marco Fondi, PhD
Dep. of Biology, University of Florence
Via Madonna del Piano 6, S. Fiorentino, Florence, Italy
Tel. +39 055 4574736
. CC-BY-NC-ND 4.0 International licensepeer-reviewed) is the author/funder. It is made available under aThe copyright holder for this preprint (which was not. http://dx.doi.org/10.1101/013532doi: bioRxiv preprint first posted online Jan. 7, 2015;

Abstract
Integrated -omics approaches are quickly spreading across microbiology research labs, leading to i) the possibility of detecting previously hidden features of microbial cells like multi-scale spatial organisation and ii) tracing molecular components across multiple cellular functional states. This promises to reduce the knowledge gap between genotype and phenotype and poses new challenges for computational microbiologists. We underline how the capability to unravel the complexity of microbial life will strongly depend on the integration of the huge and diverse amount of information that can be derived today from -omics experiments. In this work, we present opportunities and challenges of multi –omics data integration in current systems biology pipelines. We here discuss which layers of biological information are important for biotechnological and clinical purposes, with a special focus on bacterial metabolism and modelling procedures. A general review of the most recent computational tools for performing large-scale datasets integration is also presented, together with a possible framework to guide the design of systems biology experiments by microbiologists.
Keywords: Multi –omics – Systems microbiology – Computational biology – Metabolic modelling - -omics integration
. CC-BY-NC-ND 4.0 International licensepeer-reviewed) is the author/funder. It is made available under aThe copyright holder for this preprint (which was not. http://dx.doi.org/10.1101/013532doi: bioRxiv preprint first posted online Jan. 7, 2015;

Introduction
The ease at which genomes are currently sequenced has assigned to genomics one of the
first steps in microbial systems biology. Regardless of the technique used, assembly and
annotation typically follow genome sequencing and return an almost complete picture of
the genetic reservoir of a given microorganism. On the other hand, genome sequence only
represents a snapshot of the real phenotypic capabilities of an organism, providing very
few indications on other crucial aspects of the underlying life cycle such as response to
environmental and genetic perturbations, fluctuations in time, gene essentiality and so on.
To gain a systemic and exhaustive description of living entities, static information deriving
from genome sequence is not enough and other levels of knowledge must be taken into
consideration. Nowadays, technologies do exist for measuring, in a large-scale fashion,
other crucial aspects of cellular life, including the level of RNA within the cell
(transcriptomics), the nature of metabolites present within the cell (metabolomics), the
interaction among different proteins (protein-protein interaction) and many others (detailed
below). Also, metabolic biodiversity of microbial communities can be today evaluated
through metagenomics and metatranscriptomics approaches. However, no single –omics
analysis can fully unravel the complexities of fundamental microbiology (Zhang et al.,
2010). Multi- and integrated -omics approaches have thus started spreading among
several research areas, from bio-based fuel production (Zhu et al., 2013) to
biopharmaceuticals processes (Schaub et al., 2012), from medical research (Wiench et al.,
2013) to host-pathogen interactions (Ansong et al., 2013b). The integration of such diverse
data types may be considered one of the key challenges of present-day bioinformatics,
due to different data formats, high data dimensionality and need for data normalization.
One of the most important drawbacks associated with the booming of genomics resides in
the possibility to (almost) automatically derive the potential metabolic landscape of a
strain, given its genome. Bacteria continuously provide industry with novel
products/processes based on the use of their metabolism and numerous efforts are being
undertaken to deliver new usable substances of microbial origin to the marketplace
(Beloqui et al., 2008), including pharmaceuticals, biofuels and bioactive compounds in
general (George et al., 1983; Garcia-Ochoa et al., 2000; Lee et al., 2005; Zou et al., 2012).
In this context, computational modelling and in silico simulations are often adopted by
metabolic engineers to quantitatively simulate chemical reactions fluxes within the whole
microbial metabolism. To exploit computational approaches, genome annotation-derived
. CC-BY-NC-ND 4.0 International licensepeer-reviewed) is the author/funder. It is made available under aThe copyright holder for this preprint (which was not. http://dx.doi.org/10.1101/013532doi: bioRxiv preprint first posted online Jan. 7, 2015;

metabolic networks are transformed into models by defining the boundaries of the system,
a biomass assembly reaction, and exchange fluxes with the environment (Durot et al.,
2009). Also needed are i) structured (mathematical) representation of that network, ii)
possibly quantitative parameters enabling simulations or predictions on the joint operation
of all network reactions in a given environment and, in particular, iii) predictions on the
values of metabolite fluxes and/or concentrations (Papin et al., 2003). A constraint-based
modelling framework can then be used to automatically compute the resulting balance of
all the chemical reactions predicted to be active in the cell and, in turn, to bridge the gap
between knowledge of the metabolic network structure and observed metabolic processes
(Varma and Palsson, 1994).
Innovative high-throughput technologies (see Figure 1) represent a valuable resource also
in the context of metabolic modelling, since data integration can be performed to gain a
clearer and more comprehensive picture of the metabolic traits of a given organism.
Diverse data types can be mapped onto metabolic models in order to elucidate more
thoroughly the metabolism of a cell and its response to environmental factors; this is
usually done by including functional characterization and accurate quantification of all
levels of gene products, mRNA, proteins and metabolites, as well as their interaction
(Zhang et al., 2010).
Here we review and discuss possible experimental and computational pipelines for
multiple data integration in microbial research, allowing the simultaneous analysis of
different data-types and their mapping onto a de novo genome annotation. We discuss
which layers of biological information have been shown to be important for
biotechnological/clinical purposes and whether these layers are independent or have to be
considered as a single complex system. Computational insights will be reviewed, including
data mining, pre-processing, assimilation and iterative integration in order to exploit all
available information.
Furthermore, given the link existing between microbial phenotypes and underlying
metabolism, we will discuss a general framework of the major steps and checkpoints
encountered when reconstructing the metabolic network of a given organism and in its
consequent exploitation for computational simulation and/or phenotype prediction.
We underline the importance of integrating different sources of information to gain a more
comprehensive view of genome annotation and metabolic features in general.
. CC-BY-NC-ND 4.0 International licensepeer-reviewed) is the author/funder. It is made available under aThe copyright holder for this preprint (which was not. http://dx.doi.org/10.1101/013532doi: bioRxiv preprint first posted online Jan. 7, 2015;

Information layers overview
This section provides a schematization of the sources of information (layers) that are
currently the most exploited in systems biology. These layers represent the basis of multi-
omics integration discussed in the next section.
Microbial genomics pipelines
Since fast genome sequencing and preliminary data post-processing have been achieved,
well-grounded experimental design and strains selection have (re)gained a key position
when drafting genomics-oriented research plans (Fig. 1A). Complete genome sequence is
increasingly more often the starting point for integrative pipelines (see below and Fig. 1).
Sample preparation and sequencing can be performed in a few days while data post-
processing (including quality check, de novo assembly, gene prediction) still represents
the most demanding bottleneck of the genomics pipeline. For this reason, most of the
leading genomics centres (including BGI, DOE-JGI, Craig Venter Institute, Sanger) couple
genome sequencing to bioinformatics analysis and usually make their software open
access to the research community. In this way, preliminary assembly, annotation and
analysis of genomes are carried out, although many other popular tools exist for de novo
genome annotation (see for example (Angiuoli et al., 2008; Aziz et al., 2008; Seemann,
2014)).
Besides basic genomic knowledge (e.g. gene presence/absence patterns), many other
additional information layers are today available to be merged and integrated when trying
to fully elucidate complex biological patterns of living entities (Fig. 1). References to study
cases and computational tools related to these informational layers are reported in
Supporting Information 1 and 2, respectively. These include:
• Gene constraints represent the additional information present in DNA sequences
and not fully exploited by functional annotation pipelines. These may include the
detection of gene fusions, the identification of operons and the computation of gene
Codon Adaptation Index (CAI). Gene structure data (e.g. the presence of gene
fusions) can guide the identification of potential protein–protein interactions (Enright
et al., 1999). Further, the study of operonic organization exploits co-directional
intergenic distances and can provide homology-free functional annotation through
the transfer of functions among co-operonic genes (i.e. genes belonging to the
. CC-BY-NC-ND 4.0 International licensepeer-reviewed) is the author/funder. It is made available under aThe copyright holder for this preprint (which was not. http://dx.doi.org/10.1101/013532doi: bioRxiv preprint first posted online Jan. 7, 2015;

same operon) through the so-called the ‘guilt by association’ principle. Lastly, CAI
measures the variability of the codon usage in a gene in respect to the variability of
a reference set of genes and usually provides a reliable index of potential protein
expression levels within a cell.
• Genomic constraints include compositionally heterogeneous G+C domains in
DNA sequences that can provide much insight into biological features such as
horizontal gene transfer (HGT) events, pathogenicity, and antibiotic resistance.
Also, 3D structure of chromosomes is known to regulate many DNA-based
processes including repair, replication, and transcription.
• Metabolic information (the repertoire of metabolic reactions possessed by a
microbe) can be automatically computed starting from genome annotations. Derived
metabolic reconstructions (models) can be exploited for in silico metabolic
modelling and simulation, for example using so called constraints-based methods
(e.g. flux balance analysis, FBA) that are currently widely adopted (mainly because
they do not require detailed information on the chemical equations of the studied
system).
• Phylogenetic information refers to the potential represented by the huge
taxonomic range of sequenced genomes available in public database. More
specifically, it involves the use/integration of pieces of information extrapolated from
closely related organisms to fill knowledge gaps of the microbe(s) under
investigation.
• Epigenomics can be today investigated at single-base and strand resolution and is
gaining a central role since sometimes it can explain phenotypic differences arising
among cells with identical genetic information. DNA methylation state of particular
regions, for example, is linked to chromosomes partitioning, gene expression and
virulence and DNA repair. Unlike eukaryotes, bacteria use DNA adenine
methylations as epigenetic signals (rather than DNA cytosine methylation). Similar
to eukaryotes, however, spatial organization of phenotypes was recently shown to
be controlled and/or regulated by an epigenetic memory effect in bacteria (Kurz et
al., 2013), thus establishing a link between metabolism, ecology and tuning cellular
phenotype. Importantly, links between epigenetic mechanisms and bacterial
pathogenesis/virulence have been established (Casadesus and Low, 2006; Shell et
al., 2013).
. CC-BY-NC-ND 4.0 International licensepeer-reviewed) is the author/funder. It is made available under aThe copyright holder for this preprint (which was not. http://dx.doi.org/10.1101/013532doi: bioRxiv preprint first posted online Jan. 7, 2015;

• Metabolomics provides the metabolic profiling of a given organism in the form of
an instantaneous snapshot of the physiology of that cell. Mapping the outputs
metabolomic technologies onto genome annotations may improve the accuracy of
existing gene models metabolic pathways identification and genomes re-
annotations
• Transcriptomics (generated and measured through high-density tiling microarrays
or transcriptome shotgun sequencing using next generation technology) can yield
an improved description of metabolic processes active in well-defined
environmental conditions, also providing useful functional insights since many
functionally related genes (e.g. belonging to the same metabolic pathway) have
been shown to be co-expressed.
• Proteomics refers to the study of proteins structure, function and abundance at the
whole-cell level. Accordingly, it allows the quantitation of the level of expression of
cellular proteins; also it can shed light onto post-translational modifications [that can
be identified, for example, by surface plasmon resonance (SPR) combined with
Mass Sprectometry (MS), named SPR-MS (Buijs and Franklin, 2005), by
glycoproteomics pipelines (Hitchen and Dell, 2006) or by a plethora of possible
phosphoproteomics approaches (Lin et al., 2010)], protein-protein interaction (PPI,
detected, for example, by means of co-immunoprecipitation. See (Rao et al., 2014)
for a review ) and protein localization (for example studied by immunofluorescence
and fluorescent-protein tagging (Stadler et al., 2013)). PPI data, for example, have
proven valuable for inferring protein function from functions of interaction partners.
Additionally, protein phosphorylation can alter protein functions by changing
structure/function relationship as well as enzymes catalysis/interaction and allowing
a quick adjustment to changing environment.
• Phenomics (high-throughput phenotyping) allows exploring the phenotypic space
of a given organism and deriving phenotype capabilities (e.g. the capability of
metabolizing certain carbon sources in respect to others) in an automated and
large-scale fashion. This is typically performed through Phenotype MicroArrays
(PMs) (Bochner et al., 2001) which uses cellular respiration (i.e. NADH reduction)
and consequent production of a purple colour as a reporter system for overall
metabolic activity.
• Microscopy can provide high quality imaging of microbial life and detailed
knowledge on a number of cellular components, including i) protein expression,
. CC-BY-NC-ND 4.0 International licensepeer-reviewed) is the author/funder. It is made available under aThe copyright holder for this preprint (which was not. http://dx.doi.org/10.1101/013532doi: bioRxiv preprint first posted online Jan. 7, 2015;

localization and interaction (through fluorescence and confocal laser scanning
microscopy), ii) alterations of bacterial cell envelope and interaction between host
and bacterial cells (Transmission and Scanning Electron Microscope, TEM and
SEM, respectively) and iii) detection of single molecules (through super-resolution
microscopy, SRM (Schermelleh et al., 2010; Vogelsang et al., 2010)).
Integration of information layers
To date, many examples of multi-layer studies exist in scientific literature (Fig. 1C), ranging
from simpler integrations (two different –omics datasets) to more comprehensive and
computationally demanding ones (multiple –omics data).
Two layers integration include approaches that combine transcriptomics and
metabolomics (Kromer et al., 2004; Durre, 2007; Yoshida et al., 2008; Depuydt et al.,
2009; Yang et al., 2009; Sana et al., 2010), proteomics and metabolomics (Ma et al.,
2011; Fu et al., 2013) and proteomics and transcriptomics (Huang et al., 2013). These
latter kind of studies, in particular, have shown how gene expression regulation can be
largely decoupled from protein dynamics and how translation efficiency can a have higher
regulatory impact on protein abundance than protein turnover (Jayapal et al., 2008; Maier
et al., 2011). These recent studies suggest a relevant role of post-transcriptional,
translational and degradation regulation in determining cellular protein concentrations and
that they may contribute at least as much as transcription itself (Vogel and Marcotte,
2012).
An interesting two layer integration was recently proposed (Burton et al., 2014) to
reconstruct the individual genomes of microbial species present within a mixed sample
and combining metagenomics with chromatin-level contact probability maps [generated
with the Hi-C method (Lieberman-Aiden et al., 2009)]. By applying this approach to
synthetic metagenomes data, authors succeeded in clustering genome content of fungal,
bacterial, and archaeal species with great accuracy (99% agreement with published
reference genomes)
Other, less exploited integrated approaches, comprise i) the integration of
metatranscriptomics and metagenomics for determining the functional role of each
microorganism in relation to the composition of the microbial community it is inserted into
. CC-BY-NC-ND 4.0 International licensepeer-reviewed) is the author/funder. It is made available under aThe copyright holder for this preprint (which was not. http://dx.doi.org/10.1101/013532doi: bioRxiv preprint first posted online Jan. 7, 2015;

(Shi et al., 2011), ii) the integration of comparative genomics and transcriptomics (Hain
et al., 2012) and iii) the combination of photo-activated localization microscopy and
proteomics (Endesfelder et al., 2013)
Three different information layers (encompassing metabolomics, transcriptomics and
genomics) were combined with metabolic modeling of Mycoplasma pneumoniae (Maier et
al., 2013). Results obtained led the authors to infer a certain rigidity of metabolic pathway
architecture in M. pneumoniae, suggesting that these are regulated as functional units
rather than on the level of individual enzymatic reactions probably allowing a simplification
of metabolic fluxes adjustment (Maier et al., 2013). Deatherage et al. (2013) applied a
combined approach (which included proteomics, metabolomics, glycomics, and
metagenomics) and identified complex metabolic interplay among the intestinal
microbiome including the capability of S. enterica to suppress the growth of Bacteroidetes
and Firmicutes representatives while promoting growth of Salmonella and Enterococcus
ones (Deatherage Kaiser et al., 2013).
Transcriptomics, proteomics and translatomics (the evaluation of mRNAs in polysome
fractions) were combined by Berghoff et al. (2013) in order to evaluate the dynamic and
regulatory features of bacterial oxidative stress responses of the purple bacterium
Rhodobacter sphaeroides, leading to the creation of a multi-layered expression map on
the system level (expressome) (Berghoff et al., 2013). Authors found that, in this case,
translational control appears to exceed simple regulation at the transcriptional level and
that gene positioning might be involved in the tuning of the expression patterns within
inducible operons. Finally, (Perco et al., 2010) recently proposed the integration of several
-omics profiles from similar datasets at the level of PPI, thus including a further level of
information in these kind of studies.
Super-meta approaches (Fig. 2) are the result of these multidimensional integrations,
capable of combining multiple heterogeneous information layers. Also, from these
examples [and (Poblete-Castro et al., 2012; Ansong et al., 2013a; Chang et al., 2013;
Karaosmanoglu et al., 2013; Zhu et al., 2013)] it emerges that multi-omics, same condition,
experiments promise to be crucial in the future of systems microbiology. Indeed, since
complex phenotypes may arise as a result of the action of different biological processes
(e.g. transcription, translation, post-translational modifications and so on) an integrated
multi –omics approach may reveal which of them is (or are) contributing the most to the
observed cellular behaviour.
. CC-BY-NC-ND 4.0 International licensepeer-reviewed) is the author/funder. It is made available under aThe copyright holder for this preprint (which was not. http://dx.doi.org/10.1101/013532doi: bioRxiv preprint first posted online Jan. 7, 2015;

Computational aspects of information layers integration
In large scale, multi-omics studies, the computational resources allocation needed for data
processing and integration quickly outpaces the resource allocation for data generation
(Palsson and Zengler, 2010) and one of the greater efforts resides in analysing the
outcome of a set of experiments in a unified and interactive way.
In a broader sense, integration of different information layers poses (at least) three main
computational challenges, that is i) tracking the different molecular components (i.e. gene,
molecules, enzymes) across different datasets and experiments (Task 1), ii) identifying (or
developing) reliable data normalization procedures and multi-level data analysis (Task 2)
and iii) producing an effective visualization of the results (Task 3).
Task 1. The first task is achieved by linking gene names to codes that are shared across
multiple databases during genome annotation. This is usually done on the basis of
orthology relationships across gene datasets and sequence DBs, although other pieces of
information can provide hints for refining functional classification (gene
structure/organization, see below). COG (Tatusov et al., 2003), KAAS (Moriya et al., 2007)
and GO (Dimmer et al., 2012) are widely adopted tools for functional annotation that allow
the retrieval of gene-centred information during multi-layer study. Similarly, databases
such as ChEBI (Hastings et al., 2013), PubChem (Li et al., 2010) provide unique identifiers
for linking the same compound across multiple datasets or experiments.
Task 2. Concerning the second step (normalization procedures and multi-layer data
analysis), linear regression (Park et al., 2003), central tendency (global normalization)
(Yang et al., 2002) and singular value decomposition (Karpievitch et al., 2009) are widely
adopted techniques to reduce systematic errors in n-high-throughput studies. However,
since different –omics layers may possess characteristic rates of noise, variation or
discrepancies caused by complex molecular mechanisms, accurate normalization
procedures are required when performing statistical analyses over a multi-layer dataset
(Arakawa and Tomita, 2013). The Expression Index (EI), for example, accounts for the
global change within a specific type of cellular component measured by the corresponding
analytical method. Focused statistical analyses on EI values across multi-layer datasets
enable highlighting differences between samples in various perturbation experiments (Ishii
et al., 2007; Arakawa and Tomita, 2013).
. CC-BY-NC-ND 4.0 International licensepeer-reviewed) is the author/funder. It is made available under aThe copyright holder for this preprint (which was not. http://dx.doi.org/10.1101/013532doi: bioRxiv preprint first posted online Jan. 7, 2015;

Tools have been developed to facilitate handling and correlating large and diverse
datasets under the same working environment and allowing measuring a number of
different metrics (like pathway overrepresentation, inter-associations between pathways
and diseases, enrichment analyses) (Zhang and Drabier, 2012; Sun et al., 2013). A list of
currently available computational tools for downstream analysis and biological
interpretation of omics data is presented in Table 1. Although with differences among each
other, these tools allow tracing the relationships existing between different biological
functional levels (e.g. gene expression, metabolism) and their corresponding molecular
components (e.g. genes, metabolites) by integrating results from two (or more) –omics
experiments. MONA is a model-based Bayesian tool for inferring significant associations
across multiple information layers such as mRNA and protein expression profiling as well
as DNA methylation and microRNA regulation (Sass et al., 2013a). Besides providing a
pipeline for data analysis of different high-throughput approaches, MADMAX database
also tackles the issue of data storage in multi-omics experiments (Lin et al., 2011).
CONFERO can store the lists of genes derived from a priori biological knowledge and
integrate them with results from -omics data. Statistics on these multi-level datasets can
then be performed including, for example, functional enrichment analyses. By exploiting a
method called Kriging (typical of geostatistics and machine learning), Omickriking
computes a genomic similarity among the samples using a linear combination of -omics
similarity matrices and predicts the emergence of cellular complex traits through weighted
average of the phenotype of individuals in the training set. VANTED provides a framework
for mapping and integrating experimental data over biochemical networks that are drawn
by the user or downloaded from the KEGG database. NetGestalt is a tool suited for
presenting multi-scale experimental data and facilitating their integration, visualization and
analysis. Each information layer is represented on a separate track but this structure can
be easily turned into a network that can be visualized using the implemented Cytoscape
web plug-in (Shannon et al., 2003). Also, six different methods are available for analysing
data stored in the tracks, such as, for example, the identification of enriched network
modules or enrichment in GO terms or metabolic pathways.
InCroMAP (Wrzodek et al., 2013) currently supports the simultaneous analysis of mRNA,
miRNA (microRNA), DNA methylation and protein (modification) data. By means of a
hypergeometric test InCroMAP is able to assess the significance of the overrepresentation
of predefined gene sets in multiple platforms experiments. Results obtained with this tool
and representing the structured view of the metabolic changes present in a certain
. CC-BY-NC-ND 4.0 International licensepeer-reviewed) is the author/funder. It is made available under aThe copyright holder for this preprint (which was not. http://dx.doi.org/10.1101/013532doi: bioRxiv preprint first posted online Jan. 7, 2015;
experimental condition can be interactively browsed and visualized by means of the
classical KEGG representation scheme.
The R-package (http://www.R-project.org) provides a set of tools for multi-omics
integration. DAnTE, for example, performs statistical and quantitative analyses of different
high-throughput datasets that can be imported in the format of a simple csv file (Polpitiya
et al., 2008). Moreover it provides a graphical front-end for basic data analysis tasks in –
omics disciplines, although being particularly suited for proteomics datasets. Similarly,
IntegrOmics can perform correlation analysis among (-omics) variables measured for the
same sample and provided in the form of two-block data matrices.
A multivariate approach to the integration of multi-omics datasets has been recently
proposed (named MCIA, Multiple Co-Inertia Analysis) (Meng et al., 2014).This method
allows the identification of co-relationships between multiple high dimensional datasets
through an exploratory data analysis method and was shown to fit both heterogeneous
(proteomics and transcriptomics) and homogeneous (microarray and RNAseq based
transcriptomics) datasets. An important characteristic of this tool resides in the fact that,
since it does not rely on genomic feature annotation, it is not limited by the well-known
issue of the incompleteness of present day annotations. Finally, mixOmics provides
statistical integrative techniques [regularized Canonical Correlation Analysis (CCC) and
sparse Partial Least Square, (PLS)] to analyse highly dimensional and heterogeneous
data sets and to unravel relationships them.
Another consequence that stems for the collection of multiple, standardised, highly-
dimensional 'omics' datasets from living organisms resides in the possibility to investigate
causal relationships between genomics differences, phenotypes and -omics datasets in
general. Granger causality has been applied to multi-omics study cases (Walther et al.,
2010; Doerfler et al., 2013) and tools have been developed for identifying cause-effect
relationships between experimental variables in large scale datasets (Table 1).
An alternative strategy may consist in performing multi-layer data integration through a 2
step network approach and in considering, from a statistical perspective, the -omics data
point as a huge space of causal models. Indeed, multiple -omics data sets can be
represented in the form of a multiple-weighted network where vertex and vertex weights
represent –omics data whereas data regarding functional or physical interactions between
components are represented as edges and edge weights. Multi Objective (MO)
. CC-BY-NC-ND 4.0 International licensepeer-reviewed) is the author/funder. It is made available under aThe copyright holder for this preprint (which was not. http://dx.doi.org/10.1101/013532doi: bioRxiv preprint first posted online Jan. 7, 2015;

optimisation could be then used to find networks that are optimal according to several
criteria, corresponding to desired phenotypes. These criteria can be implemented as
functions of the biological data. For example, these functions (objective functions) can be
defined to calculate overrepresentation analysis statistics among datasets. Optimisation
quality indicators, such as the hyper volume, are used to establish comparisons among
different runs of MO optimisation. Important directions of methodological development will
be the multi parameter evidence synthesis and methods for causality inference based on
extensions of sparse instrumental variable approaches (Forbes and Griffiths, 2002; Carlo
Berzuini, 2012).
Task 3. ,Finally, when analysing different layers of information, it is useful to produce an
integrated view of the obtained results and represent quantitative data of the complete
cascade from genotype to phenotype for individual organisms. Available methods (see
(Gehlenborg et al., 2010) for an exhaustive review) can be roughly divided in i) tools for
automated, network-oriented representation and analysis of large biological datasets and
ii) tools focused on assembly and curation of pathways. Network visualization is often
adopted in this context since it is effective in representing diverse (cellular) components
and the interactions existing among them and providing intuitive interpretation of multi-
layer data. Cytoscape is probably the most popular tool for visualizing biological networks.
Through a large set of plugins it permits specific analyses and different combinations of –
omics integration also allowing researchers to map multiple omics datasets over the same
cellular components network (Table 1).
Mapping heterogeneous –omics data using customized metabolic pathway maps is also a
common practice and a large plethora of alternatives are currently available (Table 1). The
Pathway Tools offers an overview diagram of the biochemical networks and pathways of
an organism including the possibility to combine and represent gene expression and
metabolomics measurements over it (Paley and Karp, 2006). The web-based ProMeTra
visualizes and integrates datasets from several –omics datasets on user defined metabolic
pathway maps (Neuweger et al., 2009). Similarly, Paintomics is able to derive lists of
significant gene or metabolite changes from transcriptomics and metabolomics data and
paint this information on KEGG-derived metabolic maps (Garcia-Alcalde et al., 2011).
3Omics software is a web based tool able to perform inter-omics correlation analyses and
to visualize relationships in data with respect to time, experimental conditions and data
. CC-BY-NC-ND 4.0 International licensepeer-reviewed) is the author/funder. It is made available under aThe copyright holder for this preprint (which was not. http://dx.doi.org/10.1101/013532doi: bioRxiv preprint first posted online Jan. 7, 2015;

types (Kuo et al., 2013). Experimental data for metabolites, genes and pathways can be
combined and integrated in the context of relevant metabolic networks with the software
Metscape (Karnovsky et al., 2012). Finally, MAYDAY is an application for analysis and
visualization of general -omics data and providing functional insights with the possibility to
combine gene expression, metabolomes and biosynthetic pathways and visualize results
as differentially coloured pathway diagrams (Battke et al., 2010).
Metabolic modelling
Given the link existing between phenotypic features of a given microbe and its underlying
metabolism, in this part of the review we provide a general overview of the major steps
and checkpoints encountered when reconstructing the metabolic network of a given
organism and in its consequent exploitation for computational simulation and/or phenotype
prediction (Fig. 3). We will here focus on stoichiometric rather than kinetic modelling. A
kinetic reaction network consists of biochemical reactions that can be traditionally
described by ordinary or partial differential equations (ODEs and PDEs, respectively)
(Tomar and De, 2013). The application of kinetic models, however, is limited to small (well
characterized) biochemical systems since many intracellular experimental measurements
are needed in this modelling framework. Conversely, stoichiometric (constraints based)
modelling can be applied to larger (genome scale) biochemical systems since it requires
only the information on metabolic reactions stoichiometry and mass balances around the
metabolites under pseudo-steady state assumption (Oberhardt et al., 2009).
Interestingly, global-scale properties of metabolic networks have been inferred using
network modelling techniques. These include, for example, the emergence of bow-tie
structures (Friedlander, 2014), latent versatility and carbon efficiency (Bardoscia, 2014),
robustness and plasticity of metabolic pathways (Berger et al., 2014), identification of
synthetic lethal reaction sets in metabolic networks, essential plasticity and redundancy of
metabolism (Guell et al., 2014). The application of metabolic modelling approaches seems
promising also in the context of the emerging issue of antibiotic resistance, as it has been
shown that specific metabolic traits are crucial for the persistence of multi-drug resistant
microbial sub-populations [the so-called persisters, (Prax and Bertram, 2014)]. Finally, as
new genomes from the same taxonomic unit (e.g. bacterial species) are being released,
comparative metabolic modelling approaches are being exploited for studying the
. CC-BY-NC-ND 4.0 International licensepeer-reviewed) is the author/funder. It is made available under aThe copyright holder for this preprint (which was not. http://dx.doi.org/10.1101/013532doi: bioRxiv preprint first posted online Jan. 7, 2015;

correlation between unique strain-specific metabolic capabilities and their corresponding
pathotypes and/or environmental niches (Monk et al., 2013).
Currently available computational tools for in silico metabolic modelling have been recently
reviewed in (Copeland et al., 2012; Moura et al., 2013) and will not be covered here.
A metabolic modelling pipeline
The input of a common metabolic modelling flowchart is usually a (complete or draft)
genome sequence (generally referred to as “NGS” in Fig. 3A). Publically available
resources exist for automatically generating draft metabolic reconstructions (see
Supporting Information 2). Draft metabolic models usually require extensive gap-filling for
the identification of metabolic functions that have not been identified during preliminary
reconstruction step; this can usually be performed using comparative genomics
approaches using highly curated models of (more or less distantly) related microorganisms
(see next section). Once gaps have been correctly identified and filled, a first comparison
between phenotypes prediction capabilities of the model and experimental data (i.e.
experimentally validated growth rates) can be performed (Fig. 3B). Initial reconstruction
usually fails in correctly identifying all the metabolic capabilities, and extensive model
refinement is required for reconciling model predictions with phenotypic data (e.g. Biolog
data, Fig. 3C). When a fitting is found between experimental data and in silico predictions,
well-grounded computational simulation can start (Fig. 3D), according to the biological
rationale of the overall metabolic modelling project [e.g. optimisation of biomass production
and overproduction of a given compound using, for example, Pareto optimality and multi-
objective functions (Angione et al., 2013; Sengupta et al., 2013)]. Outcomes of
computational simulations typically require experimental validation; in case this is
achieved, the reconstruction process can generally be considered terminated and the
model can be used for further in silico analyses (e.g. knockouts simulation, robustness
analysis, changes in growth medium composition, etc.) or to suggest further wet-lab
experiments. Importantly, a working metabolic model can be used for the refinement of
other metabolic models (possibly from closely related microorganisms), thus connecting
the end of the pipeline with the beginning stages of reconstruction of other organisms (i.e.
C and A boxes of Fig. 3).
Finally, in case no agreement is found or a greater accuracy is required, in this final stage
additional (experimental) data (typically -omics data, “-omics box” in Fig. 3D) should be
. CC-BY-NC-ND 4.0 International licensepeer-reviewed) is the author/funder. It is made available under aThe copyright holder for this preprint (which was not. http://dx.doi.org/10.1101/013532doi: bioRxiv preprint first posted online Jan. 7, 2015;

produced in order to integrate, fix and expand the reconstructed model. This integration is
also useful when a given (metabolic) phenotype cannot be explained relying exclusively
the metabolic information layer.
Which -omics information could improve metabolic modelling?
Despite fine-scale cellular features - such as molecular crowding (Beg et al., 2007) and
macromolecular synthesis (Thiele et al., 2012) - can be accounted for by metabolic
modelling, –omics-derived data is often used to assist and improve metabolic model
predictions and to provide a system-level understanding of the cellular behaviour (in Fig.
3D).
Comparative genomics/taxonomy between multiple organisms can be exploited during
metabolic reconstructions especially when gap-filling a newly reconstructed model or when
trying to include novel reactions into it. Indeed, as each metabolic reconstruction is a
reflection of the genetic content of the respective organism, the identification of the
overlaps between the genomic content of the organisms for which a metabolic
reconstruction is available can help understanding which reaction should be
added/removed to/from a network. The refinement of the metabolic models from two
Pseudomonas representatives is an example such an approach (Oberhardt et al., 2011).
Full comparative analysis of their genome-scale metabolic reconstructions has led, in this
case, to the identification of differences in their virulence mechanisms and in their
metabolic features that, in turn, may be of help for future metabolic engineering
application.
Transcriptomics is one of the most exploited layers for improving or correcting metabolic
predictions. By exploiting gene expression data, genome scale metabolic networks can be
turned into condition specific models in which only those reactions corresponding to
expressed genes will be present and active [see for example (Fondi et al., 2014)]. In
practice, this corresponds to respectively “turn on” or “turn off” those reactions whose
corresponding genes are up- or down-regulated in vivo, when running the in silico
simulation.
When mapping gene expression data onto metabolic models, data derived from multi-
condition, single platform –omics studies are of value, in that results from every single
experiment can be easily compared with those from the other replicates (Faith et al., 2007;
Colijn et al., 2009). In some cases, such approach has been shown to provide a realistic
. CC-BY-NC-ND 4.0 International licensepeer-reviewed) is the author/funder. It is made available under aThe copyright holder for this preprint (which was not. http://dx.doi.org/10.1101/013532doi: bioRxiv preprint first posted online Jan. 7, 2015;

picture of the actual metabolic state of a microbial cell and to lead to a deeper
understanding of its basic functioning, including the consequences of environmental
perturbations such as gene knock-outs and/or growth medium manipulation.
Similarly, under the assumption that protein abundance changes correlate to changes in
metabolic fluxes, quantitative proteomics data can be used for deriving condition-specific
metabolic models.
Relative proteomics (and transcriptomics) data can be useful for studying system-level
changes of the metabolism following an external perturbation (e.g. changes in growth
temperature, medium, pH, etc.). In a recent work, for example, we have mapped protein
abundance data onto the newly reconstructed metabolic model of the Antarctic bacterium
Pseudoalteromonas haloplanktis TAC125 (Fondi et al., 2014). This has led to the
identification of biologically consistent metabolic adjustments caused by cold shock-
dependent changes in protein expression. Similarly, metabolic network modelling and
proteome data were combined in (Tong et al., 2013) to explore the metabolic
consequences of a downshift in culture temperature in the anaerobic thermophilic
bacterium Thermoanaerobacter tengcongensis and to decipher the effect of proteome
change on the bacterial growth under perturbation.
Absolute quantitation of protein abundance, instead, can be used for de novo drafting of
metabolic models(Thomas et al., 2014; Vanee et al., 2014). Indeed, the use of high-
throughput proteomics data as a starting point proved to be the most accurate in
resembling in vivo growth conditions (Vanee et al., 2014).
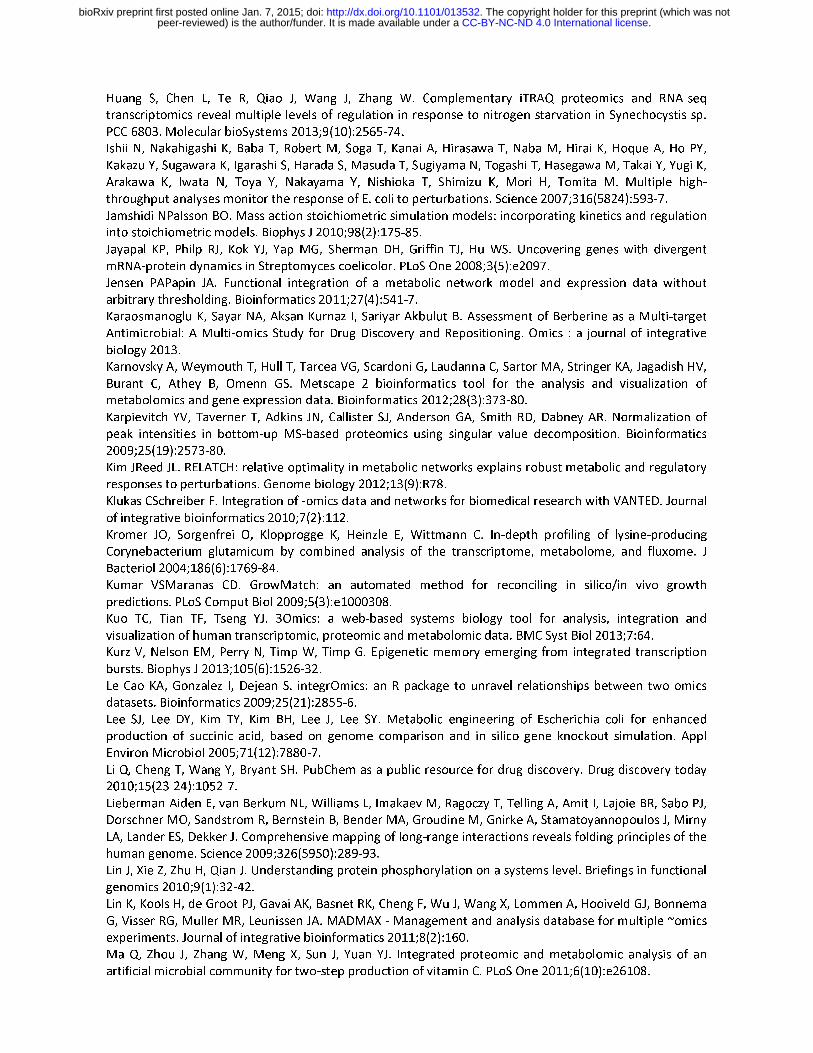
Several methods are today available for integrating gene expression with (constraints-
based) modelling (see Table 1 and (Blazier and Papin, 2012)). GIMME and iMAT
maximise the flux across those reactions whose genes display high mRNA levels and
minimise those of reactions associated with low mRNA levels according to a user-supplied
expression threshold. MADE does not require an a priori threshold on expression levels,
relying on multiple expression datasets to account for differential expression and constraint
fluxes across model reactions. Unlike the above-mentioned approaches, E-FLUX provides
more physiologically consistent solutions since it does not convert expression levels to
binary states (active or inactive reactions). Besides constraints based modelling and
expression data, PROM allows integrating pre-compiled transcription regulatory networks.
GX-FBA combines hierarchical regulation imposed by gene-expression with the constraint
. CC-BY-NC-ND 4.0 International licensepeer-reviewed) is the author/funder. It is made available under aThe copyright holder for this preprint (which was not. http://dx.doi.org/10.1101/013532doi: bioRxiv preprint first posted online Jan. 7, 2015;

of metabolic reaction connectivity and using information on mRNA levels to guide
hierarchical regulation of metabolism subject to the interconnectivity of the metabolic
network. Finally, RELATCH takes advantage of the concept of relative optimality (based
on relative flux changes with respect to a reference flux distribution) and uses flux and
gene expression data to predict metabolic responses in a genetically or environmentally
perturbed state. Remarkably, the application of all these methods may be hampered by
the observation that, in some cases, mRNA transcript levels do not correlate with protein
levels (Gygi et al., 1999; Nie et al., 2006). In those cases, other information layers (e.g.
post-translational modifications, post-transcriptional regulation) may explain this
discrepancy and, in turn, their integration during metabolic modelling procedures might
provide more realistic insights and/or predictive capability. A systematic evaluation of the
available methods for integrating transcriptomics data into constraint-based models of
metabolism has been recently performed (Machado and Herrgard, 2014), revealing that
none of the methods outperforms the others for all the tested conditions. Also, in most
cases, the predictions obtained by simple FBA using growth maximization and parsimony
[i.e. assuming that the cell attempts to achieve its objective while allocating the minimum
amount of resources (Machado and Herrgard, 2014)] criteria still represents a preferable
choice for a realistic picture of the metabolic landscape of the organism under study.
Stoichiometric network modelling can be integrated with in vivo measurements of
metabolic fluxes to determine the absolute flux through large networks of the carbon
metabolism, using FBA, 13C fluxomics or 13C-constrained FBA approaches (Winter and
Kromer, 2013). Directly comparing the result of an in silico simulation with isotopologue
data, for example, can help in addressing which of the predicted metabolic fluxes is real
and how far its value is from the in vivo measurements. Alternatively, 13C-based metabolic
flux analysis (13C-MFA) can be formulated as an inverse problem to compute a set of
fluxes that leads to the best match of the experimentally measured fluxes.
For example, a 13C-MFA network model was generated for E. coli revealing the reliability
of this integrated approach to predict and measure the operation and regulation of
metabolic networks (Chen et al., 2011). Similarly, by applying 13C metabolic flux analysis
and in silico FBA, insights into xylose metabolism in S. cerevisiae were obtained, including
futile pathways and the link between high cell maintenance energy and xylose utilization
(Feng and Zhao, 2013).
. CC-BY-NC-ND 4.0 International licensepeer-reviewed) is the author/funder. It is made available under aThe copyright holder for this preprint (which was not. http://dx.doi.org/10.1101/013532doi: bioRxiv preprint first posted online Jan. 7, 2015;

A hypothesis-driven algorithm for the integration of transcriptomics and metabolomics data
with metabolic network topology was originally developed and its application to the
metabolic network of Saccharomyces cerevisiae showed the feasibility of inferring whether
biochemical reactions within a cell are hierarchically or metabolically regulated (Cakir et
al., 2006). A novel method (IOMA) has been developed to quantitatively integrate
proteomic and metabolomic data with genome-scale metabolic models using a
mechanistic model for determining reaction rate (Yizhak et al., 2010). The integration of
such sources of information has led to achieve a greater accuracy in predicting the
metabolic state of E. coli under different gene knockouts in respect to other methods (i.e.
FBA and MOMA, Minimization Of Metabolic Adjustment).
In silico modelling growth predictions on defined media can be easily compared with
Biolog substrate utilization data (phenomics). This is typically achieved by (qualitatively)
comparing the estimated flux value across biomass assembly reaction of the model with
the activity directly measured during phenotype microarray experiment. In other words,
growth predictions on a given sole carbon source (either growth or no growth) are
compared against the outcome of a large scale phenotype profiling experiment and in case
no agreement is found some reconciliation steps are usually necessary. These include, for
example, the inclusion of a transport reaction for a specific tested compound (for which
disagreement of in silico and in vivo data is observed) or the inclusion of previously
missing metabolic reactions (gap-filling).
This comparison usually speeds up the identification of missing transport reactions and/or
metabolic gaps in the model and, in some cases, can give essential functional insights
concerning unknown genes. A number of currently available metabolic reconstructions
have been validated adopting such approach, including models of Burkholderia
cenocepacia J2315 (Fang et al., 2011), Acinetobacter baylyi ADP1 (Durot et al., 2008),
Bacillus subtilis (Oh et al., 2007). Most of the metabolic reconstructions that are currently
available display accuracy values ranging from 75% up to more than 95% when their
growth predictions are compared against phenotype microarrays growth data.
A list of available computational tools for integrating –omics datasets and metabolic
models is reported in Table 2.
What is missing in metabolic reconstruction?
. CC-BY-NC-ND 4.0 International licensepeer-reviewed) is the author/funder. It is made available under aThe copyright holder for this preprint (which was not. http://dx.doi.org/10.1101/013532doi: bioRxiv preprint first posted online Jan. 7, 2015;
Currently, about 4000 complete genome sequences are available in public databases
(www.genomesonline.org); conversely, only around 100 reconstructions of microbial
metabolic systems can be retrieved (see
http://systemsbiology.ucsd.edu/InSilicoOrganisms/OtherOrganisms for an updated list).
This gap is the most evident consequence of the difficulties in reconstructing “working”
metabolic models starting from genome annotations and speeding up this process is a key
challenge for future systems microbiology (Fig. 2).
Also, the sketchiness of present-day metabolic models is an important point that needs
consideration. Indeed, even in the case of model organisms, reconstructions rarely
account for any more than roughly 25% of their genes, leading to an underestimation of
their real metabolic capabilities of the strain under study. However, in some cases, such
an apparently small fraction of genes embedded in metabolic reconstructions may indeed
represent the majority of the metabolic genes that are actually expressed during normal
growth. This is the case, for example, of the Antarctic bacterium Pseudoalteromonas
haloplanktis TAC125, whose metabolic reconstruction embeds around 97% of the
metabolic genes actually expressed during exponential phase (Fondi et al., 2014).
Since metabolic reconstructions are usually homology-based, classic metabolic
reconstructions fail in identifying characteristic metabolic feature and/or pathways of
microorganisms that are phylogenetically and/or functionally different from well-
characterized ones. -omics integration strategies that we have illustrated in previous
sections are a promising approach in this context, since the combination of heterogeneous
information layers may contribute to identify and properly fill metabolic gaps left in
reconstructions derived from sequence-based annotations. In this context, it is to be noted
that software for exploiting –omics information during constraints-based modelling are
mostly focused on the integration of transcriptomics (expression) data (Table 2).
Accordingly, more effort is needed in the future to allow including other –omics datasets
(e.g. proteomics, metabolomics etc.) when modelling microbial metabolism. Nevertheless,
experiments with fine scale observation (e.g. single knock-out mutants) are usually
decisive in providing a robust answer to knowledge gaps in homology-based reconstructed
metabolic models.
. CC-BY-NC-ND 4.0 International licensepeer-reviewed) is the author/funder. It is made available under aThe copyright holder for this preprint (which was not. http://dx.doi.org/10.1101/013532doi: bioRxiv preprint first posted online Jan. 7, 2015;

Finally, taxonomic information is another, still not fully exploited, resource in metabolic
reconstruction and very few works describe possible approaches for merging information
from models of two (or more) close organisms. Nevertheless as the number of available
and, most importantly, highly curated and experimentally validated metabolic models will
increase and span over a larger phylogenetic range, this resource is expected to gain an
important role. This is also relevant for experimental design and strains selection,
providing insights into the issue of which species/genera should be sequenced with higher
priority in order to increase the coverage of available metabolic information, Some works
have tried quantifying the increase in information content when adding novel genomes to a
given dataset and, importantly, the influence of phylogenetic distance among species in
guiding this choice (“where to add taxa”) (Eddy, 2005; McAuliffe et al., 2005; Pardi and
Goldman, 2005; Geuten et al., 2007). Similar approaches may thus be useful in the
context of microbial metabolic biodiversity exploration, leading, for example, to the
identification of novel, biotechnologically relevant pathways. Indeed, we underline that a
thorough exploration of metabolic diversity may be obtained integrating taxonomic and
metabolic information, guiding strains selection for more focused downstream post-
genomics analyses.
Conclusions
Many possible pathways link genotype and phenotypes, being represented by distinct
functional states of cellular components (genes, metabolites, DNA methylation states,
proteins). In an ideal future scenario, most of the information layers herein described and
accounting for those functional states will be known for a given bacterium in different
environmental conditions. In this situation, computational biology will be able to guide in
silico reverse engineering and trace back the optimal path towards the desired microbial
phenotype(s).
In this work we have reviewed some of these information layers and their growing
exploitation in present-day microbiology research due to the spreading of massive –omics
technologies. Each of them is bringing valuable insights into the comprehension of cellular
architecture and functioning. Nevertheless, mounting evidences suggest that it is the
integration of these large, multi-scale datasets that will bring alternative perspectives to our
current view of microbial cell organization and possibilities for explain the emergence of
. CC-BY-NC-ND 4.0 International licensepeer-reviewed) is the author/funder. It is made available under aThe copyright holder for this preprint (which was not. http://dx.doi.org/10.1101/013532doi: bioRxiv preprint first posted online Jan. 7, 2015;
complex phenotypes. Also, connections among biological features that were previously
thought to be unrelated (e.g. epigenetics and pathogenicity) are being discovered following
this path. The capability of integrating and combining multi –omics data with metabolic
modelling techniques is expected to provide even more accurate and realistic predictions
of cellular metabolism in those cases in which, for example, metabolic activity is decoupled
from expression of the corresponding genes. In this context, genetic constraints (e.g. CAI)
and epigenetics mechanisms (e.g. DNA methylation, post-translational modifications)
represent still unexploited layers in metabolic modelling and a challenge for future in silico
simulations.
References
Angione C, Carapezza G, Costanza J, Lio P, Nicosia G. Pareto Optimality in Organelle Energy Metabolism
Analysis. IEEE/ACM transactions on computational biology and bioinformatics / IEEE, ACM 2013.
Angiuoli SV, Gussman A, Klimke W, Cochrane G, Field D, Garrity G, Kodira CD, Kyrpides N, Madupu R,
Markowitz V, Tatusova T, Thomson N, White O. Toward an online repository of Standard Operating
Procedures (SOPs) for (meta)genomic annotation. Omics 2008;12(2):137-41.
Ansong C, Schrimpe-Rutledge AC, Mitchell HD, Chauhan S, Jones MB, Kim YM, McAteer K, Deatherage
Kaiser BL, Dubois JL, Brewer HM, Frank BC, McDermott JE, Metz TO, Peterson SN, Smith RD, Motin VL,
Adkins JN. A multi-omic systems approach to elucidating Yersinia virulence mechanisms. Molecular
bioSystems 2013a;9(1):44-54.
Ansong C, Deatherage BL, Hyduke D, Schmidt B, McDermott JE, Jones MB, Chauhan S, Charusanti P, Kim
YM, Nakayasu ES, Li J, Kidwai A, Niemann G, Brown RN, Metz TO, McAteer K, Heffron F, Peterson SN, Motin
V, Palsson BO, Smith RD, Adkins JN. Studying Salmonellae and Yersiniae host-pathogen interactions using
integrated 'omics and modeling. Current topics in microbiology and immunology 2013b;363:21-41.
Arakawa KTomita M. Merging multiple omics datasets in silico: statistical analyses and data interpretation.
Methods in molecular biology 2013;985:459-70.
Aziz RK, Bartels D, Best AA, DeJongh M, Disz T, Edwards RA, Formsma K, Gerdes S, Glass EM, Kubal M,
Meyer F, Olsen GJ, Olson R, Osterman AL, Overbeek RA, McNeil LK, Paarmann D, Paczian T, Parrello B,
Pusch GD, Reich C, Stevens R, Vassieva O, Vonstein V, Wilke A, Zagnitko O. The RAST Server: rapid
annotations using subsystems technology. BMC Genomics 2008;9:75.
Bardoscia MM, M. Samal, A. Phenotypic constraints promote latent versatility and carbon efficiency in
metabolic networks. 2014.
Battke F, Symons S, Nieselt K. Mayday--integrative analytics for expression data. BMC Bioinformatics
2010;11:121.
Beg QK, Vazquez A, Ernst J, de Menezes MA, Bar-Joseph Z, Barabasi AL, Oltvai ZN. Intracellular crowding
defines the mode and sequence of substrate uptake by Escherichia coli and constrains its metabolic activity.
Proceedings of the National Academy of Sciences of the United States of America 2007;104(31):12663-8.
Beloqui A, de Maria PD, Golyshin PN, Ferrer M. Recent trends in industrial microbiology. Current opinion in
microbiology 2008;11(3):240-8.
Berger A, Dohnt K, Tielen P, Jahn D, Becker J, Wittmann C. Robustness and plasticity of metabolic pathway
flux among uropathogenic isolates of Pseudomonas aeruginosa. PLoS One 2014;9(4):e88368.
Berghoff BA, Konzer A, Mank NN, Looso M, Rische T, Forstner KU, Kruger M, Klug G. Integrative "omics"-
approach discovers dynamic and regulatory features of bacterial stress responses. PLoS genetics
2013;9(6):e1003576.
. CC-BY-NC-ND 4.0 International licensepeer-reviewed) is the author/funder. It is made available under aThe copyright holder for this preprint (which was not. http://dx.doi.org/10.1101/013532doi: bioRxiv preprint first posted online Jan. 7, 2015;

Blazier ASPapin JA. Integration of expression data in genome-scale metabolic network reconstructions.
Front Physiol 2012;3:299.
Bochner BR, Gadzinski P, Panomitros E. Phenotype microarrays for high-throughput phenotypic testing and
assay of gene function. Genome research 2001;11(7):1246-55.
Buijs JFranklin GC. SPR-MS in functional proteomics. Brief Funct Genomic Proteomic 2005;4(1):39-47.
Burton JN, Liachko I, Dunham MJ, Shendure J. Species-Level Deconvolution of Metagenome Assemblies
with Hi-C-Based Contact Probability Maps. G3 2014.
Cakir T, Patil KR, Onsan Z, Ulgen KO, Kirdar B, Nielsen J. Integration of metabolome data with metabolic
networks reveals reporter reactions. Mol Syst Biol 2006;2:50.
Camilo E, Bovolenta LA, Acencio ML, Rybarczyk-Filho JL, Castro MA, Moreira JC, Lemke N. GALANT: a
Cytoscape plugin for visualizing data as functional landscapes projected onto biological networks.
Bioinformatics 2013;29(19):2505-6.
Carlo Berzuini PD, Luisa Bernardinelli, 2012. Causality: Statistical Perspectives and Applications, John Wiley
& Sons, Ltd.
Casadesus JLow D. Epigenetic gene regulation in the bacterial world. Microbiol Mol Biol Rev
2006;70(3):830-56.
Chandrasekaran SPrice ND. Probabilistic integrative modeling of genome-scale metabolic and regulatory
networks in Escherichia coli and Mycobacterium tuberculosis. Proceedings of the National Academy of
Sciences of the United States of America 2010;107(41):17845-50.
Chang C, Li L, Zhang C, Wu S, Guo K, Zi J, Chen Z, Jiang J, Ma J, Yu Q, Fan F, Qin P, Han M, Su N, Chen T,
Wang K, Zhai L, Zhang T, Ying W, Xu Z, Zhang Y, Liu Y, Liu X, Zhong F, Shen H, Wang Q, Hou G, Zhao H, Li G,
Liu S, Gu W, Wang G, Wang T, Zhang G, Qian X, Li N, He QY, Lin L, Yang P, Zhu Y, He F, Xu P. Systematic
analyses of the transcriptome, translatome, and proteome provide a global view and potential strategy for
the C-HPP. J Proteome Res 2013.
Chen X, Alonso AP, Allen DK, Reed JL, Shachar-Hill Y. Synergy between (13)C-metabolic flux analysis and flux
balance analysis for understanding metabolic adaptation to anaerobiosis in E. coli. Metab Eng
2011;13(1):38-48.
Colijn C, Brandes A, Zucker J, Lun DS, Weiner B, Farhat MR, Cheng TY, Moody DB, Murray M, Galagan JE.
Interpreting expression data with metabolic flux models: predicting Mycobacterium tuberculosis mycolic
acid production. PLoS Comput Biol 2009;5(8):e1000489.
Copeland WB, Bartley BA, Chandran D, Galdzicki M, Kim KH, Sleight SC, Maranas CD, Sauro HM.
Computational tools for metabolic engineering. Metab Eng 2012;14(3):270-80.
Deatherage Kaiser BL, Li J, Sanford JA, Kim YM, Kronewitter SR, Jones MB, Peterson CT, Peterson SN, Frank
BC, Purvine SO, Brown JN, Metz TO, Smith RD, Heffron F, Adkins JN. A Multi-Omic View of Host-Pathogen-
Commensal Interplay in -Mediated Intestinal Infection. PLoS One 2013;8(6):e67155.
Depuydt S, Trenkamp S, Fernie AR, Elftieh S, Renou JP, Vuylsteke M, Holsters M, Vereecke D. An integrated
genomics approach to define niche establishment by Rhodococcus fascians. Plant Physiol
2009;149(3):1366-86.
Dimmer EC, Huntley RP, Alam-Faruque Y, Sawford T, O'Donovan C, Martin MJ, Bely B, Browne P, Mun Chan
W, Eberhardt R, Gardner M, Laiho K, Legge D, Magrane M, Pichler K, Poggioli D, Sehra H, Auchincloss A,
Axelsen K, Blatter MC, Boutet E, Braconi-Quintaje S, Breuza L, Bridge A, Coudert E, Estreicher A, Famiglietti
L, Ferro-Rojas S, Feuermann M, Gos A, Gruaz-Gumowski N, Hinz U, Hulo C, James J, Jimenez S, Jungo F,
Keller G, Lemercier P, Lieberherr D, Masson P, Moinat M, Pedruzzi I, Poux S, Rivoire C, Roechert B,
Schneider M, Stutz A, Sundaram S, Tognolli M, Bougueleret L, Argoud-Puy G, Cusin I, Duek-Roggli P,
Xenarios I, Apweiler R. The UniProt-GO Annotation database in 2011. Nucleic acids research
2012;40(Database issue):D565-70.
Doerfler H, Lyon D, Nagele T, Sun X, Fragner L, Hadacek F, Egelhofer V, Weckwerth W. Granger causality in
integrated GC-MS and LC-MS metabolomics data reveals the interface of primary and secondary
metabolism. Metabolomics : Official journal of the Metabolomic Society 2013;9(3):564-574.
Durot M, Bourguignon PY, Schachter V. Genome-scale models of bacterial metabolism: reconstruction and
applications. FEMS microbiology reviews 2009;33(1):164-90.
. CC-BY-NC-ND 4.0 International licensepeer-reviewed) is the author/funder. It is made available under aThe copyright holder for this preprint (which was not. http://dx.doi.org/10.1101/013532doi: bioRxiv preprint first posted online Jan. 7, 2015;

Durot M, Le Fevre F, de Berardinis V, Kreimeyer A, Vallenet D, Combe C, Smidtas S, Salanoubat M,
Weissenbach J, Schachter V. Iterative reconstruction of a global metabolic model of Acinetobacter baylyi
ADP1 using high-throughput growth phenotype and gene essentiality data. BMC Syst Biol 2008;2:85.
Durre P. Biobutanol: an attractive biofuel. Biotechnology journal 2007;2(12):1525-34.
Eddy SR. A model of the statistical power of comparative genome sequence analysis. PLoS biology
2005;3(1):e10.
Endesfelder U, Finan K, Holden SJ, Cook PR, Kapanidis AN, Heilemann M. Multiscale spatial organization of
RNA polymerase in Escherichia coli. Biophys J 2013;105(1):172-81.
Enright AJ, Iliopoulos I, Kyrpides NC, Ouzounis CA. Protein interaction maps for complete genomes based
on gene fusion events. Nature 1999;402(6757):86-90.
Faith JJ, Hayete B, Thaden JT, Mogno I, Wierzbowski J, Cottarel G, Kasif S, Collins JJ, Gardner TS. Large-scale
mapping and validation of Escherichia coli transcriptional regulation from a compendium of expression
profiles. PLoS biology 2007;5(1):e8.
Fang K, Zhao H, Sun C, Lam CM, Chang S, Zhang K, Panda G, Godinho M, Martins dos Santos VA, Wang J.
Exploring the metabolic network of the epidemic pathogen Burkholderia cenocepacia J2315 via genome-
scale reconstruction. BMC Syst Biol 2011;5:83.
Feng XZhao H. Investigating xylose metabolism in recombinant Saccharomyces cerevisiae via 13C metabolic
flux analysis. Microbial cell factories 2013;12(1):114.
Fondi M, Maida I, Perrin E, Mellera A, Mocali S, Parrilli E, Tutino ML, Lio P, Fani R. Genome-scale metabolic
reconstruction and constraint-based modelling of the Antarctic bacterium Pseudoalteromonas haloplanktis
TAC125. Environ Microbiol 2014.
Forbes AGriffiths P. Methodological strategies for the identification and synthesis of 'evidence' to support
decision-making in relation to complex healthcare systems and practices. Nursing inquiry 2002;9(3):141-55.
Friedlander TM, A. E. Tlusty, T. Alon , T. Evolution of bow-tie architectures in biology. 2014.
Fu F, Cheng VW, Wu Y, Tang Y, Weiner JH, Li L. Comparative Proteomic and Metabolomic Analysis of
Staphylococcus warneri SG1 Cultured in the Presence and Absence of Butanol. J Proteome Res 2013.
Garcia-Alcalde F, Garcia-Lopez F, Dopazo J, Conesa A. Paintomics: a web based tool for the joint
visualization of transcriptomics and metabolomics data. Bioinformatics 2011;27(1):137-9.
Garcia-Ochoa F, Santos VE, Casas JA, Gomez E. Xanthan gum: production, recovery, and properties.
Biotechnology advances 2000;18(7):549-79.
Gehlenborg N, O'Donoghue SI, Baliga NS, Goesmann A, Hibbs MA, Kitano H, Kohlbacher O, Neuweger H,
Schneider R, Tenenbaum D, Gavin AC. Visualization of omics data for systems biology. Nature methods
2010;7(3 Suppl):S56-68.
George HA, Johnson JL, Moore WE, Holdeman LV, Chen JS. Acetone, Isopropanol, and Butanol Production
by Clostridium beijerinckii (syn. Clostridium butylicum) and Clostridium aurantibutyricum. Appl Environ
Microbiol 1983;45(3):1160-3.
Geuten K, Massingham T, Darius P, Smets E, Goldman N. Experimental design criteria in phylogenetics:
where to add taxa. Syst Biol 2007;56(4):609-22.
Guell O, Sagues F, Serrano MA. Essential plasticity and redundancy of metabolism unveiled by synthetic
lethality analysis. PLoS Comput Biol 2014;10(5):e1003637.
Gygi SP, Rochon Y, Franza BR, Aebersold R. Correlation between protein and mRNA abundance in yeast.
Molecular and cellular biology 1999;19(3):1720-30.
Hain T, Ghai R, Billion A, Kuenne CT, Steinweg C, Izar B, Mohamed W, Mraheil MA, Domann E, Schaffrath S,
Karst U, Goesmann A, Oehm S, Puhler A, Merkl R, Vorwerk S, Glaser P, Garrido P, Rusniok C, Buchrieser C,
Goebel W, Chakraborty T. Comparative genomics and transcriptomics of lineages I, II, and III strains of
Listeria monocytogenes. BMC Genomics 2012;13:144.
Hastings J, de Matos P, Dekker A, Ennis M, Harsha B, Kale N, Muthukrishnan V, Owen G, Turner S, Williams
M, Steinbeck C. The ChEBI reference database and ontology for biologically relevant chemistry:
enhancements for 2013. Nucleic acids research 2013;41(Database issue):D456-63.
Hermida L, Poussin C, Stadler MB, Gubian S, Sewer A, Gaidatzis D, Hotz HR, Martin F, Belcastro V, Cano S,
Peitsch MC, Hoeng J. Confero: an integrated contrast data and gene set platform for computational analysis
and biological interpretation of omics data. BMC Genomics 2013;14:514.
Hitchen PGDell A. Bacterial glycoproteomics. Microbiology 2006;152(Pt 6):1575-80.
. CC-BY-NC-ND 4.0 International licensepeer-reviewed) is the author/funder. It is made available under aThe copyright holder for this preprint (which was not. http://dx.doi.org/10.1101/013532doi: bioRxiv preprint first posted online Jan. 7, 2015;
Huang S, Chen L, Te R, Qiao J, Wang J, Zhang W. Complementary iTRAQ proteomics and RNA-seq
transcriptomics reveal multiple levels of regulation in response to nitrogen starvation in Synechocystis sp.
PCC 6803. Molecular bioSystems 2013;9(10):2565-74.
Ishii N, Nakahigashi K, Baba T, Robert M, Soga T, Kanai A, Hirasawa T, Naba M, Hirai K, Hoque A, Ho PY,
Kakazu Y, Sugawara K, Igarashi S, Harada S, Masuda T, Sugiyama N, Togashi T, Hasegawa M, Takai Y, Yugi K,
Arakawa K, Iwata N, Toya Y, Nakayama Y, Nishioka T, Shimizu K, Mori H, Tomita M. Multiple high-
throughput analyses monitor the response of E. coli to perturbations. Science 2007;316(5824):593-7.
Jamshidi NPalsson BO. Mass action stoichiometric simulation models: incorporating kinetics and regulation
into stoichiometric models. Biophys J 2010;98(2):175-85.
Jayapal KP, Philp RJ, Kok YJ, Yap MG, Sherman DH, Griffin TJ, Hu WS. Uncovering genes with divergent
mRNA-protein dynamics in Streptomyces coelicolor. PLoS One 2008;3(5):e2097.
Jensen PAPapin JA. Functional integration of a metabolic network model and expression data without
arbitrary thresholding. Bioinformatics 2011;27(4):541-7.
Karaosmanoglu K, Sayar NA, Aksan Kurnaz I, Sariyar Akbulut B. Assessment of Berberine as a Multi-target
Antimicrobial: A Multi-omics Study for Drug Discovery and Repositioning. Omics : a journal of integrative
biology 2013.
Karnovsky A, Weymouth T, Hull T, Tarcea VG, Scardoni G, Laudanna C, Sartor MA, Stringer KA, Jagadish HV,
Burant C, Athey B, Omenn GS. Metscape 2 bioinformatics tool for the analysis and visualization of
metabolomics and gene expression data. Bioinformatics 2012;28(3):373-80.
Karpievitch YV, Taverner T, Adkins JN, Callister SJ, Anderson GA, Smith RD, Dabney AR. Normalization of
peak intensities in bottom-up MS-based proteomics using singular value decomposition. Bioinformatics
2009;25(19):2573-80.
Kim JReed JL. RELATCH: relative optimality in metabolic networks explains robust metabolic and regulatory
responses to perturbations. Genome biology 2012;13(9):R78.
Klukas CSchreiber F. Integration of -omics data and networks for biomedical research with VANTED. Journal
of integrative bioinformatics 2010;7(2):112.
Kromer JO, Sorgenfrei O, Klopprogge K, Heinzle E, Wittmann C. In-depth profiling of lysine-producing
Corynebacterium glutamicum by combined analysis of the transcriptome, metabolome, and fluxome. J
Bacteriol 2004;186(6):1769-84.
Kumar VSMaranas CD. GrowMatch: an automated method for reconciling in silico/in vivo growth
predictions. PLoS Comput Biol 2009;5(3):e1000308.
Kuo TC, Tian TF, Tseng YJ. 3Omics: a web-based systems biology tool for analysis, integration and
visualization of human transcriptomic, proteomic and metabolomic data. BMC Syst Biol 2013;7:64.
Kurz V, Nelson EM, Perry N, Timp W, Timp G. Epigenetic memory emerging from integrated transcription
bursts. Biophys J 2013;105(6):1526-32.
Le Cao KA, Gonzalez I, Dejean S. integrOmics: an R package to unravel relationships between two omics
datasets. Bioinformatics 2009;25(21):2855-6.
Lee SJ, Lee DY, Kim TY, Kim BH, Lee J, Lee SY. Metabolic engineering of Escherichia coli for enhanced
production of succinic acid, based on genome comparison and in silico gene knockout simulation. Appl
Environ Microbiol 2005;71(12):7880-7.
Li Q, Cheng T, Wang Y, Bryant SH. PubChem as a public resource for drug discovery. Drug discovery today
2010;15(23-24):1052-7.
Lieberman-Aiden E, van Berkum NL, Williams L, Imakaev M, Ragoczy T, Telling A, Amit I, Lajoie BR, Sabo PJ,
Dorschner MO, Sandstrom R, Bernstein B, Bender MA, Groudine M, Gnirke A, Stamatoyannopoulos J, Mirny
LA, Lander ES, Dekker J. Comprehensive mapping of long-range interactions reveals folding principles of the
human genome. Science 2009;326(5950):289-93.
Lin J, Xie Z, Zhu H, Qian J. Understanding protein phosphorylation on a systems level. Briefings in functional
genomics 2010;9(1):32-42.
Lin K, Kools H, de Groot PJ, Gavai AK, Basnet RK, Cheng F, Wu J, Wang X, Lommen A, Hooiveld GJ, Bonnema
G, Visser RG, Muller MR, Leunissen JA. MADMAX - Management and analysis database for multiple ~omics
experiments. Journal of integrative bioinformatics 2011;8(2):160.
Ma Q, Zhou J, Zhang W, Meng X, Sun J, Yuan YJ. Integrated proteomic and metabolomic analysis of an
artificial microbial community for two-step production of vitamin C. PLoS One 2011;6(10):e26108.
. CC-BY-NC-ND 4.0 International licensepeer-reviewed) is the author/funder. It is made available under aThe copyright holder for this preprint (which was not. http://dx.doi.org/10.1101/013532doi: bioRxiv preprint first posted online Jan. 7, 2015;

Machado DHerrgard M. Systematic evaluation of methods for integration of transcriptomic data into
constraint-based models of metabolism. PLoS Comput Biol 2014;10(4):e1003580.
Maier T, Schmidt A, Guell M, Kuhner S, Gavin AC, Aebersold R, Serrano L. Quantification of mRNA and
protein and integration with protein turnover in a bacterium. Mol Syst Biol 2011;7:511.
Maier T, Marcos J, Wodke JA, Paetzold B, Liebeke M, Gutierrez-Gallego R, Serrano L. Large-scale
metabolome analysis and quantitative integration with genomics and proteomics data in Mycoplasma
pneumoniae. Molecular bioSystems 2013;9(7):1743-55.
Markus Kalisch MM, Diego Colombo, Marloes H. Maathuis, Peter Bühlmann. Causal Inference Using
Graphical Models with the R Package pcalg. Journal of statistical software 2012;47(11).
Martin A, Ochagavia ME, Rabasa LC, Miranda J, Fernandez-de-Cossio J, Bringas R. BisoGenet: a new tool for
gene network building, visualization and analysis. BMC Bioinformatics 2010;11:91.
McAuliffe JD, Jordan MI, Pachter L. Subtree power analysis and species selection for comparative genomics.
Proceedings of the National Academy of Sciences of the United States of America 2005;102(22):7900-5.
Meng C, Kuster B, Culhane AC, Moghaddas Gholami A. A multivariate approach to the integration of multi-
omics datasets. BMC Bioinformatics 2014;15:162.
Merelli I, Lio P, Milanesi L. NuChart: An R Package to Study Gene Spatial Neighbourhoods with Multi-Omics
Annotations. PLoS One 2013;8(9):e75146.
Monk JM, Charusanti P, Aziz RK, Lerman JA, Premyodhin N, Orth JD, Feist AM, Palsson BO. Genome-scale
metabolic reconstructions of multiple Escherichia coli strains highlight strain-specific adaptations to
nutritional environments. Proceedings of the National Academy of Sciences of the United States of America
2013;110(50):20338-43.
Moriya Y, Itoh M, Okuda S, Yoshizawa AC, Kanehisa M. KAAS: an automatic genome annotation and
pathway reconstruction server. Nucleic acids research 2007;35(Web Server issue):W182-5.
Moura M, Broadbelt L, Tyo K. Computational tools for guided discovery and engineering of metabolic
pathways. Methods in molecular biology 2013;985:123-47.
Nagy H, Sornay-Rendu E, Boutroy S, Vilayphiou N, Szulc P, Chapurlat R. Impaired trabecular and cortical
microarchitecture in daughters of women with osteoporotic fracture: the MODAM study. Osteoporosis
international : a journal established as result of cooperation between the European Foundation for
Osteoporosis and the National Osteoporosis Foundation of the USA 2013;24(6):1881-9.
Navid AAlmaas E. Genome-level transcription data of Yersinia pestis analyzed with a new metabolic
constraint-based approach. BMC Syst Biol 2012;6:150.
Neto EC, Keller MP, Attie AD, Yandell BS. Causal Graphical Models in Systems Genetics: A Unified
Framework for Joint Inference of Causal Network and Genetic Architecture for Correlated Phenotypes. The
annals of applied statistics 2010;4(1):320-339.
Neuweger H, Persicke M, Albaum SP, Bekel T, Dondrup M, Huser AT, Winnebald J, Schneider J, Kalinowski J,
Goesmann A. Visualizing post genomics data-sets on customized pathway maps by ProMeTra-aeration-
dependent gene expression and metabolism of Corynebacterium glutamicum as an example. BMC Syst Biol
2009;3:82.
Nie L, Wu G, Zhang W. Correlation between mRNA and protein abundance in Desulfovibrio vulgaris: a
multiple regression to identify sources of variations. Biochem Biophys Res Commun 2006;339(2):603-10.
Oberhardt MA, Chavali AK, Papin JA. Flux balance analysis: interrogating genome-scale metabolic networks.
Methods in molecular biology 2009;500:61-80.
Oberhardt MA, Puchalka J, Martins dos Santos VA, Papin JA. Reconciliation of genome-scale metabolic
reconstructions for comparative systems analysis. PLoS Comput Biol 2011;7(3):e1001116.
Oh YK, Palsson BO, Park SM, Schilling CH, Mahadevan R. Genome-scale reconstruction of metabolic
network in Bacillus subtilis based on high-throughput phenotyping and gene essentiality data. The Journal
of biological chemistry 2007;282(39):28791-9.
Pacheco MP, Sauter, T. Fast reconstruction of compact context-specific metabolic networks via integration
of microarray data. 2014.
Paley SMKarp PD. The Pathway Tools cellular overview diagram and Omics Viewer. Nucleic acids research
2006;34(13):3771-8.
Palsson BZengler K. The challenges of integrating multi-omic data sets. Nature chemical biology
2010;6(11):787-9.
. CC-BY-NC-ND 4.0 International licensepeer-reviewed) is the author/funder. It is made available under aThe copyright holder for this preprint (which was not. http://dx.doi.org/10.1101/013532doi: bioRxiv preprint first posted online Jan. 7, 2015;

Papin JA, Price ND, Wiback SJ, Fell DA, Palsson BO. Metabolic pathways in the post-genome era. Trends
Biochem Sci 2003;28(5):250-8.
Pardi FGoldman N. Species choice for comparative genomics: being greedy works. PLoS genetics
2005;1(6):e71.
Park T, Yi SG, Kang SH, Lee S, Lee YS, Simon R. Evaluation of normalization methods for microarray data.
BMC Bioinformatics 2003;4:33.
Perco P, Muhlberger I, Mayer G, Oberbauer R, Lukas A, Mayer B. Linking transcriptomic and proteomic data
on the level of protein interaction networks. Electrophoresis 2010;31(11):1780-9.
Poblete-Castro I, Escapa IF, Jager C, Puchalka J, Lam CM, Schomburg D, Prieto MA, Martins dos Santos VA.
The metabolic response of P. putida KT2442 producing high levels of polyhydroxyalkanoate under single-
and multiple-nutrient-limited growth: highlights from a multi-level omics approach. Microbial cell factories
2012;11:34.
Polpitiya AD, Qian WJ, Jaitly N, Petyuk VA, Adkins JN, Camp DG, 2nd, Anderson GA, Smith RD. DAnTE: a
statistical tool for quantitative analysis of -omics data. Bioinformatics 2008;24(13):1556-8.
Prax MBertram R. Metabolic aspects of bacterial persisters. Frontiers in cellular and infection microbiology
2014;4:148.
Quek LE, Wittmann C, Nielsen LK, Kromer JO. OpenFLUX: efficient modelling software for 13C-based
metabolic flux analysis. Microbial cell factories 2009;8:25.
Rao VS, Srinivas K, Sujini GN, Kumar GN. Protein-protein interaction detection: methods and analysis.
International journal of proteomics 2014;2014:147648.
Sana TR, Fischer S, Wohlgemuth G, Katrekar A, Jung KH, Ronald PC, Fiehn O. Metabolomic and
transcriptomic analysis of the rice response to the bacterial blight pathogen Xanthomonas oryzae pv.
oryzae. Metabolomics : Official journal of the Metabolomic Society 2010;6(3):451-465.
Sass S, Buettner F, Mueller NS, Theis FJ. A modular framework for gene set analysis integrating multilevel
omics data. Nucleic acids research 2013a.
Sass S, Buettner F, Mueller NS, Theis FJ. A modular framework for gene set analysis integrating multilevel
omics data. Nucleic Acids Res 2013b;41(21):9622-33.
Schaub J, Clemens C, Kaufmann H, Schulz TW. Advancing biopharmaceutical process development by
system-level data analysis and integration of omics data. Adv Biochem Eng Biotechnol 2012;127:133-63.
Schermelleh L, Heintzmann R, Leonhardt H. A guide to super-resolution fluorescence microscopy. The
Journal of cell biology 2010;190(2):165-75.
Schmidt BJ, Ebrahim A, Metz TO, Adkins JN, Palsson BO, Hyduke DR. GIM3E: condition-specific models of
cellular metabolism developed from metabolomics and expression data. Bioinformatics 2013;29(22):2900-
8.
Seemann T. Prokka: rapid prokaryotic genome annotation. Bioinformatics 2014;30(14):2068-9.
Sengupta T, Bhushan M, Wangikar PP. Metabolic modeling for multi-objective optimization of ethanol
production in a Synechocystis mutant. Photosynthesis research 2013;118(1-2):155-65.
Shannon P, Markiel A, Ozier O, Baliga NS, Wang JT, Ramage D, Amin N, Schwikowski B, Ideker T. Cytoscape:
a software environment for integrated models of biomolecular interaction networks. Genome research
2003;13(11):2498-504.
Shavit YLio P. CytoHiC: a cytoscape plugin for visual comparison of Hi-C networks. Bioinformatics
2013;29(9):1206-7.
Shell SS, Prestwich EG, Baek SH, Shah RR, Sassetti CM, Dedon PC, Fortune SM. DNA methylation impacts
gene expression and ensures hypoxic survival of Mycobacterium tuberculosis. PLoS pathogens
2013;9(7):e1003419.
Shi Y, Tyson GW, Eppley JM, DeLong EF. Integrated metatranscriptomic and metagenomic analyses of
stratified microbial assemblages in the open ocean. The ISME journal 2011;5(6):999-1013.
Shi Z, Wang J, Zhang B. NetGestalt: integrating multidimensional omics data over biological networks.
Nature methods 2013;10(7):597-8.
Shlomi T, Cabili MN, Herrgard MJ, Palsson BO, Ruppin E. Network-based prediction of human tissue-specific
metabolism. Nature biotechnology 2008;26(9):1003-10.
. CC-BY-NC-ND 4.0 International licensepeer-reviewed) is the author/funder. It is made available under aThe copyright holder for this preprint (which was not. http://dx.doi.org/10.1101/013532doi: bioRxiv preprint first posted online Jan. 7, 2015;

Stadler C, Rexhepaj E, Singan VR, Murphy RF, Pepperkok R, Uhlen M, Simpson JC, Lundberg E.
Immunofluorescence and fluorescent-protein tagging show high correlation for protein localization in
mammalian cells. Nature methods 2013;10(4):315-23.
Sun H, Wang H, Zhu R, Tang K, Gong Q, Cui J, Cao Z, Liu Q. iPEAP: integrating multiple omics and genetic
data for pathway enrichment analysis. Bioinformatics 2013.
Tatusov RL, Fedorova ND, Jackson JD, Jacobs AR, Kiryutin B, Koonin EV, Krylov DM, Mazumder R, Mekhedov
SL, Nikolskaya AN, Rao BS, Smirnov S, Sverdlov AV, Vasudevan S, Wolf YI, Yin JJ, Natale DA. The COG
database: an updated version includes eukaryotes. BMC Bioinformatics 2003;4:41.
Thiele I, Fleming RM, Que R, Bordbar A, Diep D, Palsson BO. Multiscale modeling of metabolism and
macromolecular synthesis in E. coli and its application to the evolution of codon usage. PLoS One
2012;7(9):e45635.
Thomas A, Rahmanian S, Bordbar A, Palsson BO, Jamshidi N. Network reconstruction of platelet metabolism
identifies metabolic signature for aspirin resistance. Scientific reports 2014;4:3925.
Tomar NDe RK. Comparing methods for metabolic network analysis and an application to metabolic
engineering. Gene 2013;521(1):1-14.
Tong W, Chen Z, Cao Z, Wang Q, Zhang J, Bai X, Wang R, Liu S. Robustness analysis of a constraint-based
metabolic model links cell growth and proteomics of Thermoanaerobacter tengcongensis under
temperature perturbation. Molecular bioSystems 2013;9(4):713-22.
Topfer N, Jozefczuk S, Nikoloski Z. Integration of time-resolved transcriptomics data with flux-based
methods reveals stress-induced metabolic adaptation in Escherichia coli. BMC Syst Biol 2012;6:148.
Vanee N, Brooks JP, Spicer V, Shamshurin D, Krokhin O, Wilkins JA, Deng Y, Fong SS. Proteomics-based
metabolic modeling and characterization of the cellulolytic bacterium Thermobifida fusca. BMC Syst Biol
2014;8:86.
Varma APalsson BO. Stoichiometric flux balance models quantitatively predict growth and metabolic by-
product secretion in wild-type Escherichia coli W3110. Appl Environ Microbiol 1994;60(10):3724-31.
Vogel CMarcotte EM. Insights into the regulation of protein abundance from proteomic and transcriptomic
analyses. Nature reviews Genetics 2012;13(4):227-32.
Vogelsang J, Steinhauer C, Forthmann C, Stein IH, Person-Skegro B, Cordes T, Tinnefeld P. Make them blink:
probes for super-resolution microscopy. Chemphyschem 2010;11(12):2475-90.
Walther D, Strassburg K, Durek P, Kopka J. Metabolic pathway relationships revealed by an integrative
analysis of the transcriptional and metabolic temperature stress-response dynamics in yeast. Omics : a
journal of integrative biology 2010;14(3):261-74.
Wiench B, Chen YR, Paulsen M, Hamm R, Schroder S, Yang NS, Efferth T. Integration of Different "-omics"
Technologies Identifies Inhibition of the IGF1R-Akt-mTOR Signaling Cascade Involved in the Cytotoxic Effect
of Shikonin against Leukemia Cells. Evidence-based complementary and alternative medicine : eCAM
2013;2013:818709.
Winter GKromer JO. Fluxomics - connecting 'omics analysis and phenotypes. Environ Microbiol
2013;15(7):1901-16.
Wrzodek C, Eichner J, Buchel F, Zell A. InCroMAP: integrated analysis of cross-platform microarray and
pathway data. Bioinformatics 2013;29(4):506-8.
Xia T, Hemert JV, Dickerson JA. OmicsAnalyzer: a Cytoscape plug-in suite for modeling omics data.
Bioinformatics 2010;26(23):2995-6.
Yang S, Tschaplinski TJ, Engle NL, Carroll SL, Martin SL, Davison BH, Palumbo AV, Rodriguez M, Jr., Brown
SD. Transcriptomic and metabolomic profiling of Zymomonas mobilis during aerobic and anaerobic
fermentations. BMC Genomics 2009;10:34.
Yang YH, Dudoit S, Luu P, Lin DM, Peng V, Ngai J, Speed TP. Normalization for cDNA microarray data: a
robust composite method addressing single and multiple slide systematic variation. Nucleic acids research
2002;30(4):e15.
Yizhak K, Benyamini T, Liebermeister W, Ruppin E, Shlomi T. Integrating quantitative proteomics and
metabolomics with a genome-scale metabolic network model. Bioinformatics 2010;26(12):i255-60.
Yoshida S, Imoto J, Minato T, Oouchi R, Sugihara M, Imai T, Ishiguro T, Mizutani S, Tomita M, Soga T,
Yoshimoto H. Development of bottom-fermenting saccharomyces strains that produce high SO2 levels,
using integrated metabolome and transcriptome analysis. Appl Environ Microbiol 2008;74(9):2787-96.
. CC-BY-NC-ND 4.0 International licensepeer-reviewed) is the author/funder. It is made available under aThe copyright holder for this preprint (which was not. http://dx.doi.org/10.1101/013532doi: bioRxiv preprint first posted online Jan. 7, 2015;

Zhang FDrabier R. IPAD: the Integrated Pathway Analysis Database for Systematic Enrichment Analysis.
BMC Bioinformatics 2012;13 Suppl 15:S7.
Zhang W, Li F, Nie L. Integrating multiple 'omics' analysis for microbial biology: application and
methodologies. Microbiology 2010;156(Pt 2):287-301.
Zhu H, Ren X, Wang J, Song Z, Shi M, Qiao J, Tian X, Liu J, Chen L, Zhang W. Integrated OMICS guided
engineering of biofuel butanol-tolerance in photosynthetic Synechocystis sp. PCC 6803. Biotechnology for
biofuels 2013;6(1):106.
Zou W, Liu L, Zhang J, Yang H, Zhou M, Hua Q, Chen J. Reconstruction and analysis of a genome-scale
metabolic model of the vitamin C producing industrial strain Ketogulonicigenium vulgare WSH-001. J
Biotechnol 2012;161(1):42-8.
. CC-BY-NC-ND 4.0 International licensepeer-reviewed) is the author/funder. It is made available under aThe copyright holder for this preprint (which was not. http://dx.doi.org/10.1101/013532doi: bioRxiv preprint first posted online Jan. 7, 2015;

Acknowledgments During the realization of this work Marco Fondi was supported by a FEMS advanced fellowship (FAF2012). This work is also supported by a PNRA (Piano Nazionale per la Ricerca in Antartide) grant (PNRA 2013/B4.02).
Tables
Table 1: List of software/methods for–omics integration
Method/Software Website Ref. -omics datasets integration
Omickriging (R package) http://cran.r-project.org/web/packages/OmicKriging/index.html
-
Integromics https://www.integromics.com/ (Le Cao et al., 2009) MONA http://sourceforge.net/projects/monaos/ (Sass et al., 2013b) NetGestalt http://www.netgestalt.org/ (Shi et al., 2013) VANTED http://vanted.ipk-gatersleben.de/ (Klukas and Schreiber,
2010) mixOmics (R package) http://www.qfab.org/mixomics/ - Confero http://sourceforge.net/projects/confero/ (Hermida et al., 2013) DAnTE http://omics.pnl.gov/software/DanteR.php (Polpitiya et al., 2008) MADMAX http://madmax2.bioinformatics.nl:443/dev/f?
p=104:1 (Lin et al., 2011)
MCIA http://www.bioconductor.org/packages/release/bioc/html/omicade4.html
(Meng et al., 2014)
InCroMAP http://www.ra.cs.uni-tuebingen.de/software/InCroMAP/
(Wrzodek et al., 2013)
Causality qtlnet http://cran.r-
project.org/web/packages/qtlnet/ (Neto et al., 2010)
pcalg http://pcalg.r-forge.r-project.org/ (Markus Kalisch, 2012) -omics data visualization OmicsAnalyzer http://apps.cytoscape.org/apps/omicsanalyz
er (Xia et al., 2010)
GALANT http://www.lbbc.ibb.unesp.br/galant/ (Camilo et al., 2013) BisoGenet http://apps.cytoscape.org/apps/bisogenet (Martin et al., 2010) CytoHiC http://www.cl.cam.ac.uk/~ys388/CytoHiC/ (Shavit and Lio, 2013) MODAM http://www.softpedia.com/get/Programming/
Components-Libraries/MODAM.shtml (Nagy et al., 2013)
NuChart ftp://fileserver.itb.cnr.it/nuchart (Merelli et al., 2013) Pathway Tools http://bioinformatics.ai.sri.com/ptools/ (Paley and Karp, 2006) ProMeTra https://prometra.cebitec.uni-bielefeld.de/cgi-
bin//prometra.cgi?login=prometra (Neuweger et al., 2009)
Paintomics http://bioinfo.cipf.es/node/826 (Garcia-Alcalde et al., 2011)
3Omics http://3omics.cmdm.tw/ (Kuo et al., 2013) Metscape http://metscape.ncibi.org/ (Karnovsky et al., 2012) MAYDAY http://www-ps.informatik.uni-
tuebingen.de/mayday/ (Battke et al., 2010)
. CC-BY-NC-ND 4.0 International licensepeer-reviewed) is the author/funder. It is made available under aThe copyright holder for this preprint (which was not. http://dx.doi.org/10.1101/013532doi: bioRxiv preprint first posted online Jan. 7, 2015;
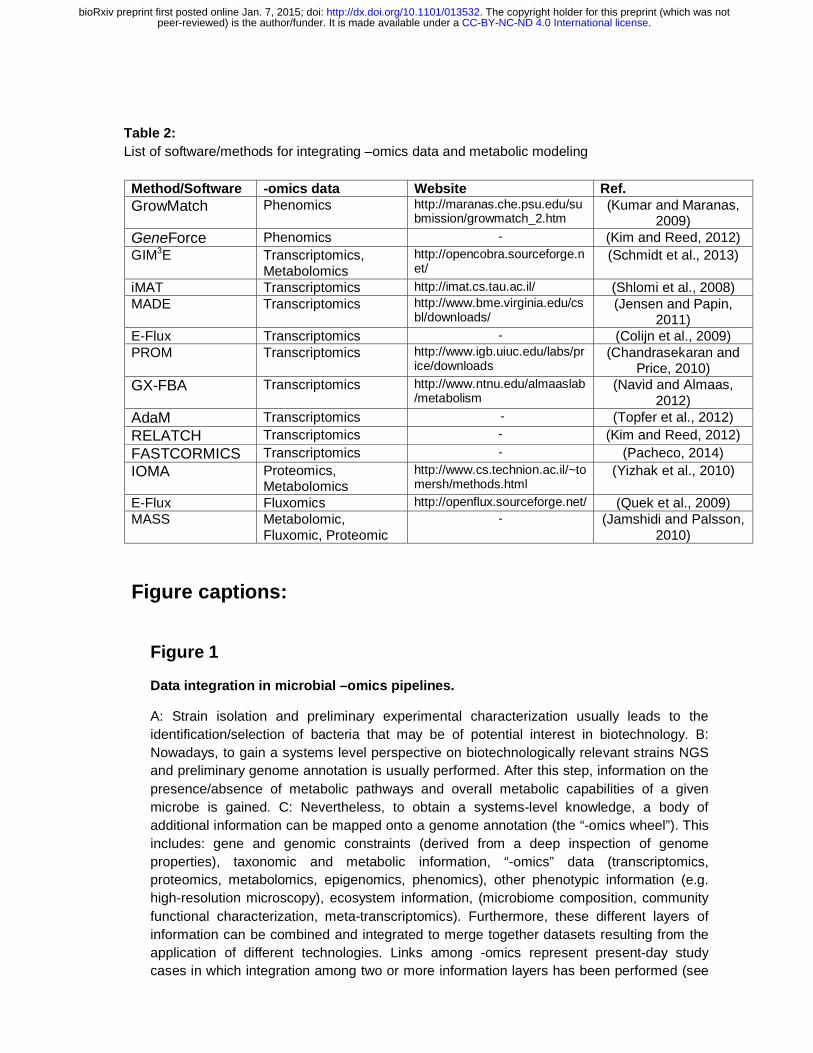
Table 2: List of software/methods for integrating –omics data and metabolic modeling
Method/Software -omics data Website Ref. GrowMatch Phenomics http://maranas.che.psu.edu/su
bmission/growmatch_2.htm (Kumar and Maranas,
2009) GeneForce Phenomics - (Kim and Reed, 2012) GIM3E Transcriptomics,
Metabolomics http://opencobra.sourceforge.net/
(Schmidt et al., 2013)
iMAT Transcriptomics http://imat.cs.tau.ac.il/ (Shlomi et al., 2008) MADE Transcriptomics http://www.bme.virginia.edu/cs
bl/downloads/ (Jensen and Papin,
2011) E-Flux Transcriptomics - (Colijn et al., 2009) PROM Transcriptomics http://www.igb.uiuc.edu/labs/pr
ice/downloads (Chandrasekaran and
Price, 2010) GX-FBA Transcriptomics http://www.ntnu.edu/almaaslab
/metabolism (Navid and Almaas,
2012) AdaM Transcriptomics - (Topfer et al., 2012) RELATCH Transcriptomics - (Kim and Reed, 2012) FASTCORMICS Transcriptomics - (Pacheco, 2014) IOMA Proteomics,
Metabolomics http://www.cs.technion.ac.il/~tomersh/methods.html
(Yizhak et al., 2010)
E-Flux Fluxomics http://openflux.sourceforge.net/ (Quek et al., 2009) MASS Metabolomic,
Fluxomic, Proteomic - (Jamshidi and Palsson,
2010)
Figure captions:
Figure 1
Data integration in microbial –omics pipelines.
A: Strain isolation and preliminary experimental characterization usually leads to the identification/selection of bacteria that may be of potential interest in biotechnology. B: Nowadays, to gain a systems level perspective on biotechnologically relevant strains NGS and preliminary genome annotation is usually performed. After this step, information on the presence/absence of metabolic pathways and overall metabolic capabilities of a given microbe is gained. C: Nevertheless, to obtain a systems-level knowledge, a body of additional information can be mapped onto a genome annotation (the “-omics wheel”). This includes: gene and genomic constraints (derived from a deep inspection of genome properties), taxonomic and metabolic information, “-omics” data (transcriptomics, proteomics, metabolomics, epigenomics, phenomics), other phenotypic information (e.g. high-resolution microscopy), ecosystem information, (microbiome composition, community functional characterization, meta-transcriptomics). Furthermore, these different layers of information can be combined and integrated to merge together datasets resulting from the application of different technologies. Links among -omics represent present-day study cases in which integration among two or more information layers has been performed (see
. CC-BY-NC-ND 4.0 International licensepeer-reviewed) is the author/funder. It is made available under aThe copyright holder for this preprint (which was not. http://dx.doi.org/10.1101/013532doi: bioRxiv preprint first posted online Jan. 7, 2015;

corresponding references). D: After -omics integration has been performed, a more comprehensive perspective on the microbe(s) under study is gained, providing clues on the possible interactions with the surrounding environment (including metabolic cross-talk with other microbial species), statistically grounded inferences and novel questions to be addressed (possibly re-iterating the pipeline). In this figure, orange boxes include possible software (see Supplementary Table 2 for the full list) while green-blue boxes specific tasks of general –omics strategy.
Figure 2
Super-meta and multi-parameter evidence synthesis approaches for -omics integration.
Available technologies and public datasets allow approaching systems biology issues through a super-meta approach. Accordingly, different combinations of microbial ensembles (y axis), sampling environments (z axis) and/or -omics technologies (x axis) can be integrated and analysed, exploiting, for example multi evidence synthesis approaches. In this figure, the different circles represent different datasets, with hypothetical data quality represented in red-scale and the amount of data by circles size.
Figure 3
Overall scheme of a metabolic reconstruction/modelling pipeline and possible –omics integration. A: The input is typically a genome resulting from NGS. Tools for automatically generating draft metabolic reconstructions from public repositories are reported in Supplementary Table 1). B: Experimental data (i.e. growth rates, phenotype microarrays) can be used at this moment to help model construction/refinement. C: Draft metabolic models usually undergo extensive gap-filling. Once gaps have been correctly identified and filled, a first comparison between phenotypes prediction capabilities of the model and experimental data. D: When a fitting is found between experimental data and in silico predictions, more grounded computational simulation start. In this phase, -omics data integration (e.g. transcriptomics, proteomics) can be used for refining and reconciling modelling predictions. Finally, a working and experimentally validated metabolic model can be used for the refinement of other metabolic models.
. CC-BY-NC-ND 4.0 International licensepeer-reviewed) is the author/funder. It is made available under aThe copyright holder for this preprint (which was not. http://dx.doi.org/10.1101/013532doi: bioRxiv preprint first posted online Jan. 7, 2015;

Strain(s) selection
- codon usage- structure- organization -function
ACUAE-CAIMosaicFinderOperonDB
- GC% content- DNA conf.OriFinder
GraphDNA
Epigenomics- DNA methylation
RESID db
Phenomics
Proteomics
Gene constraints
Genomic constraints
Taxonomic info- comparativegenomics- phylogeny
CoGeCGATMicrobesOnlineBeast
- model reconstruction- FBA and ODEs
Model SEEDKEGGCOBRA toolbox
Metabolic model
MBRole MetPA MSEA MAVEN
Metabolomics - pathway
- genome re-annotation
Transcriptomics -co-expression- condition dependentgene expression- data normalization
BioconductorGIMMEiMAT
Ecosystem info
-PPI network
RASTPGAAPDDBJ PipelineMicroScope
NGS + de novo annotation- genome assembly-genome annotation- genome re-sequencing
Annotated genome
-Phenotype microarray
- DuctApe- PhD database- RetroSpect- PheMaDB
Single cell microscopy - SEM- TEM- Super-resolution
- Tri-track- RELION- CellC
- Metagenomics- Metatranscriptomics- Microbiomes
H+
H+ H
+
H+
- Integrated annotation - New questions- Visualization- Statistical inference- Causality
multi-layer integrations2-layer integrations
KBase
- DIP db- STRING db- Cytoscape
- MG-RAST- FANTOM- MEGAN
- Pathways reconstruction
BiQAnalyzer HTSMRT Analysis
Figure1
A)
B)
C)
D)
Abubucker et al. 2012
Wang et al. 2011
Lin
et a
l. 20
13
Lin et al. 2013
Lin
et a
l. 20
13
Miy
ashi
ro e
t al.
2007
- posttranslational modi�cations
Durot et al. 2008
Yizhak et al. 2010
Yizhak et al. 2010
Yizhak et al. 2010
Fu et al. 2013
Delmotte
et a
l. 2010
Yang et al. 2009Lo
w et a
l. 2001
Mace
k et a
l.
2007
Hain
et a
l. 201
2
Hain et al. 2012
Hai
n e
t al.
2012
. CC-BY-NC-ND 4.0 International licensepeer-reviewed) is the author/funder. It is made available under aThe copyright holder for this preprint (which was not. http://dx.doi.org/10.1101/013532doi: bioRxiv preprint first posted online Jan. 7, 2015;

Host-associatedEnvironmental
Clinical strains
Metaenvironment (z)
Multi-omics (x)
Genomics
Proteomics
Metabolomics
Phenomics
Transcripto
mics
Microbialstrains (y)
Food borne
Biotransformation
Super-meta
Figure 2
data quality
. CC-BY-NC-ND 4.0 International licensepeer-reviewed) is the author/funder. It is made available under aThe copyright holder for this preprint (which was not. http://dx.doi.org/10.1101/013532doi: bioRxiv preprint first posted online Jan. 7, 2015;

Metabolic model
NGSModel generation
Multi -omics integration to knowledge
ProteomicsTranscriptomicsMetabolomicsPhenomicsComparative genomics
Model check
Reject
Pass
-omics
Computational simulation(growth and phenotype)
Reject
Taxonomic information
Reconstructioncompleted
Public repositories
timeN
. cel
ls
Biological validation
Pass
Biological rationale
B) A)
C)
D)
Experimental data analysis and visualization
Experimental data analysis and visualization
. CC-BY-NC-ND 4.0 International licensepeer-reviewed) is the author/funder. It is made available under aThe copyright holder for this preprint (which was not. http://dx.doi.org/10.1101/013532doi: bioRxiv preprint first posted online Jan. 7, 2015;