metabolic effects of dietary sucrose and fructose in - diabetes care
TRANSCRIPT

R I G I N A L A R T I C L E
Metabolic Effects of Dietary Sucroseand Fructose in Type II Diabetic SubjectsDOMINGOS A. MALERBI, MD
F.l.l.EN SlMONE A. PA1VA, MDANA LUCIA DUARTE, RD
BERNARDO L. WAJCHENBERG, MD
OBJECTIVE — To investigate the metabolic effects of dietary fructose and sucrose in type IIdiabetic patients.
RESEARCH DESIGN AND METHODS— Sixteen well-controlled type II diabetic sub-jects were fed three isocaloric diets for 28 days each. The three diets provided 50-55, 15, and30-35% of total energy from carbohydrate, protein, and fat, respectively. In one diet, 20% oftotal calories were derived from fructose; in another, 19% of total calories were derived fromsucrose; and in the control diet, only 5% of daily calories were derived from sugars, all othercarbohydrates being supplied as polysaccharides.
RESULTS — No significant differences were observed between either the fructose or thesucrose diet and the control polysaccharide diet in any of the measures of glycemic control,serum lipid levels, or insulin and C-peptide secretion.
CONCLUSIONS — Our data suggest that in the short and middle terms, high fructoseand sucrose diets do not adversely affect glycemia, lipemia, or insulin and C-peptide secretionin well-controlled type II diabetic subjects.
After having undergone a virtual revo-lution in dietary recommendationsfor diabetes, during which carbohy-
drates changed their status from "villains"to "stars," we are now faced with the con-troversies about the metabolic effects ofvarying ratios between sugars and poly-saccharides. Among sugars, fructose hasraised interest from both patients andhealth professionals since studies fromJenkins et al. (1,2), which codified theglucose response into a "glycemic index."Of the foods tested, the fructose-contain-ing ones had the lowest glycemic indexes,indicating that their ingestion resulted inlower postprandial plasma glucose con-centrations than the ingestion ofisocaloric amounts of other common car-bohydrates. Similar to fructose, consider-able attention has recently been focusedon the effects of sucrose in diabetic sub-jects, and it is now well-established thatthe complete withdrawal of this sugar
from the nutritional plan of diabeticpatients is no longer justified (3).
The available data on the effects offructose and sucrose consumption on themetabolic abnormalities of diabetes, par-ticularly those related to lipid metabolism,are inconclusive (3). The reasons for thecontradictory results may be explained, atleast partially, by differences in the condi-tions under which the studies were con-ducted. The duration of the experimentsvaried over the whole range from testmeals (4-7) to short- (8), middle- (9,10),and long-term (11,12) studies. Also, thetype of study diets varied from liquid for-mulas (4) to complex dietary manipula-tions (13). The degree of metabolic controlof the subjects ranged from mild type IIdiabetes (14) to hyperglycemic (15),hypertriglyceridemic (9,16), or hyperinsu-linemic (17,18) subjects.
In view of the literature's large varia-tion in experimental conditions and con-
I'iom the Endocrine and Nutrition Services, Hospital das Clinicas, University of Sao Paulo Medical School,Sao Paulo, Brazil.
Address correspondence and reprint requests to Domingos A. Malerbi, MD, Rua Jacques Felix 408/apt.H, 04'509-902 Sao Paulo-SP, Brazil.
Received for publication 8 August 1995 and accepted in revised form 13 June 1996.CHOD-PAP, cholesterol oxidase-p-aminophenazone assay; CV, coefficients of variation; GOD-PAP, glu-
cose oxidase-p-aminophenazone assay; R1A, radioimmunoassay.
flicting results, we designed the presentstudy to evaluate—in a homogeneousgroup of free-living, well-controlled, typeII diabetic patients, both in the short andmiddle-terms—the metabolic and pi-cellsecretory effects of isocaloric modificationsof the standard polysaccharide-rich dietrecommended for diabetic patients, byincreasing its fructose or sucrose content.
RESEARCH DESIGN ANDMETHODS— Sixteen well-controlledtype II diabetic subjects (9 women, 7men), previously diagnosed by theNational Diabetes Data Group criteria (19),were studied. Their age ranged from 34 to66 years (mean 54.2 years), and they haddiabetes for 2 months to 15 years (mean2.7 years). BMI ranged from 21.2 to 28.5kg/m2 (mean BMI 25.6 kg/m'). Tenpatients were receiving oral sulfonylureas,and six were being treated with diet alone.The oral hypoglycemic agents were contin-ued throughout the study their dose hav-ing not been changed. None of the subjectshad been previously treated with insulin.Three patients had hypertension, onebeing treated with captopril and two withchlorthalidone. None of the patients tookany other medication during the study. Allsubjects were in good general health. Twopatients had clinical evidence of mildperipheral neuropathy and one had back-ground retinopathy. Patients with a historyof poor clinic attendance, chronic alcoholabuse, clinically significant hepatic or renaldisease, or severe micro- or macroangiopa-thy were excluded at recruitment. The clin-ical characteristics of the study groups areshown in Table 1. All subjects gave writteninformed consent before entering the studyand the experimental protocol wasapproved by the ethics committee of theUniversity of Sao Paulo Medical School.
All patients consumed each diet for 28days, with 14-day washout periodsbetween them. The diets were isocaloric,with 25-30 kcal • kg-1 • day-1 and weredesigned to maintain constant bodyweight, providing 50-55, 15, and 30-35%of total energy from carbohydrate, protein,and fat, respectively. The three diets con-tained nearly identical amounts of dietaryfiber, cholesterol, polyunsaturated fat,
DIABETES CARE, VOLUME 19, NUMBER 11, NOVEMBER 1996 1249
Dow
nloaded from http://diabetesjournals.org/care/article-pdf/19/11/1249/444415/19-11-1249.pdf by guest on 15 M
arch 2022

Dietary sucrose and fructose in type II diabetes
Table 1—Baseline characteristics of the patients
Patient123456789
10111213141516
Means ± SE
Sex
FFFMMMMMMMFFFFFF
Age (years)
66623437566263555357455355586349
54.2 ± 2.3
BMI (kg/m2)
28.523.522.325.124.427.327.228.021.227.323.722.128.830.023.126.7
25.6 ± 0.7
Known duration ofdiabetes (years)
10121110.20.50.530.22150.5
152.7 ± 1.0
HbAlc (%)
9.06.36.26.38.07.08.37.47.08.58.36.17.48.86.38.3
7.5 ± 0.3
Treatment
D + 125 mgCD + 500 mg C
DD + 10 mg G
DD + 500 mg CD 4- 125 mgC
DD + 500 mg CD + 125 mgC
DDD
D + 375 mg CD + 2.5mgGD + 2.5 mgG
—
Fasting plasmaglucose (mmol/1)
8.45.35.56.85.07.86.88.08.46.77.36.87.8
10.55.59.0
7.2 ± 0.4
C, chlorpropamide; G, glibenclamide; D, diet. For HbAlc, normal range is 5.3-8.0%.
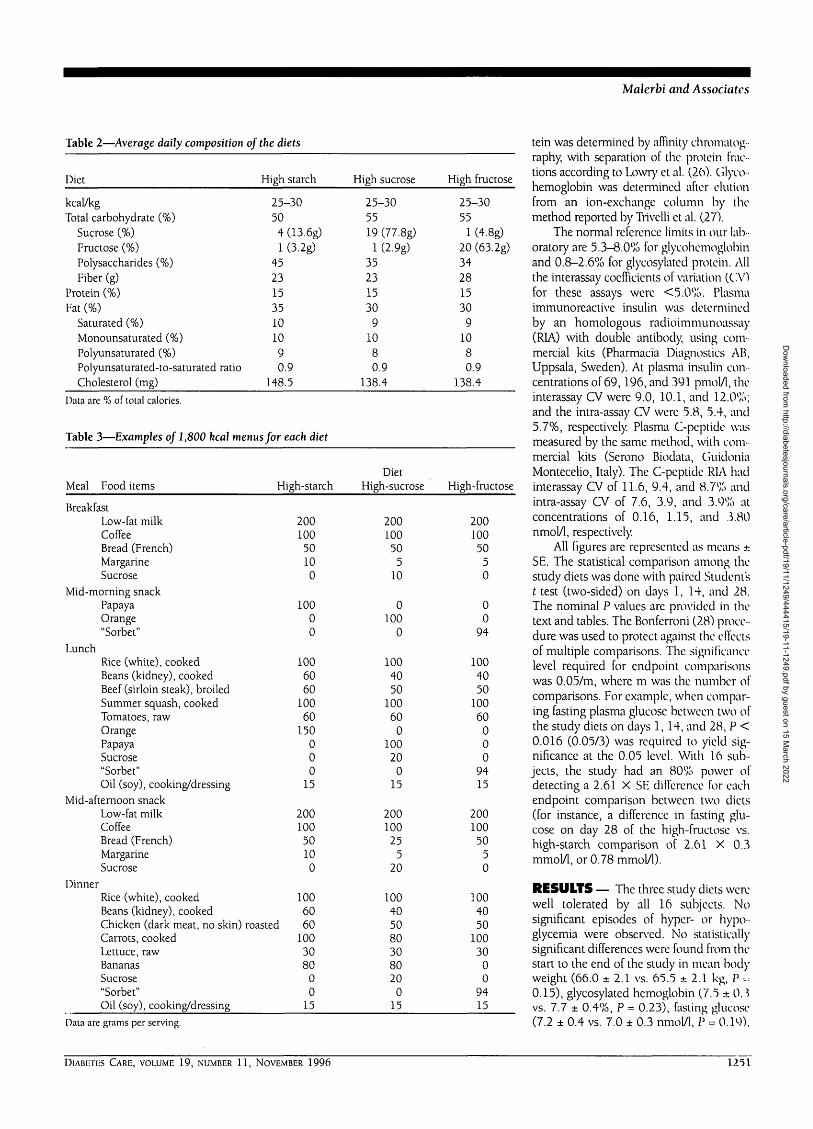
monounsaturated fat, and saturated fat(polyunsaturated-to-saturated ratio was0.9). In the control high-starch diet (dietI), 92% of carbohydrate energy wasderived from polysaccharides, which com-prised 45% of the total calories. In thehigh-sucrose diet (diet II), 32% of total car-bohydrate (19% of total calories) wasderived from sucrose. The high-fructosediet (diet III) had 28% of its total carbohy-drate content (20% of total calories) asfructose. Diet I had 1 and 4% of total calo-ries as fructose and sucrose, respectivelyand was 5% higher in fat than the high-sugar diets to match patients' feedinghabits. As the study was not metabolic, thisdifference in composition between thethree diets was considered experimentallyacceptable and insufficient to influence theresults. Table 2 shows the average nutri-tional composition of the diets, which wascalculated by a software based on the U.S.Department of Agriculture tables (20) andthe literature data on carbohydrate compo-sition of foods (21). The diet sequence waspreviously planned to avoid systematicrepetitions of a given order, six patientshaving started with diet I, five with diet II,and five with diet III. Of the fructose pres-ent in the high-fructose diet, 85% wasincorporated into a papaya frozen creamcalled sorbet, prepared from pure fructose(ADM-Corn Processing, Clinton, IA) in themetabolic kitchen of the Endocrine Ser-
vice, and supplied weekly to the patients.The remaining 15% of fructose wasderived from natural sources such as veg-etables and fruits. The "sorbet" was con-sumed three times a day: at the mid-morn-ing snack and after lunch and dinner. Allcarbohydrate contained in the high-starchdiet occurred naturally in the foods listed:bread, potatoes, beans, rice, etc. Virtuallyall sucrose contained in the high-sucrosediet was added to fruits, milk, beverages,and coffee. The average percent distribu-tion of daily calories among meals was 17,4, 31, 17, and 31% in breakfast, mid-morning snack, lunch, mid-afternoonsnack, and dinner, respectively.
The group of patients who completedthe study was highly compliant, willing toparticipate, and committed to the experi-mental protocol, having established a verygood relationship with the staff. They werenot admitted to the hospital so that theycould remain in their usual environment asmuch as possible. The patients wereencouraged to maintain their usual physi-cal activities and were seen at 2-week inter-vals as outpatients for clinical evaluations.Dietary compliance was assessed by recalland review of food records at each visit byA.L.D. who also assessed the occurrence ofadverse effects and the acceptability of thestudy diets. The three diets were markedlydifferent in composition as to the type offood supplying carbohydrates, which
made the chance of mistake negligible.Table 3 shows examples of typical menusfor each diet. Exchange lists of food itemswere provided to the patients for menumodifications.
The subjects underwent metabolicevaluations on days 1, 14, and 28 of eachdiet period. Fasting blood samples wereobtained at 0730 for measurement of glu-cose, insulin, C-peptide, total and HDLcholesterol, triglycerides, and glycosylatedprotein. Additional samples for measure-ment of glucose, insulin, C-peptide, andtriglyceride were obtained at 1400 and2200, nearly 2 h after lunch and dinner. A24-h urine collection for glucose was alsoobtained at each visit. Glycosylated hemo-globin was measured on days 1 and 28 ofeach study diet. Plasma and urine glucoseconcentrations were determined by anautomated glucose oxidase method withcolorimetric assay (glucose oxidase-p-aminophenazone [GOD-PAP]) (22). Serumtotal cholesterol was determined by a simi-lar method (cholesterol oxidase-p-amino-phenazone [CHOD-PAP]) (23), and theHDL cholesterol fraction was determinedafter precipitation of the other lipoproteinfractions with magnesium/phospho-tungstate (24). The LDL cholesterol fractionwas calculated by die Friedewald formula(24). Serum triglycerides were determinedby an enzymatic colorimetric assay (GK-GPO-POD) (25). Serum glycosylated pro-
1250 DIABETES CARE, VOLUME 19, NUMBER 11, NOVEMBER 1996
Dow
nloaded from http://diabetesjournals.org/care/article-pdf/19/11/1249/444415/19-11-1249.pdf by guest on 15 M
arch 2022
Malerbi and Associates
Table 2—Average daily composition of the diets
Diet
kcal/kgTotal carbohydrate (%)
Sucrose (%)Fructose (%)Polysaccharides (%)Fiber (g)
Protein (%)Fat (%)
Saturated (%)Monounsaturated (%)Polyunsaturated (%)Polyunsaturated-to-saturated ratioCholesterol (mg)
High starch
25-30504 (13.6g)1 (3.2g)
45231535101090.9
148.5
High sucrose
25-305519 (77.8g)
1 (2.9g)35231530
91080.9
138.4
High fructose
25-3055
1 (4.8g)20 (63.2g)34281530
91080.9
138.4
Data are % of total calories.
Table 3—Examples of 1,800 kcal menus for each diet
Meal Food items
BreakfastLow-fat milkCoffeeBread (French)MargarineSucrose
Mid-morning snackPapayaOrange"Sorbet"
LunchRice (white), cookedBeans (kidney), cookedBeef (sirloin steak), broiledSummer squash, cookedTomatoes, rawOrangePapayaSucrose"Sorbet"Oil (soy), cooking/dressing
Mid-afternoon snackLow-fat milkCoffeeBread (French)MargarineSucrose
DinnerRice (white), cookedBeans (kidney), cookedChicken (dark meat, no skin)Carrots, cookedLettuce, rawBananasSucrose"Sorbet"Oil (soy), cooking/dressing
High-starch
20010050100
10000
1006060
10060
150000
15
20010050100
10060
roasted 601003080
00
15
DietHigh-sucrose
20010050
510
0100
0
1004050
10060
010020
015
20010025
520
100405080308020
015
High-fructose
20010050
50
00
94
1004050
10060
000
9415
20010050
50
1004050
10030
00
9415
Data are grams per serving.
tein was determined by affinity chromatog--raphy, with separation of the protein frac-tions according to Lowry et al. (26). Glyco-hemoglobin was determined after elutionfrom an ion-exchange column by themethod reported by Trivelli et al. (27).
The normal reference limits in our lab-oratory are 5.3-8.0% for glycohemoglobinand 0.8-2.6% for glycosylated protein. Allthe interassay coefficients of variation (CV)for these assays were <5.0%. Plasmaimmunoreactive insulin was determinedby an homologous radioimmunoassay(RIA) with double antibody, using com-mercial kits (Pharmacia Diagnostics AB,Uppsala, Sweden). At plasma insulin con-centrations of 69,196, and 391 pmol/1, theinterassay CV were 9.0, 10.1, and 12.0%;and the intra-assay CV were 5.8, 5.4, and5.7%, respectively. Plasma C-peptide wasmeasured by the same method, with com-mercial kits (Serono Biodata, GuidoniaMontecelio, Italy). The C-peptide RIA hadinterassay CV of 11.6, 9.4, and 8.7% andintra-assay CV of 7.6, 3.9, and 3.9% atconcentrations of 0.16, 1.15, and 3.80nmol/1, respectively.
All figures are represented as means ±SE. The statistical comparison among thestudy diets was done with paired Studentst test (two-sided) on days 1, 14, and 28.The nominal P values are provided in thetext and tables. The Bonferroni (28) proce-dure was used to protect against the effectsof multiple comparisons. The significancelevel required for endpoint comparisonswas 0.05/m, where m was the number ofcomparisons. For example, when compar-ing fasting plasma glucose between two ofthe study diets on days 1,14, and 28, P <0.016 (0.05/3) was required to yield sig-nificance at the 0.05 level. With 16 sub-jects, the study had an 80% power ofdetecting a 2.61 X SE difference for eachendpoint comparison between two diets(for instance, a difference in fasting glu-cose on day 28 of the high-fructose vs.high-starch comparison of 2.61 X 0.3mmol/1, or 0.78 mmol/1).
RESULTS — The three study diets werewell tolerated by all 16 subjects. Nosignificant episodes of hyper- or hypo-glycemia were observed. No statisticallysignificant differences were found from thestart to the end of the study in mean bodyweight (66.0 ± 2.1 vs. 65.5 * 2.1 kg, P •-=0.15), glycosylated hemoglobin (7.5 ± 0.3vs. 7.7 ± 0.4%, P = 0.23), fasting glucose(7.2 ± 0.4 vs. 7.0 ± 0.3 nmol/1, P - 0.19),
DIABETES CARE, VOLUME 19, NUMBER 11, NOVEMBER 1996 1251
Dow
nloaded from http://diabetesjournals.org/care/article-pdf/19/11/1249/444415/19-11-1249.pdf by guest on 15 M
arch 2022
Dietary sucrose and fructose in type II diabetes
Table 4—Effects of the high-fructose and high-starch diets
DayT4" 28
Fasting plasma glucose (mmol/1)Starch dietFructose dietP
Postprandial plasma glucose (mmol/1)Starch dietFructose dietP
Glycosylated protein (%)Starch dietFructose dietP
Fasting serum cholesterol (mmol/1)Starch dietFructose dietP
Fasting serum LDL cholesterol (mmol/1)Starch dietFructose dietP
Fasting serum HDL cholesterol (mmol/1)Starch dietFructose dietP
Fasting serum triglycerides (mmol/1)Starch dietFructose dietP
Postprandial serum triglycerides (mmol/1)Starch dietFructose dietP
Fasting plasma insulin (pmol/1)Starch dietFructose dietP
Postprandial plasma insulin (pmol/1)Starch dietFructose dietP
Fasting plasma C-peptide (nmol/1)Starch dietFructose dietP
Postprandial plasma C-peptide (nmol/1)Starch dietFructose dietP
Body weight (kg)Starch dietFructose dietP
7.3 ±0.47.3 ±0.2
0.46
7.6 ±0.37.1 ±0.3
0.07
2.5 ±0.12.6 ±0.2
0.36
5.1 ±0.35.1 ±0.2
0.49
3.4 ±0.23.4 ±0.2
0.44
1.0 ±0.11.0 ±0.1
0.11
1.3 ±0.11.2 ±0.1
0.08
2.2 ±0.12.0 ±0.1
0.06
61.8 ± 12.154.0 ±9.9
0.09
187.8 ±28.2166.2 ±21.7
0.08
0.8 ±0.10.8 ±0.1
0.50
1.7 ±0.11.6 ±0.1
0.37
65.5 ±2.165.9 ±2.0
0.44
7.0 ±0 .2
7.0 ±0 .2
0.46
7.1 ±0 .3
7.1 ±0 .4
0.46
5.1 ±0.25.2 ±0.2
0.37
3.3 ±0.23.4 ±0.2
0.37
1.0 ±0.11.0 ±0.1
0.20
1.4 ±0.11.4 ±0.1
0.31
2.4 ±0.12.5 ±0.2
0.43
63.0 ±10.248.0 ±7.6
0.05
202.8 ±41.8145.2 ±14.1
0.08
0.8 ±0.10.9 ±0.1
0.33
1.7 ±0.21.6 ±0.1
0.03
65.4 ±2.065.5 ±2.1
0.79
76
77
22
55
33
11
11
22
69
.2±0.J±0.0.12
.6±0.
.2±0.0.17
33
34
.6 ±0.1
.7±0.0.40
.2
.1 ±0.2
.0±0.0.45
.4±0,
.3±0.0.42
.0±0.
.0±0.0.18
.3±0.
.2
.2
.2
.1
.1
.1.3 ±0.10.34
.3±0.
.3±0.0.45
.1
.2
.6 ±13.054.0 ±12.4
183169
00
11
6565
0.08
.6 ±29.8
.8 ±29.10.25
.9 ±0.1
.9±00.44
.7±0
.8±00.11
.3 ±2
.3 ±20.86
.1
.1
.2
.0
.1
Data are means ± SH. Because multiple paired comparisons were made for each endpoint, only P < 0.05/m, where m was the number of comparisons for that spe-cific endpoint, were considered significant.
17,52 DIABETES CARE, VOLUME 19, NUMBER 11, NOVEMBER 1996
Dow
nloaded from http://diabetesjournals.org/care/article-pdf/19/11/1249/444415/19-11-1249.pdf by guest on 15 M
arch 2022
Malerbi and Associates
Table 5—Effects of the high-sucrose and high-starch diets
Day14 28
Fasting plasma glucose (mmol/l)Starch dietSucrose dietP
Postprandial plasma glucose (mmol/1)Starch dietSucrose dietP
Cilycosylated protein (%)Starch dietSucrose dietP
Fasting serum cholesterol (mmol/1)Starch dietSucrose dietP
Fasting serum LDL cholesterol (mmol/1)Starch dietSucrose dietP
F'asting serum HDL cholesterol (mmol/1)Starch dietSucrose dietP
F'asting serum triglycerides (mmol/1)Starch dietSucrose dietP
Postprandial serum triglycerides (mmol/1)Starch dietSucrose dietP
F'asting plasma insulin (pmol/1)Starch dietSucrose dietP
Postprandial plasma insulin (pmol/1)Starch dietSucrose dietP
F'asting plasma C-peptide (nmol/1)Starch dietSucrose dietP
Postprandial plasma C-peptide (nmol/1)Starch dietSucrose dietP
Body weight (kg)Starch dietSucrose dietP
7.3 ±0.46.8 ±0.3
0.18
7.6 ±0.37.4 ±0.3
0.31
2.5 ±0.12.7 ±0.2
0.19
5.1 ±0.35.0 ±0.2
0.31
3.4 ±0.23.4 ±0.2
0.47
1.0 ±0.11.0 ±0.1
0.41
1.3 ±0.11.4 ±0.1
0.11
2.2 ±0.12.3 ±0.1
0.25
61.8 ±12.158.2 ±11.7
0.34
187.8 ±28.2176.4 ±22.9
0.21
0.8 ±0.10.8 ±0.1
0.48
1.7 ±0.11.5 ±0.1
0.13
65.5 ±2.165.9 ±2.0
0.39
7.0 ±0.26.8 ±0.2
0.21
7.1 ±0.37.7 ±0.4
0.06
5.1 ±0.25.3 ±0.2
0.07
3.3 ±0.23.5 ±0.2
0.07
1.0 ±0.11.0 ±0.1
0.36
1.4 ±0.11.5 ±0.1
0.21
2.4 ±0.12.5 ±0.2
0.30
63.0 ±10.254.0 ± 10.0
0.17
202.8 ±41.8204.6 ±27.4
0.47
0.8 ±0.10.7 ±0.1
0.08
1.7 ±0.21.8 ±0.1
0.40
65.4 ±2.065.9 ±2.1
0.04
7.2 ± 0.37.5 ± 0.3
0.09
7.6 ± 0.38.1 ±0.4
0.10
2.6 ±0.12.7 ± 0.2
0.26
5.1*0.25.1 ±0.2
0.36
3.4 ± 0.23.5 ±0.2
0.12
1.0 ±0.11.0 ±0.1
0.19
1.3 ±0.11.4 ±0.1
0.17
2.3 ±0.12.3 ±0.1
0.32
65.3 ± 2.066.0 ±2.1
0.26
183.6 ± 29.8192.0 ± 37.8
0.40
0.9 ±0.10.8 ±0.1
0.10
1.7 ±0.11.8 ±0.1
0.23
65.3 ± 2.066.0 ±2.1
0.04
Data arc means ± SH. Because multiple paired comparisons were made for each endpoint, only P < 0.05/m, where m was the number of comparisons lor that spe-cific endpoint, were considered significant.
DlABMh.S CARH, VOLUME 1 9 , NUMBER 1 1 , NOVEMBER 1 9 9 6 1253
Dow
nloaded from http://diabetesjournals.org/care/article-pdf/19/11/1249/444415/19-11-1249.pdf by guest on 15 M
arch 2022

Dietary sucrose and fructose in type H diabetes
or glycosylated protein (2.6 ± 0.2 vs. 2.5 ±0.1%, P = 0.34).
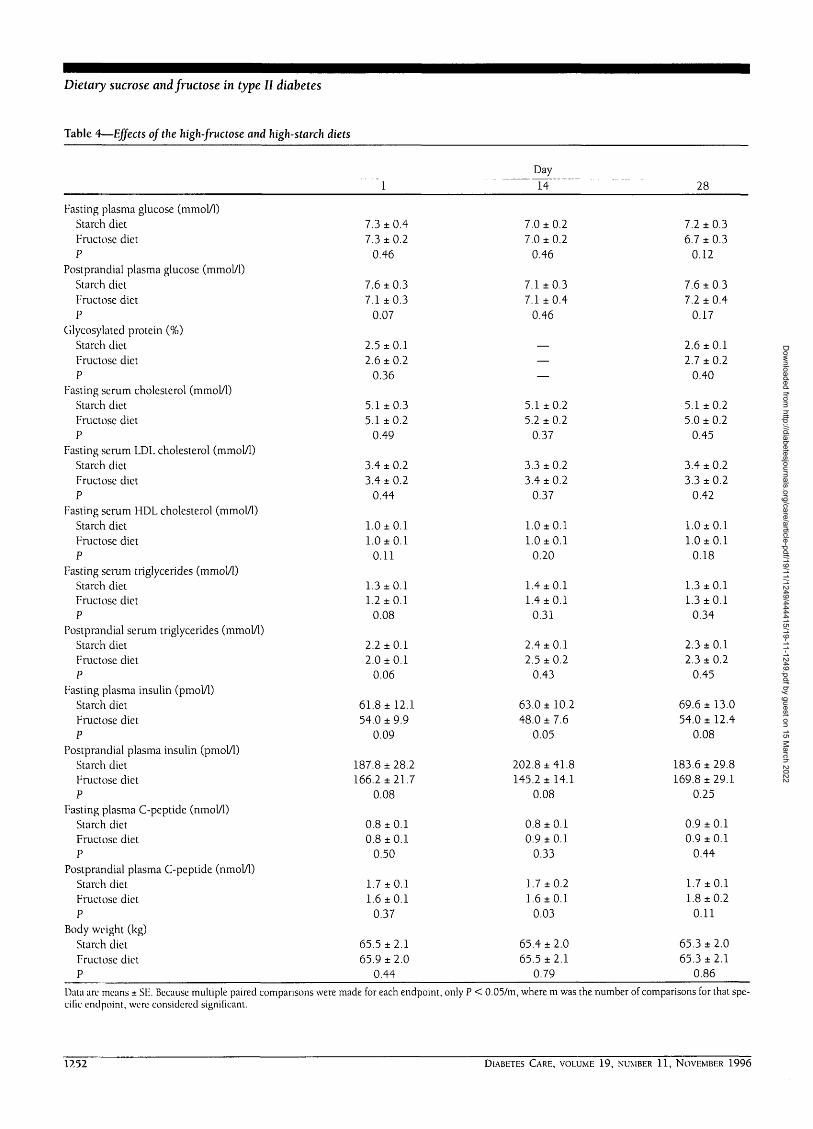
The effects of the three study diets aresummarized in Tables 4 and 5. The post-prandial values are means between afterlunch and after dinner.
The values for fasting glucose duringthe high-fructose and high-starch dietswere similar on days 1 and 14 and slightlylower in the former on day 28, but with-out statistical difference (P = 0.12). Post-prandial glucose was lower during thehigh-fructose diet than during the high-starch diet on days 1 and 28, but the dif-ferences also lacked statistical significance(P = 0.07 and 0.17, respectively). Onlythree patients had glycosuria during all thestudy: patient 9 had 1.33, 1.35, and 1.30g/24 h on days 1, 14, and 28, respectivelyof the high-starch diet; patient 10 had 5.4g/24 h on day 28 of the high-fructose diet;and patient 11 had 0.5 g/24 h on day 1 ofthe same diet. The glycosylated proteinvalues during the high-fructose diet weresimilar to the corresponding ones duringthe high-starch diet.
No significant differences wereobserved between the high-fructose andhigh-starch diets, both at baseline andsubsequently, regarding fasting total, HDL,and LDL cholesterol or triglyceride. Also,no differences were noted in postprandialtriglyceride.
The values for fasting and postpran-dial insulin during the high-fructose diettended to be lower on all test days than thecorresponding ones during the high-starch diet, but these differences did notachieve statistical significance. Fasting andpostprandial C-peptide levels were verysimilar during the high-fructose and thehigh-starch diets.
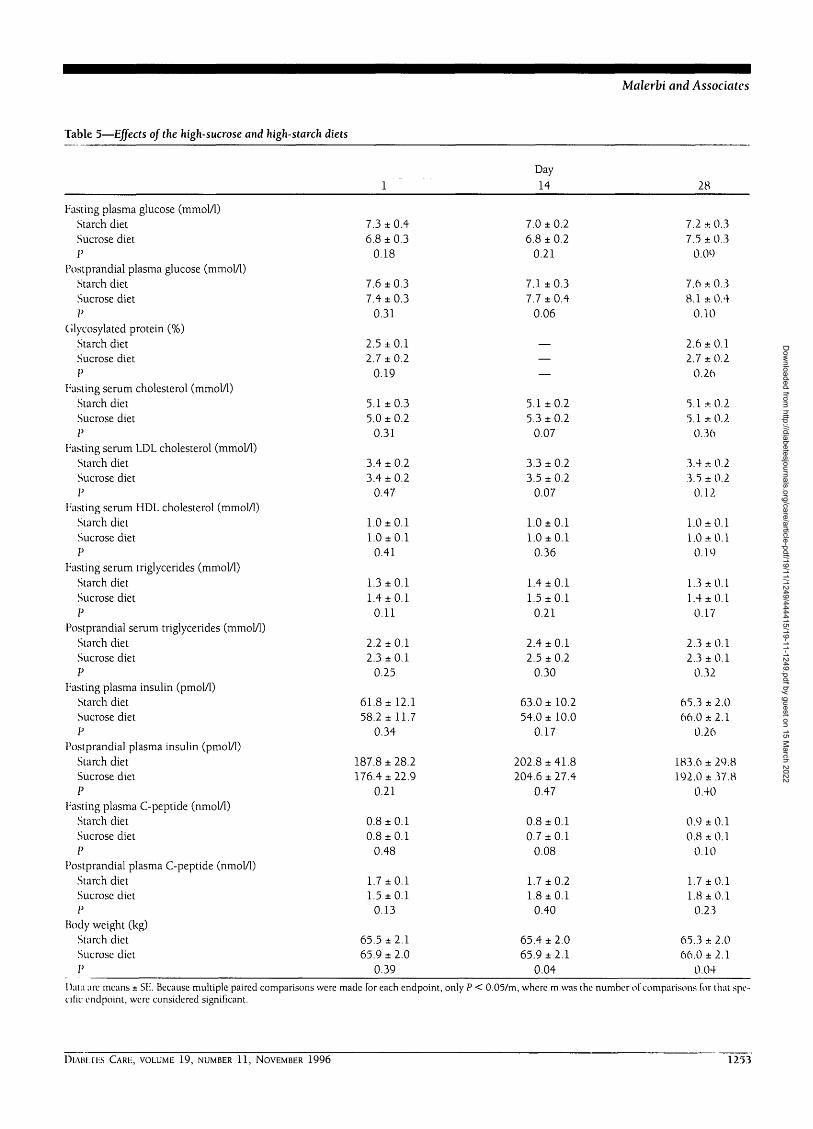
Comparing the high-sucrose and thehigh-starch diets, no significant changes infasting or postprandial glucose levels, gly-cosylated protein, or 24-h glycosuria weredisclosed. Fasting glucose was slightlyhigher on day 28 of the high-sucrose dietthan in the control high-starch diet, thesame tendency being observed for post-prandial glucose on days 14 and 28.
No significant differences wereobserved between the high-sucrose andhigh-starch diets in fasting total, HDL, orLDL cholesterol, and fasting and postpran-dial triglyceride, either at baseline or sub-sequently. Fasting total and LDL choles-terol were slightly higher with the high-sucrose than with the high-starch diet onday 14, without statistical difference.
Fasting and postprandial insulin andC-peptide levels were very similar betweenthe high-sugar and the high-starch diets,without any significant differences.
CONCLUSIONS— Establishing theideal proportion and kind of dietary car-bohydrate and matching the results ofresearch in this field with an individual-ized approach based on treatment goalsand patients lifestyle are at present amongthe most relevant issues in the nutritionalmanagement of diabetes.
In this study, 16 type II diabeticpatients were followed up for an 18-weekperiod, during which they consumed threestrikingly different diets regarding the typeof carbohydrate supplied. By keeping themin their normal living situations through-out the study we aimed at approaching asclosely as possible the usual conditions ofoutpatient management. Compliance withthe dietary instructions is obviously moredifficult to assess in this case, and that isthe greatest limitation of this kind of exper-imental protocol. However, by havingcomplied with all the other aspects of treat-ment, maintained stable weight, and keptappropriate food records, the patients gavesufficient evidence of having followed ourdietary instructions.
When consuming a diet with nearly60 g/day of fructose (20% of the total calo-ries) for 28 days, our patients had aglycemic control and lipid profile indistin-guishable from those observed with a con-trol starch diet. Indeed, the small, non-significant, reduction in postprandialglycemia with the high-fructose diet mighteven suggest a trend toward an improvedglucose metabolism. This amount of fruc-tose largely exceeds the usual intake,which is normally about 24 g, or 6% of thedaily caloric intake (29).
From a theoretical standpoint, fruc-tose might be considered beneficial fordiabetic patients. It is more slowlyabsorbed from the gastrointestinal tractthan glucose (30), is rapidly taken up andconverted into the liver to glycogen,triglycerides, and CO2 (31), is sweeterthan sucrose, and its initial metabolism isindependent of insulin action. The major-ity of the studies focusing on the influenceof dietary fructose on the glucose metabo-lism of diabetic patients have demon-strated either beneficial or neutral effects(4,5,8,12,32-37). The long-term studies,although limited in number, have shownan absence of detrimental effects of fruc-
tose on the carbohydrate metabolism,whereas in the short term the beneficialeffects are more easily observed.
Regarding lipid metabolism, there hasbeen some concern about the occurrenceof detrimental effects of high-fructose dietsin diabetic patients (35,36), despite bulkyevidence against it (8,32-34,37-39). As amatter of fact, the increase in fastingtriglycerides observed by Grigoresco et al.(36) when supplementing fructose for 2months to diabetic subjects may not havebeen related to fructose itself, as it was notstatistically different from that which alsooccurred with their control starch diet. Onthe other hand, Bantle et al. (35) foundincreased fasting total and LDL cholesterollevels after giving a high-fructose diet to18 diabetic patients in a protocol very sim-ilar to ours. However, their group ofpatients was different from ours, as 60% ofthem were being treated with insulin (1/3had type I diabetes) and their metaboliccontrol was not as good.
In the current study the high-fructosediet did not cause significant changes infasting or postprandial plasma insulin andC-peptide, although there has been a ten-dency toward lower insulin levels thanwith the high-starch diet during the wholetest period. The data in the literature agreewith the lack of effect of high-fructose dietson either (3-cell secretory capacity (35),insulin binding to receptors (32,36), orinsulin sensitivity (12) in diabetic patients.The tendency we observed toward the low-ering of insulin with the high-fructose dietmight be explained by the decreaseddependence of fructose metabolism frominsulin, but it has not been previouslyreported and needs further confirmationfrom other long-term studies.
After decades of instructing diabeticpatients to avoid carbohydrate in allforms, associations of diabetes all over theworld have been advocating a high-carbo-hydrate diet and flexible nutrition plans tomake the diabetic diet more palatable. Ourdata demonstrated that a diet containingalmost 80 g sucrose/day, which comprised19% of its total energy, did not cause anychange in glycemic control, serum lipidlevels, or insulin and C-peptide secretionwhen compared with a diet deriving car-bohydrate energy primarily from polysac-charides. For comparison, it should benoted that the average daily per capitaconsumption of sucrose is 41 (9% of totalcaloric intake) and 60 g in the U.S. andBrazil, respectively (29,40).
1254 DIABETES CARE, VOLUME 19, NUMBER 11, NOVEMBER 1996
Dow
nloaded from http://diabetesjournals.org/care/article-pdf/19/11/1249/444415/19-11-1249.pdf by guest on 15 M
arch 2022

Malerhi and Associates
These results are in accordance withan array of former studies showing thatdiabetic subjects fed sucrose either as asingle nutrient (2), as part of a meal (5-7),or as part of a nutrition plan, both inshort- (8) and middle-terms (9-11), haveno worsening of glucose or lipid metabo-lism in comparison with isocaloric feedingof starch-containing foods. Based on thesedata, all the literature agrees that sucroseper se does not adversely affect diabetescontrol and that individuals with diabetesmay be allowed to include it in their mealswithout deleterious effects. Indeed, thepresent recommendations of the AmericanDiabetes Association state that "restrictionof sucrose in the diabetic diet because ofconcern about adverse effects on glycemiacan no longer be justified" (3).
However, there is still some contro-versy as to the potential adverse effects ofdietary sucrose on the lipid metabolism ofdiabetic patients. For instance, Coulston etal. (41) found higher diurnal plasma glu-cose concentrations and increased fastingplasma cholesterol, fasting plasma triglyc-erides, and day-long plasma triglycerideswhen feeding type II diabetic subjects adiet containing 16% of its total energy fromsucrose for 15 days, as compared with a1% sucrose reference diet. The statisticalpower to detect the effects of dietarysucrose was limited by the small number ofpatients used in this study, which in addi-tion may have lacked adequate experimen-tal control over possible beneficial effects ofother sugars present in the low-sucrose ref-erence diet, which comprised 57% of thecarbohydrate calories and have not beenidentified by the authors.
There has been a trend for these lipideffects to appear by the 2nd week of ourstudy with both high-sugar diets, particu-larly the high-sucrose one, although no sta-tistical differences were disclosed. The lipidchanges after a sudden increase in dietarycarbohydrates have already been largelyreported in the literature (42). This effect iscaused by enhanced synthesis of triglyc-cride and VLDL by the liver (43), which isgenerally maximal by the 2nd week (44).Although the persistence of this effect overprolonged time has already been reported(45), most studies have shown its transi-tory nature, probably due to a mechanismof hepatic adaptation (46).
Our data showed that in well-con-trolled, normolipidemic, nonobese type IIdiabetic patients, substitution of up to 20%of daily calories as sucrose or fructose from
starch has no significant consistent effecton blood glucose control or serum lipids.This evidence may eventually represent amove toward a higher dietary flexibility, atleast in patients with this clinical profile.However, irrespective of further validationimposed by our conservative statisticalapproach and limited study's duration,caution should be warranted even inpatients with these characteristics, consid-ering the individual variability of metabolicparameters used to evaluate dietary modi-fications and to avoid the potential dangerof adding calories from sugar-containingfoods, instead of substituting them. On theother hand, it would also be appropriate toconsider the consequences of not liberaliz-ing sugar. Many studies are now showingthe inverse relationship between sugar andfat in normal and diabetic diets. In prac-tice, low-sugar diets are generally higher infat and vice-versa (47,48), and a low-sugar,high-fat diet may be more dangerous thanthe reverse.
Acknowledgments— This work was par-tially supported by CAPES-MEd and COPER-SUCAR.
We wish to thank Drs. Maria ElizabeteMendes and Daniel Giannella Neto for labora-tory support; Dr. Daniel O. Vera for help withdata collection; Drs. Nairn Savaia, Elide Lima,and Fani Malerbi for statistical advice; and Mr.Dietrich Quast for his valuable suggestions.
References
1. Jenkins DJA, Wolever TMS, Taylor RH,Barker H, Fielden H, Baldwin JM, BowlingAC, Newman HC, Jenkins AL, Goff DV:Glycemic index of foods: a physiologicalbasis for carbohydrate exchange. Am] ClinNutr 34:362-366, 1981
2. Jenkins DJA, Wolever TMS, Jenkins AL,Josse RG, Wong GS: The glycaemicresponse to carbohydrate foods. Lancetii:388-391, 1984
3. Franz MJ, Horton ES, Sr., Bantle JP, BeebeCA, Brunzell JD, Coulston AM, Henry RR,Hoogwerf BJ, Stacpoole PW: Nutritionprinciples for the management of diabetesand related complications. Diabetes Care17:490-518, 1994
4. Crapo PA, Kolterman OG, Olefsky JM:Effects of oral fructose in normal, diabetic,and impaired glucose tolerance subjects.Diabetes Care 3:575-581, 1980
5. Bantle JP, Laine DC, Castle GW, ThomasJW, Hoogwerf BJ, Goetz FC: Postprandialglucose and insulin responses to mealscontaining different carbohydrates in nor-mal and diabetic subjects. N Engl J Med
309:7-12, 19836. Slama G, Jean-Joseph P, Goicolea 1,
Elgrable F, Haardt MJ, Costagliola D, Bor-net F, Tchobroutsky G: Sucrose taken dur-ing mixed meals has no additional hyper-glycaemic action over isocaloric amountsof starch in well-controlled diabetics.Lancet ii: 122-125, 1984
7. Bornet F, Haardt MJ, Costagliola D, BlayoA, Slama G: Sucrose or honey at breakfasthave no additional acute hyperglycaemieeffects over an isoglucidic amount of breadin type 2 diabetic patients. Dicihetolo ci28:213-217, 1985
8. Bantle JP, Laine DC, Thomas JW: Meta-bolic effects of dietary fructose and sucrosein type I and II diabetic subjects. JAMA256:3241-3246, 1986
9. Abraira C, Derler J: hirge variations ofsucrose in constant carbohydrate diets intype II diabetes. Am] Med 84:N.V-P.OO,1988
10. Bantle JP, Swanson JE, Thomas W UuneDC: Metabolic effects of dietary sucrose intype II diabetic subjects. Diufvtt's Cure16:1301-1305, 1993
11. Peterson DB, Uunbert J, Gerring S, DarlingP, Carter RD, Jelfs R, Mann J I: Sucrose inthe diet of diabetic patients—-just anothercarbohydrate? Diabetobgia 29: 216-220,1986
12. Thorburn AW, Crapo PA, Griver K, Wal-lace P, Henry RR: Long-term effects ofdietary fructose on carbohydrate metabo •lism in NIDDM. Metabolism 39:58-63,1990
13. Simpson HCR, Simpson RW, l.ousley S: Ahigh carbohydrate leguminous libre dietimproves all aspects of diabetic control.Lancet i: 1-5, 1981
14. Akgiin S, Ertel NH: The effects of sucrose,fructose, and high-fructose com syrupmeals on plasma glucose and insulin innon-insulin-dependent diabetic subjects.Diabetes Care 8:279-283, 1985
15. Coulston AM, Hollenbeck CB, SwislockiALM, Chen Y-DI, Reaven GM: Deleteriousmetabolic effects of high-carbohydrate,sucrose-containing diets in patients withnon-insulin-dependent diabetes mellitus.Am J Med 82:213-220, 1987
16. Nikkila EA, Kekki M: Effects of dietaryfructose and sucrose on plasma triglyc-eride metabolism in patients with endoge-nous hypertriglyceridemia. Acta Med Stand542:221-227, 1972
17. Hallfrisch J, Reiser S, Prather ES: Bloodlipid distribution of hyperinsulinemie menconsuming three levels of fructose. Am /Clin Nutr 37:740-748, 1983
18. Reiser S, Powell AS, Scholfield DJ, Panda \]Ellwood KC: Blood lipids, lipoproteins,apoproteins, and uric acid in men fed dietscontaining fructose or high-amylose corn-starch. Am] Clin Nutr 49:832-839, 1989
19. National Diabetes Data Group: Classitiea-
DIABETES CARE, VOLUME 19, NUMBER 11, NOVEMBER 1996 1255
Dow
nloaded from http://diabetesjournals.org/care/article-pdf/19/11/1249/444415/19-11-1249.pdf by guest on 15 M
arch 2022

Dietary sucrose and fructose in type II diabetes
tion and diagnosis of diabetes mellitus andother categories of glucose intolerance.Diabetes 28:1039-1057, 1979
20. U.S. Department of Agriculture HumanNutrition Information Service: Compositionof Foods. Raw, Processed, Prepared. Agricul-ture Handbook no. 8, series 1-15. Revised1976-1987
21. I lardinge MG, Swarner JB, Crooks H: Car-bohydrates in foods. J Am Dietetic Assoc46:197-204, 1965
22. Trinder P: Determination of glucose inblood using glucose oxidase with an alter-native oxygen acceptor. Am Clin Biochem6:24-27, 1969
2 3. Siedel J, 1 lagele EO, Ziegenhorn J, Wahle-feld AW: Reagent for enzymatic determi-nation of serum total cholesterol withimproved lipolytic efficiency. Clin Chem29:1075-1080,1983
24. Friedewald WT, Levy RI, Fredrickson DS:Estimation of the concentration of low-density lipoprotein cholesterol in plasmawithout use of the preparative ultracen-trifugation. Clin Chcm 18:499-502, 1972
25. Fossati P, Prencipe L: Serum triglyceridesdetermined colorimetrically with anenzyme that produces hydrogen peroxide.Clin Chem 28:2007-2080, 1982
26. Lowry OH, Rosebrough NJ, Farr AL, Ran-dall RJ: Protein measurement with folinphenol reagent. J Biol Chem 193:265-270,1951
27. Trivelli LA, Banney HM, Lai HT: Hemoglo-bin components in patients with diabetesmellitus. NEnglJMed 284:353-357, 1971
28. Hochberg Y, Tamhane AC: Multiple Com-parison Procedures. New York, Wiley, 1987
29. Bantle JP: Clinical aspects of sucrose andfructose metabolism. Diabetes Care12:56-61, 1989
30. Niewoehner CB: Metabolic effects ofdietary vs. parenteral fructose. J Am CollNutr 5:443-450, 1986
31. Nilsson L, Hultman E: Liver and muscleglycogen in man after glucose and fructoseinfusion. Scand] Clin Lab Invest 33:5-10,1974
32. Crapo PA, Kolterman OG, Henry RR:Metabolic consequences of two-week fruc-tose feeding in diabetic subjects. DiabetesCare 9:111-119, 1986
33. Osei K, Falko J, Bosseti BM, Holland GC:Metabolic effects of fructose as a naturalsweetener in the physiologic meals ofambulatory obese patients with type II dia-betes. Am JMed 83:249-255, 1987
34. McAteer EJ, O'Reilly GO, Hadden DR: Theeffects of one month high fructose intakeon plasma glucose and lipid levels in non-insulin-dependent diabetes. Diabete Med4:62-64, 1987
35. Bantle JP, Swanson JE, Thomas W, LaineDC: Metabolic effects of dietary fructose indiabetic subjects. Diabetes Care15:1468-1476, 1992
36. Grigoresco C, Rizkalla SW, Halfon P, Bor-net F, Fontvielle AM, Bros M, Dauchy F,Tchobroutsky G, Slama G: Lack ofdetectable deleterious effects on metaboliccontrol of daily fructose ingestion for 2months in NIDDM patients. Diabetes Care11:546-550, 1988
37. Anderson JW, Story LJ, Zettwoch NC,Gustafson NJ, Jefferson BS: Metaboliceffects of fructose supplementation in dia-betic individuals. Diabetes Care12:337-344, 1989
38. Thorburn AW, Crapo PA, Beltz WF, Wal-lace P, Witztum JL, Henry RR: Lipidmetabolism in non-insulin dependent dia-betes: effects of long-term treatment withfructose-supplemented mixed meals. Am]Clin Nutr 50:1015-1022, 1989
39. Hollenbeck CB: Dietary fructose effects onlipoprotein metabolism and risk for coro-nary artery disease. Am J Clin Nutr 58(Suppl. l):800S-809S, 1993
40. Tudisco ES: Prevalencia de diabetes melli-tus no municipio de Sao Paulo: aspectosnutricionais e alimentares. Doctoral thesis.Universidade Federal de Sao Paulo. SaoPaulo, Brazil, 1993
41. Coulston AM, Hollenbeck CB, DonnerCC, Williams R, Chiou Y-AM, Reaven GM:Metabolic effects of added dietary sucrosein individuals with noninsulin-dependentdiabetes mellitus. Metabolism 34:962-966,1985
42. Harris WS, Connor WE, Inkeles SB, llling-worth DR: Dietary omega-3 fatty acidsprevent carbohydrate-induced hyper-triglyceridemia. Metabolism 33:1016-1019, 1984
43. Ruderman ND, Johns A, Krauss RM, ShafrirE: A biochemical and morphologic study ofvery low density lipoproteins in carbohy-drate-induced hypertriglyceridemia. J ClinInvest 50:1355-1368,1971
44. Jellish WS, Emanuele MA, Abraira C:Graded sucrose/carbohydrate diets inovertly hypertriglyceridemic diabeticpatients. Am JMed 77:1015-1022, 1984
45. Coulston AM, Hollenbeck CB, SwislockiALM, Reaven GM: Persistence of hyper-triglyceridemic effect of low-fat high-car-bohydrate diets in NIDDM patients. Dia-betes Care 12:94-101, 1989
46. Ullmann D, Connor WE, Hatcher LF, Con-nor SL, Flavell DP: Will a high-carbohy-drate, low-fat diet lower plasma lipids andlipoproteins without producing hyper-triglyceridemia? Artenosclcr Thromb11:1059-1067, 1991
47. Gibney M, Sigman-Grant M, Stanton JL,Keast DR: Consumption of sugars. Am JClinNutr 62 (Suppl. 1):178S-194S, 1995
48. Humphreys M, Cronin CC, Barry DG, Fer-riss JB: Are the nutritional recommenda-tions to insulin-dependent diabeticpatients being achieved? Diabetic Med11:79-84, 1993
1256 DIABETES CARE, VOLUME 19, NUMBER 11, NOVEMBER 1996
Dow
nloaded from http://diabetesjournals.org/care/article-pdf/19/11/1249/444415/19-11-1249.pdf by guest on 15 M
arch 2022