merck: refocusing research and...
TRANSCRIPT

Merck: Refocusing Research and Development
April 25, 2003 Ji Chong Helane Crowell Stacy Kend
Prepared for: Merck & Co
1
Table of Contents
Executive Summary . . . . . . . . . . . . . . . . . . . . . . . . . . . . . . . . . . . . 02 Financials
Company Profile . . . . . . . . . . . . . . . . . . . . . . . . . . . . . . . . . . . 03 Analysis . . . . . . . . . . . . . . . . . . . . . . . . . . . . . . . . . . . . . . . . . 04
Five Forces Analysis
Market Definition . . . . . . . . . . . . . . . . . . . . . . . . . . . . . . . . . . . 07 Internal Rivalry . . . . . . . . . . . . . . . . . . . . . . . . . . . . . . . . . . . . 08 Entry . . . . . . . . . . . . . . . . . . . . . . . . . . . . . . . . . . . . . . . . . . . 10 Substitutes and Complements . . . . . . . . . . . . . . . . . . . . . . . . . . 11 Buyer and Supplier Power . . . . . . . . . . . . . . . . . . . . . . . . . . . . . 12 Conclusion . . . . . . . . . . . . . . . . . . . . . . . . . . . . . . . . . . . . . . . . 12
Strategy
Current Outlook . . . . . . . . . . . . . . . . . . . . . . . . . . . . . . . . . . . . 13 Recommendation . . . . . . . . . . . . . . . . . . . . . . . . . . . . . . . . . . . 13
Appendix Selected Financial Data . . . . . . . . . . . . . . . . . . . . . . . . . . . . . . . 16
Endnotes . . . . . . . . . . . . . . . . . . . . . . . . . . . . . . . . . . . . . . . . . . . . . 17

2
Executive Summary
Currently, Merck and its competitors in the pharmaceutical industry find themselves at the tail end of a patent cycle with declining sales for drugs that have lost patent protection and several brand-name drugs nearing the end of their patents. Analysts’ consensus is that the rate of growth in the pharma industry as a whole is down, hurt by poor overall economic conditions and an industry-wide temporary gap in new drug releases to replace drugs with expiring patents. Right now, Merck’s top-selling drugs are in the following therapeutic categories: ?? Atherosclerosis (Zocor) ?? Hypertension / Heart Failure (Cozaar, Hyzaar) ?? Anti- inflammatory / Analgesics (Vioxx, Arcoxia) ?? Osteoporosis (Fosamax) ?? Respiratory (Singulair)
In 2001, the ten therapeutic categories with the most sales and double-digit growth were: ?? Antidepressant ?? Antiulcerant ?? Cholesterol Reducer ?? Antiarthritic ?? Antihypertensive ?? Narcotic Painkiller ?? Oral Diabetes ?? Oral Antihistamine ?? Antiseizure ?? Antipsychotic Blaisdell Consulting believes that Merck can improve its success in the market by refocusing its development of new drugs to target the therapeutic categories with highest sales and growth.

3
Financials Company Profile
Merck & Co., Inc. is a global research-driven pharmaceutical company with two lines of business: Merck Pharmaceutical, which develops and markets human and animal health care products, primarily therapeutic and preventive agents for the treatment of human disorders; and Medco Health Solutions, Inc., a pharmaceutical benefits management firm. Merck’s primary strategic focus is on their pharmaceutical segment, which is characterized by high net margins of 32%, rather than Medco, which has margins of only about 1%. i Within the pharmaceutical segment, the bulk of Merck’s sales and profits come from five key drugs: Zocor, Vioxx, Cozaar/Hyzaar, Fosamax, and Singulair. Merck announced plans in January 2002 to spin-off Medco Health (formerly named Merck-Medco) some time in the middle of the year. Due to poor market conditions in July, the expected IPO was postponed. Subject to market conditions, Merck still expects to establish Medco as a separate company in 2003. Merck’s business operations also include external alliances, including joint ventures and targeted acquisitions. Its largest deal this year was a roughly $1.5 billion tender offer for the remaining 49% of common stock of its Japanese subsidiary, Banyu. Its joint ventures include arrangements to research, develop, and market pharmaceuticals, including nonprescription and animal drugs, with AstraZeneca, Johnson & Johnson, Aventis Pasteur, Aventis, and Schering-Plough.

4
Analysis As of April 17, 2003, Merck’s stock price was $55.89. With 2.24 million shares outstanding, Merck’s market capitalization was about $125.4 million. In the past year, Merck’s stock price fell over 30% from $59.45 on February 11, 2002 to a low of $38.50 in late July. Since then, Merck’s stock has recovered to trade in the low to mid $50 range. The following chart comparing Merck’s stock price history to the Dow Jones Industrial Average over the last 52 weeks suggest that the steep drop in price in July was largely a reflection of a market-wide downturn.

5
In the subsequent recovery period, Merck has outpaced both the market in general and its top two competitors (in terms of sales), Pfizer and GlaxoSmithKline.
Merck’s financial summaries from the past five years demonstrate a solid financial footing. However, growth has slowed in the past two years. Net income increased by an average of 13.9% from 1997 to 2000 but only increased by 6.7% in 2001. A likely explanation is the recent expiration of patents on several of Merck’s medicines including Mevacor, Vasotec, Vaseretic, Pepcid, Prinivil, and Prinzide. Over half of Merck’s 2001 sales were generated by Medco, the company’s pharmaceuticals benefits management (PBM) section. The majority of sales from its core prescription pharmaceuticals business occurred in only six categories of medicines that include Merck’s primary, high margin drugs (net margins of 32%): Cozaar/Hyzaar (hypertension/heart

6
failure), Fosamax (osteoporosis), Singulair (respiratory), Vioxx (anti-inflammatory/analgesics), and Zocor (atherosclerosis). Calculation of several basic ratios shows relative financial stability in Merck. Return on assets (ROA) calculated in Merck’s 10-K report shows only a slight downward trend of just over 1% from 18.5 to 17.3%. The other ratio calculated in their statement is net profit margin, which has fallen 4% over the past five years to 15.3%. This may reflect an increasing proportion of sales from the Medco business, which has net margins of only about 1%. Return on equity (ROE), which measures the profits accruing to shareholders per dollar of contributed equity and is defined as net income divided by total equity, increased from 0.37 in 1997 to 0.45 in 2001, hitting a peak at 0.46 in 2000. The long-term debt to capital ratio has increased significantly in the past two years from 6.0% in 1999 to 15.4% in 2000 and 18.7% in 2001.
R&D Expenditures
---------------- ($ in millions) Year Total R&D Expenditures ---- ----------------------
1992 $1,112 1993 1,1731994 1,2311995 1,3311996 1,4871997 1,6841998 1,8211999 2,0682000 2,344
As the table shows, Merck continues to increase the budge t for R&D, strengthening the prospects for Merck’s continued growth through pharmaceuticals. Several new entries including Zetia (cholesterol), EMEND (chemotherapy induced nausea), and Arcoxia (anti- inflammatory/analgesics) already show promise to improve Merck’s position in the market.
2001 2,456

7
Five Forces Analysis Market Definition
Merck Pharmaceutical is defined in the Standard Industrial Classification (SIC) Index as belonging to Pharmaceutical Preparations, 2834. ii Under the newer North American Industry Classification System (NAICS), Merck Pharmaceutical’s market is defined as Pharmaceutical Preparation Manufacturing, 325412.iii Medco Health’s market is defined by SIC as #6324, Hospital and Medical Service Plans.iv Medco’s market is defined by NAICS as 524292, Third Party Administration of Insurance and Pension Funds.v In the pharmaceutical division, the market is defined to be the sale of prescription drugs. Within the prescription drug market however, Merck is primarily focused on researching and developing new or improved versions of existing drugs that are patent-protected. The patent protection gives Merck and its competitors the ability to set prices higher than marginal costs and thus enjoy high margins on its products while the patents last. Once the patents expire, prices and volume of sales drop considerably and so to maintain growth, continued research and development of new drugs is necessary.

8
Internal Rivalry According to data compiled by IMS Health, global sales for pharmaceuticals grew eight percent in 2002 to $400.6 billion. vi This represents a slow-down from 12% growth in 2001 and 10% growth in 2000. Graham Lewis, IMS Vice President, Strategic Global Solutions, attributed the slower rate of growth to poorer general economic conditions and a “lower-than-normal number of new product introductions.”vii Lewis does not interpret the slower rate of growth as a sign of real trouble for the industry since aging populations and the “ongoing demand for innovative therapies” should sustain the industry’s future growth. Within the pharmaceutical market that is still growing an average of 10% per year, there is a fair degree of concentration. As the following table shows, the top ten pharmaceutical companies had a combined $105 billion in U.S. prescription sales in 2001, representing 61% of the total sales of $172 billion.
Top 10 Pharmaceutical Companies by U.S. Prescription Sales in 2001 Wholesale prices, sales include prescription products only, insulin products included Source: IMS Retail and Provider Perspective™
2001 Sales (US$ Billions)
% Growth Year-Over-Year
1 Pfizer 17.6 13.9 2 GlaxoSmithKline 15.5 22.1 3 Merck & Co. 12.5 15.1 4 Johnson & Johnson 10.9 29.4 5 Bristol-Myers Squibb / Dupont
10.5 10.2
6 AstraZeneca 10.1 16.7 7 Lilly 7.6 8.1 8 Wyeth (formerly American Home Products)
7.0 17.8
9 Novartis 6.8 19.0 10 Pharmacia 6.5 17.2 Total 105.0 16.9
The figures above reflect 53 weeks of U.S. sales data instead of 52 weeks, an adjustment that is made every five years to bring IMS’s data tracking methodology into line with the calendar year. As a result, U.S. dollar figures in this table incorporate five additional days of sales.
Although figures for global sales by corporation were not publicly available, the top ten companies in the US is an appropriate proxy since the North American market now makes up 51% of the global market, up from 40.2% in 1999.viii Furthermore, the US accounts for roughly 95% or more of the $203.6 billion in 2002 North American prescription sales. ix Europe accounted for 25% of remaining sales with 22% from European Union countries; Japan for 12%; Asia, Africa, and Australia for eight percent and Latin America for the final four percent.

9
A February 2002 IMS Global ranking of the top pharmaceutical companies confirms our expectations, although there are some changes in rank ordering. Only Wyeth (formerly American Home Products) no longer makes the top ten and is replaced by Aventis.
Top Corporations Source: IMS Health, IMS Drug Monitorx
1 Pfizer 2 GlaxoSmithKline 3 Merck & Co. 4 AstraZeneca 5 Bristol-Myers Squibb 6 Novartis 7 Johnson & Johnson 8 Pharmacia Corp 9 Aventis 10 Lilly
Since the competitiveness between pharmaceutical firms in the U.S. mirrors competitiveness in the larger global market, and we have sales data for the U.S., we can estimate concentration ratios and Herfindahl values for the industry. The four firm concentration ratio for US sales is 32.8%. The Herfindahl value is the sum of the market shares of each company squared. Here, we can make a rough estimate of Herfindahl from the known market shares of the top ten companies: Herfindahl = 10.22 + 9.02 + 7.32 + 6.32 + 5.92 + 5.92 + 4.42 + 4.12 + 4.02 + 3.82 +
(sum of rest) = 414.25 + (sum of rest) > 414.25.
These numbers tell us that in a broad sense, the pharmaceutical industry is characterized by a certain degree of concentration and market power that suggests decreased competition. However, the nature of the pharmaceutical industry mitigates these results because the specific degree of competition depends on the level of differentiation between the companies’ products in their respective therapeutic categories. Each pharmaceutical firm generally has several key drugs at any given time that are its marquee products. Currently, Merck’s top-selling drugs, which represent more than two-thirds of its worldwide pharmaceutical sales, are: ? ? Vioxx (osteoarthritis and acute pain) ? ? Cozaar / Hyzaar (high blood pressure) ? ? Fosamax (treatment and prevention of postmenopausal osteoporosis, reduce
osteoporotic fracture risk in postmenopausal women, treatment of male osteoporosis to increase bone mass, treatment of glucocorticoid- induced osteoporosis, Paget’s disease of the bone)
? ? Zocor (elevated cholesterol, associated total/coronary mortality, raise HDL cholesterol, reduce triglycerides, reduce stroke risk)
10
? ? Singulair (chronic asthma for adults and children as young as age two).
Thus, the competition between pharmaceutical companies must be determined by the amount of competition in each of the therapeutic categories into which these drugs fall. According to a National Institute for Health Care Management Research and Educational Foundation study of 2001 sales, Merck faces varying intensity of competition in the different therapeutic categories of its top drugs. In 2001, Vioxx was the #2 drug in the Antiarthritic category with 28.3% market share behind Pfizer’s Celebrex (33.4%). In the Cholesterol Reducer category, Merck was again #2 to Pfizer with Zocor’s 27.2% share to Lip itor’s 44.9%. Fosamax, however, was the #1 drug in its category, Bone Density Regulators, with 54.6% share. Of the top 50 drugs ranked in terms of 2001 sales, Pfizer led the pack with eight drugs, three of which were in the top ten. GlaxoSmithKline had six of its drugs in the top 50, two of which were in the top ten. Merck had four of its drugs in the top 50 in 2001, with two in the top ten. Lilly, Wyeth, and Bristol-Myers Squibb each had three drugs in the top 50 and a host of other pharmaceutical companies had one or two of their drugs in the top 50. TAP, Lilly, and AstraZeneca each had one drug in the top ten.
Entry
There are strong barriers to entry in the pharmaceutical industry for two essential reasons. First, the patent system essentially gives manufacturers a 20-year monopoly on the specific chemical compound of their drugs. However, drugs must undergo extensive FDA testing that takes an average of 8.5 years to complete.xi This reduces the effective patent period but manufacturers often develop new patents on an existing drug with only slight variations that can, for practical purposes, extend the patent and accompanying monopoly on the drug. By no means does a patent guarantee that a drug manufacturer’s product does not have competition. Merck’s Vioxx and Pfizer’s Celebrex are both antiarthritic drugs that reduce the other’s market share. But if a manufacturer were to produce a new breakthrough drug that far surpasses the effectiveness of existing drugs, then the drug would enjoy little competition as long as the patent lasted and no other rival company were able to produce a separate drug that does not infringe on the patent. In this case, existing patents on less effective drugs immediately lose their value.

11
The intense research and development necessary to develop new breakthrough drugs is the second strong barrier to entry. Some analysts estimate that only one in 5,000 compounds that are tested will eventually make it to the market.xii For this reason, the top pharmaceutical companies have large R&D budgets so that they can continually develop new products to maintain their profits. Merck has committed $2.9 billion to R&D for 2002 and its major competitors, #1 Pfizer and #2 GlaxoSmithKline, had respective 2001 R&D budgets of $4.8 billion and 2.4 billion pounds (roughly $3.5-3.8 billion). Merck’s R&D budget in 2002 was $2.9 billion, focusing on the following 13 therapeutic areas: ?? Arthritis ?? Asthma ?? Cancer ?? Cardiovascular (Atherosclerosis, Heart failure, Hypertension, Thrombosis) ?? Diabetes ?? Gastroenterology ?? Immunology (Allergy, Autoimmune disorders, Inflammation) ?? Infectious Diseases (Antibiotics, Vaccines) ?? Neurology (Alzheimer’s disease, Anxiety, Cognition, Depression, Pain,
Schizophrenia) ?? Obesity ?? Ophthalmology ?? Osteoporosis ?? Prostate disease
Substitutes and Complements
Besides substitution of a rival drug’s maker product, potential substitutes may be related to a broader view of the health care industry and alternative methods of treatment besides prescription drugs. It is important to note that Merck and its major competitors are not involved in the generic drug market. As patents expire, the top pharmaceutical companies eventually discontinue manufacture of their product as profit margins fall and the drugs are replaced with new compounds coming from the R&D pipeline. Again, possible complements are related more generally to outcomes in the broader health care industry. Doctor’s visits, hospital visits, etc. could be considered complements since as more patients go to visit the doctor or the hospital, consumption of prescription drugs is likely to increase since they will be prescribed more often.

12
Buyer and Supplier Power
Buyers have relatively little power since the demand for the newest quality drugs is inelastic. Obviously, given any disease or illness, consumers are likely to spend as much as necessary for cures or relief from symptoms. Suppliers also have relatively little power since the uniform inputs into the drugs should be commonly available. For example, if a recipe for a new drug calls for calcium, then there can be many suppliers to choose from for that particular ingredient. For production and R&D, pharmaceuticals typically own the required resources so they are not forced into contracts with upstream suppliers.
Conclusion
Force Threat to Profits Internal Rivalry Very High Entry Very High Substitutes and Complements Low Buyer Power Low Supplier Power Low Net Effect High

13
Strategy Current Outlook
With the patent on its top-selling drug, Zocor, and also other drugs nearing expiration in 2006, Merck faces the ever-present challenge of continuous invention in the pharma industry. In the many different categories of prescription drugs, one or two emerge as the top drugs in that category until their patents run out and generic manufacturers take deep cuts out of the market share. To maintain and increase profits, pharma firms must consistently innovate new “winning” drugs to replace those with expiring patents. Unfortunately, in the short term, analysts conclude that the R&D pipeline is weak across the board for the industry. Merck has nine drugs in its short-term pipeline, slated for approval and release by 2006. Of these nine drugs, only Emend™ has been approved by the FDA for use in the U.S. Although Emend is a promising treatment for the prevention of chemotherapy- induced nausea and vomiting, it is not expected to be a major breakthrough drug for Merck. A primary reason why Emend will not be one of the major drugs in Merck’s stable is that it is in a category of drug that has a relatively small total market. For example, Emend is not an Antidepressant, for which the total sales of all drugs in 2001 were roughly $12.5 billion. According to the NIHCM study, Antidepressants have the largest market and the next top two categories of drugs are Antiulcerants ($10.8 billion) and Cholesterol Reducers ($10 billion). Merck’s only presence in these top three categories is its drug, Zocor, in the Cholesterol Reducers category. The other drugs in Merck’s short-term pipeline are also not in these major categories except for Aprepitant, an anti-depression medicine, and an extension of their Zocor product, combining it with Zetia.
Recommendation
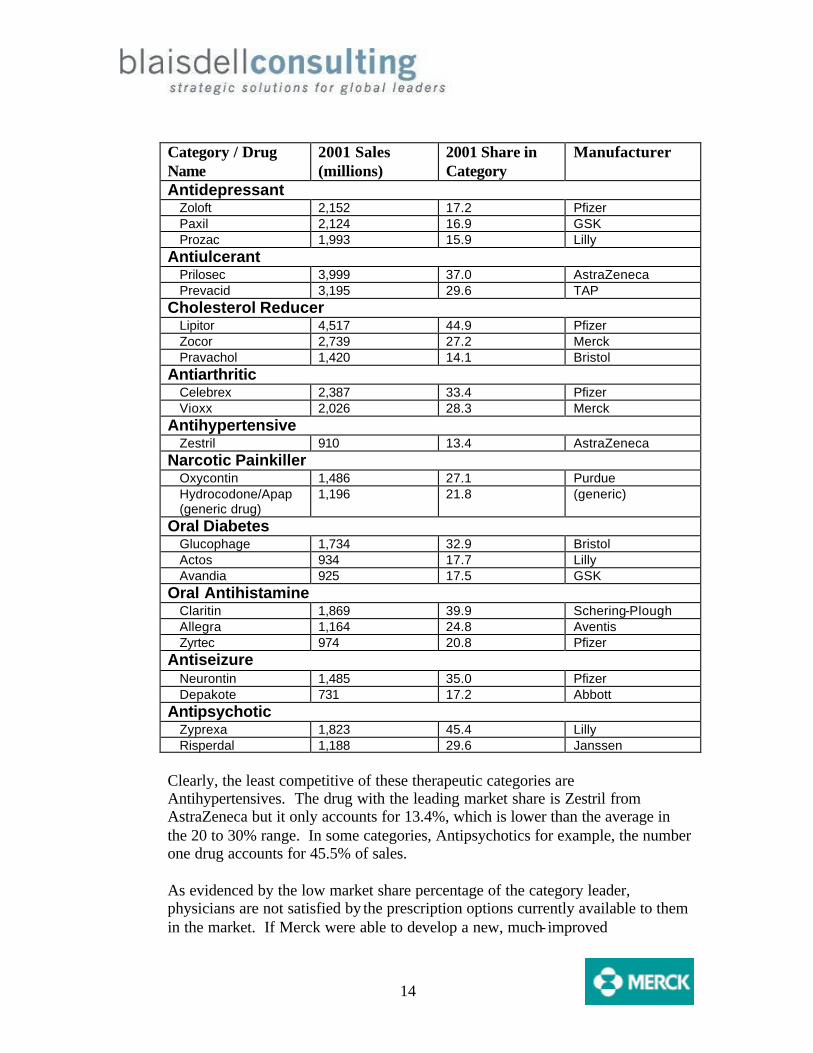
Blaisdell Consulting sees an opportunity for Merck to build on its successes by establishing itself in other therapeutic categories, which it is capable of doing because of its advances in R&D. All but one of the top ten therapeutic categories from 2001 are characterized as expected, with two or three top drugs accounting for roughly 50% or more of the market share in each category. The following table, condensed from the NIHCM study, summarizes the current situation in each category including sales of the top drugs, percent market share, and manufacturer.
14
Category / Drug Name
2001 Sales (millions)
2001 Share in Category
Manufacturer
Antidepressant Zoloft 2,152 17.2 Pfizer Paxil 2,124 16.9 GSK Prozac 1,993 15.9 Lilly
Antiulcerant Prilosec 3,999 37.0 AstraZeneca Prevacid 3,195 29.6 TAP
Cholesterol Reducer Lipitor 4,517 44.9 Pfizer Zocor 2,739 27.2 Merck Pravachol 1,420 14.1 Bristol
Antiarthritic Celebrex 2,387 33.4 Pfizer Vioxx 2,026 28.3 Merck
Antihypertensive Zestril 910 13.4 AstraZeneca
Narcotic Painkiller Oxycontin 1,486 27.1 Purdue Hydrocodone/Apap (generic drug)
1,196 21.8 (generic)
Oral Diabetes Glucophage 1,734 32.9 Bristol Actos 934 17.7 Lilly Avandia 925 17.5 GSK
Oral Antihistamine Claritin 1,869 39.9 Schering-Plough Allegra 1,164 24.8 Aventis Zyrtec 974 20.8 Pfizer
Antiseizure Neurontin 1,485 35.0 Pfizer Depakote 731 17.2 Abbott
Antipsychotic Zyprexa 1,823 45.4 Lilly Risperdal 1,188 29.6 Janssen
Clearly, the least competitive of these therapeutic categories are Antihypertensives. The drug with the leading market share is Zestril from AstraZeneca but it only accounts for 13.4%, which is lower than the average in the 20 to 30% range. In some categories, Antipsychotics for example, the number one drug accounts for 45.5% of sales. As evidenced by the low market share percentage of the category leader, physicians are not satisfied by the prescription options currently available to them in the market. If Merck were able to develop a new, much- improved

15
antihypertensive drug, they could capture a significant share of the $5.7 billion of antihypertensive medication sold in 2001. By setting the development of a new antihypertensive as one of the goals of R&D, likely incorporating previous research for Merck’s expired patent drug, Prinivil, Merck can challenge AstraZeneca in the weakly competitive Antihypertensive market. Not only does Merck have some previous experience in the Antihypertensive category, but new R&D techniques show promise to give Merck an advantage. The 2001 $540 million acquisition of the Kirkland, WA biotech company, Rosetta Inpharmatics, gave Merck instant access to the increasingly important field of biogenetics, and specifically, Rosetta’s specialized knowledge of a technique known as molecular profiling. Molecular profiling examines how tens of thousands of genes react to various circumstances, including disease and drugs. The technique can cut down on the failure rate of Merck’s R&D projects, thereby substantially reducing costs.
16
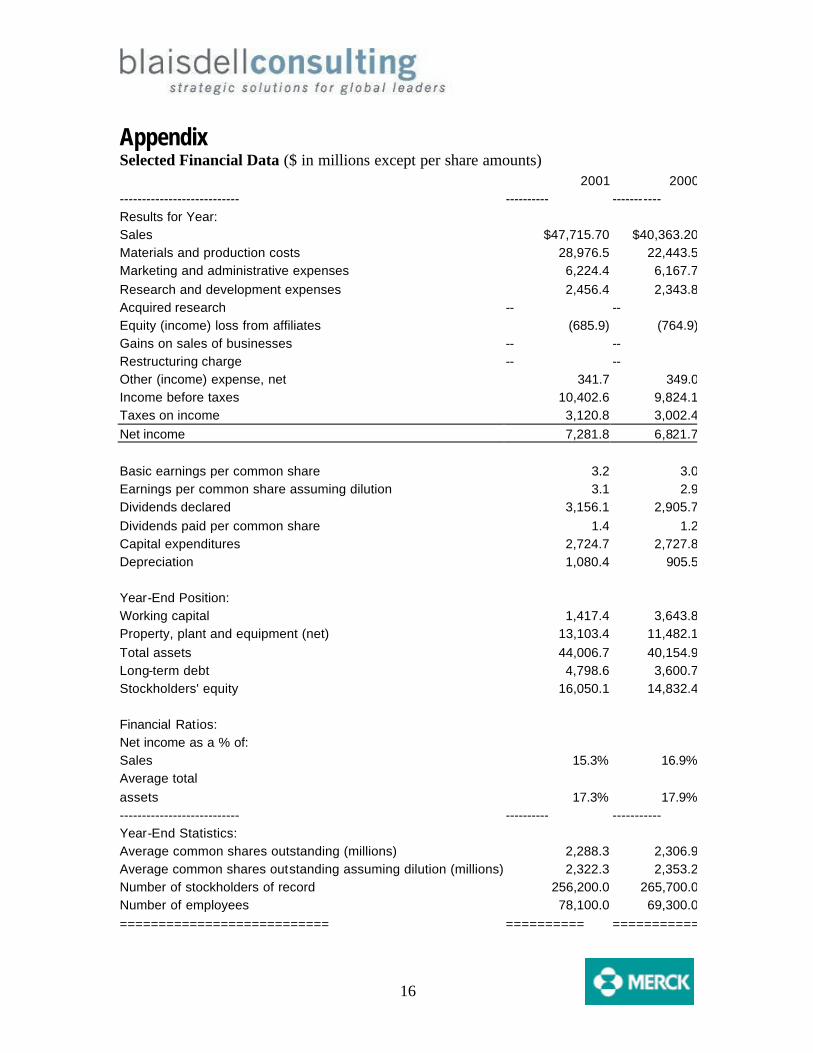
Appendix Selected Financial Data ($ in millions except per share amounts) 2001 2000--------------------------- ---------- ----------- Results for Year: Sales $47,715.70 $40,363.20 Materials and production costs 28,976.5 22,443.5 Marketing and administrative expenses 6,224.4 6,167.7 Research and development expenses 2,456.4 2,343.8 Acquired research -- -- Equity (income) loss from affiliates (685.9) (764.9)Gains on sales of businesses -- -- Restructuring charge -- -- Other (income) expense, net 341.7 349.0 Income before taxes 10,402.6 9,824.1 Taxes on income 3,120.8 3,002.4 Net income 7,281.8 6,821.7 Basic earnings per common share 3.2 3.0 Earnings per common share assuming dilution 3.1 2.9 Dividends declared 3,156.1 2,905.7 Dividends paid per common share 1.4 1.2 Capital expenditures 2,724.7 2,727.8 Depreciation 1,080.4 905.5 Year-End Position: Working capital 1,417.4 3,643.8 Property, plant and equipment (net) 13,103.4 11,482.1 Total assets 44,006.7 40,154.9 Long-term debt 4,798.6 3,600.7 Stockholders' equity 16,050.1 14,832.4 Financial Ratios: Net income as a % of: Sales 15.3% 16.9%Average total assets 17.3% 17.9%--------------------------- ---------- ----------- Year-End Statistics: Average common shares outstanding (millions) 2,288.3 2,306.9 Average common shares outstanding assuming dilution (millions) 2,322.3 2,353.2 Number of stockholders of record 256,200.0 265,700.0 Number of employees 78,100.0 69,300.0 =========================== ========== ===========

17
i S&P Report ii Establishments primarily engaged in manufacturing, fabricating, or processing drugs in pharmaceutical preparations for human or veterinary use. The greater part of the products of these establishments are finished in the form intended for final consumption, such as ampoules, tablets, capsules, vials, ointments, medicinal powders, solutions, and suspensions. Products of this industry consist of two important lines, namely: (1) pharmaceutical preparations promoted primarily to the dental, medical, or veterinary professions, and (2) pharmaceutical preparations promoted primarily to the public. http://www.osha.gov/cgi-bin/sic/sicser2?sic=2834 iii This U.S. industry comprises establishments primarily engaged in manufacturing in-vivo diagnostic substances and pharmaceutical preparations (except biological) intended for internal and external consumption in dose forms, such as ampoules, tablets, capsules, vials, ointments, powders, solutions, and suspensions. http://www.census.gov/epcd/naics02/def/ND325412.HTM#N325412 iv Establishments primarily engaged in providing hospital, medical, and other health services to subscribers or members in accordance with prearranged agreements or service plans. Generally , these service plans provide benefits to subscribers or members in return for specified subscription charges. The plans may be through a contract under which a participating hospital or physician agrees to render the covered services without charging any additional fees. Other plans provide for partial indemnity and service benefits. Also included in this industry are separate establishments of health maintenance organizations that provide medical insurance. Establishments providing these services through their own facilities or employed physicians are classified in Major Group 80. http://www.osha.gov/cgi-bin/sic/sicser2?6324 v This U.S. industry comprises establishments primarily engaged in providing third party administration services of insurance and pension funds, such as claims processing and other administrative services to insurance carriers, employee-benefit plans, and self-insurance funds. http://www.census.gov/epcd/naics02/def/ND524292.HTM vi http://www.ims -global.com/insight/news_story/0302/news_story_030228.htm vii ibid viii http://www.ims -global.com/insight/news_story/0302/news_story_030228.htm; http://www.ims -global.com/insight/world_in_brief/review99/year.htm ix http://www.ims -global.com/insight/world_in_brief/review99/na.htm x http://www.ims -global.com/insight/world_in_brief/0102/corps.htm xi http://www.pacificresearch.org/pub/hpp/2002/hpp_02-09.html xii http://www.pacificresearch.org/pub/hpp/2002/hpp_02-09.html