measuring requirements engineering success -
TRANSCRIPT

MANAGING SOFTWARE DEVELOPMENT (FALL 2008)
Measuring Requirements
Engineering Success
Varokas Panusuwan


Executive Summary
Requirements engineering (RE) consists of activities in capturing requirements, deciding about the system to design and managing system specification. Different characteristics of projects, combined with the informality of the real world, make it impossible to prescribe the one universal RE process. Trial-and-error has been noted to be the natural way in finding the right RE process for organizations. However, blindly searching for the right process would not be considered efficient in today’s business settings. Systematic evaluation process must be established to ensure that we understand benefits and drawbacks of each method.
The first step for improvement would be to understand success itself through various indicators. Success of the RE process is not restricted to only the quality of artifacts produced, but also the service provided to the customer and the cost effectiveness of the process itself. Success can also be indicated by the degree in which the current process follows good practices or capability model goals. Various aspects such as the fluency of staff that performs RE activities would also dictate success. These indicators are mostly abstract guidelines. Refinement process is needed for the indicators to be meaningful in practice. We can define quantitative measures from each indicator either by using goal-question-metric paradigm or subjective evaluation techniques. The measures identified would be used to construct an index score to indicate the success of a project. The most challenging step in this process would be to decide what to measure. Business goals can be used to focus the measures on an area vital to business success. To quantitatively indicate business success, key performance indicators are derived from the business goals.
At the end of this paper, a measurement program is proposed using the constructs discussed. The program is conducted in four phases using top down approach. The first phase is planning and communicating with management to define goals. The goal is then refined to quantitative performance indicators. Indicators and quantitative measures for RE processes are then derived from business goals. The process of collecting the measures and calculating the index score is also defined as an input to the report presented to management. The report is designed to show the relationship between projects’ scores and performance indicator, in order to further investigate the contribution of success from each project.
This paper is written for the project office staff in organizations that are interested in quantitative management. The ideal settings are to have different types of projects in organizations to be able to compare the approach used by each project. The goal-based measurement program proposed would also be best executed when the organization shares same set of goals. It is also recommended that the organization has a relatively high level of process maturity in order to effectively collect the measures derived from the program.

Table of Contents
Organization Background ............................................................................................................... 1
Introduction ..................................................................................................................................... 1
Indicators of Success....................................................................................................................... 2
Dimension of success .................................................................................................................. 2
Following Good Practices ........................................................................................................... 3
Good Practice Guidelines ....................................................................................................... 3
Key Activity in Maturity Model ............................................................................................. 4
Capability of the RE Staff ........................................................................................................... 4
Quantifying Indicators of Success .................................................................................................. 4
Goal-Question-Metrics ............................................................................................................... 4
Subjective Evaluation ................................................................................................................. 5
Likert Items Questionnaire ..................................................................................................... 5
Evaluation Dimensions ........................................................................................................... 6
Frequency of Practice Scale .................................................................................................... 6
Refine the questions ................................................................................................................ 7
Consolidating Results ..................................................................................................................... 7
Normalizing ................................................................................................................................ 8
Index Score ................................................................................................................................. 9
Business Goal Alignment ............................................................................................................... 9
Putting it all together ..................................................................................................................... 11
Requirements Engineering Measurement Program .................................................................. 11
Phase 1: Exploration and Planning ........................................................................................... 11
Phase 2: Establishing Business Goals ....................................................................................... 11
Identify Goals........................................................................................................................ 11
Refine Goals.......................................................................................................................... 11
Identify Key Performance Indicators .................................................................................... 12
Phase 3: Defining Measurement Data ....................................................................................... 12
Identify the indicators ........................................................................................................... 12
Identify the Measures ............................................................................................................ 13

Phase 4: Defining the Data Collection and Analysis Process ................................................... 13
Define Measuring Process .................................................................................................... 13
Score Calculation .................................................................................................................. 14
Define Reporting Process ..................................................................................................... 14
Suggested Improvements .......................................................................................................... 16
Conclusion .................................................................................................................................... 16

1
Organization Background
This paper is written for organizations that are currently using or is interested in quantitative management. The organization should have multiple software projects with different requirements engineering process in developments. The goal-based approach which will be discussed in this paper would also be best executed when the organization shares the same goals. It is recommended that the organization should archive a relatively high level of process maturity, where the process is well defined and documented. This would ensure that the various metrics derived by the methods proposed are properly incorporated into the process and practiced by the organization. The best person to execute the process should be a person from the project office who has access to data from multiple projects, or the team that is assigned specifically to the task.
Introduction
Requirement engineering is an activity that involves elicitation, documentation and management of the requirements [1]. It is the starting point of what to design, the most fragile and arguably the most important step in software engineering. As Fred Brook said in his infamous quote, “the hardest single part of building a software system is deciding precisely what to build ... no other part of the work so cripples the resulting system if done wrong. No other part is more difficult to rectify later” [2].
The motive is very high in search for the perfect requirements engineering process. Like most issues in software development, there is no silver bullet to apply for everything and everyone must find the right process for themselves. Sometimes, we just have to admit the fact that the only natural and efficient way is to try different methods for ourselves [3]. After trial-and-error, we can then evaluate the outcome of each method, compare it to the previous processes, improve on it until we find the right method that best suits our purposes.
The major challenge we would soon face is to find a baseline for improvement. Requirements stand between the imprecise real world and the precise nature of programming [4]. This unique property makes the process in capturing and managing varies very much in their approach and patterns. Thus, it is hard to measure into the process directly [5].
This paper is synthesized from various literatures on engineering process improvement. First, indicators that can be used to identify goodness of the process are presented. Different technique will be discussed on how to transform these indicators into quantitative measures and to select the right ones that benefits the most to the organization’s business goals. At the end, a guideline to develop a measurement program is proposed. The process contains information on how to use the different techniques discussed. It combines all measures into an index score and generates a report that can be used for requirements engineering process improvement.

2
Indicators of Success
The best way to measure requirements engineering is not to measure the process itself, but to indirectly measure the observed outcome of the process [6]. Indicators used by some literatures in requirements engineering process improvement are presented here. These indicators are not by all means comprehensive, but should be sufficient to demonstrate different approaches in measuring. We will also soon discover that not all the measures would fit to every requirement engineering processes. This problem will be addressed when the methods in measurement selection is discussed.
Dimension of success
Visible outcome of requirements engineering activity usually are the artifacts from the process. However, success seems to have deeper meaning than just the quality of the documentations that are generated from the process. We learned this when El Emam and Madhavji interviewed 30 experts in the industry involved in different requirements engineering (RE) phases with one single question: “What criteria are being used to assess RE success”. They were able to indentify 34 criteria that were used in the industry to judge the success of requirements engineering. The interesting part of the study is that they also asked the experts to categorize the output of the results. After analysis of these results, they were able to identify five aspects of success that is presented in three groups. These categories indentified are named “dimensions of requirements engineering success” and are presented below [7].
• The Cost Effectiveness of the RE Process This dimension is concerned about the whether the resources used in the process is reasonable. For example, the top three measures for this dimension would be the cost compared to other similar RE phases, the fraction of cost compared to total system development cost, and the amount of changes made to RE documentation.
• Quality of RE Products This dimension looks directly at the quality of major artifacts produced as a part of requirement engineering activity. Two significant product qualities are identified in the study.
o Quality of Architecture The quality of architecture designed during the process. The examples are: the clarity of the models to the system objectives and to the business process.
o Quality of Cost/Benefits Analysis This is the ability for us to perform the business cost/benefit from the requirements. In other words, we should be able to have good insights if the system to be built is profitable from the requirements gathered. For example, the coverage of the cost/benefit analysis and the extent that the management is convinced the cost/benefit are likely to materialize.
3
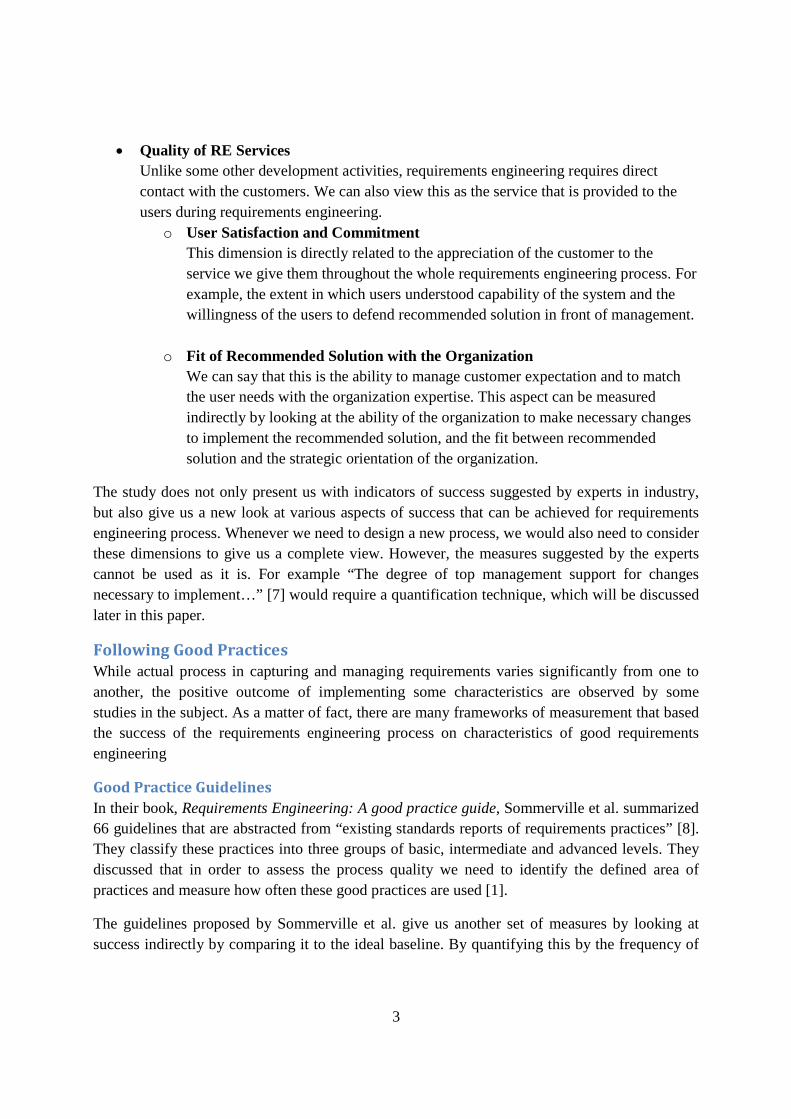
• Quality of RE Services Unlike some other development activities, requirements engineering requires direct contact with the customers. We can also view this as the service that is provided to the users during requirements engineering.
o User Satisfaction and Commitment This dimension is directly related to the appreciation of the customer to the service we give them throughout the whole requirements engineering process. For example, the extent in which users understood capability of the system and the willingness of the users to defend recommended solution in front of management.
o Fit of Recommended Solution with the Organization We can say that this is the ability to manage customer expectation and to match the user needs with the organization expertise. This aspect can be measured indirectly by looking at the ability of the organization to make necessary changes to implement the recommended solution, and the fit between recommended solution and the strategic orientation of the organization.
The study does not only present us with indicators of success suggested by experts in industry, but also give us a new look at various aspects of success that can be achieved for requirements engineering process. Whenever we need to design a new process, we would also need to consider these dimensions to give us a complete view. However, the measures suggested by the experts cannot be used as it is. For example “The degree of top management support for changes necessary to implement…” [7] would require a quantification technique, which will be discussed later in this paper.
Following Good Practices
While actual process in capturing and managing requirements varies significantly from one to another, the positive outcome of implementing some characteristics are observed by some studies in the subject. As a matter of fact, there are many frameworks of measurement that based the success of the requirements engineering process on characteristics of good requirements engineering
Good Practice Guidelines
In their book, Requirements Engineering: A good practice guide, Sommerville et al. summarized 66 guidelines that are abstracted from “existing standards reports of requirements practices” [8]. They classify these practices into three groups of basic, intermediate and advanced levels. They discussed that in order to assess the process quality we need to identify the defined area of practices and measure how often these good practices are used [1].
The guidelines proposed by Sommerville et al. give us another set of measures by looking at success indirectly by comparing it to the ideal baseline. By quantifying this by the frequency of

4
the practices in the organization, we can use this to argue the success of the requirement process by means of benchmarking ourselves to the predefined standards.
Key Activity in Maturity Model
One flavor of success in following good practices can also be found in certain process maturity models. In SW-CMM, each level of maturity beyond the initial level requires Key Process Areas (KPA) that needs to be satisfied. For SW-CMM, there are two KPA defined for the requirements management activity: “System requirements allocated to software are controlled to establish a baseline for software engineering and management use” and “Software plans, products and activities are kept consistent with the system requirements allocated to software” [5].
For organization with an ongoing maturity assessment, we can also use KPA to define the success of our process as well. Instead of following the general good practices, we can be focused more on achieving objectives defined in the maturity model. As in the good practices case, the goal is also vague and needs to be refined later.
Capability of the RE Staff
Requirements engineering is not performed by an automated system, but by the judgment of the staff that performs it. Success of the process should not only depend on how well the process is defined, but also the capability of the staffs that exercises it. We can adopt Vickers et al. criteria of measuring the capability of requirements engineering staff for knowledge transfer purposes. In their work, they identified 11 key competencies that are useful to requirements engineering activity [9]. While the usage intentions are different, we can adopt these measures to look at the skill level of the requirement engineering staff as well. Some examples of the competencies are “defining the problem context”, “identifying stakeholders and elicitation”, “identifying and resolve conflicts” among others.
Quantifying Indicators of Success
From the different sources discussed above, we should now have a list of possible indicators that can give us insights about the requirements engineering activity. Unfortunately most of them only provide a broad view that begs refinement and clarification. Challenges lie in how we should transform the definition such as “The user’s reaction to the cost estimates” [7] into concrete data that can be used to indicate goodness, which is meaningful for process improvement. This section presents two guidelines on how to quantitatively measure each of the aspects discussed earlier.
Goal-Question-Metrics
Most of the guidelines and metrics provided for us have very imprecise meaning. We need to refine the principles given into more concrete measures. One technique that is widely used in software measurements is the Goal-Question-Metrics (GQM) paradigm proposed by Basili. The nature of the guidelines fits well to the description of a goal described by Basili that “the goals

5
tend to be vague and ambiguous, often expressed at an imprecise level of abstraction” [10]. We can adopt this paradigm to derive a set of metrics needed to indicate success to the selected principles. First, we can start by framing the principles into a goal template of purpose, perspective and environment proposed by Basili [11]. This should enable us to think about the questions we would ask to indicate that we achieved the goal. Then, we can progress to think about the actual metrics that can be used to answer each particular question. Using this paradigm does not only give us a set of measureable metrics, but also provide the tractability back to the goal, or the principle in our case, that we try to achieve as well.
Example of using the GQM in refining requirement engineering goals is discussed by Loconsole in defining the measures for the SW-CMM KPA. The first goal of the requirements KPA can be expanded out into a set of questions and goals. The goal and its first two questions are presented below:
Goal: “System requirements allocated to software are controlled to establish a baseline for software engineering and management use”
Questions Measures 1 What is the current status of each requirement? • Status of each requirement 2 What is the level of the stability of the requirements?
• # initial requirements • # final requirements • # changes per requirement
Table 1 Example of applying GQM method for the first goal of SW-CMM. The questions and measures are extracted from two uppermost questions presented in [5]
As demonstrated, the goal can be decomposed down to the exact measures that can be tied to a process to collect those measures.
Subjective Evaluation
While the GQM gives us a paradigm to think about the goals and derive indirect measures, it has its drawbacks. In some circumstances, the question cannot be easily derived. We also have to be aware that for every goal that the GQM is applied, it might span out into many different questions and metrics, which would be challenging to manage. Subjective evaluations allow us to measure each goal directly based on the judgment of the person who is involved in the process. The techniques in obtaining these metrics and to ensure consistencies are presented below.
Likert Items Questionnaire
The most popular form of subjective evaluation seems to be a combination of a questionnaire with an interview. Kujala et al. explained their approach of quantification technique in their paper to measuring roles of users’ involvement in RE. In their work, they developed 4-point Likert items, ranging from “strongly disagree” score of 1 up to “strongly agree” score of 4. They also include a “no opinion” option with a score of 0 in addition to the spectrum [6]. This option is important in case the person evaluating is not involve directly in some part of the process or
6
does not have enough information to assess it. In this case, they can just use the ‘no opinion’ option instead of guessing, which might skew the results.
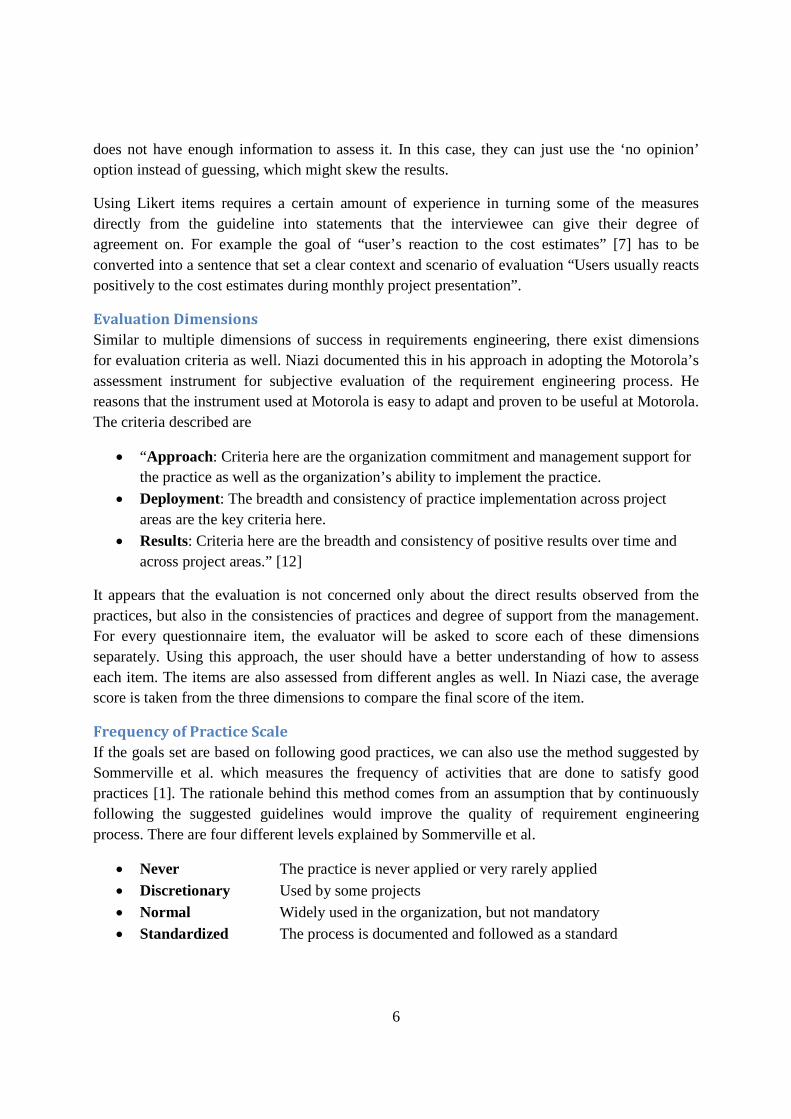
Using Likert items requires a certain amount of experience in turning some of the measures directly from the guideline into statements that the interviewee can give their degree of agreement on. For example the goal of “user’s reaction to the cost estimates” [7] has to be converted into a sentence that set a clear context and scenario of evaluation “Users usually reacts positively to the cost estimates during monthly project presentation”.
Evaluation Dimensions
Similar to multiple dimensions of success in requirements engineering, there exist dimensions for evaluation criteria as well. Niazi documented this in his approach in adopting the Motorola’s assessment instrument for subjective evaluation of the requirement engineering process. He reasons that the instrument used at Motorola is easy to adapt and proven to be useful at Motorola. The criteria described are
• “Approach: Criteria here are the organization commitment and management support for the practice as well as the organization’s ability to implement the practice.
• Deployment: The breadth and consistency of practice implementation across project areas are the key criteria here.
• Results: Criteria here are the breadth and consistency of positive results over time and across project areas.” [12]
It appears that the evaluation is not concerned only about the direct results observed from the practices, but also in the consistencies of practices and degree of support from the management. For every questionnaire item, the evaluator will be asked to score each of these dimensions separately. Using this approach, the user should have a better understanding of how to assess each item. The items are also assessed from different angles as well. In Niazi case, the average score is taken from the three dimensions to compare the final score of the item.
Frequency of Practice Scale
If the goals set are based on following good practices, we can also use the method suggested by Sommerville et al. which measures the frequency of activities that are done to satisfy good practices [1]. The rationale behind this method comes from an assumption that by continuously following the suggested guidelines would improve the quality of requirement engineering process. There are four different levels explained by Sommerville et al.
• Never The practice is never applied or very rarely applied • Discretionary Used by some projects • Normal Widely used in the organization, but not mandatory • Standardized The process is documented and followed as a standard

7
Refine the questions
One of the major drawbacks in using subjective evaluation is that each interviewee interprets the questions differently. This could result in poor data quality or numerous “no opinion” boxes checked, which also does not add value. We need to establish a process to make sure that the questions are written as clear as possible.
To address this problem we can adopt data collection steps proposed by Sommerville et al. in their maturity assessment guide. In their work, five steps are used to assess the requirements engineering process maturity. Since we only focus on the data collection process, we can only adopt step 2 to 4, which are “Select People to Interview”, “Score Practices against Checklist”, and “Resolve area of Uncertainty” [13] . We can then formulate the steps in refinement of subjective data collection as follows.
1. Participant Selection Select a group of people to participate in the evaluation. The people selected should understand the different practices used and the level of usage in the organization in general.
2. Initial Scoring The participants evaluate each question and give a score for each question item via an interview. The interview allows us to gain insights into details of state of practice and provides the opportunity to validate the results [6]. The questions raised about each items will be collected to be used in the next step.
3. Resolve Area of Uncertainty In this step, we conduct a workshop to resolve all areas of uncertainties with the participants. The workshop could be driven by the list of questions from the interview and other issues that the participant raised. Each questionnaire items will be revised to give more precise meanings.
Consolidating Results
We have discussed several areas of success that we must look into and the way to systematically identify and collect data about them. The goal in measuring success of the requirements engineering process is that we can use the knowledge to improve the way we practice it. However, we know that “Process improvement is not a one step process. Even addressing the most urgent problem may take several improvement cycles since good practice must be introduced incrementally and its performance verified” [8]. This means that the data collection will not be done only once, but continuously as an input of the process improvement framework. Knowing this, we must be certain that the data gathered can be summarized in the meaningful way to the process improvement activities.

8
Normalizing
Two paradigms of data collection definitions, which are GQM and subjective evaluation, were presented in this paper. We can quickly see that the numbers produced from these two paradigms are very different. The result from subjective evaluation ranges according to the degrees of agreement to the question item asked. GQM on the other hand, will produce numbers that are measured directly from the object of interest.
Source Metrics Example Value GQM # changes to requirements per unit of time 15 changes/month Subjective Evaluation Users usually reacts positively to the cost estimates
during monthly project presentation 2 (Disagree)
Organize formal requirements inspection 4 (Standardized) Table 2 Examples of metrics value from different data collection paradigm [1] [5].
According to Rozum, the measurement program success would depend on good characteristics of measures. For example, the measure should be objective, repeatable, simple and measurable. One of the important characteristic we should look at is that the measure should imply “goodness” of the data [14]. In GQM derived data, the number “15 changes/month” does not clearly indicate the goodness of the process. Just by using this raw data, we cannot conclude that we are doing good or bad. By researching on industry standards or by collecting few data samples from the current process, we should able to calculate the baseline for each data item. The two numbers we would need is the mean and the standard deviation value. With these number we can established a scale based on how far we are from the mean relative to the standard deviation data.
In order to be able to combine the results together, we should also be careful about the “polarity” of the data gathered as well. Since higher score from both Likert item and process following frequency always indicated better process, no further calculation is needed. In case of GQM, we have to identify them individually. For example, a process with high “number of inconsistent requirements” should yield a lower score. We will use the term Positive GQM for the one that yields a higher score when the value is higher. Negative GQM will be used to describe when lower value implies higher score.
After we understand the nature of each type of data, we can construct the conversion table that can be used to normalize different types of data into the same scale. The normalized score not only give us insight on the goodness of each item, but will also be used as an input for the index scoring process described in the next section.

9
Score Likert item Frequency Positive GQM Negative GQM 4 Strongly Agree Standardized Mean + 2SD Mean - 2SD 3 Agree Discretionary Mean + SD Mean - SD 2 Disagree Normal Mean Mean 1 Strongly
Disagree Never Mean – SD Mean – SD
0 No opinion No opinion Mean – 2SD Mean – 2SD Table 3 Normalizing table
Index Score
The main reason to normalize all the measures is that we take a summation of all the normalized scores together to create an index score that is easy to comprehend. This index score can be used to quickly indicate the status of a current requirements engineering process and to compare between different projects. In requirement engineering process improvement realm, Sommerville et al. calculates requirements engineering maturity by the process adopted from SPICE (Software Process Improvement and Capability dEtermination). They argue that using this method provides flexibility in calculation. The final score is simply a summation of the score from each item. The scores have the same weight because they could not identify which one of them takes priority over another [8] . We can adopt the method presented by Sommerville et al. to calculate the index score of our measures.
Guideline Score Make a business case for the system 4 Use checklists for requirements analysis 2 Uniquely identify each requirement 1
Total Score 7 Table 4 Example of SPICE calculation. Data from [13]
Business Goal Alignment
As presented in this paper, the requirement engineering process can be a success by many definitions and dimensions. We can clearly see that while the list of goals presented in this paper is not by all means exhaustive, there are many measures that we can derive from those goals. Measuring all of them would not only be very challenging to do, but might not generates much value as we would not have adequate resource to analyze the results. Sommerville et al. discuss that the “holy grail” of software engineering research is to demonstrate that the proposed solution would lead to benefits in the business realm. In their paper, they proposed two different ways to assess the impact of their maturity assessment to the business, which we can adopt to use [13].
The project partners involved in maturity assessment of Sommerville et al. proposed the following steps in identifying impacts to business [13].
1. Discuss with the stakeholders to discover their business goals that are likely to be supported by the requirement engineering process improvement

10
2. Identify critical success factors (CSFs) that are related to business goals. This helps us in assessment if we are making progress towards the business goal
3. Identify the key performance indicators (KPIs). These indicators will be a measurable product or process attribute that will help us identify if we meet the critical success factors.
As we can see, this approach bears resemblance to the GQM paradigm. However, the significant difference is that we are developing goals in terms of what is important in our business. Different organization will have different goals that they want to achieve according to their strategic positions. After the goals are identified, we identify the CSF to each business goals to help us decide if the progress is actually being made towards these goals. As discussed by Sommerville et al. these CSFs are not restricted only to the requirements engineering process, but can be thought of as the overall software process improvement goal. An example is a case where we have a goal to improve software productivity. One of the associated CSFs can be reduction in the amount of effort to rework. By improving the RE process, we would reduce amount of requirements rework, which will in turn reduce the total amount of rework as well [13].
Business Goal Critical Success Factors Improve Managerial Satisfaction Improve the tractability of requirements throughout
the system lifecycle Reduce uncertainty throughout the system lifecycle
Improve user satisfaction Reduce the number of complaints from internal and external users
Improve the efficiency of the system implementation and process
Get the system right first time Reduce time to deployment of software Reduce the deviation from the project schedule Reduce deviation from project budgets
Table 5 Example of business goals and CSFs identified for each goal. [13]
As we can see from the examples, the business goals and vision are broken down into criteria that indicate progress towards the goals. The last step would be to actually find measures that prove that we satisfy these business criteria. For each CSF, we will identify the KPI associated with it.
CSF Associated KPIs Get the system right the first time Percentage of requirements satisfied in the initial
design Number of requirements change request relating to requirements errors per month Effort devoted to rework Number of system modifications resulting from requirements engineering errors.
Table 6 Example of derived KPIs from CSF [13] .
After we identify the necessary KPIs, we can now measure the initial values from a reference project that can be used for a baseline. The difference between the reference and the measured

11
value later would be an indicator of the improvement or degradation from each approach towards our goals.
Putting it all together
In this section, different methods discussed and proposed in previous sections are synthesized into a sample of measurement program that can be adopted by the organization. The intention is not to prescribe any standard sets of measures, but to provide a guideline to help the organization in identifying measures that are aligned to the goal of the organization’s business. The guide will not elaborate on directions of how to incorporate these measures into an existing process. The reader can look for more information on this subject in the materials about process definition and process improvement.
Requirements Engineering Measurement Program
The measurement program proposed follows a top-down approach in measures defining, adopted from the structure of development strategy for the measurement process documented by Rozum [14]. The program composed of four different phases, with details explained on adaption to the requirement engineering from defining the goal, finding the metrics and define the reports and a guide for analysis process.
Phase 1: Exploration and Planning
As the target group of this paper is a company with relatively high maturity level, there might be some metrics that already being measured. We would first retrieve the documented process on these measures and identify those that specifically targets RE process.
The goal of this phase is to make ourselves aware of the current measures that are already implemented. We should be able to trace back to rationale behind these measures or the process that requires them.
Phase 2: Establishing Business Goals
Identify Goals
After the list of current measures is created, measurement team can approach the management and discuss on the goals of business operations, including the organization benefits expected from the implementation of requirement engineering [13] . Before discussing the goal, the team should prepare a material to provide executive summary on different aspects of success. The aspects are dimensions of success [7], various activities of requirement engineering process [1] and different capabilities of staff performing requirement engineering [9].
Refine Goals
After discussing goals with the management, we should analyze if the goal is well defined. This step important as we know that to archive success requires different aspects of the requirements to be balanced [15] . First, compare the goals with rationale behind current metrics gathered from
12
phase 1. More goals can also be used from the Key Process Area if the organization is planning on adopting or is currently under software maturity level program [5]. The refined goals will be communicated back to the management for approval.
Identify Key Performance Indicators
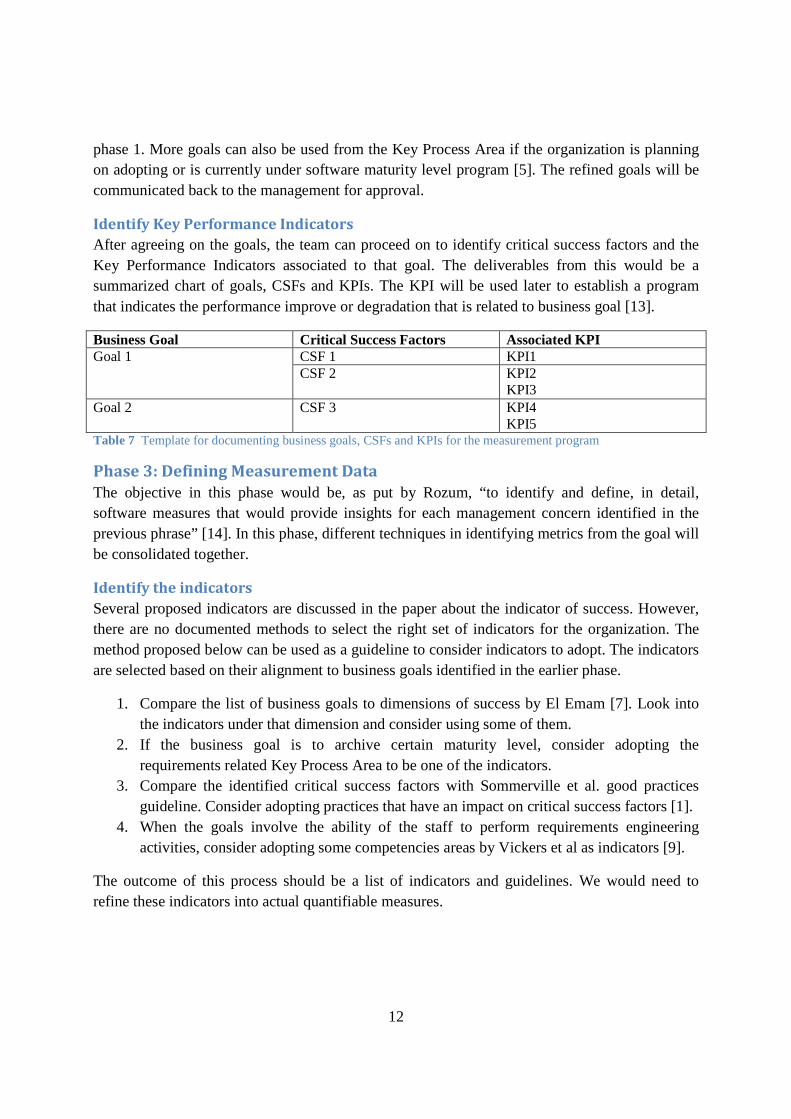
After agreeing on the goals, the team can proceed on to identify critical success factors and the Key Performance Indicators associated to that goal. The deliverables from this would be a summarized chart of goals, CSFs and KPIs. The KPI will be used later to establish a program that indicates the performance improve or degradation that is related to business goal [13].
Business Goal Critical Success Factors Associated KPI Goal 1
CSF 1 KPI1 CSF 2
KPI2 KPI3
Goal 2 CSF 3 KPI4 KPI5
Table 7 Template for documenting business goals, CSFs and KPIs for the measurement program
Phase 3: Defining Measurement Data
The objective in this phase would be, as put by Rozum, “to identify and define, in detail, software measures that would provide insights for each management concern identified in the previous phrase” [14]. In this phase, different techniques in identifying metrics from the goal will be consolidated together.
Identify the indicators
Several proposed indicators are discussed in the paper about the indicator of success. However, there are no documented methods to select the right set of indicators for the organization. The method proposed below can be used as a guideline to consider indicators to adopt. The indicators are selected based on their alignment to business goals identified in the earlier phase.
1. Compare the list of business goals to dimensions of success by El Emam [7]. Look into the indicators under that dimension and consider using some of them.
2. If the business goal is to archive certain maturity level, consider adopting the requirements related Key Process Area to be one of the indicators.
3. Compare the identified critical success factors with Sommerville et al. good practices guideline. Consider adopting practices that have an impact on critical success factors [1].
4. When the goals involve the ability of the staff to perform requirements engineering activities, consider adopting some competencies areas by Vickers et al as indicators [9].
The outcome of this process should be a list of indicators and guidelines. We would need to refine these indicators into actual quantifiable measures.

13
Identify the Measures
Usually the list of indicators generated from the previous section would need more concrete interpretations. Two techniques for defining measures are discussed in this paper, which are GQM and the subjective evaluation methods. The measurement team must decide which technique will be used for each indicator.
The major strength of GQM is that it turns one indicator into many quantifiable measures that can be collected by weaving it into the process. The weakness is that the GQM would potentially generate several metrics for an indicator. The baseline also needs to be collected to indicate the goodness of the collected data. For Subjective evaluation, the indicators only need slight adjustment in a Likert item format. However, the quality of data depends largely on the clarity of each question and the degrees of exposure to the process of the evaluators [13].
The output of this process should be a table that describes all the measures derived from each indicator and goal, the technique used and other descriptions.
ID Measure Description Indicator Technique Related Goal 1 M1 Description 1 IND1 GQM Goal 1 2 M2 Description 2 3 M3 Description 3 IND2 SE Goal 2 4 M4 Description 4 IND3 SE Goal 3 Table 8 Tables documenting measures and the technique used to derive them.
Phase 4: Defining the Data Collection and Analysis Process
Define Measuring Process
For GQM derived measures, most of them can be collected objectively by modifying existing organization process. For subjective evaluation, we need to plan for a separate data collecting process. To ensure the quality of data gathered, the process involves selecting the evaluator, developing the standards of evaluation [1], considering evaluation dimensions [12] and to refine the data [13] as discussed in previous sections of this paper.
The outcome of this process should be the data collection form and the process script, which looks similar in structure to the process proposed in the section about refining the questions. The form should have two different sections. In one section, group the measures that indicate good practices together. In this section, evaluators give a score to each practice by the outcome observed and frequency that it is used. In the other section, state other measures as Likert items and let the evaluator give the score by the level of agreement to that item. The process scripts should include the steps to ensure consistencies in the interpretation of questions.

14
Requirements Engineering Assessment Form Evaluator ID: XYZ Date Collected: MM/DD/YYYY Project ID: XYZ Interviewee: ABC Section 1 : General Questions Questions Score Q1 0 1 2 3 4 Q2 0 1 2 3 4 Score: 0 = No opinion, 1 = Strongly Disagree, 2 = Disagree, 3 = Agree, 4 = Strongly Agree Section 2 : Adopting of good practices Practices Approach Deployment Results P1 0 1 2 3 4 0 1 2 3 4 0 1 2 3 4 P2 0 1 2 3 4 0 1 2 3 4 0 1 2 3 4 Score: (Approach) 0 = No opinion, 1 = Very poor, 2 = Poor, 3 = Good, 4 = Excellent (Deployment) 0 = No opinion, 1 = Never, 2 = Normal, 3 = Discretionary, 4 = Standardized (Results) 0 = No opinion, 1 = Very poor, 2 = Poor, 3 = Good, 4 = Excellent Note: Table 9 Template for subjective evaluation data collection
Score Calculation
After the data is collected, they will be combined into one index score. All subjective evaluation score should already be normalized. For GQM derived data, the team needs to collect an average and standard deviation of the project as a baseline. This data will be collected on a per project basis to be used in the report. The calculation process can follow the following pattern adopted from Sommerville et al. scaling it beyond the process practice frequencies [1]
1. Collect all GQM derived data for the given project. 2. Normalize all GQM derived data using the normalizing table 3. For each evaluation form of the given project
a. Take the average of “Approach”, “Deployment” and “Results” into a single score for each good practice adoption [12].
b. Take the summation of the general questions and the good practice score calculated in (a) to be the project’s score
4. Take the average of all the evaluation form score calculated 5. Sum all normalized GQM derived data with the average evaluation score for each project.
Define Reporting Process
The team should agree with the management on the frequency of the report. The report should contain information about the score of each project and changes since the last report. Along with

15
the project score, there should be KPI changes since the last report as well. The report should also contain information about goals, measurement date. The report should be presented using a format that is easy for the viewer to identify the changes in KPI, scores of each project relative to each other and the changes since last report of each project.
Requirements Engineering Measurement Report Report Date MM/DD/YYYY Collection Date MM/YYYY – MM/YYYY Measurement Goals:
• Goal 1 • Goal 2 • Goal 3
KPI Changes Index Scores by project
Notes: Table 10 Template for data reporting to the management. Description of KPI should be printed on a separate sheet and use in comparison with this report. KPI changes chart is adopted from [13]
The suggested analysis process is to compare the index score changes with the KPI changes to understand the attribution of different projects to the KPI. The project which contributes to a higher score and higher KPI could be investigated further for the main source of improvement. Such knowledge can be spread across all projects.
-15
-10
-5
0
5
10
15
20
1 2 3 4 5 6
-40 -20 0 20 40 60 80 100
Project H
Project G
Project F
Project E
Project D
Project C
Project B
Project A
Change % Score
16
Suggested Improvements
Since the proposed method is untested and synthesized from various literatures, there might be flaws that have not been discovered. Assumptions are being made about the nature of the data collected. Suggested improvements are
• Every measure has equal weight, thus, equal impacts to the final score. After collecting a certain amount of data, we can develop a process to analyze the scale of impact on each practice to the stated KPIs.
• When the new measures are introduced, the maximum possible score will change as well. A process must be established to accommodate this change of score.
• The goal oriented method helps in identifying measures that are important to business operations, but does not make sure that all aspects of business operations are being considered. This might lead to some business aspects being neglected. A process can be developed to ensure that discovered goals are balanced.
Conclusion
By establishing quantitative measures, we learn more about the current status of the processes. They also allow us to objectively compare consequences of changes we made to the process. Choosing the right measures is an important decision, which is not always an easy one. The question we should ask ourselves is not what to measure, but what do we want to learn and understand. In this case, we would like to gain insights about the success of the requirements engineering in the organization.
The first step is to define what success means to us. In the business realm, this is what the organization wants to achieve as business goals. After defining what is important to us in order to be successful, we can then establish different indicators and measures to look into these aspects. Measurement activity is not trivial. It requires involvement from many entities following a well executed plan. After defining the measures, we also need to plan the data collecting and reporting process. A good collecting process ensures that data gathered reflects what happens in the real world. The reporting process communicates back to management what we have learned from collecting data.
It is important to emphasize that data does not act upon anything nor magically improve any process. It is the people who interpret data and use them to plan and act according to what they learned. Data gathered from the proposed measurement program enables us to see the contribution of each project towards desired success. We can then look into characteristics that drive success in certain projects and use it to tailor the requirements engineering process that suits us the best.

References
[1] I. Sommerville and P. Sawyer, Requirement Engineering: A Good Practice Guide.: Wiley, 1997.
[2] F. P. Brooks, "No Silver Bullet: Essence and Accidents of Software Engineering," in IEEE Computer., 1987.
[3] S. Fricker, M. Glinz, and P. Kolb, "A Case Study on Overcoming the Requirements Tar Pit," Journal of Universal Knowledge Management, vol. 1, no. 2, pp. 85-98, 2006.
[4] M. Jackson, Problem Frames: Analyzing and structuring software development problems.: Addison-Wiley, 2001.
[5] A. Loconsole, "Measuring the Requirements Management Key Process Area - Application of the Goal Question Metric to the Requirements Management Key Process Area of the Capability Maturity Model," in Proceedings of ESCOM - European Software Control and Metrics Conference, London, UK, 2001, pp. 67-76.
[6] S. Kujala, M. Kauppinen, L. Lehtola, and T. Kojo, "The Role of User Involvement in Requirements Quality and Project Success," in Proceedings of the 13th IEEE International Conference on Requirements Engineering, 2005, pp. 75-84.
[7] K. El Emam and N. H. Madhavji, "Measuring the Success of Requirements Engineering Processes," in Second IEEE International Symposium on Requirements Engineering (RE'95), 1995.
[8] P. Sawyer, I. Sommerville, and S. Viller, "Capturing the Benefits of Requirements Engineering," in IEEE Software, 1999, pp. 78-85.
[9] A. Vickers, A. Mavin, and H. May, "Requirement Engineering: How do you know how good you are?," in IEEE Joint International Conference on Requirement Engineering (RE'02), 2002.
[10] V. R. Basili, "Quantitative evaluation of software methodology," University of Maryland, College Park, Technical Report TR-1519, 1985.
[11] V. R. Basili and H. D. Rombach, "The TAME project: towards improvement-oriented software environments," IEEE Transactions on Software Engineering, pp. 758-773, June 1988.

[12] M. Niazi, "An Instrument for Measuring the Maturity of Requirements Engineering Process," in International conference on product focused software process improvement, Oulu, Finland, 2005, pp. 574-585.
[13] I. Sommerville and J. Ransom, "An Empirical Study of Industrial Requirements Engineering Process Assessment and Improvement," ACM Transactions on Software Engineering and Methodology, vol. 14, no. 1, pp. 85-117, January 2005.
[14] J. A. Rozum, "The SEI and NAWC: Working Together to Establish a Software Measurement Program," Software Engineering Institute, Pittsburgh, Technical Reports 1993.
[15] I. M. Kamata and T. Tamai, "How Does Requirements Quality Relate to Project Success or Failure?," in 15th IEEE International Requirements Engineering Conference, 2007, pp. 69-78.