measuring success: alternative education schools ... success: alternative education schools’...
TRANSCRIPT

Measuring Success: Alternative Education Schools’ Accountability Models
Rebekah Barr
Achievement School District
Measuring Success 1

Abstract
The School Reform Movement seeks to revise schools in order to provide more complete
educations as well as prepare all students to be college ready. Alternative education schools and
programs will play an important piece in this future, and it is important for their districts to have
a reliable method to measure their success in terms of school culture and safety, academic growth
and proficiency, and credit completion. Effective alternative education schools provide
instruction and assistance to ensure that their at-risk students gain the credits that they need in a
timely manner, as well as improving their academic skills and proficiency. The state of Tennessee
will require the Achievement School District to evaluate their alternative education schools to
ensure that they are successful and effective. The most commonly used standards for evaluating
these programs are based on student participation, academic growth, credit completion rates, and
graduation. Measures to evaluate these standards include a credit completion rate, attendance
rates, a targeted growth percentage in proficiency, or an achievement of individual goals.
Problems with these measures stem from the uniqueness of alternative schools’ environments.
For example, proficiency targets must take into account that most students in alternative schools
are low performing. Parent involvement measures must take into account that many students
could be parents themselves. Student persistence year-to-year might not apply because students
could complete their academic goals in a few months. Effective accountability measures set by a
district would allow enough autonomy for a school to function as it sees fit while simultaneously
demanding growth and student success.
Measuring Success 2

Defining ‘Alternative Education’
Alternative Education School/Program: According to the U.S. Department of Education an
alternative education school is “a public elementary/secondary school that addresses needs of
students that typically cannot be met in a regular school, provides nontraditional education,
serves as an adjunct to a regular school, or falls outside the categories of regular, special
education or vocational education.” Aron (2006) adds that “alternative education programs offer
students who are failing academically or may have learning disabilities, behavioral problems, or
poor attendance an opportunity to achieve...While there are many different kids of alternative
schools and programs, they are often characterized by their flexible schedules, smaller teacher-
student ratios, and modified curricula.”
At-risk: Ruiz de Velasco et. al (2008) describes at-risk persons as “ youth vulnerable to
academic or behavioral failure”. At-risk youth tend to come from the same impoverished and
minority backgrounds. It is generally they who make up the student population of alternative
education schools and programs. According to Ruiz de Velasco et. al, these student populations
also tend to be more racially or ethnically concentrated, English learners, highly mobile, in an
unstable family situation, have substance abuse problems, and/or are more violent than their
traditional school counterparts.
Standards: Standards are the tools that are used to evaluate school success in a framework.
Another word is ‘assessments’. Examples of standards for evaluating alternative education
schools or programs are ‘daily attendance’, ‘credit completion’, ‘ACT growth composite’, etc.
Measuring Success 3

Measurements: Measurements are the ways that schools demonstrate success in each standard.
It is the “numeric description” produced by the accountability model. (Allen et. al 2009) An
example of this would be ‘the percentage of stable students that show growth in their individual
daily attendance rate compared to the previous school year or maintain at least a 90% attendance
rate.’
Targets/Thresholds: Targets or thresholds are synonymous in terms of school evaluation. These
are the numerical goals provided for each measurement of success. For example, a proficiency
target might be that each student must receive a 19 or above on the ACT exam. These targets/
thresholds provide data for districts and administrators to monitor.
Goals of Alternative Education
According to Raywid (1994) there are three types of alternative education schools. Type 1
schools seek innovation and reform within their structure and curriculum. They resemble some
charter and magnet schools today. Type 2 schools seek to rehabilitate student behavior. These
schools “have been likened to ‘soft jails’.” Type 3 schools rehabilitate those students with
substance abuse, emotional, or social problems. These schools “focus on remedial work and on
stimulating social and emotional growth- often emphasizing the school itself as a community.”
However, though these schools work with students who have physiological needs, there is no
sign that this includes students with serious mental handicaps. Today, alternative education
schools and programs have evolved to be a mix of all three of these types of school. They hope
Measuring Success 4

to accomplish most if not all of these objectives in order to achieve success. Raywid identifies
that alternative education schools are successful if they “generate and sustain community within
them”, “they make learning engaging”, and if they have the foundation and support to maintain
these two things. Aron (2006) found that the most successful alternative education schools
prioritized student’s educational needs. He concluded that though different student populations
might have different and vast “educational needs”, the “educational objectives” for high school
aged students and older should be a diploma, GED, and/or an alternative diploma. Across a broad
number of sources however, alternative education programs and schools’ goals also include
•Accrediting students
•Recovering class credits
•Educating students in an alternative learning environment (Type 1 environment)
•Guiding students who are at-risk of dropping out
•Helping students meet state performance standards
Alternative Education and the Achievement School District
In the wake of No Child Left Behind, during a time of high-stakes testing, it’s important to know
that the numbers the states and districts are receiving about school performance are the right
ones. With the opportunity to create it’s own accountability model, the Achievement School
District has a great responsibility. The district aims to provide individual operator-run schools as
much autonomy and decision making power as possible while maintaining rigorous academic
proficiency and growth goals. Therefore, in order avoid infringing on any of that independence,
Measuring Success 5

the alternative education accountability framework will only measure outcomes. It is the duty of
the district however, to specify the broad demands by the state as well as set thresholds and
targets for schools to meet. The ASD will use the data obtained from administering this
framework in order to continuously improve.
The majority of Achievement School District students whom will be sent to alternative
education schools in the first year of it’s operation will be sent for disciplinary reasons (Anne
Thomas 2013). An expulsion sentence generally ranges from one month to one year. Once the
student has been told they will be expelled, they will be sent home for one day. The next day, the
student will go through a program with counseling and limited instruction in one of the ASD
public schools. These days will give time for a board to review the student’s conduct and
sentence as well as fill out paperwork. If the student is then recommended for expulsion, the
student and his/her guardian will be given a few choices. The student can go to a Shelby County
(the local district) alternative education school for the duration of their sentence. The student can
attend one of the ASD chartered alternative education schools. Or finally, the child can remain at
home and out of school for the duration of their expulsion. The state of Tennessee does not
require attendance of expelled students. It is and will be important for those students to remain in
an academic environment throughout their expulsion so as to not fall behind, but more
importantly, to continue with their education. In the future, other students will be recommended
for transfer to the alternative education school, beyond disciplinary reasons. It will be difficult
for the Achievement School District to monitor the success of their students at out-of-district
schools, but not impossible. However, what will be most important is that the ASD can monitor
Measuring Success 6

their own alternative education school to determine that their students are growing academically,
as well as being counseled in order to later be returned to their previous school successfully.
Setting the Context
The Tennessee State Board of Education has an alternative education program/model that any
alternative campus must adhere to. This document was located on the Tennessee Department of
Education’s website. The standards listed and described in the document are general and
resemble the model published by the National Alternative Education Association. The 12
standards/areas provide a model that an alternative education school must follow. The 12 areas
are: mission, program environment, governance, transitional planning, support services, parent/
community engagement, staffing and professional development, individualized learner plans, life
skills, curriculum and instruction, student assessment, and monitoring and program assessment.
(See Appendices.) Because this document is very broad, it allows districts much autonomy in
determining their own accountability measures. The state mandates that each school develop a
learner plan for each student, as well as ensure that students self-assess using surveys and set
their own goals. This limits the autonomy of school operators, but provides the Achievement
School District with a state-enforced mechanism for attaining individualized learning plans for
each student that will exist across all schools and programs and can be used for evaluative
purposes. The state envisions independent districts and programs that are guided by the state’s
model. The state of Tennessee’s alternative education schools and programs are not part of the
Adequate Yearly Progress mandates. Additionally, alternative education students’ scores on the
Measuring Success 7

state proficiency test, TCAP, are included in their regular schools’ proficiency calculations. This
holds the regular schools accountable for their prior students’ performance on state testing.
Differing Opinions
Across many interviews, scholarly sources, news articles, one tends to uncover several differing
opinions concerning both education reform and alternative education. The following opinions are
included so that the reader may interpret and consider each one when reading about proposed
accountability measures. The author has provided where the opinion came from, possibly why,
and the significance of it.
•Craig Ferguson, District 79 in New York City. The author contacted Mr. Ferguson
through a mutual connection in order to understand how that district holds it’s alternative
education schools accountable. It is Mr. Ferguson’s opinion that alternative schools should be
held to the same standards and measured the same way as traditional schools. He believes that
alternative education’s most important purpose is to return it’s students back to the traditional
school. His reasoning is that “people do expect less [from alternative education schools] and
that’s a problem... a diploma needs to mean the same thing” even if the student populations are
very different. He believes that districts should avoid creating “a district within a district” by
establishing and evaluating two separate systems: the alternative schools and the traditional
schools. When creating an accountability framework, he suggests that a district frame them in
such a way that it is possible to “lay them next to normal school targets.”
Measuring Success 8

•Principal Annette Bursey of Hollywood Success Academy in Memphis, TN. Hollywood
Success is an alternative education elementary school in the Shelby County School System
serving students from kindergarten to 5th grade. This past year, as well as this coming year, the
Achievement School District will have the option of sending eligible recommended students to
Hollywood Success. Most of these students will be recommended to attend Hollywood Success
because of disciplinary reasons through expulsion. Hollywood Success serves students from
kindergarten through 5th grade. Speaking generally about the students sent to her school for
disciplinary reasons, Ms. Bursey stated her opinion. She believes that the majority of those
students have undiagnosed learning disorders as well as academic handicaps. She faults this lack
of a proper diagnosis with the traditional schools. This opinion has not been cited by any sort of
factual basis thus far, but is a strong point of interest.
Accountability Measures
Credit/Course Completion: One of the most overarching goals of alternative education schools
is credit attainment. Whether the student be over-age, far behind, expelled, or simply under-
credited, alternative education schools serve to recover those credits and allow students to no
longer be at-risk of academic failure. The state of Tennessee requires an Individualized Learner
Plan for each alternative education student (the state of North Carolina does as well, see
Appendices) which consists of both academic and behavioral goals for the student to complete
during their time at the alternative education campus. In order to ensure that students are not only
Measuring Success 9

reaching mastery in subjects and meeting academic growth goals, districts must ensure that
students are continuing in their educational career successfully. The standards below all do this.
Promotion to Next Grade/High School Graduation: This measure can apply to all students. In
order to ensure that students are on the track for academic success, they must demonstrate
mastery by being promoted to the next grade or graduation from high school. Many
accountability models measure either one of these standards. However, these measures could
involve tracking and additional resources for the alternative education school to follow the
student after the transition back to their traditional school. Additionally, the alternative education
school might not have influenced a student to be promoted to the next grade in any way, but
would still be held accountable. An alternative education could also support the student and
improve their academic growth, but still not have provided enough for the student to be qualified
to move on. Pros: approved accountability measure across the board, applies to all students, easy
to measure. Cons: might necessitate additional resources, lack of promotion might be at no fault
of the alternative education school.
Course/ Credit Completion: Actual vs Average: Because course and credit completion are
extremely similar, they have been grouped together. All four measures are used in the California
state model (See Appendices). The Chicago Public School system also uses “credit attainment”
as a measurement of credit completion. The definition provided is “the percentage of students
who earn the total number of credits possible during their time of enrollment.” This measure is
scored reasonably. If 70% of students earn the maximum amount of credits, the school is given
the highest rating. (See Appendices) This would allow those students who are academically
Measuring Success 10

unable to receive the total credits possible, not hold the school back. Mike Ramero of the Los
Angeles Unified School District suggests that 30 credits per semester per student is average. He
proposes that the measure be evaluated by using the number of credits recovered total divided by
the number of students enrolled, even if the student is enrolled for one day. Pros: perfectly
embodies the goal of an alternative education school, applies to all students, number of credits or
courses can be specified. Cons: each student learns at a different pace. Depending on the student
body and school curriculum, credits could be completed rapidly or minimally.
GED Completion: This measure is used by the state of California. It is measured in two ways:
the percentage of students eligible to take the GED and whom pass all tests and the percentage of
GED sections passed by all students eligible. GED completion is a necessary measure to
demonstrate that graduating students are competent beyond exam scores, but this measure does
not apply to any other aged students. This measure would not be appropriate in the Achievement
School District for another four years. Pros: demonstrates competency of graduating students,
applies to students who want their GED without using standardized tests, can be measured in
several ways. Cons: not appropriate in the Achievement School District for several years, only
applies to a small number of students, might require tracking or additional resources.
Completion of Individualized Learner Plan/Percentage of ILP Goals Completed: Because
the state of Tennessee requires that all alternative education students have an individualized
learner plan, either of these measures would be extremely effective. The individualized learner
plan would apply to all students enrolled in the alternative education process. The plan mandates
Measuring Success 11

that each student also have academic and behavioral goals created and agreed upon by the
student, their guardian, and the appropriate traditional school staff. The state of North Carolina
also has a personalized education plan for each of their students. This standard could be
measured in two ways: measuring the percentage of students who complete the individualized
learner plan, and/or the percentage of ILP goals completed by each student. This measure
demands that each plan be created reasonably for each student so the alternative education school
is not wrongfully held accountable. There also must be clear communication between the
traditional and alternative education school, so that both understand the students’ goals and how
and when those goals will be completed. Pros: perfectly embodies the goals of alternative
education- behavioral modification and academic improvement, applies to all students, relatively
easy to measure, can be measured in several ways, combines disciplinary measure with academic
measure. Cons: must have system/check list to monitor goals.
Academic Proficiency/Growth: Especially of importance to the Achievement School District,
is the value of their students’ educations. In order to meet the district’s goal of having all schools
in the top 25% of state schools, the district must demand that all students meet rigorous academic
proficiency and growth goals. In order to measure this proficiency and growth, the district uses
standardized testing. The state of Tennessee only requires that students take the state exam. This
exam, called the TCAP evaluates students’ proficiency. It is value-added, longitudinal, and
analyzed using TVAAS to develop and establish growth goals for all students. TVAAS sets goals
for each individual student, and allows the student to be assessed against their own previous
Measuring Success 12

growth. Dr. Raymond Morley recommends that “the measurement of individual growth rather
than ranking and comparing to others is practiced to encourage learning and motivate the
learner.”
TCAP/End of Course Exams: These exams are mandated by the state to be completed by all
TN students. Using TVAAS to measure growth achievement, it is possible to compare each
student’s growth against himself each year. The tests are administered in the spring. In terms of
alternative education accountability, a standard measuring TCAP growth would not be effective
for several reasons. First, because students will tend to not be enrolled at alternative education
schools for a whole year, their learning or lack of learning will not be hugely influenced by their
alternative education school. Secondly, the test is administered once a year. This means that it
can not be administered after a student has directly completed their time at an alternative school,
but would have to wait until the spring. Though the Colorado League of Charter Schools
recommends that (and both Texas and North Carolina do) state exam scores be used to hold
optional schools accountable, it will not be accurate in the alternative education schools in the
Achievement School District. Pros: state mandated exam, can be administered to all students in
all grades, can be used to measure growth, compares the student’s growth to themselves. Cons:
only administered once a year, won’t demonstrate student’s academic growth after only being at
an alternative education school for a month or two.
3-year School Success Measure: This measure was suggested by Pathways in Education and is
chosen after the ASD’s own model. The ASD uses it to identify schools that are making
Measuring Success 13

significant annual gains in proficiency based on student scores on the state exams. Pathways also
proposed including the high school graduation rate into the calculation and requested that they be
compared against schools with similar student demographics and numbers of free and reduced
lunch students (FRL). However, keeping in mind the ASD’s rigorous demands for growth across
all categories, this request would not be feasible. All students, no matter their background must
be achieving the same goals. Pros: measures the school’s improvement in all students over the
course of time, would show the school’s improvement or lack of over the years. Cons: uses the
state exam scores (see above), possibly scores compared to similar schools.
GPA Improvement: One of the most preferred accountability measures by alternative education
schools in North Caroline was “improved GPAs” (Brewer, Feifs, Kaase 2001). This measure can
be very subjective however. Different schools can use different grading systems, have different
standards, etc. Because the Achievement School District will be transferring eligible students to
and from their alternative education school, the grading systems would have to be identical for
this measure to be effective. Otherwise, an alternative education school could inflate the grades
of their students in order to be positively evaluated by the district. However, this is the only
offered method for demonstrating academic improvement in students without using standardized
testing. Pros: doesn’t use standardized testing, demonstrates academic improvement. Cons: very
subjective, would have to have identical grading systems across the board, doesn’t demonstrate
mastery or proficiency in academics.
PSAT/SAT: There is no obvious research on the use of the PSAT in alternative education
schools. However, there are citations of using the PSATs and SATs as measurement of college
Measuring Success 14

readiness. The PSAT can be taken at any point in a high school career. Half of all test takers in
2011 were in grade 10 or below (PSAT Parent Perspective 2012). The PSAT may only be taken
once a year though. The SAT may be taken more often. The PSAT and SAT test knowledge
learned in the classroom. The PSAT predicts college preparedness and future SAT scores, but
does not measure growth of the student. Because the PSAT can only be taken once a year, it
would be almost impossible to use it as a demonstration of academic growth by alternative
education students. If the student was enrolled in an alternative education school in the spring,
they would not be able to take the PSAT until fall of the next year. Pros: measures and can
predict college preparedness, can be taken by any high school student, assesses classroom
knowledge, nationally acknowledged testing system. Cons: PSAT can only be taken once a year,
does not predict growth, does not have comprehensive or analytical testing system (compare to
ACT)
MAP: MAP is administered by the Northwest Evaluation Association. The test can be
administered 4 times a year. It is a longitudinal exam used to measure academic growth. Jody L.
Ernst recommends that this exam be administered after at least 8 weeks in the new school, but
less than 32. This amount of time is fairly suited to the length of student expulsions in the ASD.
It is especially convenient to use MAP in any of the alternative education campuses in the
Achievement School District because it will already be used in all other ASD schools. Currently,
the ASD is trying to obtain the raw data of a small study that measured the average growth of
alternative education students across grades and subjects. (Ernst, Turnbull 2010) (See Literature
Review for more information) Pros: already used in the ASD, can be administered in short
Measuring Success 15
intervals, administered on a computer, growth projection via RIT score, longitudinal exam,
adaptive. Cons: only tests up to the 10th grade, more expensive than other exams, is not able to
“capture semester growth”, (Chicago Public Schools STAR MAP Comparison) no norming data
for overaged students (yet), no growth percentiles for alternative education students who are
similar to them.
STAR: STAR is an adaptive test like MAP and is produced by Renaissance Learning. The exam
can be administered often, and administrators of the test may choose which subjects to
administer. The test is cheaper to administer than MAP and can be administered more often, up
to 5 times a year, whenever a student enrolls. The tests also take less time per subject than MAP.
The test may also be administered to students from 6th up to 12th grade whereas MAP only tests
up to the 10th grade. (Chicago Public Schools STAR MAP Comparison) The exam is used by
Pathways in Education in all of their Chicago and California schools right now. The exam is
nationally recognized as effective in measuring target attainment as well as growth percentiles.
Pathways recommended that the Achievement School District use both of those measures to
determine growth. Pros: cheap, can be administered often and whenever, administered by
subject, has growth percentiles for alternative education students who are similar to them,
already used by Pathways, tests up to the 12th grade. Cons: the Achievement School District
would have to administer an entirely different exam for alternative education students in order to
use this test for growth measures.
Measuring Success 16

ASPIRE/EXPLORE/PLAN/ACT: The ACT testing system can assess students in 8th, 10, and
11/12th grades respectively. (Allen et. al 2009) EXPLORE is used by 8th grade students, then
PLAN in 10th grade, and finally the ACT for high school 11th and 12th graders. ACT Aspire will
premier in spring of 2014. This standardized test will test students from grades 3 through 8 as
well as grades 9 through 10. Then, students will graduate to using PLAN and the ACT. It will be
the first longitudinal assessment that measures students from grades 3 through 12th grade.
(discoverACTASPIRE.com). The ACT can be taken up to 12 times, which makes it valuable for
over-aged students, or for alternative education schools who wish to test their students as an exit
exam to demonstrate growth. Pathways in Education proposed that the ASD use the ACT
Composite score to measure absolute achievement. The proposed metric was “one year growth in
score from eligible and college-interested students who show growth from PLAN test taken in
fall of 12th grade to ACT results in spring of 12th grade”. The proposed measure however would
only measure 12th grade students, and students will had to have taken PLAN and ACT in that
same year. Because this measure will only apply to a small number of students, it is not very
relevant. However, if this measure was expanded to include more students it would have more of
a sense of the general success of the alternative education school and student body growth. Pros:
the ACT can be taken up to 12 times, nationally recognized exam, can be taken every year in
high school beginning in spring of this year. Cons: students must take PLAN and ACT to be able
to measure growth composite.
1 Year School Success Measure, Growth by Year: This measure was suggested by Pathways in
Education. It is defined as “within a student group/cohort who has been enrolled in the program
Measuring Success 17

for 6 or more months measures the one-year growth in high school success rate, which reflects
growth across subjects (EOC and TCAP) and high school graduation rates”. The measure will
only measure those students who were enrolled in the alternative education for at least 6 months,
and the high school graduation rate will only apply to seniors enrolled for 6 or more months.
Since the Achievement School District does not and will not have any graduation eligible seniors
for another three years, this measure is not relevant in this coming school year. This measure
could only apply to a minority of students, since one goal of alternative education is successful
transition back into the traditional school system. Pros: measures success as an institution,
measures the positive influence of the alternative education school on it’s students. Cons: only
applies to a small amount of students, might need additional resources to track high school
graduation rates and test scores, won’t be a very relevant measure in the next few years.
Postsecondary Preparedness: Postsecondary preparedness measures the competence students
have for life after graduation, whether that be employment, the military, or a continuation of
education. It is the job of any high school to make sure that their students are prepared for the
next step. The three standards below measure the postsecondary preparedness of eligible
students.
ACT: Though explained above as a proficiency and growth measure, the ACT test also measures
college eligibility. The state of Tennessee recognizes that a score of 19 or above is a
demonstration of college-readiness. The ACT is nationally recognized. The Colorado League of
Charter Schools recommends the use of either the ACT or SAT composite and subtest scores to
Measuring Success 18

both signify postsecondary preparedness as well as student achievement level (See Appendices).
The suggested metrics include the “percentage of students reaching a score predictive of college
success on the exam”, “median score”, or the “percentage of students taking the college entrance
exam”. In accordance with the rigorous data-driven goals of the Achievement School District,
simply taking the college entrance exam would not measure any sort of academic achievement,
so this measure can be discarded. Also, in the context of the plan for ASD students, most
students’ goals are to successfully return to their traditional school. This measure does not
capture that. Pros: nationally recognized exam, target already set by the state, all high school
students eligible for test or pre-tests, test can be taken multiple times. Cons: standard only
applies to high school students.
Postsecondary Admission: Postsecondary admission is a very accurate and effective measure of
postsecondary preparedness. However, not all students may want to apply to continue their
education, and not all students will be eligible to contribute to this measure. The Achievement
School District could track all alternative education students to determine if they were admitted
to a postsecondary institution, but if a student was only present at their alternative education
campus for a month or two, there would be no way to demonstrate that their postsecondary
admission was influenced by their alternative education experience. Pros: obvious demonstration
of postsecondary admission. Cons: requires additional resources to track, will not apply to all
students, difficult to determine if alternative education school influenced the admission.
Postsecondary Enrollment or Employment: Like the measurement above, postsecondary
enrollment or employment would be an effective demonstration of postsecondary success. The
Measuring Success 19

standard is suggested by the Colorado League of Charter Schools, the measure determined by the
“percentage of graduates, by cohort, enrolled in postsecondary institutions (college, trade and
apprentice programs) by February of Year 1 after graduating from high school.” The metric
specifically sets a target completion date, as well as mentions the students specifically eligible to
participate in this measure. However, this standard would apply to a small amount of alternative
education students and would not be relevant for several years in the Achievement School
District. This standard would also require tracking of the alternative education students to
determine if they succeeded in enrollment or employment. Pros: effective demonstration of
transitional success, broad categories of success for graduated students to follow. Cons: applies
to a small number of students, won’t be relevant for several years, would necessitate tracking of
graduated students, difficult to determine if success was influenced by the time spent at the
alternative education campus. I have chosen to measure student achievement
School Safety/Culture. One of the most important components of a successful alternative
education school or program is it’s positive learning environment. A safe school, where there is a
strong community between teachers, students, and staff can provide the most support for students
who are at-risk for academic or behavioral failure. The standards below each measure the safety
or positive environment of a school whether it be through student participation, surveys, or lack
of disciplinary incidents.
School Suspensions: This standard measures the number of school suspensions. This could be
measured either with a status measure or with a growth measure. There is no evidence that one is
more effective than the other in terms of accuracy. This measure is used in the state of
Measuring Success 20

California’s accountability model and is measured by “the percentage of long-term students who
received out-of-school suspensions” (See Appendices). Other possible measures include ‘reduced
number of suspensions’ or setting a set target and having schools meet that target. Mike Ramero
of the Los Angeles Unified School District suggests that districts compare the number of
suspensions in one month to the number of suspensions that occurred that same month the year
before. Since there is evidence that more disciplinary incidents tend to occur in certain months,
this measure would take that into account. However, though this goal can also be used in a
traditional school, an alternative education school will have a higher concentration of students
prone to disciplinary concerns. This may or may not be of concern to the district. Pros: measures
schools’ safety, can showcase alternative education schools’ successful rehabilitative qualities,
can be a status or growth measure, can be equivalent to measure in traditional school. Cons:
schools may simply not suspend students in order to meet this target, the purpose of alternative
education is to rehabilitate not simply discipline and this measure doesn’t capture that.
School Expulsions: This standard measures the number of school expulsions. This could be
measured either with a status measure or with a growth measure. There is no evidence that one is
more effective than the other in terms of accuracy. Possible measures include ‘reduced number of
expulsions’ or setting a set target and having schools meet that target. In the context of the
Achievement School District, this measure doesn’t fit because most of the students who have
been sent to their alternative school would have been sent via expulsion already. Pros: measures
schools’ safety, can showcase alternative education schools’ successful rehabilitative qualities,
can be a status or growth measure, can be equivalent to measure in traditional school. Cons:
Measuring Success 21

schools may simply not expel students in order to meet this target, the purpose of alternative
education is to rehabilitate not simply discipline and this measure doesn’t capture that.
Behavior Incidents: this standard is broad enough to include many types of ‘incidents’ such as
write-ups, suspensions, detentions, or expulsions. This measure is used by California, North
Carolina, and New York (see Appendices). Because this measure is so broad, it can include any
type of behavior incident in the school and can hold alternative education schools accountable to
a high standard. This measure can be measured as a status target or by growth, can measure a
student’s individual decrease in behavior incidents, or the school to a target number total. Since
one of the larger goals of alternative education schools is behavior modification through
counseling, a growth measure per individual would capture that. Pursuant to the beliefs of both
Craig Ferguson and Dr. Raymond Morley (See Literature Review), a comparative growth
measure would motivate the student and provide more accurate data. I propose that this standard
be measured by “the number of behavior incidents in the same enrollment time period in the
previous year” subtracted by “the number of behavior incidents in the same enrollment time
period in the current year” measured per student and then compounded into a percentage at the
school level. Pros: the standard can measure a wide range of behavioral incidents, can be
measured at the student level, as a growth or status measure, and can capture the rehabilitative
goals of alternative education. Cons: require detailed filing/recording system to do comparison
measure, would have to define ‘incidents’.
Measuring Success 22

Attendance: Attendance is the most clear demonstration of student participation at the school
level. Though in many ways a low attendance score might be at no fault of the school due to lack
of transportation, poor home life, etc., it is one of the most commonly used accountability
measures across the board. Mike Ramero of the Los Angeles Unified School District suggests
that districts measure the number of instructional days lost. The numerical measurement could be
the number of days kids came to school subtracted by the number of days kids were absent, all
over the number of days that students came. This measure would have to count the number of
students enrolled at the time. The measurement would want a 1/1 comparative measure for
success. Another possible measure is “growth in attendance” which was suggested by Pathways
in Education. The operators suggested that the Achievement School District measure the
percentage of stable students that show growth in their individual daily attendance rate compared
to the previous school year or maintain at least a 90% attendance rate. One other possible
measure used by the state of California is “sustained daily attendance” this is the percentage of
days students were present in class and completed their full assigned instructional day. This
measurement is broad enough in description to not determine a specific hour a student is required
in school, but rather that they complete their ‘full assigned day’. This measurement would suit
the Pathways in Education schools because this measurement allows for those students who do
mostly independent work off-campus to continue to do so. The opposite of daily attendance is
truancy. The Colorado League of Charter Schools suggests measuring truancy by the ‘percentage
of students exceeding a particular number of truancies in a given period of time’. This target
measure does not specify the given period of time nor the number of truancies. It also groups
students together to hold the school accountable. Pros: attendance is the most widely used
Measuring Success 23

measure of student participation across the board, can be measured in several ways, and can be
measured the same way in traditional schools. Cons: many variables can deter students from
going to school daily unto no fault of either the student or the school.
Comparative Attendance: Another attendance measure that is used in other districts is
“comparative attendance”. Chad Ferguson suggested that this measure be evaluated using the
average length of stay in an alternative education school, and then comparing the attendance of
the student in the alternative education school to the attendance records before and after the
student returns to their traditional school. He recommends that the district track this attendance
for 2 months in the previous and after periods. Pros: this measure would allow the effectiveness
of the traditional school and the alternative education school to be compared side by side and
would provide an easy comparative target. Cons: would require additional resources and
paperwork to track the attendance, the high mobility rate in Memphis might prevent not allow for
much data for collection.
Student Punctuality: The state of California holds their schools accountable for student
punctuality. (See Appendices) The measurement is evaluated by measuring the percentage of
days all students were present and on time at beginning of each day. This is another measurement
of student engagement and participation. However, again due to the turbulent lifestyles of
alternative education students, and the lack of transportation in Memphis, measurement might be
unrealistic (though not unimportant!) to set. Especially for younger students who are dependent
upon their parents, or who can be hindered by the weather for their walk to school, this demand
Measuring Success 24
can be very unattainable. Attendance might be more realistic if measured at the daily level so as
too allow more ‘wiggle room’ for those students dependent on their guardians for transportation.
Pros: specific and rigorous demand of all students. Cons: many variables that can affect the
feasibility of a student arriving to school on time.
Dropout Rate: The dropout rate is used in accountability frameworks in North Carolina and
Texas. It is the only non-academic measure in the Texas model that determines district actions
towards the school. I believe that this measurement is extremely important given the strong anti-
dropout purpose of alternative education schools. However, given the state of Tennessee’s
attitude towards non-compulsory attendance during expulsion periods, this dropout rate might be
due to parental decision (Anne Thomas 2013) rather than a student’s decision. Nevertheless, the
dropout rate is a serious and effective measurement of success in an alternative education school.
If students are only sent to an alternative education school or program for 3 months, then the
drop out rate could be much lower if measured by the percentage of students who drop out
within their enrollment at the alternative education school.A possible measure could also use a
longitude system that may or may not involve tracking. Pros: Effective measure used in several
models, easy to measure. Cons: might necessitate additional resources to track student
attendance, might not be best evaluator if students are only in alternative education school for a
month or two, TN non-compulsory attendance might necessitate that the threshold is much
higher.
Measuring Success 25

Persistence/Stabilization Rate: Persistence in a traditional school is the percentage of students
who choose to stay within the same school from the spring of one year to the fall of the next
year. It is used to measure school approval by students. However, given the purpose of
alternative education schools to return successful students back to their traditional school, the
measure would be ineffective. Pathways in Education proposed instead that the Achievement
School District measure the stabilization rate within the alternative education school. They
proposed that the district measure the percentage of students actually enrolled for at least 60-
instructional days of the number of students possibly enrolled for at least 60-instructional days.
This could also mean that after a student’s expulsion sentence is up, the student chooses instead
to remain within Pathways in Education. However, if a student chooses not to stay longer than
their expulsion sentence, and successfully returns back to their Achievement School, then
Pathways could be held accountable for that choice. This is one of the only measures of school
approval that does not involve subjective surveys, and is instead data driven. The Chicago Public
Schools defines the stabilization rate as the “percent of stable students who are enrolled at the
end of the school year, completed the program, or successfully transitioned to another Chicago
Public School. This definition of the measure is broad enough to include those students who
either choose to remain enrolled, or successfully transition out of the optional school. However,
if students are enrolled at the end of the school, this could also signify that the student did not
complete their goals in time for the end of the school year and would have to continue in the
optional school. Pros: measures school approval, only measures those students that are eligible.
Cons: the school will be held accountable if the student chooses to return to their traditional
Measuring Success 26

school, if a student remains in the optional school, it could be because they did not complete
their academic goals or credits.
Continuous Enrollment: This is another measure that is supposed to evaluate school approval.
This measure was proposed by the Colorado League of Charter Schools. The League proposed
that this standard be measured in one of three ways. Either the percentage of students
continuously enrolled throughout the year, the percentage of students re-enrolled from one year
to the next, or the percentage of students continuously enrolled for multiple years. However,
none of these measurements would fit the plan and purpose of an alternative education school in
the Achievement School District. It could be a very bad sign if a student stays longer than
intended in an alternative education school because they might not have finished their credits or
goals in the time allotted and need to stay enrolled longer. Cons: does not fit the alternative
education school purpose or scheduling.
Parental Involvement/Community Involvement: Both of these measures are optional
measures used by the state of North Carolina. Parental involvement is measured by the
percentage of parents of students who are involved. Community Involvement is measured by the
number community members involved in the school. Both of these measures are a form of
demonstrating school approval. However, a school that was also desperate needs of funds or
volunteers would have huge amounts of parental involvement or community involvement.
According to Dr. Raymond Morley, community input and involvement is a very necessary
component of a successful alternative education school. This might not be as feasible in the
proposed Pathways school in the Achievement School District, because the school would serve a
Measuring Success 27
variety of communities and students from all over the city. As well, Pathways in Education
supports a lot of independent work and self-advocacy which would directly ask for or require
outside assistance. Though one of the largest challenges that alternative education schools face is
lack of relationships with other schools and members of the community (Ruiz de Velasco et. al),
this could be possible without parental involvement. Pros: shows that the school has strong
community support. Cons: isn’t support by the Pathways proposal or environment, doesn’t
demonstrate school approval.
Community Impact Measure: This measure would be based on the results of surveys
completed by students and/or parents. This is a measure that the Achievement School District
uses in all of their traditional schools. Pathways in Education also placed this measure on their
proposed accountability model. However, both agreed that this measure wouldn’t be used for
school decisions by the district. This is a great measure of school approval, but in the same vein
that the ASD does not use this for school decisions, it should not be used to hold Pathways
accountable. Additionally, if a student is only present at an alternative education school for their
expulsion sentence of one month, the student might have an entirely different experience than a
student who was enrolled for a year. North Carolina uses a similar measure labeled ‘customer
satisfaction’ that has students, parents, and school staff take surveys to measure the community’s
approval of the school rather than just the students or parents. Pros: already used by the ASD,
can be used to measure school approval without holding the school accountable. Cons: different
survey results for different enrollment periods, subjective measure.
Measuring Success 28

Below, this report lists all alternative education framework standards thus found. Research has
suggested that the most appropriate measures for alternative education focus on growth and
improvement so that each individual is only compared to themselves (Morley, 1994). Each
standard is described, it’s significance explained, a suggested measurement of each standard is
provided, and it’s pros and cons are named.
Measuring Success 29

Conclusion
Based on all of the above assessments and researched conclusions, I have decided to
modify the original Pathways accountability model proposal, and suggest my own framework for
the achievement school district. In terms of achievement, I believe that the number one measure
should be “the percentage of individualized learner plan goals completed”. This matches the
Tennessee requirement of all alternative education students. This measure also applies to all
students of all backgrounds. It will be the obligation of the traditional school to set the rigorous
ILP goals, and the job of the alternative education school to assist the student in completing
them. The target for this measure should be rigorous but also allow a percentage for those
students who are incapable of completing their goals. This target should be monitored especially
in the first year of implementation because it is the most unique measure that has no similarity
with a traditional schools’ evaluation measures. Secondly, I believe that the Chicago Public
Schools’ suggestion is the best choice for measuring course/credit completion. Although this
would require the district to determine the total number of credits possible per set amount of
time, this measure would set a target that is flexible for each individualized learner plan. By
setting the target similarly to the Chicago Public Schools’ as well, the alternative education
school can still be top performing with only having 70+% of their students earning the maximum
number of credits. (See Appendices).
Though it is not up to this researcher to determine if the Achievement School District
should use an entirely separate testing system for it’s alternative education students, this
researcher does feel that the STAR exam should be used at least as an entrance and exit exam.
Measuring Success 30

For students who only complete one course in their enrollment in the alternative education
school, they only have to be tested in that one course at the end of their enrollment. The school
would then only be held accountable for improvement in the area that they instructed the student.
The exam is cheaper, shorter, can be used up to the 12th grade, and can be molded into the
flexible curriculum and structure of the alternative education school. The researcher is not
advising against using MAP at all, but proposing that STAR be used at least in this way. The
STAR test would then be used for target attainment and growth percentile. In terms of growth or
absolute achievement, the EXPLORE/PLAN/ACT testing system should be used. The system
tests students in grades 8, 10, and 11/12 currently, but will test all grades in the spring of 2014.
The ACT can also be administered up to 12 times and is a nationally accepted postsecondary
preparedness measure.
Based on the strong tendency and recommendation towards using growth as an objective
in an alternative education school, student engagement should also be measured in growth. The
proposed metric is “the percentage of stable students that show growth in their individual daily
attendance rate compared to the previous school year or maintain at least a 90% attendance rate”.
This metric will not specify that the attendance is based on the individual’s personalized
schedule, but it should be clear between the alternative education school and Achievement
School District. This will not measure attendance by seat time, but rather by a completion of
specific mandated hours/completion of work determined by the alternative education school and
approved by the ASD.
Measuring Success 31

In terms of persistence, school approval should be data-driven. The stabilization rate
would measure this. The researcher has modified the measure used by the Chicago Public School
system to also include the suggestion by Pathways in Education. The suggested measure reads
“the percent of students choosing to re-enroll at the end of their enrollment period, completed the
program, and/or successfully transitioned to another Achievement School District school.” This
would include all of those students who successfully completed their time at the alternative
education school and successfully transitioned back to their traditional school, as well as those
students who preferred to remain at Pathways in Education.
Lastly, alternative education schools should be held accountable for discipline. This
would mandate beyond the completion of behavioral ILP goals that the alternative education
school improve student behavior and reduce disciplinary incidents. The proposed measure is a
product of the beliefs of Chad Ferguson as well as Anne Thomas of the Achievement School
District. By comparing the number of behavior incidents in the pervious year to the time of the
current year, the fact that some months of the year have far more disciplinary measures than
other months would be irrelevant. Also, this would still hold the alternative education school
accountable, and would be comparing it to the traditional school rather than other similar schools
which will hold the alternative education school to a higher standard. By using a high target, the
district will demand disciplinary growth/improvement of all students. There has not been
significant research that explains the importance or lack of, of weighting disciplinary measures
against schools.
Measuring Success 32

ASD Alternative Education School Performance FrameworkMeasures Under Consideration
Measure Category Measure Description
Target/Threshold (Percent or Percentile)
Achievement
Percentage of Individualized Learner Plan Goals completed
Percentage of student ILP goals completed of the total set in place
Exceeding: ≥85%Meeting: ≥75%Approaching: ≥65%Does Not Meet:<65%
AchievementCredit Attainment
Percentage of students who earn the total number of credits possible during their time of enrollment
Exceeding: ≥70%Meeting: ≥60%Approaching: ≥50%Does Not Meet: <50%
Growth
STAR Growth- Target Attainment
Percent of students meeting or exceeding their STAR growth targets per course/subject instructed
Exceeding:≥90%Meeting: ≥70%Approaching: ≥50%Does Not Meet: <50%
Growth
STAR Median Growth Percentile
Compares the average of a school’s students’ growth (by grade) with national norms for schools whose students have started at about the same level at the beginning of the year
Exceeding: ≥90thMeeting: ≥70thApproaching: ≥50thDoes Not Meet: <50th
GrowthACT/PLAN Growth Composite
One-year growth in score from students who were administered the EXPLORE test to PLAN test or PLAN test to student ACT results.
Exceeding: Meeting: Approaching: Does Not Meet:
GrowthGrowth in Attendance
Percentage of stable students that show growth in their individual daily attendance rate compared to the previous school year or maintain at least a 90% attendance rate
Exceeding: ≥90%Meeting: ≥80%Approaching: ≥70%Does Not Meet: <60%
Equity & Persistence
Stabilization Rate
Percent of students choosing to re-enroll at the end of their enrollment period/completion of ILP, or successfully transitioned to another Achievement School District school.
Exceeding: Meeting: Approaching: Does Not Meet:
School Culture & Safety/Non- Weighted
Improved Discipline
Percentage of stable students that show growth in their individual disciplinary rate compared to the previous year in the same time frame (month) or no disciplinary incidents
Exceeding: ≥90%Meeting: ≥80%Approaching: ≥70%Does Not Meet: <60%
Community Impact Measure
TBD
Measuring Success 33

The only measures that this researcher strongly recommends not being implemented are
growth on the SAT, parental/community involvement, and continuous enrollment. The SAT is
impractical to use in an alternative education setting because it only has one pre-test that can be
used to measure growth that can only be administered once a year. The system does also not test
9th graders and would rarely be used by 12th graders. Neither parent/community involvement
nor continuous enrollment capture the purpose of alternative education. Pathways in Education
supports independence and self-advocacy in their students, and strenuous parental involvement
can infringe on that. Also, due to the turbulent lifestyles and backgrounds of many alternative
education students, it would be unfair to hold the school accountable for parent participation
when it may not be possible. Continuous enrollment is counter-intuitive to the goals of
alternative education. Students should aim to complete their goals and return back to their
traditional school, choose to re-enroll, or graduate. If a student is re-enrolled from one school
year to the next, they simply could not be completing their ILP on time. This would be a negative
outcome rather than a positive one.
Ultimately, this research has sought to suggest and explain accountability frameworks for
alternative education schools. In order to ensure that all students are learning, the district must
hold all schools accountable to the same high standards. The ASD is data-driven and each school
must produce evidence of their success in order to be held accountable, improved, or
commended. No matter what school, growth and achievement should be measured and increased
every year. Because of the unique structure and unique goals of alternative education programs,
these schools necessitate a different evaluation framework than other schools, but still with the
same rigor. This research answers the question “how do we evaluate the success of alternative
Measuring Success 34

education programs?” Before any alternative education evaluation framework can be established,
however, it must be demonstrated that the measures and targets set are effective in evaluating
success of the program. This research has identified proposed measures of success for future use
by this district. And right now, it appears that ‘no one is doing it right’. The Achievement School
District would like to ensure they push the successful measurement of alternative education
programs further in the right direction. That is why the ASD is doing this research, and that is
why it is so important.
Measuring Success 35

Appendices
Tennessee State Board of Education
Alternative Education Program Model/Standards
Adopted April 2000. Revised August 2008.
Standard 1.0: Mission
An exemplary alternative education program operates with a clearly stated mission, a formal set of standards, and a plan for program improvement.
1.1 The mission describes the reason for the program and the students to be served.1.2 The mission has a unifying theme that invokes high levels of staff support.1.3 Student success is central to the mission.1.4 The program’s goals and objectives provide a focus for program improvement.1.5 The mission, goals, and expected outcomes are documented, published, and clearly visible
to staff, students, and parents.1.6 The program operates under a policies and procedures manual that is approved by the
local board of education.Standard 2.0: Program Environment
An exemplary alternative education program provides a safe, positive, and nurturing environment which is conducive to learning.
2.1 The program provides a written code of conduct which is clearly understood, accepted, and consistently applied to all students (e.g. level system or similar behavior support mechanisms).
2.2 The program is housed in a safe, well-maintained, and accessible physical environment that supports optimal student learning.
2.3 The program has a detailed safety plan that has been distributed and practiced to ensure the security and good health of students and staff.
2.4 The program demonstrates an understanding and sensitivity to academic, cultural, social, behavioral, and developmental needs of students, parents, and the community.
2.5 There is an atmosphere of mutual respect among program staff, students, parents, and the community.
2.6 Staff communicates high expectations for students’ academic performance and overall behavior.
2.7 Students have a role in shaping the learning environment.
Measuring Success 36

2.8There is a low student to teacher ratio (1:12) with a teaching assistant for each certified staff person and classes not exceeding 12 students.
Standard 3.0: Governance
An exemplary alternative education program operates under an Advisory Board comprised of staff, parents, students and community representatives who provide leadership and support in developing and communicating the program’s mission, standards, and planning for continuous improvement.
3.1The program has an Advisory Board consisting of faculty members, parents, students, community representatives, and other district personnel who meet on a regular basis during the school year.
3.2The Advisory Board makes recommendations to the program administrator on its mission, written policies, and procedures to ensure continuous improvement.
3.3The program administrator empowers the Advisory Board to help accomplish the shared vision and goals of the program.
3.4The Advisory Board is directly involved in program activities and rallies community support.
3.5Board members have ownership in the overall success of the program.
Standard 4.0: Transitional Planning
An exemplary alternative education program implements a transitional plan for students entering and exiting the program which ensures the likelihood of student success.
4.1The program has a Screening Committee to ensure that the alternative placement is most appropriate for the student’s specific educational, behavioral, and social needs (individual student, individual placement decision).
Measuring Success 37

4.2The program provides a written transitional plan from pre-entry through post-exit for every student in attendance which includes the following: an orientation which consists of rapport building, assessment of the student, IEP review, short and long-term goal setting, development of an individualized learner plan, and other mechanisms designed to orient the student to the alternative education setting.
4.3Transitional plans afford students the opportunity to maintain and accelerate their current progress toward graduation.
4.4A Student Support Team is established that consists of educators from the school of origin, educators from the alternative education program, the student, and parent(s) who are directly involved in all aspects of the transitional process including drafting, implementing, monitoring, and periodically modifying the transitional plan.
4.5The Student Support Team assesses and matches needs to services to ensure the following: early interventions are developed to minimize the number and length of alternative education placements, social readiness is assessed before returning to the school of origin, continuance of required services are provided to meet the educational needs of students with disabilities, and limited English proficiency and/or significant skill deficiencies are addressed.
4.6Information sharing (availability of pertinent records*) takes place between the home school, and/or Department of Children Services, and/or juvenile correctional center, and/or local juvenile treatment centers.
4.7When appropriate, students in alternative education programs are provided with various opportunities to develop and maintain supportive links to the school of origin.
4.8Prior to a student’s entrance and exit from an alternative education program, transitional services are coordinated with the home school, alternative education program, the student, and parents to ensure a successful return.
4.9
Transition services are routinely evaluated to determine the program’s effectiveness in promoting the return and continued success of students in the traditional school program (including follow-up visits with past participants).
*Copies of the school enrollment letter, birth certificate, social security card, immunization records, report cards, transcripts, TCAP/ Gateway scores, attendance records, discipline records,
Measuring Success 38

special education file and IEP (if applicable), current health treatments and medications needed during school hours are given to the alternative education program
Standard 5.0: Support Services
An exemplary alternative education program embodies a sound set of support mechanisms that contribute to optimal student development.
5.1The program provides a comprehensive student assistance program that includes referrals to community agencies as needed.
5.2Relationships are established to support the physical and mental health needs of the students enrolled.
5.3The program provides guidance, tutoring, and counseling to promote student performance.
5.4The program offers a broad range of weekly individual and/or group counseling sessions.
5.5The program utilizes researched based dropout prevention strategies and character building programs (e.g. conflict resolution, mentoring programs, etc.).
5.6 The program provides the appropriate services to meet the educational needs of students with disabilities, limited English proficiency, and/or significant skill deficiencies.
Standard 6.0: Parent/ Community Engagement
An exemplary alternative education program strives to establish collaborative partnerships with the community and parents to nourish a system of shared responsibility for enrolled students.
6.1 Administration ensures that effective communication and interaction take place between parents and school personnel including being continually notified of their child’s progress.
6.2The program affords opportunities for parents to be included and supported in the development of their children.
Standard 7.0: Staffing and Professional Development
Measuring Success 39

An exemplary alternative education program is staffed with effective, innovative, and qualified staff. Furthermore, the program has ongoing, relevant professional development to ensure both teacher and student success.
7.1 The program employs enthusiastic, energetic, and innovative teachers who demonstrate multiple teaching styles.
7.2Teachers are highly qualified.
7.3The staff understands and practices the concept of facilitative learning.
7.4The diversity of the staff mirrors the diversity of the student body.
7.5The school district provides a sufficient number of trained teaching assistants, guidance counselors, and other appropriate support individuals.
7.6The experience of the faculty mirrors the experience of the school district.
7.7Surveys of program content and staff development needs are distributed to establish both short and long-term professional development plans.
7.8Staff members participate in professional development opportunities that facilitate personal and professional growth.
7.9Sufficient resources, such as time and substitutes, allow staff to participate in workshops, conferences, and seminars.
7.10 Administration ensures that ongoing professional development helps build staff’s capacity through the use of research based strategies and ensures that learned techniques are implemented.
Standard 8.0: Individualized Learner Plans
An exemplary alternative education program individualizes the student’s curriculum and instruction using a learner plan to engage and challenge the student.
8.1The program uses available resources to develop a learner plan based on the student’s differentiated (remedial or accelerated) needs.
Measuring Success 40

8.2The Student Support Team is actively involved in forming and monitoring the student’s progress on the learner plan and provides the support necessary for achievement.
8.3The learner plan reviews current credit attainment and ensures that the student is making adequate progress toward graduation.
8.4Teachers use individual student data in making instructional decisions and developing the learner plan.
8.5Plans incorporate goals for changing negative behavior patterns which may have impeded the student’s success (e.g. absences, suspension, tardiness, etc.).
8.6The learner plan should address required services to meet the educational needs of students with disabilities.
8.7Plans should integrate the student’s 4-year graduation plan.
Standard 9.0: Life Skills
An exemplary alternative education program integrates life skills development into the curriculum and instruction.
9.1The program utilizes available resources to address the specific life skill needs of participants (e.g. career exploration, citizenship, conflict resolution, decision making skills, job shadowing, problem solving skills, public speaking, social skills, teamwork, time management, work readiness, etc.).
9.2Students have opportunities to put relevant life skills into action.
9.3Instruction includes self assessment, paired with short and long term goal setting.
9.4Curricula address constructive criticism and how to properly react.
9.5Students have the opportunity to engage in service learning.
Standard 10.0: Curriculum and Instruction
Measuring Success 41

An exemplary alternative education program utilizes Tennessee’s state standards, incorporates innovative teaching strategies, delivers research-based instructional techniques, and provides the resources necessary to foster student learning and achievement.
10.1 All students have access to the academic core curriculum.10.2 Teachers use Tennessee’s standard core course of study to facilitate instruction.
10.3Formal and informal assessments document students’ progress toward completion of the individualized learner plan.
10.4Differentiated instruction is provided to accommodate students’ various learning styles and recognizes multiple intelligences.
10.5Assessment results are utilized to determine programming changes and allows the student to monitor his/her own learning and progress.
10.6Instructors collaborate with other teachers and the home school to enhance teaching strategies and close learning gaps.
10.7Group delivery systems are used to support collaboration and teamwork.
10.8Instruction meets the learning style needs of each student and includes opportunities for hands-on, project oriented (experiential) activities.
10.9Instructional strategies are aligned with the goals and expectations of the students’ individualized learner plan(s).
10.10Teaching across all curricula is employed by instructors.
10.11Distance learning is utilized when appropriate (e.g. e4TN, GED +2, etc.).
10.12Technology is embedded in the curricula delivery process.
10.13The curriculum is supported by access to a balance of up-to-date and well-maintained collection of textbooks, library media, technology, software and other instructional supplies and materials.
Measuring Success 42

10.14 The program has ensured that the curriculum is implemented, supported and accessible for all students.
Standard 11.0: Student Assessment
An exemplary alternative education program routinely assesses students’ progress and adjusts instruction accordingly.
11.1The purpose of assessments are clearly defined and communicated to students, staff, and parents.
11.2Teachers use formative and summative assessment tools that are frequent, rigorous, and aligned with curriculum and instruction to track student performance and progress.
11.3Teachers use assessments to analyze student work and identify achievement gaps.
11.4Assessment, curriculum, and instruction are directly linked to planning for and accommodating a variety of learning styles and multiple intelligences.
11.5Valid and reliable assessments are aligned with district-wide measures to identify student progress as prescribed by the State of Tennessee.
11.6 Results of assessments are used to inform the students and parent(s) of progress, guide the individualized learner plan, and modify the instructional delivery.
Standard 12.0: Monitoring and Program Assessment
An exemplary alternative education program systematically conducts program evaluations while using that data for continuous improvement.
12.1 The school district routinely conducts evaluations to determine progress toward the program’s mission, standards, and plan for improvement.
12.2 Program evaluations include a review of student achievement data (e.g. TCAP test scores, course grades, drop-out data, etc.).
12.3 Program evaluations include a review of student behavioral progress (e.g. discipline data, recidivism rates, etc.).
12.4 Program evaluations are used to develop or update the plan for program improvement.12.5 The school district makes use of strategic long-range planning to continuously improve
alternative education services.
Measuring Success 43

12.6 The school system uses an external evaluator to examine attainment of exemplary practices in alternative education.
Alternate School Accountability Model from the state of California Applied by the ABC Unified school district Developed by the PSAA Advisory Committee
Indicator Performance Standard Performance Standard Performance Standard Performance Standard Performance Standard Performance Standard Performance Standard Performance Standard Measure
Indicator Immediate Action
Immediate Action
Growth Plan
Growth Plan SufficientSufficient Commendabl
eCommendabl
e1. Improved Student Behavior The percentage of classroom-based long-term students recommended for suspension or expulsion under Education Code (EC) 48900 (i) and/or (k).
78.0–100.0%78.0–
100.0% 42.0–77.9%42.0–77.9% 7.0–41.9%7.0–41.9% 0.0–6.9%0.0–6.9% Behavior and pre-learning readiness
2. SuspensionThe percentage of long-term students who received out-of-school suspensions.
71.0–100.0%71.0–
100.0% 36.0–70.9%36.0–70.9% 9.0–35.9%9.0–35.9% 0.0–8.9%0.0–8.9% Behavior and pre-learning readiness
3. Student PunctualityThe percentage of days all classroom-based long-term students were present on time at the beginning of the school day.
N/AN/A 0.0–89.9%0.0–89.9% 90.0–100.0%90.0–
100.0% N/AN/AOn-time attendance
and student engagement
4. Sustained Daily AttendanceThe percentage of days all long-term students were present in class and completed their full assigned instructional day.
0.0–69.9%0.0–69.9% 70.0–89.9%70.0–89.9% 90.0–97.9%90.0–97.9% 98.0–100.0%98.0–100.0% Holding power and student persistence
5. Student PersistenceThe percentage of classroom-based long-term students and/or long-term students in independent study considered accounted for by the October California Basic Educational Data System (CBEDS) School Information Day.
N/AN/A 0.0–89.9%0.0–89.9% 90.0–100.0%90.0–
100.0% N/AN/A Holding power and student persistence
6. AttendanceThe percentage of apportionment days claimed for all long-term students.
0.0–64.9%0.0–64.9% 65.0–83.9%65.0–83.9% 84.0–94.9%84.0–94.9% 95.0–100.0%95.0–100.0% Attendance and persistence
8. Writing Achievement(See SBE Approved Instruments for Indicators 8, 9, and 10 on page 3)
School reports show the total number of students with growth and with no growth on the achievement test
selected by the ASAM school. Schools are not provided with their school year performance levels for the academic achievement indicators (i.e., Reading,
Writing, and Mathematics) because of the early stage of data collection on these indicators; additional data are required to ensure reliable school classification.
Academic achievement
9. Reading Achievement(See SBE Approved Instruments for Indicators 8, 9, and 10 on page 3)
School reports show the total number of students with growth and with no growth on the achievement test
selected by the ASAM school. Schools are not provided with their school year performance levels for the academic achievement indicators (i.e., Reading,
Writing, and Mathematics) because of the early stage of data collection on these indicators; additional data are required to ensure reliable school classification.
Academic achievement
10. Math Achievement(See SBE Approved Instruments for Indicators 8, 9, and 10 on page 3)
School reports show the total number of students with growth and with no growth on the achievement test
selected by the ASAM school. Schools are not provided with their school year performance levels for the academic achievement indicators (i.e., Reading,
Writing, and Mathematics) because of the early stage of data collection on these indicators; additional data are required to ensure reliable school classification.
Academic achievement
11. Promotion to Next Grade The percentage of K–6 long-term students promoted to the next grade level.
N/AN/A 0.0–89.9%0.0–89.9% 90.0–100.0%90.0–
100.0% N/AN/A Grade completion and academic progress
Measuring Success 44

Indicator Performance Standard Performance Standard Performance Standard Performance Standard Performance Standard Performance Standard Performance Standard Performance Standard Measure
12A/B. Course Completion (Actual)The percentage of courses passed by all middle school long-term students based on the number of courses attempted.
N/AN/A 0.0–89.9%0.0–89.9% 90.0–100.0%90.0–
100.0% N/AN/A Course completion and performance
12C. Course Completion (Average)The average number of courses passed by all middle school long-term students per month of enrollment.
N/AN/A 0.0–0.60.0–0.6 0.7–2.00.7–2.0 N/AN/A Course completion and performance
13A. Credit Completion (Actual)The percentage of graduation credits earned by all high school long-term students based on the number of graduation credits attempted.
13A. Credit Completion (Actual)The percentage of graduation credits earned by all high school long-term students based on the number of graduation credits attempted.
0.0–66.9%0.0–66.9% 67.0–81.9%67.0–81.9% 82.0–96.9%82.0–96.9% 97.0–100.0%
Credit completion and academic progress
13B. Credit Completion (Average)The average number of graduation credits earned by all high school long-term students per month of enrollment.
13B. Credit Completion (Average)The average number of graduation credits earned by all high school long-term students per month of enrollment.
0.0–3.90.0–3.9 4.0–5.44.0–5.4 5.5–9.45.5–9.4 9.5–15.0 Credit completion and academic progress
14. High School GraduationThe percentage of high school long-term students who passed the California High School Exit Examination and received a high school diploma.
14. High School GraduationThe percentage of high school long-term students who passed the California High School Exit Examination and received a high school diploma.
0.0–49.9%0.0–49.9% 50.0–72.9%50.0–72.9% 73.0–95.9%73.0–95.9% 96.0–100.0%
Credit and program completion
15A. General Education Development CompletionThe percentage of General Education Development (GED)-eligible long-term students who passed all tests for GED certification.
15A. General Education Development CompletionThe percentage of General Education Development (GED)-eligible long-term students who passed all tests for GED certification.
N/AN/A 0.0–74.9%0.0–74.9% 75.0–100.0%75.0–
100.0% N/A Program completion
15C. General Education Development Section CompletionThe percentage of GED sections passed by all long-term students eligible to take the GED.
15C. General Education Development Section CompletionThe percentage of GED sections passed by all long-term students eligible to take the GED.
N/AN/A 0.0–74.9%0.0–74.9% 75.0–100.0%75.0–
100.0% N/A Program completion
Source: http://www.cde.ca.gov/ta/ac/am/asampriordocuments.asp Sources that have applauded this model: “Raising the Bar, Building Capacity: Driving Improvement in California’s Continuation High Schools”. Ruiz de Velasco; Mclaughlin. 2012. “Alternative Education Options: A Descriptive Study of California Continuation High Schools”. Ruiz de Velasco et al. 2008.
This model is specific and covers a large range of pertinent areas to a school’s success: participation, culture, academic improvement. The goals are realistic. Also, the fact that there are no mandated proficiency test scores that must be reached is important. Growth is more important to prove that a school is successful, rather than by the smarts of their students.
Measuring Success 45
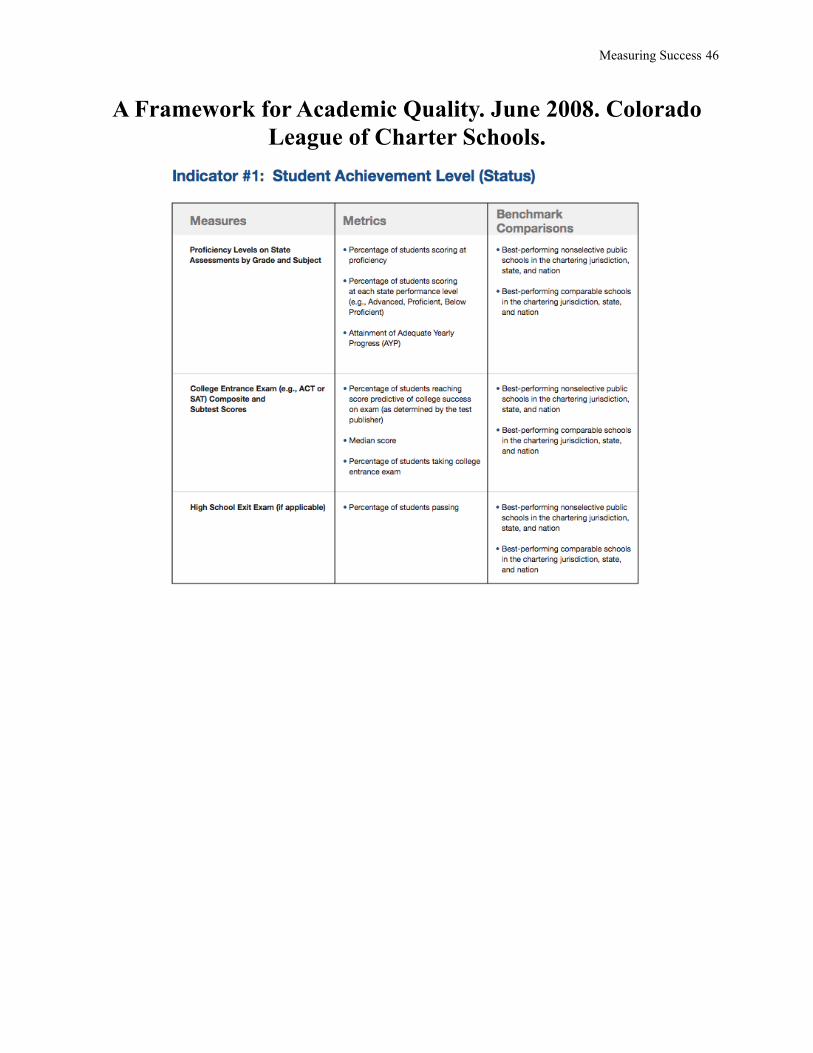
A Framework for Academic Quality. June 2008. Colorado League of Charter Schools.
Measuring Success 46

Measuring Success 47

Measuring Success 48

Measuring Success 49

Texas Alternative Education Campuses (AEC) Accountability Model
Accountability Framework measures 4 basic assessments in order to determine if the school should receive a rating of ‘AEA: Academically Acceptable’, ‘AEA: Academically Unacceptable’, ‘AEA:Not Rated- Other’ and ‘AEA Not Rated- Data Integrity Issues’
The four categories that are measures are the percentage of students who met standard and those who did not on the TAKS. The TAKS is taken by students grades 7-12. The school was rated as Academically Acceptable if at least 55% of their students met standard in 2011. This percentage of students who must pass increases by 5% every year. The students‘ scores are measured vertically. It also measures ELL student progress which must also meet the 55% passing benchmark. The ELL test is for those with limited english proficiency, as well as for fluent english speakers by using the reading section from TAKS. The model also measures the percent of those students who received their GED, graduated, or who are continuing their education, those students who are still in school, and those who dropped out. Finally the model measures the percent of those students from grades 7-12 who drop out from the AEC, or their charter.
Measuring Success 50
The schools are also graded on the Gold Performance Assessment (GPA). The GPA does not account for the schools assessment rating, but measures attendance rate, the percent of students who completed their recommended high school program/distinguished achievement program, the percent of students who participated in advanced courses, in AP/IB courses, SAT/ACT results, and those who were determined as ‘college-ready’, those who had commended performance in academic subjects, and Texas Success Initiative scores.
The upsides of this model is that it doesn’t hold the school accountable for low student performance on the SAT/ACTs or for attendance. The downside of that is that if the school is failing, then there really will be low attendance and schools should be conscious of that. Comparatively, this researcher believes that the ratings that AEC campuses receive are too broad. A school is either rated as successful or in need of improvement, and by lumping all these schools together so generally does not help parents, the district, or the state distinguish between those schools. Finally, the continuation rate is excellent for determining a school’s true success: by the effect that it has had on the lifestyle of it’s students.
Sources: http://ritter.tea.state.tx.us/perfreport/account/2011/manual/manual.pdf http://ritter.tea.state.tx.us/aea/2011/statesummarytable211.pdf
Measuring Success 51

North Carolina State Alternative Learning Program Standards and Accountability Model
The state created this model specifically for their ALP schools. It’s a good model that is clear but also gives schools a great amount of autonomy because these schools only have to chose 3 of the 8 ‘local menu options’ to measure their own accountability. However, one of the schools’ chosen criteria must be numbers 4 or 5. Data reported in the year 2000 found that the most preferred options were (in descending order) “increased parental involvement, increased attendance, improved GPAs, improved safety, reduced suspensions, improved customer satisfaction, and reduced dropouts”. The most typically reported problems were “nothing to measure, combining two goals into one, not providing information on how the objective/goal was to be measured, and not being able to define a baseline”. This researcher finds that this model is very comprehensive, and that the specific problems that these schools were reported encountering should be solved by specificity from the district rather than the state level. Indeed, Brewer, Feifs, and Kaase found that “school districts were encouraged to customize the development of their alternative schools”.
A copy of the state’s accountability framework has been inserted below for reference. I. Two Components Based on State Testing.
A. High School Only: 1.End of Course Test(s) Results; and 2. Change in Competency passing rate (from the end of 8th grade to the
end of 10th grade).B. Combination of High School and Lower Grades:
i. End of Course Test(s) results and End of Grade Test(s) results; andii. Change in Competency passing rate (from the end of 8th grade to the
end of 10th grade).C. Grade 8 or Lower:
1.& 2. End of Grade Test(s) and End of Course Test(s) results (shall count twice).
II. The Performance Composite shall be reported when applicable.
III. Menu of Local Options
The local accountability options are numbered one through eight (1-8). An Alternative School will select three different local options, one of which must be number four (4) or number (5).
Menu of Local Options
1. Attendance Goal: The attendance rate was ____________ and will increase to____________
(Factors to consider when addressing this goal:
Measuring Success 52

· Absences· Unexcused absences· Violation of LEA attendance policies)
2. DropoutsGoal: The dropout rate was __________ and will decrease to____________
(Factors to consider when addressing this goal:· Students who were counted as dropouts returning to school· Students making successful transitions to traditional schools or other positive
settings)
3. School Safety/Student ConductGoal: The percentage of students receiving discipline referral was________ and will decrease to _____________.
(Factors to consider when addressing this goal:· Reportable criminal offenses· Students receiving long and/or short term suspensions· Acceptable inspection reports)
4. Higher Expectations for Student AchievementGoal: The percentage of students making better grades and/or enrolled in higher level course(s) was ___________ and will increase to __________.
(Factors to consider when addressing this goal:· Students enrolled in higher level courses· Students whose GPA for the year improved by at least one letter grade· Students promoted at the end of the regular school year)
5. Student Progress and ProficiencyGoal: The percentage of students making measurable progress was ___________ and will increase to___________.
(Factors to be considered when addressing this goal:· Students moving up to the next EOG or EOC achievement level· Students scoring at proficiency on EOGs and/or EOCs· Students passing other required tests)
6. Parent InvolvementGoal: The percentage of parents actively involved now is _________and will increase to___________.
(Factors to consider when addressing this goal:· Parents participating in referral/placement decisions· Parents participating during the exit/transition process· Parents participating in student/school activities)
7. Community InvolvementGoal: The number of community members involved in the school is _______and
Measuring Success 53

will increase to ___________.(Factors to consider when addressing this goal:· Students completing community-based activities · Students actively engaged with mentors and/or tutors· Volunteer contact hours)
8. Customer SatisfactionGoal: Percentage of students, parents and staff expressing satisfaction with the school was ________and will increase to ________.
(Factors to consider when addressing this goal:· Responses to an annual climate survey· Parents and students expressing satisfaction· Staff expressing satisfaction)
IV. Award and Recognition Criteria
a. 5/5 — Analogous to High Growthb. 3/5 or 4/5 — Analogous to Expected Growthc. 2/5 — Analogous to No Recognitiond. 1/5 or below — Analogous to Low Performing
V. Additional Reporting
Alternative Schools also must report the following to their local boards of education.
a. Number and percentage of students referred to the Alternative School by each sending school (calculated by month)
b. Demographic information of students referred to the Alternative School by each sending school (calculated by month)
c. Number and percentage of students who return to their home school (calculated by month)
d. Demographic information of students who return to their home school (calculated by month)
e. Any other information that the local board of education deems necessary and pertinent to assess the success of students placed at risk.
In terms of the push for autonomy by the Achievement School District, this researcher believes that this model meets that attitude. However, because the ASD is a district, it is the duty of the district to set specific goals for schools in order to eliminate the problems that were cited above. Sources: Brewer, Dee; Feifs, Helmuts; Kaase, Kris. “Accountability Policy for North Carolina’s Alternative Schools, Year One Results”. February 2001. “Alternative Learning Programs and Schools, Standards and Implementation Procedures”. North Carolina Department of Public Instruction. January 2000.
Measuring Success 54

Chicago Public Schools Optional School Accountability Model
Measuring Success 55

Measure Definition Calculation
Avg. Student Growth Percentile
Average fall-to-spring, fall-to-winter, or winter-to-spring growth percentile of students on the STAR reading and math assessments
For each school, an average student growth percentile will be calculated from available individual growth percentiles from fall-to-spring, fall-to-winter, or winter-to-spring windows. An average student growth percentile is calculated separately for reading and math.
Percent Meeting Student Growth Targets
Percentage of students with a growth percentile of 40 or higher on the STAR reading and math assessments.
Numerator: number of students with a growth percentile of 40 or higher on the STAR assessment Denominator: number of students with valid pretest and posttest scores on the STAR assessment (Students are counted once per subject)
One Year Graduation Rate
Percent of graduation eligible students who graduate by the end of the school year
Numerator: number of graduation eligible students who graduate at any point during the school year. Denominator: number of students that have the minimum number of credits at the time of enrollment to graduate at the end of the school year.
Credit Attainment
Percent of students who earn the total credits possible during their time of enrollment
Numerator: number of students earning the total credits possible during their time of enrollment Denominator: number of students receiving grades during their time of enrollment. Students who have not been enrolled long enough to earn credits are excluded.
Measuring Success 56

Measure Definition Calculation
Annual Stabilization Rate
Percent of stable (students enrolled for at least 42.5 membership days) students who are enrolled at the end of the school year, completed the program, or successfully transitioned to another Chicago Public School
Numerator: number of stable students who enrolled at any time during the year and are enrolled at the end of the year, complete the program, or successfully transition to another CPS school. Denominator: number of stable students enrolled at any time during the year, excluding students with a non-dropout leave code or a verified transfer.
Attendance Rate
Average daily attendance rate of the school
Numerator: total number of present days for students during the year Denominator: total number of membership days for students during the year
Growth in Attendance Rate
Percent of students that show an improvement of at least 3 percentage points in their individual daily attendance rates at an Alternative School compared to their daily attendance rate in the previous school year.
Numerator: number of stable students whose current year attendance rate at their school of enrollment is at least 3 percentage points greater than their average year-end attendance rate during the previous school year or who have maintained a 90% attendance rate in the current year Denominator: number of stable students with documented current year attendance
Measuring Success 57

Measuring Success 58

Pathways in Education High School Composite Performance Score Calculation Draft
Measure Pathways Description
1 Year School Success Measure, Growth by Year
Within a student group (co-hort) who has been enrolled in the program for 6 (or more) months, measures the one-year growth in high school success rate, which reflects growth across subjects (EOC and TCAP) and high school graduation rates
TVAAS Index Value-added measure of student progress within a grade and subject, which demonstrates the influence the school has on its current students’ performance (within cohort group)
STAR Growth- Target Attainment
Percent of students meeting or exceeding their STAR growth targets within student cohort group
STAR Growth Percentile Compares the average of a schools’s students’ growth by end of year with national norms for schools whose students have started about the same level at the beginning of the year
3-year School Success Measure
Measures reflect proficiency across subjects (EOC and TCAP) and high school graduation rate against schools with similar student demographics and FRL
ACT Composite One-year growth in score from eligible and college-interested students who show growth from PLAN test taken in fall of 12th grade to ACT results in spring of 12th grade
Achievement Gap Closure In-School GAP Closure (by race, SPED, ELL, FRL)
Measures the year-to-year decline in the achievement gap (A gap=difference in % P/A between all subgroups and their comparison groups)
Student Equity (FRL Only) Percent of FRL students
Stabilization Rate Percent of students actually enrolled for at least 60-instructional days of the # of students possibly enrolled for at least 60-instructional days
Community Impact Measure Based on increase value in student/parent survey results
Measuring Success 59

Literature Review
Brewer, Dee; Feifs, Helmuts; Kaase, Kris. “Accountability Policy for North Carolina’s Alternative Schools, Year One Results”. February 2001. This report followed up the implementation of North Carolina’s accountability program for its alternative learning programs. The document reiterated the details of the accountability program as well as explained the policies a bit more clearly. The state’s program requires schools to select a number of measures to which they will be held accountable. Data found that the most preferred accountability measures were (in descending order):
· “increased parental involvement· increased attendance· improved GPAs· improved safety· reduced suspensions· improved customer satisfaction, and· reduced dropouts”
The most typically reported problems were:· “nothing to measure· combining two goals into one· not providing information on how the objective/goal was to be measured, and· not being able to define a baseline”
Brewer, Feifs, and Kaase found that “school districts were encouraged to customize the development of their alternative schools,” but problems arose at the school level because districts did not follow this encouragement.
Ernst, Jody L.; Turnbull, Jennifer J. “Alternative Growth Goals for Students Attending Alternative Education Campuses: an Analysis of NWEA’s MAP Assessment: Technical Report”. May 2010.
Ernst and Turnbull studied the growth of alternative education school students versus the growth of all other students who were administered the Measures of Academic Progress (MAP) test. The test is taken on the computer, and can be taken up to four times a year. The authors note that this is a positive feature of the exam because alternative education campuses (AECs) typically serve more mobile students than those of regular schools. MAP can then measure student growth in a shorter period. However, the exam was created only for students in grades 2 through 10. Though NWEA states that the MAP exam can be administered to 11th and 12th grade students, there is no norming data for those age groups, which results in the inability to set informed RIT targets or measure growth relative to national peers. This is problematic because a majority of AECs serve high school students. Despite that, this report had participating AECs administer the exam to 11th and 12th grade students in an effort to determine if AEC student growth is comparable to the growth of other students nationwide. They found student academic
Measuring Success 60

growth to be lower than expected in AECs and ultimately cautioned districts and school leaders to be conscious of this when setting growth goals to determine a school’s success. A study was done using a small sample of AEC schools in 2005; average growth of AEC students across grades and subjects was noted. The Achievement School District will be in contact with the NWEA to see if an updated study has been done and if it is possible to obtain the raw data.
Hemmer, Lynn M.; Shepperson, Tara L. “College Readiness, Alternative School Students, and Implications from Texas.” 2012.
This report found that in Texas, though students were graduating from alternative schools beyond the state mandated minimum, many graduates weren’t college-ready and were less college-ready than their peers. In the state of Texas, a student is labeled “college-ready” if they have done at least one of the following: met or exceeded a certain score on their ACT or SAT exams, have taken the Texas Success Initiative (TSI) Higher Education Readiness Component, completed advanced courses in high schools, participated in AP/IB courses, have completed a high school academic program that meets the Recommended High School Program or the more rigorous Distinguished Achievement Program (program standards defined by the state), or have met or exceeded benchmark scores on their high school exit exam in both math and English language arts.The research does not point to the direct reason why alternative school graduates are less college ready than their regular school peers, but suggests it could be one or a combination of a few things: “failure to advance students academically [or] the slow pace of progress”. Hemmer and Shepperson acknowledge that alternative education students are generally less proficient than regular school students but indicate that rigorous course work, support for standardized test taking, and more advanced classwork would increase the number of college ready alternative school graduates. Thus, it is important to be mindful of using this standard when setting goals for school success if using this standard at all. If alternative education schools are held accountable for the number of graduating students who are prepared for college, and the school has neither rigorous course work nor ACT or SAT tutoring, the school will most likely not have a high number of students who are college-ready. See index for Texas Alternative Education Campus Accountability Model.
Morley, Dr. Raymond E. “A Framework for Learning Alternatives Environments in Iowa”.
Dr. Morley has written and published numerous reports and recommendations in the field of alternative learning environments in Iowa. The recommendations in this document have been adopted as the standard for measuring accountability in the state of Iowa. It can be found on the Iowa Department of Education’s website. According to the author, the most essential components of an alternative education school or program are:· purpose· student focus· staff focus, and · management and support focus.
Measuring Success 61
In terms of staff evaluation, Morley recommends that all members are involved in self-assessment. In terms of student focus, he recommends that multiple measures are used to measure academic success as well as a few locally developed measures in order to determine that the framework is suited to the school’s environment. Morley pushes for personalized planning for each student. He believed that standardized testing that emphasizes comparative standings should be an option for those who wish to compare their standings with others on a national level. Instead, he recommends that ‘the measurement of individual growth rather than ranking and comparing to others is practiced to encourage learning and motivate the learner.”
“Alternative Learning Programs and Schools, Standards and Implementation Procedures”. North Carolina Department of Public Instruction. January 2000
This research by the North Carolina Department of Public Instruction proposed state-wide standards for all of the alternative learning programs (ALPs). These standards demanded:· a clear school mission· leadership· a positive culture and climate· professional development· parent/community involvement· a rigorous and effective curriculum and instructions · monitoring and assessment
This document proposed that schools meet the “monitoring and assessment” standard by measuring student growth through testing. Teachers must use “traditional and non-traditional methods of assessment to track student performance and progress” though no specific assessments are named in this document beyond those administered by the state. Also, teachers and administrative staff are mandated to work with parents and the students to develop a “Personalized Education Plan” (PEP) for each incoming student. Parent(s), staff, and student must agree to the plan before it is put in place. The PEP consists of academic and proficiency goals for the student. The student is deemed successful if they complete the goals outlined in the PEP. The state mandates that two of the goals be based on results of state testing. The Department of Public Instruction also proposed that schools implement criteria to measure behavioral or community success at the student level (in the PEP) as well as at the school level. The Department proposed that ALPs choose from a “menu of local options”. The proposed objectives or numerical goals in each of these categories were not explicitly stated in the state framework model. Rather, the state lists factors to consider when addressing the goals.These “local options” included:· Attendance (Factors to consider: absences, unexcused absences, violation of attendance
policies)· Dropouts (Factors to consider: students who were counted as dropouts returning to
school, students making successful transitions to traditional schools or other positive settings)
· School Safety/Student Conduct (Factors to consider: reportable criminal offenses, students receiving long and/or short term suspensions, acceptable inspection reports)
Measuring Success 62

· Higher Expectations for Student Achievement (Factors to consider: students enrolled in higher level courses, students whose GPA for the year improved by at least one letter grade, students promoted at the end of the regular school year)
· Student Progress and Proficiency (Factors to consider: Students moving up to the next achievement level, students scoring at proficiency, students passing other required tests)
· Parent Involvement (Factors to consider: parents participating in referral/placement decisions, parents participating during the exit/transition process, parents participating in student/school activities)
· Community Involvement (Factors to consider: Students completing community-based activities, students actively engaged with mentors and/or tutors, volunteer contact hours)
· Customer Satisfaction (Factors to consider: Responses to an annual climate survey by staff, parents, and students, parents and students expressing satisfaction, staff expressing satisfaction)
ALPs must select 3 from the list of 8, and set numerical goals in order to measure their own success. This allows the schools autonomy, and the ability to determine which measures apply or don’t apply to their school environment. Of note is that this level of autonomy could allow too much leeway for schools to ‘pass’. The school administrators could feasibly pick the criteria that they know their school will exceed. This report did not clarify which criteria matter or should be weighted more than others, or if all were weighed the same in the eyes of the Department of Public Instruction. The schools are recognized on a 1-5 scale as being low performing, not receiving recognition, having expected growth, or high growth. See Index for North Carolina Alternative Learning Program Accountability Model.
“Exemplary Practices in Alternative Education: Indicators of Quality Programming”. National Alternative Education Association. January 2009.
This report recommends the following ten standards and indicators of quality that all effective and successful alternative education schools and programs should demonstrate:· mission and purpose· leadership· climate and culture· staffing and professional development· curriculum and instruction· student assessment· transitional planning and support· parent/guardian involvement· collaboration· program evaluation
Under each standard, the NAEA lists indicators that the standard is being upheld. All of these indicators are measurable which is positive for those schools who apply these standards to their schools, but they do not provide much autonomy for schools that have more independent programs and methods. For example, under the ‘mission’ standard, one indicator is that “the
Measuring Success 63

mission, goals, and expected outcomes are documented, published and visible to students, parents/guardians, program staff, and the community.” Many of these standards demand certain inputs such as small classrooms, transition services, parent surveys, etc. In terms of student assessment however, the document is helpful. Because each state appears to have unique accountability frameworks for student success, a model from a national organization could foster more semblance across the board. The state of Tennessee has in fact adopted many of these indicators and standards into their own state model, but has modified it to be more broad. See Index for the Tennessee State Alternative Education Program Model/Standards.
“A Framework for Academic Quality: A Report from the National Consensus Panel on Charter School Academic Quality”. The Charter School Quality Consortium. June 2008.
This report was compiled by the Charter School Quality Consortium. The document does not specify research or recommendations as it relates to alternative education or continuation schools, but the comments are general enough that they can apply to an alternative school. Two things that the Consortium recommends for all schools using their methods are that the schools use the entire framework, and that they specify each of the measures and goals by grade, class, school type, etc. The four indicators of academic quality that must be measured according to the Consortium are:
• student achievement level• student progress over time• postsecondary readiness and success which is defined broadly as “readiness to earn a
competitive wage and preparation for economic self-sufficiency”. • student engagement
Each indicator is broken down into measures, then metrics, and benchmark comparisons are listed. See Index for the Framework of Academic Quality.
Ruiz de Velasco, Jorge; McLaughlin, Milbrey. “Raising the Bar, Building Capacity” Driving Improvement in California’s Continuation High Schools.” May 2012.
This report contains valuable details and findings on California continuation schools. The state’s Alternative School Accountability Model is observed as being too broad by Ruiz de Velasco and Milbrey;though well developed and executed, there isn’t enough specificity at the school level. Throughout the report, the researchers make recommendations such as clarifying academic goals and limiting involuntary transfer (of students with behavioral problems) to continuations schools because the purpose of a continuation school is not rehabilitation. They also suggested “rewarding continuous student-proficiency based growth at the school level” so that these schools may take part in the AYP calculation, as well as providing a full day of in-class instruction if a continuation student desires, collaboration with other education options (like a vocational school or community college), and using a 5 or 6 year graduation rate as standard. The rest of the recommendations were specifically for district leaders. Ruiz de Velasco and
Measuring Success 64

Milbrey’s work suggests that most of the faults in the continuation schools stemmed from the district not defining specific standards, rather than the schools themselves. Using these missteps as a guide, the Achievement School District can aide their schools’ successes.
Measuring Success 65

Bibliography
Bakke, Robert., Lewis, Joy W. “California’s Alternative Schools Accountability Model (ASAM)”. Powerpoint. September 2005
Brewer, Dee., Feifs, Helmuts., Kaase, Kris. “Accountability Policy for North Carolina’s Alternative Schools, Year One Results”. February 2001.
Ernst, Jody L.; Turnbull, Jennifer J. “Alternative Growth Goals for Students Attending Alternative Education Campuses: an Analysys of NWEA’s MAP Assessment: Technical Report”
Hemmer, Lynn M.; Shepperson, Tara L. “College Readiness, Alternative School Students, and Implications from Texas.” 2012.
Aron, L. Y. U.S. Department of Labor, Employment and Training Administration. (2006). An overview of alternative education National Center on Education and the Economy.
Morley, Dr. Raymond E. “A Framework for Learning Alternatives Environments in Iowa”. 1994.
Raywid, Mary Anne. “Alternative Schools: The State of the Art.” September 1994. ERIC
Reimer, Mary S., Cash, Terry. “Alternative Schools: Best Practices for Development and Evaluation. Effective Strategies for School Improvement. Alternative Schooling.” 2002.
Ruiz de Velasco, J., Austin, G., Dixon, D., Johnson, J., McLaughlin, M., & Perez, L. (2008). Alternative education options: A descriptive study of california continuation high schools. (pp. 1-12).
Ruiz de Velasco, Jorge., McLaughlin, Milbrey. “Raising the Bar, Building Capacity” Driving Improvement in California’s Continuation High Schools.” May 2012.
Measuring Success 66

Non-Academic Sources
Allen, Jeff., Bassiri, Dina., Noble, Julie. “Statistical Properties of Accountability Measures Based on ACT’s Educational Planning and Assessment System.” August 2009.
“Alternative Education Program Model/Standards.” Tennessee State Board of Education. Adopted April 2000. Revised August 2008.
“Alternative Learning Programs and Schools, Standards and Implementation Procedures”. North Carolina Department of Public Instruction.
Bursey, A. (2013, 07 22). Interview by R Barr. Accountability in Hollywood Success Academy.
“Draft SY14-15 Performance Policy”. July 2013. Powerpoint. Chicago Public Schools
Ernst, Jody L. “NWEA AEC Research Findings to Inform How to Best Articulate the Assessments Use For Purposes of AEC Accountability.” Colorado Department of Education.
Ernst, J. L. (2013, 07 29). Interview by R Barr. Accountability Measures and Setting Targets in Alternative Education Schools.
Ferguson, C. (2013, 07 18). Interview by R Barr. Accountability in District 79.
“A Framework for Academic Quality: A Report from the National Consensus Panel on Charter School Academic Quality”. The Charter School Quality Consortium. June 2008.
“Getting the Most Out of STAR Enterprise: Using Data to Inform Instruction and Intervention.” Renaissance Learning. 2012
“Outcomes from Assessment Comparison.” Network of Alternative Schools. Chicago Public Schools. July 2013.
Ramero, M. (2013, 07 16). Interview by R Barr. Accountability in the Los Angeles Unified School District.
Tennessee Department of Education: Annual Alternative Education Report. (School Year 2009-2010). March 2011. Http://state.tn.us/education/learningsupport/alted.shtml
“Texas Education Agency: 2011 Summary Data Table. Alternative Education Accountability (AEA) Procedures.” November 2011.
Measuring Success 67

Thomas, A. (2013, 07 8). Interview by R Barr. Alternative Education and the Achievement School District.
“The 2011 Accountability Rating System for Texas Public Schools and School Districts.” Texas Education Agency. May 2011. http://ritter.tea.state.tx.us/perfreport/account/2011/manual/index.html
(2009). Exemplary practices in education: Indicators of quality programming. National Alternative Education Association.
Measuring Success 68