measurements of sediment oxygen demand characteristics of the
TRANSCRIPT


REPORT OF INVESTIGATSON 76
Measurements of Sediment Oxygen Demand Characteristics of the Upper Illinois Waterway
by THOMAS A. BUTTS
TITLE: Measurements of Sediment Oxygen Demand Characteristics of the Upper Illinois Waterway.
ABSTRACT: Oxygen demand characteristics of bottom sediments for a 113-mile reach of the Upper Illinois Waterway were measured in situ at 22 locations in order to assess the effects of such demand on the dissolved oxygen resources of the overlying water. For the measurements of sediment oxygen demand (SOD), a bottom sampler was specially designed to entrap and seal a quantity of water at the river bottom. Changes in dissolved oxygen (DO) concentrations within the entrapped water were recorded by a DO probe fastened in the sampler. SOD values for 20 undisturbed bottom locations ranged from 0.56 to 5.00 grams per square meter per day (g/m2/day), and values at 2 disturbed locations were 6.45 and 8.08 g/m2 /day. The oxygen demands of sediments in many parts of the waterway are sufficiently high to impose a significant demand on the DO content of the overly ing water. In addition to SOD measurements, 172 bottom samples were collected, described in detail, and analyzed for percent organic and dried solids content. Expressions for the relationship between these percentages and the SOD rates were developed and used to estimate probable SODs at the various sampling sites. Subsequent charts of the river bed depict the ranges of SOD values useful in engineering analyses of the waste assimilative capacity of the Upper Illinois Waterway.
REFERENCE: Butts, Thomas A. Measurements of Sediment Oxygen Demand Characteristics of the Upper Illinois Waterway. Illinois State Water Survey, Urbana, Report of Investigation 76, 1974.
INDEXING TERMS: Dissolved oxygen, river sediments, sampling, sediment oxygen demand, Upper Illinois Waterway, water pollution.

STATE OF ILLINOIS HOW. DANIEL WALKER, Governor
DEPARTMENT OF REGISTRATION AND EDUCATION RONALD E. STACKLER, J.D., Director
BOARD OF NATURAL RESOURCES AND CONSERVATION
Ronald E. Stackler, J.D., Chairman
Robert H. Anderson, B.S., Engineering
Thomas Park, Ph.D., Biology
Charles E. Olmsted, Ph.D., Botany
Laurence L. Sloss, Ph.D., Geology
H. S. Gutowsky, Ph.D., Chemistry
William L. Everitt, E.E., Ph.D., University of Illinois
Elbert H. Hadiey, Ph.D., Southern Illinois University
STATE WATER SURVEY DIVISION WILLIAM C. ACKERMANN, D.Sc, Chief
URBANA 11974
Printed by authority of the State of Illinois-Ch. 127, IRS, Par. 58.29
(10-74-2000)

CONTENTS
PAGE
Abstract 1 Introduction 1
Study area 1 Acknowledgments 2
Sampling equipment and procedures 3 SOD bottom sampler 3
SOD sampler accessories 4 SOD sampler operations 5
Sampling procedures 5 Sediment oxygen demand 5
SOD measurements 6 Temperature influences 9 DO-invertebrate influences 10 Rate of deposition influence 11 Resuspension influence 11
Sediment identification and analysis 12 Physical characteristics 12 Relationship of sediment characteristics and SOD 13
Silt-clay category 13 Sand-gravel category 15 Gravel-rock category 16
Extrapolated SOD rates 16 Summary and assessment 17 References 18 Appendix A. Unreduced sediment oxygen demand field data 19 Appendix B. Sediment oxygen demand in terms of elapsed time and DO used . . 23 Appendix C. Descriptions of sediment samples and results of analyses 25 Appendix D. Areal distribution of estimated sediment oxygen demand rates . . . 29

Measurements of Sediment Oxygen Demand Characteristics of the Upper Illinois Waterway
by Thomas A. Butts
A B S T R A C T Oxygen demand characteristics of bottom sediments for a 113-mile reach of the Upper Illinois
Waterway were measured in situ at 22 locations in order to assess the effects of such demand on the dissolved oxygen resources of the overlying water. For these measurements of sediment oxygen demand (SOD), a bottom sampler was specially designed to entrap and seal a quantity of water at the river bottom. Changes in dissolved oxygen (DO) concentrations within the entrapped water were recorded by a DO probe fastened in the sampler.
SOD values for 20 undisturbed bottom locations ranged from 0.56 to 5.00 grams per square meter per day (g/m2 /day), and SOD values at 2 disturbed (equatable to barge passages) bottom locations were 6.45 and 8.08 g/m2/day. Sand and gravel bottoms had an average SOD value of 1.39 g/m2/day and silt-clay bottoms had an average value of 3.02 g/m2/day. The oxygen demands of sediments in many parts of the waterway are sufficiendy high to impose a significant demand on the DO content of the overlying water.
In addition to SOD measurements, 172 bottom samples were collected, described in detail, and analyzed for percent organic and dried solids content. Expressions for the relationship between these percentages and the SOD rates were developed for silt-clay and sand-gravel sediments, and these expressions were used to estimate probable SODs at the various sampling sites. Subsequent charts of the river bed depict the ranges of SOD values useful in engineering analyses of dissolved oxygen demand relationships for the Upper Illinois Waterway.
I N T R O D U C T I O N
The Illinois Waterway is unique among the water courses within the state of Illinois. It is the state's longest and largest river system, and its headwaters during dry weather flow often consist of treated liquid wastes from approximately 5.5 million people and numerous industries. These wastes at low flows are often mixed or diluted with water diverted from Lake Michigan. The Metropolitan Sanitary District of Greater Chicago, which has an average daily treated sewage discharge of 1380 million gallons near the headwaters, dwarfs all other waste contributions along the 327.2-mile long waterway. During heavy rain storms, tremendous loads of untreated sewage solids and sediments are released into the upper waterway via combined sewer overflows in the Chicago Metropolitan area. These overflows have both a short-term and long-term detrimental effect on the water quality of the waterway.
During July, August, and September, 1971, a study was made of the waste assimilative capacity of the waterway from Chillicothe upstream to Lockport (just below Chicago). A preliminary but detailed analysis and examination of the dissolved oxygen (DO) and biochemical oxygen demand (BOD) data collected indicated that dissolved BOD, either carbonaceous or nitrogenous or a combination of both, was not sufficient to account for the low dissolved oxygen concentra
tion frequently observed. Extensive deposits of bottom sediments trapped in the upper-most pools were suspected of being the prime reason for this discrepancy.
The primary purpose of this study was to determine the degree and extent of the sediment oxygen demand (SOD) in the upper waterway. The general physical characteristics of the sediments were determined, and several of the characteristics that could be easily quantified were correlated to SOD for predictive purposes. The effect of SOD on the DO content of overlying water is related mostly to the composition and areal extent of the sediments and, to lesser degree, the depth of the deposits. Therefore, the areal extent of the deposits was cataloged, not the depths.
Study Area
The Illinois Waterway is a series of eight navigational pools extending 327.2 miles from its confluence with the Mississippi River at Grafton, Illinois, to the Chicago River outlet at Lake Michigan. The lengths of the pools and their inclusive Corps of Engineers milepoint designations are listed in table 1. The actual lengths of the Starved Rock and Brandon Road pools
1

Table 1. Illinois Waterway Navigation Pools
Table 2. Hydraulic Features of the Upper Illinois Waterway Pools
(For 7-day 10-year low flows at flat pool stage)
differ from the inclusive milepoint totals because straightening and realignments of the main channel have shortened distances. For navigational guidance, the Corps has continued to use their original milepoint designations. The Upper Illinois Waterway includes the Brandon Road, Dresden Island, Marseilles, and Starved Rock pools and the upper 52 miles of the Peoria pool. This is a 113-mile reach extending from milepoint 179.0 at Chillicothe to milepoint 292.1 at Lockport, as shown in figure 1.
The basic hydraulic characteristics are quite different for each pool within the study area. As noted in table 1, the pool lengths vary over a wide range. Table 2 lists additional geometric and hydraulic features of each pool within the study area. These data give a good indication as to which pools have the greatest potential for accumulating sediments. For instance, solely from velocity differences the Dresden Island pool has a greater potential for accumulating undesirable benthic material than does the Marseilles pool. Although the Brandon Road pool is narrow, it is very deep and its velocities slow, thereby creating a potential depository for sediments. Its location immediately below Chicago makes this pool particularly vulnerable to excessive benthic accumulations. The Starved Rock pool has both narrow-swift and wide-shallow sections. The area immediately above the dam is very wide and shallow which weighs heavily in making this pool, on the average, the shallowest and slowest of any studied. The upstream end of the upper Peoria pool is relatively narrow and swift, while the
Figure 1. Study area — Upper Illinois Waterway
downstream end contains considerable backwater area ideal for sediment deposition.
Acknowl edgments
This report was prepared under the general supervision of Ralph L. Evans, Head of the Water Quality Section, and Dr. William C. Ackermann, Chief, Illinois State Water Survey. Katherine Shemas typed the original manuscript; Mrs. J. Loreena Ivens edited the final report; and John Brother Jr., Chief Draftsman, prepared the illustrations. Extensive assistance was contributed by several members of the Water Quality Section, notably William T. Sullivan and David L. Hullinger in analyzing samples, Donald H. Schnepper in advising on the design of the SOD sampler and collecting sediment samples, and John Thiel in making SOD runs.
2

S A M P L I N G E Q U I P M E N T A N D P R O C E D U R E S
SOD Bottom Sampler
Only a limited amount of information is available in the literature on determining sediment oxygen demand in the field. Although several laboratory bench studies have been done, laboratory equipment is not suitable nor adaptable for in-situ studies. Therefore, essentially original thought, influenced somewhat by a few reported field studies, went into designing and fabricating an SOD sampler suitable for use on a large river such as the Illinois Waterway. The sampler had to be rugged and heavy to withstand strong currents, yet be manageable. It had to be fabricated with material readily accessible to an ordinary machine shop, and most importantly, it had to be reliable and functional.
A bell-shaped bottom sampler was designed and fabricated according to the specifications depicted in figure 2. The sampler used in this study is shown in figure 3. The basic idea was derived from a plexiglas sampler designed by Lucas and Thomas for use in Lake Erie. The hull of the Water Survey sampler consisted of a half section of a 24-inch long piece of a 14-inch diameter steel pipe having 7/16-inch wall thickness. Semicircular 5/16-inch thick plates were welded to the ends, and 2x2x3/16 angles were welded all around the bottom to act as cutting edges and seating flanges. A split collar that could be tightened by hand was installed to hold the dissolved oxygen-temperature probe. A small notch was cut out of the bottom of the angle on the probe side to let the probe leader pass. This seemingly minor detail was important because the weight of the sampler in conjunction with the
angle edge would be capable of cutting through the insulating material of the probe leader. The sampler had a volume of
Figure 2. Sediment oxygen demand bottom sampler
Figure 3. Discharge SOD sampler showing hose connections at pump (left) and probe installation in sampler (right)
3

30.27 liters and covered a flat bottom area of 0.21676 square meters. The total volume of water contained within the system was 31.11 liters.
SOD Sampler Accessories
Besides the sampler, a small capacity electrically driven pump, a generator, heavy duty 3/4-inch rubber garden hose, and a dissolved oxygen-temperature meter equipped with 50 feet of leader attached to the probe were the essential elements of the overall system. A gasoline driven pump of sufficiently small capacity could possibly be substituted for the generator-pump combination.
The pump was a small portable utility pump having a rated capacity of 39 gallons per minute (gpm) at 10 pounds per square inch (psi) discharge and 5 feet of suction lift, which normally would be required over the side of the boat. An actual test showed that the discharge was only 12.5 gpm (29 percent of rated capacity) with 55 feet of 3/4-inch garden hose attached. This provided a velocity through the sampler of 0.05 feet per second (fps) and a detention time of 38 seconds. The complete recirculation time within the system of sampler, hoses, and pump was 45 seconds. These values appeared to be ideal although the pump did not provide the capacity originally thought necessary. Seldom did the flow have to be throttled down to prevent bottom stirring, yet the pump provided outlet velocities considerably greater than the 1.0 fps required to make the DO probe function correctly. The pump motor was a 1/2 horsepower, 7.8 ampere, 115 volt unit.
The suction inlet to the pump was fitted with necessary
parts to adapt the pipe-threaded pump inlet to a pressure coupling threaded for a 3/4-inch hose. The vertical discharge at the pump was fitted with a short nipple and a tee. A pet-cock was installed in the top of the tee to bleed off air. A gate valve was placed horizontally off the tee for use in controlling the flow rate.
The generator had a capacity of 115 volts, and 15.7 amperes or 1800 watts at 3600 rpm. The unit was driven by a two cycle engine. The use of a generator-pump combination has the advantage of not having to shut down the power source when pumping is not required. The pump motor cord can merely be removed from the generator power outlet.
Good heavy-duty 3/4-inch rubber garden hose was used as recirculating lines. Vinyl hose will not work on the suction end because it collapses. Five feet of clear flexible plastic tubing was used on the discharge end of the gate valve, and a quick-connecting pressure fitting was used to attach it to the rubber hose (see figure 3 left). The clear plastic tubing served as an observation window to control air bleed-off and bottom stirring.
The sampler was lowered or raised by a U. S. Geological Survey bridge winch adapted for use in a boat. The winch is normally used for raising or lowering current meters from bridge gaging stations and therefore is equipped with casters for movement across a bridge. The bottom of the winch was reinforced and fitted with a flanged pipe sleeve. A 3/4-inch piece of marine plywood was laid in the bottom of the boat and fitted with a flanged pipe upon which the winch pivoted through the pipe sleeve and on the casters. The basic features of the sampling system are illustrated in figure 4.
Figure 4. Sediment oxygen demand sampling system
4

SOD Sampler Operations
Specific operating procedures and techniques were developed which produced excellent results with a minimum of operating difficulties. The recommended operating steps are:
1) Anchor the boat fore-and-aft in line with the current. 2) Sample the bottom for sediment composition with
some type of sampling dredge. 3) Calibrate the DO probe by the Winkler method on a
water sample collected from near the bottom. 4) Insert DO probe into the split collar within the
sampler and hand tighten screw bolts. 5) Attach discharge hose to sampler and tape the probe
leader to the hose at approximately 6-inch intervals up to 3 feet above top of sampler.
6) Attach sampler to winch cable and lower sampler over the side of the boat until the top is just submerged. Air will be trapped in the sampler.
7) Remove as much entrapped air as possible by rocking sampler back and forth keeping the top completely submerged. The air escapes from the suction hose nipple on the sampler.
8) When air is removed, connect suction line to nipple and lower to mid-depth.
9) Submerge suction hose until it is full of water. This procedure further reduces trapped air and minimizes air bleeding time.
10) Attach suction hose to pump after replacing fitting gasket. The gasket should be replaced after each run. (Worn gaskets were found to be the biggest cause of air entrapment in the system.)
11) Start generator, prime pump, and connect motor to power outlet.
12) Let pump discharge into open river until all or most all of air is eliminated from the system, then connect clear plastic tubing to garden hose under water. This procedure eliminated trapping air in the line.
13) Bleed air which has accumulated in the high point of the system by opening the petcock atop the tee.
14) Lower sampler gently to bottom. 15) Immediately turn on DO meter and record time, DO
values, and temperature. Continue reading time and DO values for approximately 2 hours or until the DO usage curve is clearly defined. An occasional temperature check is desirable.
The original sampler design was found suitable for use on all forms of bottom sediments except the high velocity sandy channels and rocky or shelly areas. The 2-inch flanges were sufficient to prevent excessive submergences even in very mucky bottoms. Large wooden auxiliary flanges had been made to bolt to the steel angles but were never needed. In areas having excessive detritus on the bottom, hose strainers in the suction line were used to prevent large particles from clogging the pump. In sandy, high velocity areas undermining occurred very abruptly and was quite noticeable from a sharp increase in DO readings and slight temperature changes.
Sampling Procedures
Before an SOD run was made, an exploratory sample of the bottom was taken with a 6-inch Eckman dredge. At 13 of the 22 SOD sampling stations, the Eckman samples were washed through a 30-mesh sieve for benthic organism identification. Sediment samples for laboratory analysis of liquid and volatile content were collected with a 9-inch ponar dredge at three locations within a cross section, i.e., in the centerline of the main channel (C) and at points right (R) and left (L) of the channel, looking upstream. The upstream point of reference, rather than the conventional downstream reference, was used because during sampling the orientation of the boat was in an upstream direction.
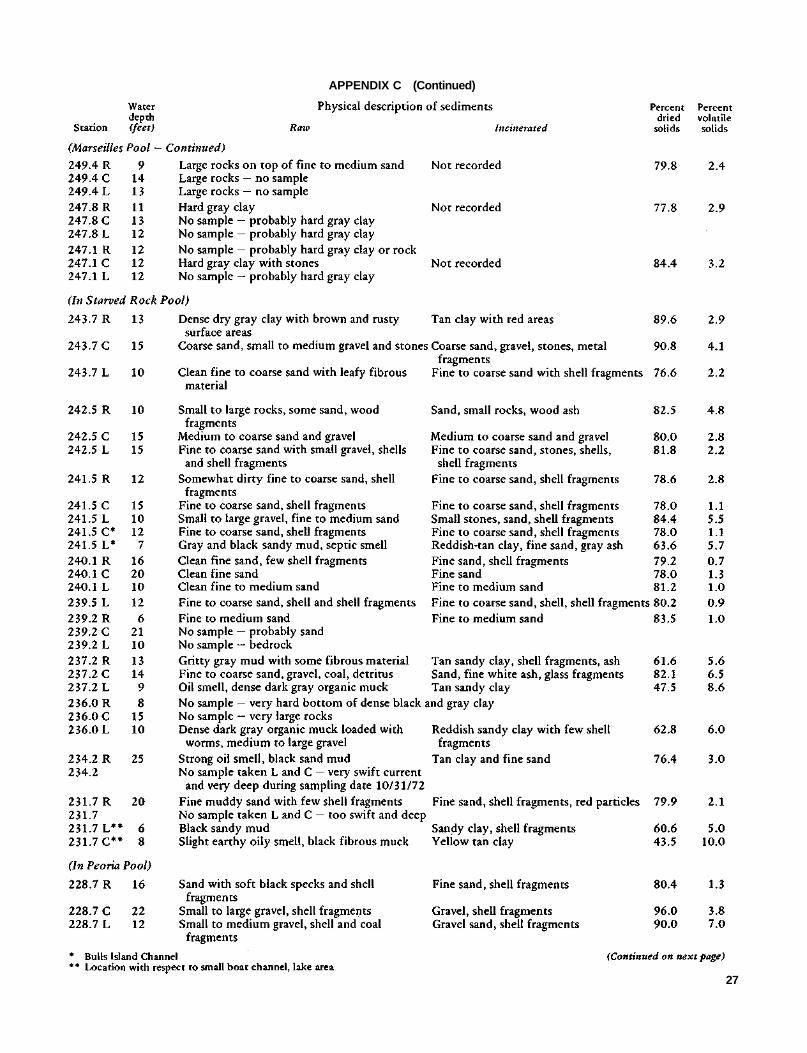
Approximately 65 to 75 grams of sediment was retained and stored in wide-mouth 125-milliliter (ml) plastic bottles. The bottles were stored over-night in a refrigerator for analysis the next day. About 25 to 30 grams of the sample was used for determining the percent volatile and dried solids. The percent dried solids parameter is a somewhat general indicator of constituency, i.e., the degree of solidity or liquidity of the sediment material. This parameter was determined by decanting the supernatant from the top of the refrigerated samples. The residue was then thoroughly mixed, and a portion was oven dried at 103C. The weight of the oven dried residue divided by the weight of the decanted wet residue times 100 was defined as the percent dried solids for use in this report. The percent volatile solids was determined according to Standard Methods for Examination of Water and Wastewater, 13th Edition, and physical descriptions of the raw and incinerated samples were recorded. These descriptions are included with this report as appendix C.
S E D I M E N T O X Y G E N D E M A N D
Twenty-two SOD sampling runs were made — at 8 stations in the Peoria pool, at 2 in the Starved Rock pool, and at 12 in the Dresden Island pool. None was attempted in the Marseilles or Brandon Road pools principally because the Marseilles pool is sandy and the Brandon Road pool is short and very congested
with barge traffic. Benthic organism samples were taken at 14 stations. Only four were taken in the Dresden Island pool, and sampling was discontinued there because the tremendous number of worms encountered made field identification of organisms impractical.
5

SOD Measurements
The unreduced (raw) SOD field observations are tabulated in appendix A. Plots of the reduced data are shown in figures 5 and 6, and the plotting points are tabulated in appendix B. The shapes of the elapsed time vs DO usage curves resemble first-order carbonaceous BOD curves to a great degree; however, first-order kinetics are not applicable to determining SOD rates. The steep slopes at the beginning of most of the curves are attributable principally to 1) initial bottom disturbances by the sampler placement, and 2) mixing of lower DO concentrations in the interface water with higher DO water trapped in the system on the way down. Generally, about 3 to 5 minutes of rapid DO usage occurs before a stabilized linear relationship develops. The rate is determined from this linear portion of the curve. The dashed lines in the tabulated values in appendix B mark the somewhat arbitrary beginning of the linear portion of the data. The slopes were determined by standard regression analysis.
The DO usage rates in this report are expressed in terms of grams per square meter per day (g/m2/day). Mathematically, a bottom sampler SOD rate can be formulated as:
where
The specific formula for the Water Survey sampler is:
On the basis of the success of the Water Survey sampler, a constant in the order of 200 appears to be desirable in the equation. Values much greater than 200 will have too large a volume-to-area ratio; such samplers will require much longer runs to adequately define DO usage curves. Values much less than 200 will exhibit a small volume-to-area ratio, and operational problems, such as excessive bottom disturbances, will probably occur. If SOD experiments are needed in highly compacted bottoms having relatively low oxygen demand rates, it may be desirable to design a sampler having a constant somewhat below 200.
The plots shown in figures 5 and 6 and the data in appendix B clearly demonstrate that the time required to complete a run varied considerably from one area to another. Several factors account for this. The principal one is the sediment composition; mucky bottoms require longer runs than do more compact or sandy bottoms to clearly define the linear segment of the DO usage curve. The degree of initial bottom disturbance is often a big factor. Mucky bottoms are easily disturbed by a sudden drop of the sampler. Inadvertently, excessive disturbances do occur and a longer time is required for the sediments to settle out.
Sampling may be cut short by undermining of the sampler, which often governs the length of run in sandy areas or areas having a thin layer of soft material on top of compacted sediments. The curve at station 208.2 L (see figure 5) is an example of a run cut short by undermining of the sampler in a sandy bottom. A steep rise occurs during the first 3 minutes of the curve caused by an intentional hard drop of the sampler to achieve penetration for sealing in the sand. Because of the heavy nature of the sand, the sediment quietly settled, and the curve flattened considerably until undermining occurred in 23 minutes. The point at which undermining occurs is generally quite noticeable; an instantaneous increase in DO occurs, often accompanied by a small decrease in temperature. A similar undermining occurred at station 198.8 L (see figure 5). Here the bottom consisted of silt balls on top of the hard pan clay. Subsidence of the initial disturbance took 8 minutes, much longer than the 3 minutes required in the sand at station 208.2 L. However, undermining occurred at about the same time interval (22 minutes).
The principal factor that limited the length of runs was barge traffic. At stations near the main channel, barges caused problems and under certain circumstances created such violent undertow and wave action that the sampler was literally ripped from the bottom. The run at station 283.6 R (figure 6) was scheduled to go for 2 hours, but the passage of a barge aborted it after 1 hour. The effect of the barge was so violent that, besides ripping the sampler from the bottom, both anchors were pulled free and cables, anchor lines, and hoses were entangled.
This experience dramatized the direct effect barges have on resuspending bottom sediments in the Upper Illinois Waterway. Although the flat linear portions of the DO usage curves represent the normal undisturbed SOD, the initial sharp rises in the curves can logically be equated to the effects of disturbances created by barges. The resuspension of sediments by barge traffic may increase short-term localized oxygen demand loads by seven or eight fold. Additional discussion of resuspended sediments will be presented later. Although generally an SOD curve can be adequately defined in 60 to 90 minutes, runs of approximately 2 hours were made when possible. One 3-hour run was made, but this was found to be unnecessary.
The SOD values for 22 sampling stations listed in table 3 range from 0.56 to 8.08 g/m2/day. The two highest values, 6.45 to 8.08 g/m2/day, resulted when disturbance of sediments occurred throughout the run. In both cases, regulation of the flow by the gate valve on the pump was not successful in clearing the flow, as observed through the clear plastic tubing. These two values were excluded from statistical analyses performed on the total data.
The SOD values were grouped into silt-clay and sand-gravel classifications, and the means were compared statistically by thet-test. The mean of 3.02 g/m2/day for 12 silt-clay bottoms was found to be significantly different from the mean of 1.39 g/m2/day for 8 sand-gravel bottoms at the 1 percent level of significance. On the basis of this finding, additional analyses were made for these two general groupings.
6
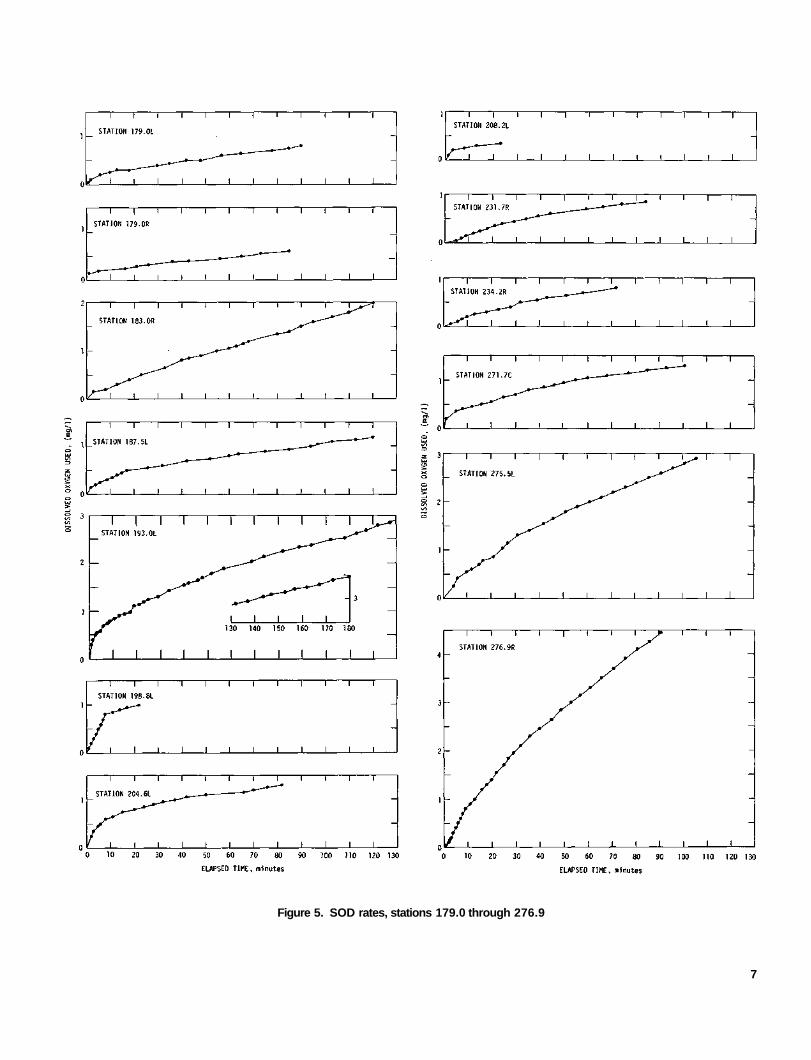
Figure 5. SOD rates, stations 179.0 through 276.9
7

Figure 6. SOD rates, stations 277.4 through 283.6
8

Temperature Influences
The water temperatures recorded at the time SOD measurements were taken are listed in table 3. These are average values observed between the beginning and ending of a run. Depending upon the length of sampling time, the temperature in the SOD sampling system generally rose from 1 to 2C (see appendix A).
Some limited experimental laboratory work has been done to develop a temperature correction factor for benthic oxygen demand. Baity2 showed that the temperature correction for the BOD rate coefficient (K), in the form of the modified Arrhenius equation, is applicable for oxygen demand rates of fresh sewage sludge. The form of the equation he used is:
where
Fair et al.3 suggested using the basic form of the Arrhenius equation to equate river mud oxygen demand rates with temperature changes. Fair's results, presented in the form of the
modified Arrhenius equation, gives a constant of 1.067 compared with 1.047 shown applicable by Baity. Recently McDonnell and Hall4 have derived a constant, which when converted to the form used in equation 3, equals 1.069, a value very close to Fair's. Hanes and Irvine5 indicate that significant changes in SOD rates occur with changes in temperature.
McDonnell and Hall4 state that benthal biological processes appear to follow the general principle of twofold increases in activity for each 10C rise in temperature. This observation was made for a controlled laboratory experiment. They conclude that their temperature studies define only qualitatively seasonal variations in a stream. In effect, this can be interpreted to mean that winter and summer rates are discernible but those for small degree changes within a season are not.
The data collected on the Upper Illinois Waterway appear to support this contention. The average water temperature for sampling days of this study was 25C, the low being 19.6C and the high 28C. All data were corrected to 25C with the use of equation 3. The multiple correlation coefficient between SOD and percent solids and volatile solids for silt-clay observations at 25C was found to be 0.65 compared with 0.66 for data not
Table 3. Summary of Sediment and SOD Characteristics
9

corrected for temperature. Evidently small changes in temperature have a minimal effect on SOD rates under the conditions of this study. Other factors appear to be more important.
DO-lnvertebrate Influences
Another factor considered important by several investigators is initial dissolved oxygen concentration. Baity2 concluded that no correlation existed between SOD and DO concentrations so long as a DO residual exists in the water. However, later works4 '6 '7 indicate that when macroinvertebrates are present in the sediments in large numbers, the SOD rate is dependent upon the dissolved oxygen concentration. Baity's samples were devoid of macroinvertebrates. Edwards and Rolley6 found that very high rates of SOD always occur in sediments having invertebrate populations of up to 140,000 Cbironomus larvae per square meter. According to McDonnell and Hall,4 maximum SOD rates appeared to occur at DO concentrations of approximately 8 mg/1; for an invertebrate laden sediment 25 centimeters (cm) deep, the SOD was approximately 6.0 g/m2/day at 8.0 mg/1 DO compared with 4.8 g/m2/day at 3.0 mg/1 DO.
Initial DO concentrations for all of the 22 SOD stations sampled and invertebrate numbers for 13 stations are given in table 4. The SOD rates in the Starved Rock and Peoria pools would appear to be relatively independent of the DO concentration because of the small number of invertebrates present in the bottom sediments. However, the SOD rates in most areas of the Dresden Island and Brandon Road pools would probably be dependent upon the DO. The maximum number of invertebrates counted in the Dresden Island pool was approximately 30,000/m2 . However, many samples that were collected in this pool for sediment analysis contained estimated invertebrate numbers of 100,000/m2 or greater. Some samples, as noted in appendix C contained solid mats of worms.
The dissolved oxygen concentrations at most of the stations were above 4.0 mg/1 and many were in the 5.5 to 6.5 mg/1 range as the result of abnormally high flows during the time of sampling. On several occasions the flow was at or above flood stage. Normally, low summer flow DO concentrations fall between 2.0 and 3.0 mg/1 in the Dresden Island and Peoria pools and below 1.0 mg/1 in the Brandon Road pool. Since waste assimilative characteristics of a stream are normally evaluated during low summer flows, the measured DO rates in the Dresden Island and Brandon Road pools should be corrected for the low DO values expected during this period.
An SOD-DO correction formula has been developed from the data given by McDonnell and Hall4 for 25-cm deep sludge. The formula is:
where
This formula can be used to estimate SOD rates at various DO concentrations in areas having very high benthic invertebrate populations.
McDonnell and Hall used the basic work of previous researchers to develop a method for estimating the percentages of SOD due to microbial and macroinvertebrate populations. The rate caused by microbial activity has been found to be constant at DO values of 0.5 mg/1 or greater, whereas the rate resulting from invertebrate activity decreases logarithmically with decreasing DO concentrations. A graphical procedure presented by McDonnell and Hall can be used to isolate the constant microbial rate from the variable invertebrate one. In the sediments used in their work, microbial respiration accounted for 45 to 48 percent of the SOD while invertebrate respiration accounted for 52 to 55 percent of the SOD, depending on sediment depth. Edwards and Rolley6 found that around 40 percent of the SOD was caused by invertebrate respiration. These findings would indicate that the SOD values for the Brandon Road and Dresden Island pools are probably influenced to a large degree by the large invertebrate populations in the sediments of these two pools.
Table 4. DO and Invertebrate Concentrations at SOD Sampling Stations
10

Rate of Deposition Influence
The rate of enriched sediment deposition embodies two inseparable but distinguishable occurrences. These are sediment depth and sediment accumulation. Their respective effects upon sediment oxygen demand have been investigated by several researchers.
From field observations Velz8 concluded that enriched sediments will deposit and accumulate at stream velocities of 0.6 fps or less, and resuspension and scouring will occur at velocities of 1.0 to 1.5 fps. As was shown in table 2, the velocities likely to occur at 7-day 10-year low flow in all pools except Marseilles are below 0.6 fps. Thick deposits of sediment would be expected to occur in these pools and indeed do. For example, in the Brandon Road pool in the vicinity of the dam, Corps of Engineers soundings in 1939 showed water depths of 15 to 23 feet. During this investigation only a foot of overlying water was observed except in the narrow channel maintained by barge traffic. This suggests sludge deposits in excess of 20 feet thick.
There are differing views among researchers regarding the effect sediment depth has on SOD rates. Velz8 considered the rate of accumulation, not depth, the governing factor, and he suggested that SOD rates proceed in accordance with first-order kinetics to the point where equilibrium is reached. In this case equilibrium exists when the daily rate of accumulation equals the daily rate of reduction caused by microbial activity. The maximum SOD rate occurs at equilibrium conditions, and equilibrium conditions are achieved in 40 to 50 days if stream velocities of 0.6 fps or less persist during that length of time.
In contrast to the mechanism of sediment accumulation — biological stabilization advocated by Velz,8 laboratory studies have generally been based on the concept that sediment deposition occurs in periodic slugs. It is probable that both processes are at work in the Upper Illinois Waterway. However, because most of the flow in that reach of the waterway originates from the steady flow of waste streams from activated sludge plants, it is likely that the 'slug concept' does not govern and that the SOD rates developed during this study are maxima occurring at equilibrium conditions.
This conclusion is supported in part by the findings of Rolley and Owens.7 They found an average SOD of 2.4 g/m2/day at 15C in bottom sediments below 5 activated sludge plants. Above 12 plants, SOD values were about one half as much. Their SOD value of 2.4 g/m2/day corrected for the temperature of 25C, the average observed during this study, amounts to 3.8 g/m2/day. This closely agrees with the average SOD of 3.2 g/m2/day found for the Dresden Island pool.
Studies on the effects of slug-type depositions on the DO resources of streams are summarized by the investigations of Baity,2 Fair et al.,3,12 McDonnell and Hall,4 Oldacker et al.,9
and Hanes and White.10 In their work SOD rates were developed for slugs of sediment placed in reactors and observed under varying conditions, e.g., sediment depth, temperature, DO concentrations, salinity, and sludge age. The studies have
been especially beneficial in defining the kinetics of SOD. However, the relationships between undisturbed in-situ SOD rates and those developed in the laboratory for the same sediments have not been defined. Therefore the translation of laboratory results to field conditions is questionable.
The ranges of SOD rates observed by a number of investigators, including those of this study, are presented in table 5. Most of the laboratory investigations were performed on sewage sludges up to 25 cm deep; the two in-situ studies were made on the bottom of Lake Erie.
Table 5. Comparative SOD Values Reported by Various Researchers
Resuspension Influences
At times, resuspension of bottom sediments in the Upper Illinois Waterway appears to have intermittent but significant effects on water quality. While DO usage from the resuspension of deposited benthic material cannot be strictly designated as SOD, an implicit relationship exists between the two phenomena. As previously noted from the SOD curves of figures 5 and 6, a bottom disturbance can create a very sharp initial drop in DO in the sampler for short periods of time. The initial DO usage portions of these curves are probably representative of what happens to dissolved oxygen concentrations locally when barge tows churn up the bottom sediments. Wind action, observed during sampling at some stations, is responsible for longer periods of resuspensions of benthic material. The wind effect is most pronounced in shallow wide areas, such as station 277.4 L (figure 6).
Experimental laboratory work done by Baumgartner and Palotas13 demonstrated very explicitly the effect of suspended bottom sediments on dissolved oxygen concentrations. The
11

resuspended sediments were found to exert an immediate oxygen demand, and the magnitude of the demand was found to be governed by temperature and degree of agitation. Resus-pension was found to increase the maximum oxygen uptake rate 10-fold over that for quiescent conditions. It was concluded that a continuous disturbance of polluted bottom sediments, such as would occur during a dredging operation, could significantly lower the ambient dissolved oxygen concentration.
This phenomenon is well demonstrated in figure 5 at station 198.8 L. Two distinct curves exist — one during the initial disturbance phase and another after resettlement of the disturbed material. Because of the nature of the disturbable material (small cohesive clay balls), a relatively high initial SOD
rate of 20.7 g/m2/day occurred compared with 2.8 g/m2/day for quiescent conditions.
Another interesting example is for station 208.2 L (figure 5), a sandy bottom location. The initial rate was only 15.9 g/m2/day and persisted for only 2 minutes compared with a 7-minute initial reaction time for the clay ball bottom at station 198.8 L. The quiescent SOD rate for the sand was 1.05 g/m /day. One of the highest initial reaction rates observed was 47.5 g/m2/day at station 282.8 R (figure 6), and it persisted for about 5 minutes before it gradually tapered down to a quiescent rate of 4.58 g/m2/day. These examples demonstrate the oxygen consuming potential of disturbed Upper Illinois Waterway bottom material.
S E D I M E N T I D E N T I F I C A T I O N A N D A N A L Y S I S
The descriptions and analyses of sediment samples collected at 172 locations within the study area are tabulated in appendix C. Physical descriptions of the benthic samples before drying and after incineration are given, along with the percent dried solids and percent volatile solids. Also included is the depth of water at each sampling site during the time of sampling. Although no attempt has been made to correct the depths to a common elevation, the values are generally indicative of shallow or backwater areas and deeper channels.
Physical Characteristics
The general description of the bottom material contained in wide areas of the Brandon Road and Dresden Island pools would fit that of a thick black fibrous muck (figure 7) having
either an oily or musty smell. The fibrous material, when examined closely, was often found to be massive populations of sludge worms. For the most part, the bottom sediments in these two pools can be categorized simply as highly infested with pollution-tolerant organisms. Heavy oils or petroleum products are widely distributed throughout most of the sediments in these two pools. Often gritty-sandy samples smelled of oil and frequently produced a rainbow effect in water. Many of the samples burst into flame in the kiln when exposed to a blast of air as shown in figure 8. It is believed that both the petroleum and detritus content of the samples contributed to this. The drying and dewatering characteristics of the sediments appear to be similar to that of primary sewage sludge. A large sample was air dried in the laboratory for six weeks. At
Figure 7. Semisolid oily sediment typical of Dresden Island or Brandon Road pools Figure 8. Sample burning in kiln
12

the end of this time, the sediment was well dried and cracked, had a light black or gray appearance, and was easily crumbled into a humus-like mass. These characteristics can be noted in figure 9 for samples that have been incinerated.
Figure 9. Incinerated samples
Throughout most of the Marseilles pool and the upper reaches of the Starved Rock pool, the sediments consisted principally of gravel, sand, and shells. Some detritus and organic matter were present, but most of the undesirable material presumably is trapped in the Dresden Island and Brandon Road pools. Throughout most of the Marseilles pool the flow is constricted to a relatively narrow channel, the only significant widening occurring immediately above the Marseilles lock and dam. In this area, the bottom consists of hard, compacted gray clay interspersed with small stones.
Some interesting sediments were found in localized areas of the Starved Rock pool, although for the most part the narrow channels above the lake formed by the Starved Rock lock and dam contained relatively clean sand and gravel. In the channel around Bulls Island above Ottawa (station 241.5, see appendix C), a thick septic sandy muck was observed. Unexpectedly at station 237.2, in swift deep water, the bottom was found to consist of dense, dark gray, oily smelling organic muck. Farther downstream in a constricted channel (station 236.0) dense dark-gray organic muck loaded with sludge worms was found. The lake bottom above the dam consisted mainly of very dirty or muddy sand in the shallows and relatively clean sand and gravel in the main navigation channel. However, a pocket of oily black fibrous muck was found at station 231.7.
The upper reaches of the upper Peoria pool consist princi
pally of muddy sand bottoms. Localized areas of thick oily
muck exist such as in the vicinity of stations 225.8 and 222.0.
At station 217.1 L, a 1-inch layer of oily fibrous detritus was
found on top of dirty sand. The middle reaches contained
many small coal and shell fragments. In the lower reaches
below Lacon, thick oily muck became predominant. The sedi
ments between Lacon and Chillicothe, on the whole, were
found to be enriched, although not to the degree of those in
the Dresden Island and Brandon Road pools. In certain loca
tions, gaseous releases were observed during the passing of
barges.
Relationship of Sediment Characteristics and SOD
A requirement in this study was to develop relationships between specific physical or chemical properties of sediments and SOD rates. Such relationships were needed for estimating SOD rates for sediments throughout the study area. Edwards and Rolley6 and Rolley and Owens7 made extensive examinations of the relationship between the sediment oxygen consumption and various chemical parameters such as organic carbon, Kjeldahl nitrogen, carbon-nitrogen ratio, permanganate value, humic acid, and the physical property of percent volatile solids (loss on ignition). They found no correlation between the SOD and any of the individual parameters or between the SOD and any combination of the parameters.
In this study, two parameters, percent dried solids and percent volatile solids, were chosen for examination. They are easily measured, and from a sanitary engineering point of view, they should at least show a casual relationship to SOD.
A statistically significant difference, as indicated earlier, was found to exist between the SOD rates for sand-gravel sediments and the more mucky ones consisting predominantly of silt-clay particles. Predictive relationships were therefore developed on the basis of these two categories as well as a third one for large gravel and rock bottoms.
Silt-Clay Category
Twelve SOD rates, having a mean value of 3.02 g/m2/day, were included in this category and are identified in table 3. Station 276.9 was not included because, as previously noted, the sediment remained stirred to some degree throughout this test run. Figures 10 and 11 show logarithmic relationship between SOD and percent solids and between SOD and percent volatile solids, respectively. Figure 12 shows the relationship between percent dried solids and percent volatile solids for 78 samples classified as silt-clay. The 12 samples for which SOD rates are available (solid circles) are well distributed through the range of observed values.
The correlation coefficient between the logarithms of the percent dried solids and SOD was -0.58 and that for percent volatile solids and SOD was 0.62. These values are not high but they do indicate that a significant portion of the variation in SOD can be explained by these two parameters. The nega-
13

tive correlation shown in figure 10 indicates that the sample becomes less liquid or more solidly compacted as the oxygen demand rate becomes less. The volatile solid-SOD relationship shown in figure 11 would be expected since the SOD tends to increase with increases in volatile material. The relationship between the percent dried solids and percent volatile solids appears to be logarithmic (figure 12), and as expected, the volatile solids tend to decrease with decreasing liquidity. The multiple correlation coefficient relating the logarithms of the SOD rates to the logarithms of the percentage dried solids and
volatile solids is 0.65, a small but statistically significant increase over that when relating only volatile solids to the SOD rates. The resultant prediction equation is:
where
Figure 10. Relationship of percent dried solids and SOD, silt-clay
Figure 11. Relationship of percent volatile solids and SOD, silt-clay
Figure 12. Relationship of percent solids and volatile solids, silt-clay
14

The predictive capability of the equation is not as good as was originally desired. The standard error of estimate is approximately 1.0 g/m2/day which, for the general nature of this work, is acceptable.
Sand-Gravel Category
Eight SOD rates, having a mean value of 1.39 g/m2/day, were included in this category, as identified in table 3. Station 277.4 L was not included because, as previously noted, the sediment remained stirred to some degree throughout this test run. Figures 13 and 14 show the relationship between SOD and percent dried solids and between SOD and percent volatile solids, respectively. Figure 15 shows the relationship between percent solids and percent volatile solids for the sand-gravel samples; the solid circles are for the eight samples for which SOD rates were determined.
The SOD relationships are even poorer than those for the silt-clay classification. The correlation between SOD and percent dried solids was 0.58, and that for SOD and percent volatile solids was -0.42. Not only are the correlations low,
the signs are the opposite of those expected. This ambiguity may be caused by several factors. One is that the sample of eight is quite small. Second, the ranges of the dependent variable (SOD) and the independent variables (percent dried solids and percent volatile solids) are quite small. The SOD values range (at 25C) from 0.49 to 2.08 g/m2/day, and the volatile solids range from only 2.5 to 9.4 percent compared with a 3.3 to 25.7 percent range for the silt-clay samples. As a result, no meaningful predictive relationships could be developed. Consequently, the SOD rates for sand-gravel locations were assigned values based on the condition of the sand. For a relatively clean sand, an SOD value of less than 1.0 g/m2/day was assigned, and for a dirty sand, a value of 1.0 to 2.0 g/m2/day was assigned.
The relationship between the percent dried solids and percent volatile solids (figure 15) shows an interesting trend. As the percent dried solids increases from 55 to approximately 82 percent, the organic or volatile matter decreases. However, a reverse trend appears to occur at around 82 percent. At this point, the volatile solids increase with increasing dried solid
Figure 13. Relationship of percent dried solids and SOD, Figure 14. Relationship of percent volatile solids and SOD, sand-gravel sand-gravel
Figure 15. Relationship of percent solids and volatile solids, sand-gravel
15

content. This is probably caused by the fact that the size of the sediment particles increases with increasing values of percent dried solids. Below 78 percent dried solids, in the sand-gravel classification, the sediments consist principally of sand. At around 78 to 82 percent dried solids, pebbles, stones, and small rocks are encountered. Above 82 percent dried solids, medium to large sized rocks predominate. As the rock sizes increase, the surfaces become more nearly ideal for biological growth such as occurs on trickling filter media. The nutrient-rich, BOD-laden Waters in the waterway do support organic growths on these rock surfaces. These growths are characterized by a viscous jelly-like mass typical of zoogleal films. Such biological activity could account for the shape of the curve depicted by figure 15. In essence, two conditions can reflect comparable volatile solids content. In one case the volatile matter, consisting or organic debris of small particle size, increases with decreasing dried solids content; in the other case, an increase in volatile matter is sustained by increasing dried solids producing a habitat for microbial growth.
The points having related SOD values, represented by the solid circles in figure 15, extend only to about 77 percent dried solids. The larger pebbles and stones encountered above this value prevented proper seating and sealing of the sampler, so that no direct measured SOD values are available in the higher solids range. Consequently, an indirect computational procedure was needed for estimating SOD rates in rocky areas.
Gravel-Rock Category
Because no direct method could be used for the gravel-rock type of bottom, an indirect computational procedure was developed whereby reasonable SOD values can be estimated. The principal input data required are observed dissolved oxygen concentrations between two points of interest and the ultimate dissolved BOD and its associated BOD usage rate K . Flow and time-of-travel between points of interest are also needed. Techniques developed and outlined by Butts et al.14 were used to compute the total ultimate BOD and K from observed DO concentrations in conjunction with river flows and time-of-travel between stations. This computed BOD includes both the dissolved and the benthic BOD fractions. From the summer 1971 water quality phase of this study, dissolved BOD data for seven days were available. For each date the dissolved fraction was subtracted from the total, and the remaining was assumed to be benthic oxygen demand. A summary of the average computed oxygen demand rates for various reaches is given in table 6.
The rocky bottoms are all immediately below the navigation dams. A decrease in benthic oxygen demand in the downstream direction is quite evident. The term benthic oxygen demand is probably more meaningim as applied here than SOD because the oxygen demand is probably due principally to biological extraction and accumulation from attached microbial growths and not from sediment deposits.
The benthic demands in the Brandon Road pool below the
Table 6. Computed Oxygen Demand Rates for Gravel-Rock Bottoms
Lockport dam are very high, in the range of five to six times higher than any observed SOD value listed in table 3. Such high values probably account for the sharp drop in DO levels often observed downstream of a dam after reaeration has occurred at the dam. The benthic demand below the Starved Rock dam is low probably because of the physical makeup of the area and the nature of the river waste load as it enters this reach.
Extrapolated SOD Rates
Sediment oxygen demand rates were computed or assigned to the 172 sampling stations listed in appendix C. For most clay-silt stations, equation 5 was used for estimating purposes. For the reasons cited previously, sand-gravel locations were assigned values either less than 1.0 g/m2/day or 1.0 to 2.0 g/m2 /day depending upon the condition of the bottom. Gravel-rock bottom rates were those listed in table 6.
In certain instances, special situations or anomalies arose with the bottom composition. Some samples contained apparent volatile solids or other materials (wood and coal fragments) which do not reflect or represent potential or immediate oxygen consumption. As an example, in the station 280.3 L sample (see appendix C), approximately 31 percent of the dried solids was volatile material from wood fragments. The Starved Rock and Peoria pools had an area extensively laden with coal fragments. At station 228.7 L the sample was 90 percent dried solids, and the relatively high 7 percent volatile solids content was attributed to coal fragments. Also, high populations of worms can distort the relationship of percent dried solids and percent volatile solids. At station 289.0 L, only 37.4 percent of the decanted sample was solid material, but over 25 percent of this was volatile because of the extremely high sludge worm population. When these anomalies occurred, the bottoms were assigned SOD rates in line with those computed for the nearest location having reliable data.
The computed and assigned SOD rates were then plotted
16

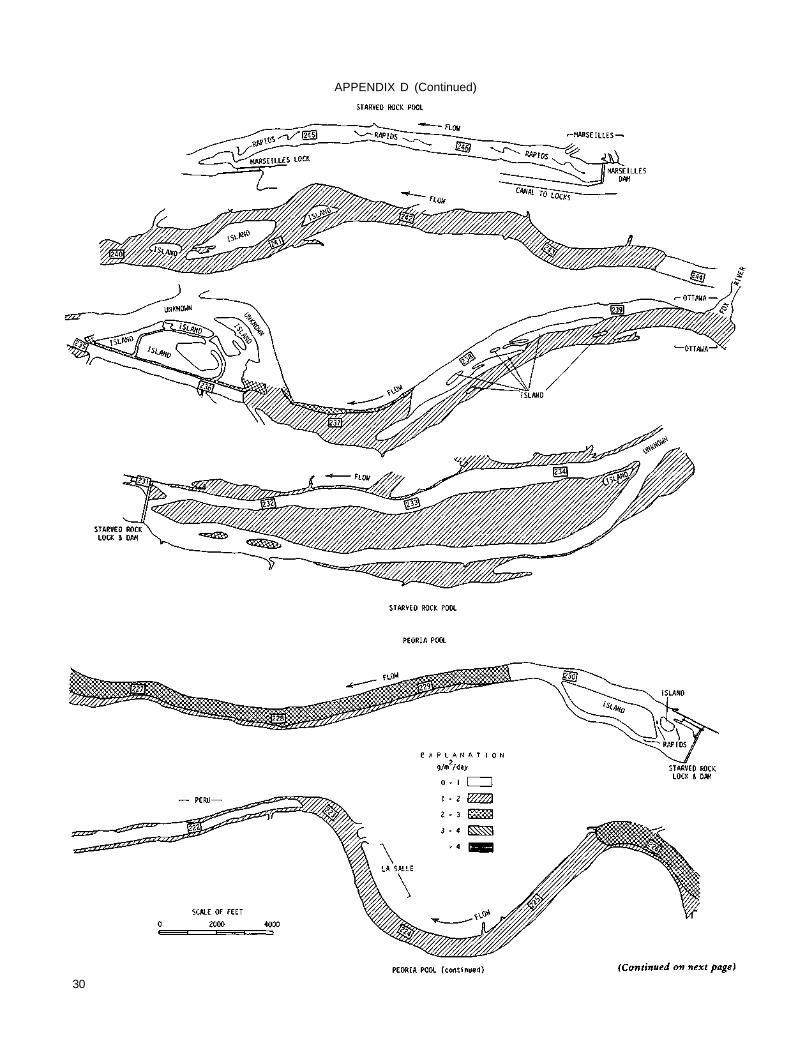
on Corps of Engineers navigation charts. Contours of like values were drawn, and maps were prepared giving the general SOD rates for specific areas of the waterway. Appendix D contains maps showing the areal distribution of SOD rates for the Brandon Road, Dresden Island, Starved Rock, and Peoria
pools. The Marseilles pool is not shown in detail because the bottom sediments are basically clean sand having SOD values less than 1.0 g/m2/day. These maps can greatly aid in making engineering analyses of the waste assimilative sparity of the Upper Illinois Waterway.
SUMMARY AND ASSESSMENT
After the examination and analysis of water quality data obtained during a study of the waste assimilative capacity of the Upper Illinois Waterway, the need to quantify the oxygen demand characteristics of bottom sediments for a 113-mile reach between Chillicothe and Lockport became evident. The object of this study was to determine, by in-situ measurements, the degree and extent of the sediment oxygen demand (SOD) in order to ascertain the relationship between SOD rates and DO content of the overlying waters. The areal distribution of the bottom deposits was cataloged, but sediment depths were not. Since few in-situ SOD studies have been made and none under the conditions that exist in the Upper Illinois Waterway, special equipment and operating procedures had to be developed.
A bottom sampler was designed to entrap and seal a quantity of overlying water at the river bottom. The changes in dissolved oxygen (DO) concentration within the entrapped water were recorded by a dissolved oxygen probe affixed within the sampler. An electric pump powered by a gasoline motor driven generator housed in a boat was used to maintain water velocities in the sampler to properly actuate the DO probe.
SOD data at 22 locations within the study area were obtained. Twenty of the runs were for undisturbed bottom conditions and two were for disturbed conditions. SOD values for the undisturbed locations ranged from 0.56 to 5.00 g/m2/day. At the two disturbed bottom locations the SOD values were 6.45 and 8.08 g/m2/day. Bottoms composed principally of sand and small gravel had an average SOD value of 1.39 g/m2 /day and those composed principally of silt and clay had an average SOD value of 3.02 g/m2/day. The highest rates generally occurred in the upper 19 miles of the reach studied.
The oxygen demands of the sediments in many areas of the Upper Illinois Waterway appeared sufficiently high to impose a significant demand upon the dissolved oxygen content of the overlying waters. For example, during 7-day 10-year low flow periods, an estimated 1.7 mg/1 of DO will be used within the 15-mile long Dresden Island pool as a result of the oxygen demand characteristics of the bottom sediments. The disturbed bottom rates can be equated to conditions that exist during the riling of sediments by the passage of barge tows, by dredging operations, and by violent wind activity.
In addition to making SOD measurements, 172 bottom sediment samples were collected with a ponar dredge. These samples were analyzed to determine the percent organic con
tent and percent dried solids. Also, a detailed physical description of each sample was logged. Relationships between the percentages of organics and dried solids and the SOD rates were developed for silt-clay and sand-gravel sediment classifications. The mathematical expressions developed were used to estimate the probable SODs at the various sediment sampling sites.
Charts of the river bed within the study area were prepared showing the ranges of SOD values. These charts provide a pictorial review of the SOD characteristics that can be of aid in making detailed engineering analyses of the dissolved oxygen demand relationships within the Upper Illinois Waterway.
Definition of the SOD rates makes possible an assessment of the relationship between the SOD rates and the DO content of the overlying water. Table 7 gives the total DO depletion through the various pools due to the sediment oxygen demand rates depicted in appendix D, for three different flow conditions. During extremely low summer flows, the depletion of DO due to benthic or sediment oxygen demand appears to be significant for a pool as a unit.
Table 7. Computed DO Depletions in Pools Due to Sediment Oxygen Demand
Table 8 lists the unit DO depletions in terms of milligrams per liter per mile for the various pools. This table clearly differentiates the SOD effects by pools. The benthic oxygen demand in the Brandon Road pool definitely has more effect on the DO resources here than do the respective SODs in any
17

of the other pools. During intermediate flows, such as observed on August 25, 1971, the benthic demand has minimal influence on the DO concentrations except possibly in the Brandon Road pool.
Because of the areal extent and depths of bottom sediments, particularly in the Brandon Road and Dresden Island pools, coupled with the periodic resuspension of the sediments by barge tows, it is doubtful that the aquatic ecology of the waterway can be measurably enhanced solely by achieving current water quality standards. A program for the removal of undesirable sediments in critical zones probably will have to be devised and implemented. However, any such program should be preceded by a study designed to predict the impact of resus-pended sediments on downstream DO resources that would
result from sediment removal operations. In this regard, stream-flow and water temperature conditions would be pertinent.
Table 8. Computed Unit DO Depletions by Pools Due to Sediment Oxygen Demand
REFERENCES
1 Lucas, A. M., and N. A. Thomas. 1972. Sediment oxygen demand in Lake Erie's Central Basin, 1970 (Chapter 5). In "Project Hypo," by N. M. Burns and C. Ross, Canada Centre for Inland Waters Paper No. 6 and U. S. Environmental Protection Agency Technical Report TS-05-71-208-24.
2 Baity, H. C. 1938. Some factors affecting the aerobic decomposition of sewage sludge deposits. Sewage Works Journal v. 10(3):539-568, May.
3 Fair, G. M., E. W. Moore, and H. A. Thomas, Jr. 1941. The natural purification of river muds and pollu-tional sediments. Sewage Works Journal v. 13(4); 756-778, July.
4 McDonnell, A. J., and S. D. Hall. 1969. Effect of environmental factors on benthal oxygen uptake. Journal Water Pollution Control Federation, Research Supplement, Part 2, v. 41:R353-R363, August.
5 Hanes, N. B., and R. L. Irvine. 1966. Oxygen uptake rates of benthal systems by a new technique. Proceedings 21st Industrial Waste Conference, Purdue University, Part 1. Engineering Extension Series No. 121, V L, No. 2, Lafayette, Indiana, p. 468-479, May.
6 Edwards, R. W., and H. L. J. Rolley. 1965. Oxygen consumption of river muds. Journal of Ecology v. 53:1-19.
7 Rolley, H. L. J., and M. Owens. 1967. Oxygen consumption rates and some chemical properties of river muds. Water Research v. 1:759-766.
8 Velz, C. J. 1958. Significance of organic sludge deposits. Oxygen Relationships in Streams, U. S.
Department of Health, Education, and Welfare, Robert A. Taft, Sanitary Engineering Center Technical Report W58-2.
9 Oldaker, W. H., A. A. Burgum, and H. R. Pahren. 1968. Pilot-plant studies of benthic oxygen demand of river bottom sediments. Journal Water Pollution Control Federation v. 40:1688-1701, October.
10 Hanes, B. N., and T. M. White. 1968. Effects of sea-water concentration on oxygen uptake of a benthal system. Journal Water Pollution Control Federation v. 40:R272-R280, October.
11 Blanton, J. O., and A. R. Winklhofer. 1972. Physical processes affecting the hypolimnion of the Central Basin of Lake Erie (Chapter 3). In "Project Hypo," by N. M. Burns and C. Ross, Canada Centre for Inland Waters Paper No. 6 and U. S. Environmental Protection Agency Technical Report TS-05-71-208-24.
12 Fair, G. M., E. W. Moore, and H. A. Thomas, Jr. 1941. The natural purification of river muds and pollutional sediments. Sewage Works Journal v. 13(2):270-307, March.
13 Baumgartner, D. J., and Geza Palotas. 1970. The oxygen uptake demand of resuspended bottom sediments. Seattle University Research Paper, Environmental Protection Agency, Water Quality Office Water Pollution Control Research Series 16070 DCD 09/70.
14 Butts, T. A., V. Kothandaraman, and R. L. Evans. 1973. Practical considerations for assessing the waste assimilative capacity of Illinois streams. Illinois State Water Survey Circular 110.
18

APPENDIX A. Unreduced Sediment Oxygen Demand Field Data
(DO in milligrams per liter; Temperature in degrees Cj
19

APPENDIX A (Continued)
(DO in milligrams per liter; Temperature in degrees C)
20

APPENDIX A (Continued)
(DO in milligrams per liter; Temperature in degrees C)
21

APPENDIX A (Concluded)
(DO in milligrams per liter; Temperature in degrees C)
22

APPENDIX B. Sediment Oxygen Demand in Terms of Elapsed Time and DO Used
( time elapsed in minutes; 2 DO used in milligrams per liter)
NOTE: Dashed line indicates beginning of linear portion of curve (Continued on next page)
23

APPENDIX B (Concluded)
( time elapsed in minutes; DO used in milligrams per liter)
24

APPENDIX C. Descriptions of Sediment Samples and Results of Analyses
25

APPENDIX C (Continued)
26
APPENDIX C (Continued)
27

APPENDIX C (Concluded)
28

APPENDIX D. Area) Distribution of Estimated SOD Rates
29
APPENDIX D (Continued)
30

APPENDIX D (Continued)
31

APPENDIX D (Concluded)
32