dissolved oxygen 6 - sacramento state · chapter a6. field measurements dissolved oxygen, version...
TRANSCRIPT
Chapter A6. Field Measurements Dissolved Oxygen, Version 2.1 (6/2006)
DO — 1
DISSOLVED OXYGEN 6.2
Revised by Michael E. Lewis
Page
Dissolved oxygen .................................................................... DO–3
6.2.1 Amperometric and luminescent-sensor methods ............5
6.2.1.A Equipment and supplies ....................................... 6
6.2.1.B Calibration .........................................................10
One-point and two-point calibrations ........................ 10
Correction for atmospheric pressure and salinity..... 11
Calibration procedures................................................ 13
1. Air-calibration chamber in air ........................... 13
2. Calibration with air-saturated water................. 15
3. Air-calibration chamber in water ...................... 17
6.2.1.C Measurement......................................................19
Surface Water .............................................................19
Ground Water.............................................................22
6.2.1.D Troubleshooting (amperometric instruments) ...........................24
6.2.2 Spectrophotometric method..........................................25
6.2.2.A Equipment and supplies ................................... 25
6.2.2.B Calibration and interferences ...........................26
6.2.2.C Measurement ....................................................... 27
Dissolved Oxygen, Version 2.1 (6/2006) U.S. Geological Survey TWRI Book 9
2 — DO
6.2.3 Iodometric (Winkler) method ...................................... 29
6.2.3.A Equipment and supplies.................................... 30
6.2.3.B Measurement ..................................................... 31
6.2.4 Reporting ....................................................................... 33
6.2.5 Correction factors for oxygen solubility and salinity .................................................................. 33
Selected references............................................................................46
Acknowledgments ......................................................................... 48
Illustrations
6.2–1. Graph showing factors used to correct atmospheric pressures adjusted to sea level .......................................... 12
Tables
6.2–1 Equipment and supplies for the amperometric and luminescent-sensor methods of dissolved-oxygen determenation ......................................................................7
6.2–2 Factors used to correct atmospheric pressures adjusted to sea level..............................................................................12
6.2–3 Troubleshooting guide for amperometric instruments .....24
6.2–4 Equipment and supplies for the spectrophotometric method of dissolved-oxygen determination........................26
6.2–5 Equipment and supplies for the iodometric (Winkler) method of dissolved-oxygen determination........................30
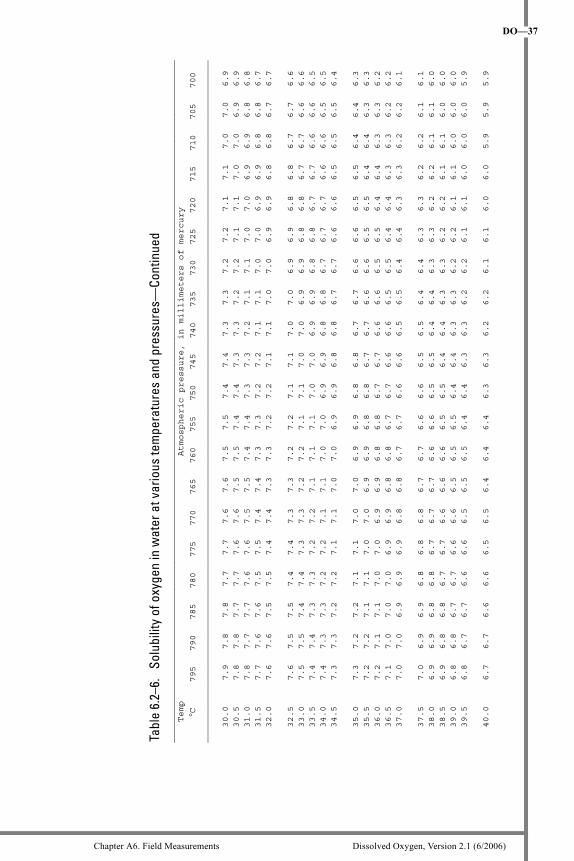
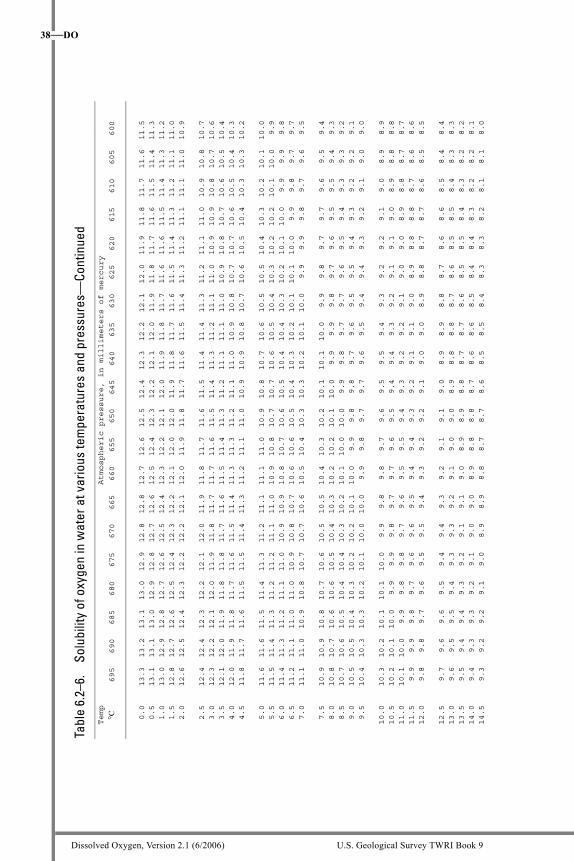
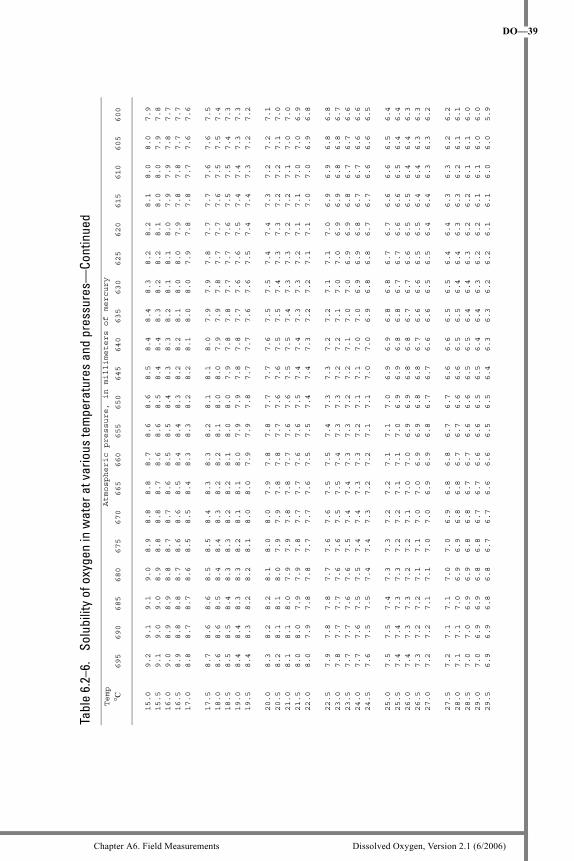
6.2–6 Solubility of oxygen in water at various temperatures and pressures.........................................................................35
6.2–7 Salinity correction factors for dissolved oxygen in water (based on conductivity) ..................................................... 41
Any use of trade, product, or firm names is for descriptive purposes only and does not imply endorsement by the U.S. Government.
Chapter A6. Field Measurements Dissolved Oxygen, Version 2.1 (6/2006)
DO — 3
DISSOLVED OXYGEN 6.2The concentration of dissolved oxygen in water is affected by many factors including ambient temperature, atmospheric pressure, and ion activity. Accurate data on the concentration of dissolved oxygen (DO) in environmental water resources are essential for documenting changes that result from natural phenomena and human activities. Sources of DO in water include atmospheric aeration and photosyn-thetic activities of aquatic plants. Many chemical and biological reac-tions in ground water and surface water depend directly or indirectly on the amount of available oxygen. Dissolved oxygen is necessary in aquatic systems for the survival and growth of many aquatic organisms and is used as an indicator of the health of surface-water bodies.
DISSOLVED OXYGEN: molecular oxygen
(oxygen gas) dissolved in water.
Standard field methods used by the U.S. Geological Survey (USGS) for determining concentrations of DO in surface and ground waters include the use of amperometric and luminescent-based-sensor instruments and spectrophotometric analysis. Selection of a measurement method should take into consideration environmental conditions, the specific data-quality objectives of the data-collection program, and the inherent benefits of a given technology. Except where noted, these methods are used routinely to determine the concentration of dissolved oxygen in fresh to saline unfiltered surface and ground waters.
Dissolved Oxygen, Version 2.1 (6/2006) U.S. Geological Survey TWRI Book 9
4 — DO
The amperometric method (section 6.2.1) has been the standard USGS procedure for the past 10 to 15 years for determining aquatic DO concentrations that exceed 1 milligram per liter (mg/L).
The luminescent-based sensor method (section 6.2.1) uses relatively new technology, and applies to the same environmental conditions as the amperometric method.
The spectrophotometric method (section 6.2.2 - for example, the
Rhodazine-D™1 technique) is recommended for determining concentrations of DO less than 2.0 mg/L.
The iodometric (Winkler) method (section 6.2.3) is regarded as an accurate and precise method for the determination of dissolved oxygen in water; however, it is not a standard USGS method for field determinations of DO because the accuracy and reproducibility achieved depend largely on knowledge of the presence of possible sources of interference (nitrite, ferrous or ferric iron, and organic matter, for example) and on the experience and technique of the data collector. In a laboratory environment, the method is excellent for calibrating DO instrument systems.
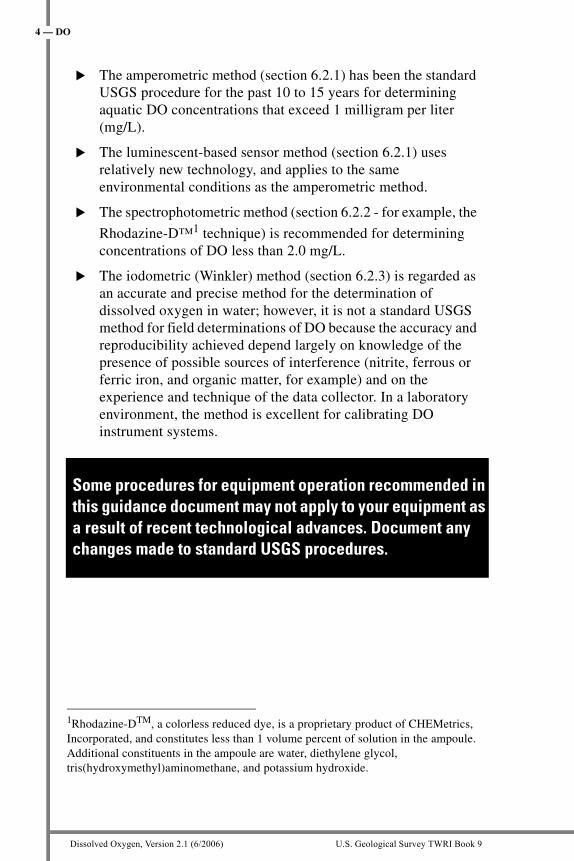
Some procedures for equipment operation recommended in this guidance document may not apply to your equipment as a result of recent technological advances. Document any changes made to standard USGS procedures.
1Rhodazine-DTM, a colorless reduced dye, is a proprietary product of CHEMetrics, Incorporated, and constitutes less than 1 volume percent of solution in the ampoule. Additional constituents in the ampoule are water, diethylene glycol, tris(hydroxymethyl)aminomethane, and potassium hydroxide.
Chapter A6. Field Measurements Dissolved Oxygen, Version 2.1 (6/2006)
DO—5
AMPEROMETRIC AND 6.2.1LUMINESCENT-SENSOR
METHODSThe amperometric and luminescent-sensor methods are appropriate for routine measurement of DO concentrations under most of the field conditions encountered by USGS data-collection personnel. Calibra-tion procedures are similar for these methods.
The amperometric method has been the most commonly used field method for measuring DO in water for USGS data-collection efforts. The DO concentration is determined using a temperature-compensating meter connected to a polarographic-membrane type of sensor.
● The method is relatively simple to use and is well-suited to making discrete or continuous in situ measurements of DO concentration in surface water or ground water.
● Method performance can be negatively affected by calibration drift; by loose, wrinkled, or damaged membranes; or by sen-sor contact with hydrogen sulfide. Unfortunately, poor perfor-mance can occur without any indications from the instrument readings.
The luminescent-sensor technology that has been developed for environmental monitoring of DO in water is considered an appropriate alternative to the amperometric method. The luminescent-sensor method involves the measurement of light-emission characteristics of a luminescent-based reaction at the sensor-water interface (see TECHNICAL NOTE). While the relative benefits of the technology are apparent, it should be recognized that its application at typical USGS sampling sites is relatively new; therefore, it does not benefit from the experience derived from years of use, as is the case with the amperometric method.
● There are no consumables such as membranes or filling solu-tions with the new method, unlike the amperometric method.
● The technology does not consume oxygen at the sensor-water interface; therefore, no stirring is required in slow or stagnant water.
● There are no known sources of interference to the method in natural aquatic systems.
Dissolved Oxygen, Version 2.1 (6/2006) U.S. Geological Survey TWRI Book 9
6—DO
TECHNICAL NOTE: The luminescent sensor employs a light-emitting diode (LED) to provide incident light, which excites the oxygen-sensit ive luminescent-dye molecule substrate (luminophore) of the sensor. After dissipation of the excitation energy, longer-wavelength light is emitted (luminescence). The magnitude of steady-state luminescence (intensity)—that is, the average luminescent lifetime (the phase difference between the excitation light and the returned light)—is measured by the sensor and is inversely proportional to the DO concentration in the water.
6.2.1.A EQUIPMENT AND SUPPLIESDO instruments (meters and sensors) are available from a number of commercial vendors. Because the instructions for use, calibration, and maintenance often differ for each manufacturer, the user is cautioned to read and carefully follow the instructional manual for the instrument system to be used. DO instruments, and expecially the sensors, are sophisticated electronic equipment and require care in handling and operation. The equipment and supplies required for the amperometric and luminescent-sensor methods of measuring the DO concentration in a water body are listed in table 6.2-1.
Amperometric instrument systems consist of the entire sensor assembly, including the electrolyte solutions, membranes, and thermistor thermometers.
Protect sensors and other supplies from being jostled during transportation, from sudden impacts, sudden temperature changes, and extremes of heat and cold.
Follow the manufacturer’s recommendations for short-term (field) and long-term (office) storage of sensors and for performance checks.
Chapter A6. Field Measurements Dissolved Oxygen, Version 2.1 (6/2006)
DO—7
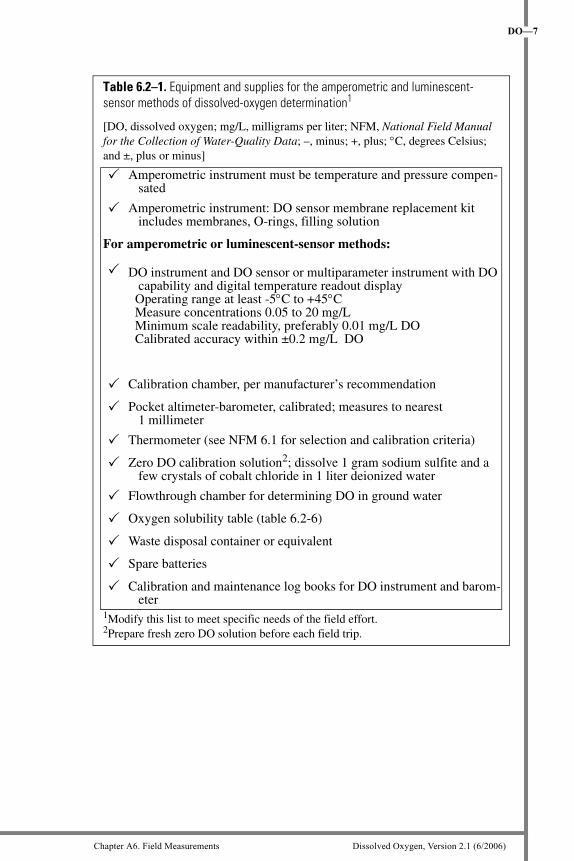
Table 6.2–1. Equipment and supplies for the amperometric and luminescent-sensor methods of dissolved-oxygen determination1
[DO, dissolved oxygen; mg/L, milligrams per liter; NFM, National Field Manual for the Collection of Water-Quality Data; –, minus; +, plus; °C, degrees Celsius; and ±, plus or minus]
Amperometric instrument must be temperature and pressure compen-sated
Amperometric instrument: DO sensor membrane replacement kit includes membranes, O-rings, filling solution
For amperometric or luminescent-sensor methods:
DO instrument and DO sensor or multiparameter instrument with DO capability and digital temperature readout display
Operating range at least -5°C to +45°CMeasure concentrations 0.05 to 20 mg/LMinimum scale readability, preferably 0.01 mg/L DOCalibrated accuracy within ±0.2 mg/L DO
Calibration chamber, per manufacturer’s recommendation
Pocket altimeter-barometer, calibrated; measures to nearest 1 millimeter
Thermometer (see NFM 6.1 for selection and calibration criteria)
Zero DO calibration solution2; dissolve 1 gram sodium sulfite and a few crystals of cobalt chloride in 1 liter deionized water
Flowthrough chamber for determining DO in ground water
Oxygen solubility table (table 6.2-6)
Waste disposal container or equivalent
Spare batteries
Calibration and maintenance log books for DO instrument and barom-eter
1Modify this list to meet specific needs of the field effort.2Prepare fresh zero DO solution before each field trip.
Dissolved Oxygen, Version 2.1 (6/2006) U.S. Geological Survey TWRI Book 9
8—DO
Before each field trip: 1. Check the instrument batteries and all electrical connections.
2. When using an amperometric instrument, inspect the sensor closely, checking for any loose, wrinkled, or torn membrane, air bubbles beneath the membrane, and a tarnished or discolored cath-ode or anode. If any of these problems are detected, do not use the sensor until it has been serviced according to the manufacturer’s recommendations.
3. Test instrument calibration. Do not use an instrument that fails to calibrate properly. Service the instrument according to the manu-facturer’s recommendations and recalibrate.
4. Test the instrument to ensure that it will read zero in a freshly pre-pared zero DO solution. For amperometric instruments:
● If the instrument reading exceeds 0.2 mg/L, then the sensor membrane and electrolyte (if present) need to be replaced or the sensor needs to be repaired.
● Before repairing or replacing the sensor, check zero DO again with a freshly prepared zero DO solution.
5. Check the calibration with a pocket altimeter-barometer. If neces-sary, recalibrate following the manufacturer’s recommendations.
6.
CAUTION: Before handling any chemicals, refer to the Material Safety Data Sheet (MSDs) for safety precautions.
Chapter A6. Field Measurements Dissolved Oxygen, Version 2.1 (6/2006)
DO—9
The relation between sensor membranes and temperature must be rec-ognized. DO sensors must be temperature compensating: the perme-ability of the membrane and solubility of oxygen in water change as a function of temperature.
All built-in thermistor thermometers must be calibrated and field checked before use, as described in NFM 6.1 (“Temperature”).
Some manufacturers provide membranes of different thicknesses, the selection of which is based on the intended use of the instrument. Select the sensor membrane based on manufacturer recommendations.
Two basic types of membrane design are available: (a) loose membranes and (b) membrane cap assemblies. Loose membranes are considerably less expensive but are more difficult to install. Sensor performance can be affected by the manner in which loose membranes are installed and conditioned after installation.
After membrane replacement, allow a minimum of 2 to 6 hours for the new membrane to condition before calibration and use.
● For greater stability during calibration allow the new mem-brane to condition overnight prior to calibration.
● If conditions necessitate using the sensor and new membrane before the recommended overnight conditioning time, more frequent calibration checks and possibly recalibration are necessary for accurate DO measurements.
Luminescent-based sensors: Manufacturers of luminescent-based DO sensors can provide very different guidance on the care and main-tenance of their particular sensor. Read and follow the manufacturer’s guidance for the specific instrument to be used.
Dissolved Oxygen, Version 2.1 (6/2006) U.S. Geological Survey TWRI Book 9
10—DO
6.2.1.B CALIBRATIONInstrument systems for the amperometric or the luminescent-sensor methods must be properly calibrated and tested before each field trip and cleaned in the field after each use.
Amperometric instruments
Different manufacturers recommend different calibration frequencies for membrane-electrode DO meters; however, virtually all state that optimum instrument performance and data quality will be obtained by frequent calibration. Calibration and operation procedures for the amperometric method differ among instrument types and makes—refer to the manufacturer’s instructions.
Luminescent-sensor instruments
Luminescent-based sensors are precalibrated by the manufacturer and most manufacturers’ literature suggests that no further calibration is warranted. The accuracy of factory calibrations, however, may not satisfy the data-quality objectives of a specific program. Frequency of calibration can have a significant effect on the overall accuracy and precision of DO measurements; therefore, users of these meters are advised to make frequent calibration checks and to recalibrate as frequently as required to meet specific data-quality objectives.
One-point and two-point calibrationsCalibration for most amperometric DO instruments and some lumines-cent-sensor instruments can only be checked with a 1-point calibration at 100-percent saturation. For these instruments, a zero DO check should be performed routinely as an evaluation of sensor performance (see section 6.2.1.A, “Before each field trip”). Because the sensors on DO instruments may be slow to respond after the zero check, the sen-sor should be thoroughly rinsed with deionized water before use.
Some instruments allow for 2-point calibrations at 0-percent and 100-percent saturation. Follow the manufacturer’s instructions for those instruments with 2-point calibration functionality. Verifying instru-ment performance at zero DO and using a 2-point calibration can be particularly important for data accuracy when the instrument will be used to measure low DO concentrations (less than 5 mg/L).
Chapter A6. Field Measurements Dissolved Oxygen, Version 2.1 (6/2006)
DO—11
Check DO meter calibration at each field site. In addition, amperometric instruments should be recalibrated each
time after a meter has been powered off.
Correction for atmospheric pressure and salinityAtmospheric pressure, the temperature of the water or water vapor, and the conductivity (or salinity) of the water must be known to determine the theoretical amount of oxygen that can be dissolved in water. Record all calibration information in instrument log books and copy cali-bration data onto field forms at the time of calibration.
Ambient atmospheric pressure is true atmospheric pressure at the measurement site, not that which has been adjusted to sea level. Atmospheric pressure reported by the National Weather Service gener-ally is not the true (ambient) value. Weather Service atmospheric read-ings usually are adjusted to sea level and must be adjusted back to the elevation of the weather station. Upon request, a weather station may provide ambient atmospheric pressure.
Use a calibration-checked pocket altimeter-barometer to determine ambient atmospheric pressure to the nearest 1 millimeter (mm) of mercury.
Check the accuracy of all field barometers before each field trip, and record readings and adjustments in the log book. If possible, check barometer accuracy with information from an official weather station.
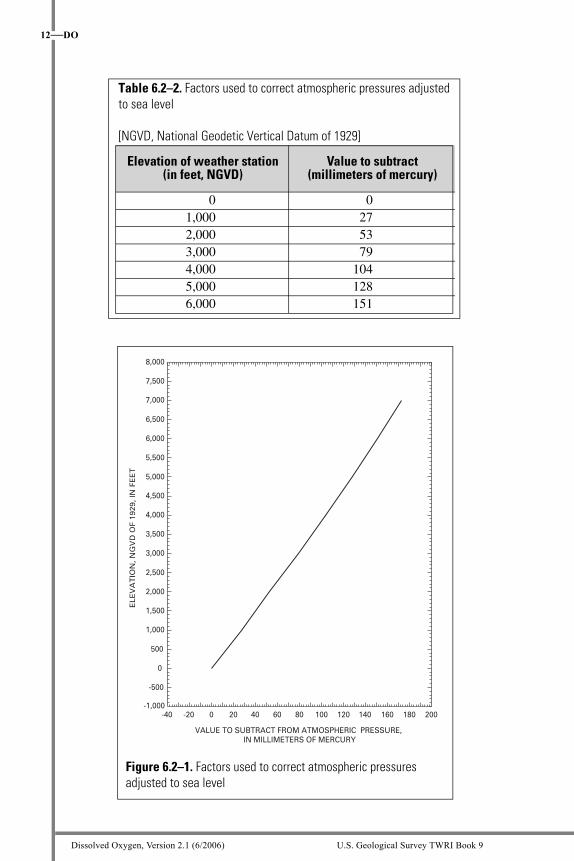
Use table 6.2–2 and figure 6.2–1 if the value used for atmospheric pressure has been adjusted to sea level.
To correct weather station readings adjusted to sea level to ambient atmospheric pressure: subtract appropriate values shown (table 6.2–2, fig. 6.2–1) from atmospheric readings adjusted to sea level (shown in millimeters of mercury).
Although atmospheric pressure does not decrease linearly with increases in elevation, linear interpolation is acceptable within the elevation ranges given in table 6.2–2. Alternatively, plot the values from table 6.2–2 and extrapolate subtraction factors directly from the graph (fig. 6.2-1). Section 6.2.5 contains the table of oxygen solubility at various tempera-tures and pressures. Many instruments have the pressure-temperature algorithm stored in internal memory. Interactive tables also are available for user-specified temperature, pressure, and salinity at http://water.usgs.gov/software/dotables.html (accessed Apr. 27, 2006).
Dissolved Oxygen, Version 2.1 (6/2006) U.S. Geological Survey TWRI Book 9
12—DO
Table 6.2–2. Factors used to correct atmospheric pressures adjusted to sea level
[NGVD, National Geodetic Vertical Datum of 1929]
Elevation of weather station(in feet, NGVD)
Value to subtract(millimeters of mercury)
0 0 1,000 27 2,000 53 3,000 79 4,000 104 5,000 128 6,000 151
Figure 6.2–1. Factors used to correct atmospheric pressures adjusted to sea level
-1,000
8,000
-500
0
500
1,000
1,500
2,000
2,500
3,000
3,500
4,000
4,500
5,000
5,500
6,000
6,500
7,000
7,500
-40 200-20 0 20 40 60 80 100 120 140 160 180
ELE
VA
TIO
N, N
GV
D O
F 19
29, I
N F
EE
T
VALUE TO SUBTRACT FROM ATMOSPHERIC PRESSURE, IN MILLIMETERS OF MERCURY
Chapter A6. Field Measurements Dissolved Oxygen, Version 2.1 (6/2006)
DO—13
Although the salinity correction can be made either during calibration or after measurement, the preferred USGS method is to apply salin-ity correction factors after calibration and measurement (recali-bration is necessary for each field variation in salinity if the correction is made during calibration). For salinity-correction procedures, see section 6.2.5.
Calibration proceduresThe three procedures described below are for a one-point calibration (100-percent saturation) of a DO system. The iodometric method for DO measurement described in section 6.2.3 can be used to check the calibration of these instruments. Record all calibration information in instrument log books and copy calibration data onto field forms at the time of calibration.
Procedure 1 (Air-calibration chamber in air) and Procedure 2 (Calibration with air-saturated water) can be used with minor modifications for either amperometric or luminescent-sensor instruments.
Procedure 3 (Air-calibration chamber in water) is appropriate only for the amperometric method.
Many amperometric DO sensors require the meter to be turned on for 10 to 15 minutes before calibration and use to stabilize the probe. Refer to the manufacturer’s instrument-specific guidelines for the requirements of your instrument.
Procedure 1—Air-calibration chamber in air
This procedure is similar to Procedure 3 (Air-calibration chamber in water), which commonly is used for amperometric instruments, except that the calibration chamber is in air rather than in water. This calibra-tion method is most commonly recommended by manufacturers of amperometric instruments. Calibration chambers are either built into the instrument case or are provided as separate components by the manufacturer. Use the calibration chamber provided or recom-mended by the manufacturer.
1. Wet the inside of the calibration chamber with water. Then pour out the water (but leave a few drops). Remove any water droplets on the sensor membrane and insert the sensor into the chamber (this ensures 100-percent humidity).
2. If using an amperometric instrument, allow 10 to 15 minutes for the DO sensor and the air inside the calibration chamber to equili-brate.
Dissolved Oxygen, Version 2.1 (6/2006) U.S. Geological Survey TWRI Book 9
14—DO
3. Using your calibration pocket altimeter-barometer, read the ambi-ent atmospheric pressure checked to the nearest 1 mm of mercury.
4. Measure the temperature in the calibration chamber and observe the readings until the instrument stabilizes. Read the temperature to the nearest 0.1oC. The temperature inside the chamber should approximate the water temperature, measured with a calibrated thermometer.
TECHNICAL NOTE FOR AMPEROMETRIC INSTRUMENTS:Most instrument manufacturers recommend calibrating at temperatures that are at least within 10oC of the ambient water temperature. The most accurate calibration will be achieved if the temperature difference between the environmental water and the calibration chamber is minimized as much as possible.
5. Use the oxygen-solubility table 6.2–6 to determine the DO satura-tion at the measured temperature and atmospheric pressure. (Refer to section 6.2.5 and table 6.2–7 for salinity corrections.)
6. Following the manufacturer’s instructions, adjust the calibration control until the instrument reads the DO saturation value deter-mined from the oxygen-solubility table.
Verify that the instrument reading is within + 0.2 mg/L of the computed saturation value, or use more stringent accuracy criteria that reflect the data-quality requirements of the study. The luminescent-sensor instrument is now calibrated and ready for use.
7. When working with an amperometric instrument, remove the sen-sor from the calibration chamber and check to see if any water droplets are on the membrane. Water droplets on the membrane cause improper calibration. If water droplets are present, recalibrate the instrument; otherwise the instrument is now calibrated and ready for use.
Chapter A6. Field Measurements Dissolved Oxygen, Version 2.1 (6/2006)
DO—15
Procedure 2—Calibration with air-saturated water
In this procedure, the DO sensor or instrument system is calibrated against water that is saturated with oxygen at a known temperature and ambient atmospheric pressure.
1. The temperature of water used for calibration should be about the same as the temperature and conductivity of the water to be mea-sured.
● If working at the field site—obtain about 1 liter (L) of water from the water body to be measured.
• If working in the laboratory—obtain about 1 L of deionized water or tap water.
2. Place the DO sensor and calibration water in a large beaker or open-mouth container. (Some manufacturers supply an air-satu-rated water-calibration vessel.)
● Allow the sensor to come to thermal equilibrium with the water temperature.
● Shield the beaker or container from direct sunlight and wind to minimize temperature variations.
3. Aerate the water for 5 to 10 minutes. Using a battery-operated aquarium pump or minnow-bucket aerator and a short piece of tub-ing, attach a gas diffusion stone to the end of the tubing and place it at the bottom of the beaker of calibration water. Avoid placing the instrument in the stream of air bubbles.
4. Determine if the water is 100-percent saturated with oxygen.
● Observe the instrument reading while aerating the calibration water.
● When no change in the DO reading is observed on the instru-ment for 4 to 5 minutes, assume that the water is saturated.
5. Using your pocket altimeter-barometer, read the ambient atmo-spheric pressure to the nearest 1 mm of mercury.
6. Read the temperature of the calibration water to the nearest 0.1oC.
7. Using oxygen solubility table 6.2–6, determine the DO saturation value at the measured temperature and atmospheric pressure of the calibration water. (Refer to section 6.2.5 and table 6.2–7 for salin-ity corrections.)
Skip to Step 9 if using an amperometric instrument
Dissolved Oxygen, Version 2.1 (6/2006) U.S. Geological Survey TWRI Book 9
16—DO
For accurate calibration, be sure that the water is 100 percent saturated with oxygen (step 4 above).
8. For luminescent-sensor instruments: Following the manufac-turer’s instrument calibration instructions, verify that the instru-ment reading is within + 0.2 mg/L of the computed saturation value. (Alternatively, apply a more stringent accuracy criterion that reflects study data-quality requirements.) The luminescent-sensor instrument is now calibrated and ready for use.
9. For amperometric instruments: Adequate flow of water across the surface of the membrane is required for accurate measure-ments. Recommendations for flow velocity vary by manufacturer, with most recommending about 1 foot per second (ft/s).
● Provide suitable turbulence in the air-saturated water by phys-ical or mechanical means to maintain the required flow rate past the membrane, avoiding the creation of air bubbles at the water-sensor interface.
● Maintain this flow rate when making measurements and adjusting instrument calibration.
10. For amperometric instruments: Turn off the aerator and take care to prevent any air bubbles from adhering to the membrane. Following the manufacturer’s instructions, set or adjust the cali-bration control until the instrument reads a saturation value of DO as determined above. Verify that the instrument reading is within + 0.2 mg/L of the computed saturation value, or use more strin-gent accuracy criteria that reflect the data-quality objectives of the study.
Chapter A6. Field Measurements Dissolved Oxygen, Version 2.1 (6/2006)
DO—17
Procedure 3—Air-calibration chamber in water
This calibration method is applicable only to amperometric instruments. An air-calibration chamber permits calibration of the DO sensor at the temperature of the water in which the DO concentra-tion is to be measured. This calibration procedure minimizes errors caused by temperature differences. Air-calibration chambers for in-water calibrations currently are not available on the open market and one of the most common, the YSI 5075A calibration chamber, is no longer manufactured. For most multi-parameter water-quality instru-ments, the manufacturer-provided ground-water flow cell may be modified and used as an air-calibration chamber in water. The modifi-cation requires the cell to be mounted on the sonde with one port of the cell plugged and the other port vented to the atmosphere with tubing.
1. Insert the sensor probe into the rings of the DO wand and dip this calibration chamber into the surface or ground water to be mea-sured, allowing the temperature readings to stabilize. Remove the wand and pour out the excess water, leaving a few drops.
● Check for and remove any water droplets on the sensor mem-brane.
● Insert the DO sensor into the wet chamber (this ensures 100 percent humidity).
● If a YSI model 5739 sensor is used, the pressure-compensating diaphragm on the side of the sensor must be enclosed within the calibration chamber during calibration.
● Check that no water can leak into the calibration chamber and that the membrane does not have droplets of water adhering to it. The water droplets reduce the rate of oxygen diffusion through a membrane, producing erroneous results.
2. Immerse the calibration chamber into the water to be measured. Allow 10 to 15 minutes for the air temperature inside the chamber to equilibrate with the water (see the TECHNICAL NOTE in Proce-dure 1).
● For streams, choose an area of the stream that closely approxi-mates mean stream temperature. In shallow streams, try to place the chamber in an area that represents the stream but that is shaded from direct sunlight.
● For ground water, use temperature-stabilized purge water or other clean water having a temperature that closely approxi-mates that of the ground water.
Dissolved Oxygen, Version 2.1 (6/2006) U.S. Geological Survey TWRI Book 9
18—DO
3. Using a calibration-checked pocket altimeter-barometer, determine the ambient atmospheric pressure to the nearest 1 mm of mercury.
4. Read the temperature within the chamber to the nearest 0.1oC, using a calibrated thermometer (NFM 6.1).
● The temperature inside the chamber should approximate the water temperature.
● If the two temperatures do not match, allow additional time for equilibration of the chamber with the water temperature.
● If the temperature of the chamber still does not approximate the water temperature, the thermistor in the DO sensor might be malfunctioning. Compare water temperature measured by the DO meter and a calibrated field thermometer. If the two measurements vary by more than + 0.2oC, the calibration should be discontinued and the DO meter thermistor should be repaired following the manufacturer’s recommendations.
TECHNICAL NOTE: Most instrument manufacturers recommend calibrating at temperatures that are at least within 10oC of the ambient water temperature. The most accurate calibration will be achieved if the temperature difference between the environmental water and the calibration chamber is minimized as much as possible.
5. Use table 6.2-6 (section 6.2.5) to determine the DO saturation value at the measured water temperature and atmospheric pres-sure. If a salinity correction will be applied during calibration, consult the instructions in section 6.2.5 and table 6.2-7.
6. Following the manufacturer’s instructions, set or adjust the calibra-tion control until the instrument reads a DO saturation value deter-mined from oxygen solubility (table 6.2–6). Verify that the instrument reading is within + 0.2 mg/L of the computed satura-tion value, or use more stringent accuracy criteria per the data-quality objectives of the study. The instrument is now calibrated and ready for use. Remove the sensor from the calibration cham-ber.
Water droplets on the DO membrane will result in improper calibration. Recalibration is required if water droplets are observed.
Chapter A6. Field Measurements Dissolved Oxygen, Version 2.1 (6/2006)
DO—19
TECHNICAL NOTE: The YSI 5075A calibration chamber is designed to allow the membrane surface of a DO electrode (model 5739) to be at ambient atmospheric pressure while in the chamber. Because the pressure-compensating diaphragm must remain at atmospheric pressure, check the calibration chamber vent tube (from the chamber through the end of the handle) to ensure that it is not plugged with debris or filled with water.
MEASUREMENT 6.2.1.C The solubility of oxygen in water depends on the partial pressure of oxy-gen in air, the temperature of the water, and the dissolved-solids content of the water.
The higher the atmospheric pressure and the lower the temperature and conductivity, the more oxygen can be dissolved in the water.
Degassing, mineral precipitation, and other chemical, physical, and biological reactions can cause the DO concentration of a water sample to change substantially within minutes after sample collection. These sample reactions are especially important when sampling ground water that is not in equilibrium with the atmosphere.
The solubility of oxygen in water decreases as salinity increases. Correction factors for salinity normally are applied after measuring DO. Information about oxygen solubility and salinity and a salinity correction-factors table are in section 6.2.5. Interactive tables also are available according to user-specified temperature, pressure, and salinity at http://water.usgs.gov/software/dotables.html (accessed Apr. 27, 2006).
Surface waterStandard determinations of dissolved oxygen in surface water represent the cross-sectional median or mean concentration of dissolved oxygen at the time of observation.
Measuring the DO concentration at one distinct spot in a cross section is valid only for flowing water with a cross-sectional DO variation of less than 0.5 mg/L. Discerning such variation requires a cursory cross-section measurement. The effort involved in collecting this cross-section information is only slightly less than making an equal-width-increment (EWI), equal-discharge-increment (EDI), or multiple-vertical cross-sectional measurement. Measurements made at multiple locations in the cross section are recommended when possible.
Dissolved Oxygen, Version 2.1 (6/2006) U.S. Geological Survey TWRI Book 9
20—DO
Determining DO for a single vertical at the centroid of flow at the midpoint of the vertical only represents the cross section under ideal mixing conditions.
Do not measure DO in or directly below sections with turbulent flow, in still water, or from the bank, unless these conditions represent most of the reach or are required by the study objectives.
Apply a salinity correction to the saturation values after the DO measurement, if needed (http://water.usgs.gov/software/dotables.html, accessed Aug. 26, 2005).
Dissolved oxygen must be measured in situ. Never measure DO in subsamples from a sample splitter.
Follow the 7 steps below to measure DO in surface water:
1. Calibrate the DO instrument at the field site and check that the temperature thermistor has been certified by the USGS Water Sci-ence Center within the past 4 months (NFM 6.1.2).
2. Record the DO variation from the cross-sectional profile and select the sampling method (NFM 6.0):
● Flowing, shallow stream—Wade to the location(s) where DO is to be measured.
● Stream too deep or swift to wade—Lower a weighted DO sensor with a calibrated temperature sensor from a bridge, cableway, or boat. (Do not attach the weight directly to the sen-sors or sensor cables, because this could damage the sensors or sensor cables.)
● Still-water conditions—Measure DO at multiple depths at several points in the cross section.
Chapter A6. Field Measurements Dissolved Oxygen, Version 2.1 (6/2006)
DO—21
3. Immerse the DO and temperature sensors directly into the water body and allow the sensors to equilibrate to the water temperature (no less than 60 seconds).
Notes for amperometric instruments only:
● If the water velocity at the point of measurement is less than about 1 ft/s, use a stirring device or stir by hand to increase the velocity. (To hand stir, raise and lower the sensor at a rate of about 1 ft/s, but do not break the surface of the water.) The stir-by-hand method may not be appropriate in lakes, reservoirs, or slow-moving waters (for example, bayous) as these water bod-ies may be stratified at the point of measurement, making accu-rate DO measurements impossible. This could be especially problematic in areas where DO concentrations change substan-tially over short distances, such as near the thermocline or bot-tom sediments.
● High stream velocity can cause erroneous DO measurements.
4. Record the temperature without removing the sensor from the water.
5. After the instrument reading has stabilized, record the median DO concentration (see NFM 6.0).
● The reading should stabilize to within ±0.2 mg/L.
6. For EWI, EDI, or multiple-vertical measurements, proceed to the next station in the cross section and repeat steps 3 through 5. When measurements for the stream have been completed, remove the sensor from the water, rinse it with deionized water, and store it according to the manufacturer’s instructions.
7. Record DO concentrations on the field forms:
● In still water—median of three or more sequential values.
● EDI—mean value of all subsections measured (use the median if measuring one vertical at the centroid of flow).
● EWI—mean (or median) of all subsections measured.
Dissolved Oxygen, Version 2.1 (6/2006) U.S. Geological Survey TWRI Book 9
22—DO
Ground waterTo determine the concentration of DO in an aquifer, the water being measured must not contact air. Study objectives and site characteristics will dictate the specific procedures selected. If the DO concentration is less than 1 mg/L, refer to the spectrophotometric method (sec-tion 6.2.2).
Throughout measurement, use equipment that avoids aeration, and operate equipment to mitigate losses or gains of dissolved gases. (Consult NFM 6.0 for proper downhole and flowthrough-chamber sampling procedures.)
Use a positive-displacement submersible pump and high-density plastic or fluorocarbon-polymer sample tubing that is relatively gas impermeable, if possible.
Use transparent materials for the tubing and chamber to allow checking for bubbles. Air bubbles that adhere to the sides of the tubing and flowthrough chamber will add significant error to low-level DO measurements (A.F. White, U.S. Geological Survey, written commun., 1993).
Never use a bailed or other discrete sampler to determine the concentration of DO in ground water.
Follow the steps below to measure DO in ground water:
1. Calibrate the DO instrument onsite. Check that the thermistor ther-mometer has been certified by the USGS Water Science Center within the past 4 months.
2. Install the DO equipment (see NFM 6.0):
● Downhole system—Lower the DO and temperature sensors to the sampling point, followed by the pump, to monitor DO varia-tion during purging. If an amperometric downhole system will be used only for final DO determination after the samples are collected and the pump is removed, attach a stirrer to the DO instrument before lowering it to the sampling point.
● Flowthrough-chamber system—Refer to NFM 6.0 for installation guidelines. Be sure to:
Chapter A6. Field Measurements Dissolved Oxygen, Version 2.1 (6/2006)
DO—23
Air bubbles in the lines and flowthrough chamber can add substantial error to low DO readings.
a. Install the DO sensor through an air-tight grommet, checking that the seal is intact. Check that the sensors are properly immersed.
b. Flush air bubbles from the tubing walls and flowthrough chamber—tap the tubing with the blunt end of a tool to dislodge entrained air bubbles (see TECHNICAL NOTE below).
c. Check for and eliminate backpressure in the chamber.
3. If using a luminescent-sensor instrument, skip to step 4. If using an amperometric instrument, be sure to maintain constant, laminar flow past the DO sensor.
4. Measure and record DO at regular intervals throughout purging. Allow the sensors to equilibrate with ground water for 5 minutes or more at the flow rate to be used for sampling.
5. Check the stability (variability) of DO toward the end of purging.
The stability criterion is met when five consecutive readings made at regularly spaced intervals of 3 to 5 minutes or more are within +0.2 mg/L. (For each reading, monitor fluctuations for 30 to 60 seconds and record the median value, if necessary.) If the ±0.2 mg/L criterion is not met, increase the purge period in accordance with study objectives and continue to record measurements at reg-ularly spaced time intervals.
6. Report sample DO as the median of the final five DO readings recorded. Record on field forms any difficulty with stabilization.
7. Remove the sensor from the water and rinse it with deionized water.
TECHNICAL NOTE: Anomalously high DO measurements commonly are caused by aeration of ground water during pumping. This can result from air leakage through loose fittings on production-well pumps (for example, turbine pumps) and also if drawdown in the aquifer introduces air into the cone of depression or through well-screen perforations. To avoid these problems, review information about the pump, well-construction and drawdown data, and previous data records (A.F. White, U.S. Geological Survey, written commun., 1993).
Dissolved Oxygen, Version 2.1 (6/2006) U.S. Geological Survey TWRI Book 9
24—DO
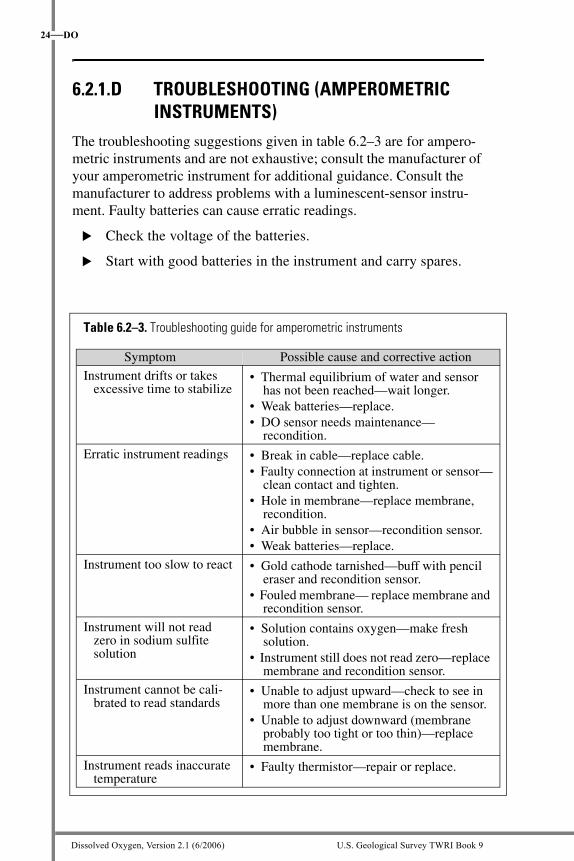
6.2.1.D TROUBLESHOOTING (AMPEROMETRIC INSTRUMENTS)
The troubleshooting suggestions given in table 6.2–3 are for ampero-metric instruments and are not exhaustive; consult the manufacturer of your amperometric instrument for additional guidance. Consult the manufacturer to address problems with a luminescent-sensor instru-ment. Faulty batteries can cause erratic readings.
Check the voltage of the batteries.
Start with good batteries in the instrument and carry spares.
Table 6.2–3. Troubleshooting guide for amperometric instruments
Symptom Possible cause and corrective action
Instrument drifts or takes excessive time to stabilize
• Thermal equilibrium of water and sensor has not been reached—wait longer.
• Weak batteries—replace.• DO sensor needs maintenance—
recondition.
Erratic instrument readings • Break in cable—replace cable.• Faulty connection at instrument or sensor—
clean contact and tighten.• Hole in membrane—replace membrane,
recondition.• Air bubble in sensor—recondition sensor.• Weak batteries—replace.
Instrument too slow to react • Gold cathode tarnished—buff with pencil eraser and recondition sensor.
• Fouled membrane— replace membrane and recondition sensor.
Instrument will not read zero in sodium sulfite solution
• Solution contains oxygen—make fresh solution.
• Instrument still does not read zero—replace membrane and recondition sensor.
Instrument cannot be cali-brated to read standards
• Unable to adjust upward—check to see in more than one membrane is on the sensor.
• Unable to adjust downward (membrane probably too tight or too thin)—replace membrane.
Instrument reads inaccurate temperature
• Faulty thermistor—repair or replace.
Chapter A6. Field Measurements Dissolved Oxygen, Version 2.1 (6/2006)
DO—25
SPECTROPHOTOMETRIC METHOD 6.2.2Spectrophotometric methods2 described by Chemetrics, Inc. are recom-mended for accurate determination of DO concentrations in suboxic waters over a concentration range of 0.1 mg/L to approximately 1.0 mg/L. The Rhodazine-D™ colorimetric method minimizes atmospheric interaction with the water sampled (ASTM D 5543-94, 2005; White and others, 1990; http://www.chemetrics.com/catalogpdfs.html, accessed May 15, 2006).
The accuracy of the method is +10 percent at 75 percent of full range, +20 percent at 25 percent of full range, and +30 percent at the CHEMetrics practical detection limit.
The technique was developed for ground water but it can be adapted for work in anoxic zones of lakes and reservoirs.
EQUIPMENT AND SUPPLIES 6.2.2.ATwo sampling systems can be used, an in situ (submersible or downhole) sampler (see White and others, 1990), or a plastic overflow cell through which sample water is pumped. Either sampling system uses partially evacu-ated oxygen-free glass ampoules containing Rhodazine-D™ that are broken along a prescored capillary tip while they are submerged in the water to be analyzed. Equipment and supplies needed for this method are listed in table 6.2–4.
2Dissolved-oxygen concentrations in the range of 0.2 to 2.0 mg/L and 2.0 to 15.0 mg/L also can be determined spectrophotometrically using an Indigo-Carmine method (Gilbert and others, 1982; www.chemetrics.com/catalogpdfs.html, accessed May 15, 2006)
Dissolved Oxygen, Version 2.1 (6/2006) U.S. Geological Survey TWRI Book 9
26—DO
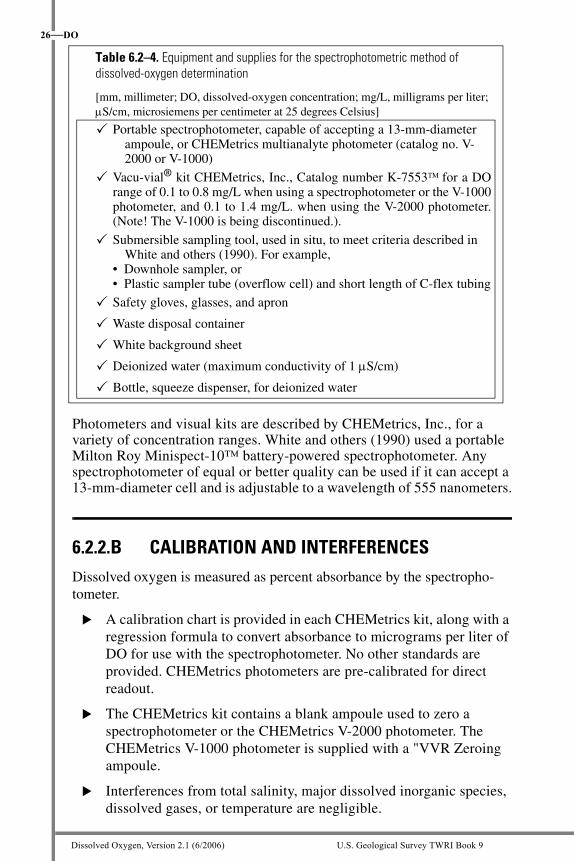
Photometers and visual kits are described by CHEMetrics, Inc., for a variety of concentration ranges. White and others (1990) used a portable Milton Roy Minispect-10™ battery-powered spectrophotometer. Any spectrophotometer of equal or better quality can be used if it can accept a 13-mm-diameter cell and is adjustable to a wavelength of 555 nanometers.
6.2.2.B CALIBRATION AND INTERFERENCESDissolved oxygen is measured as percent absorbance by the spectropho-tometer.
A calibration chart is provided in each CHEMetrics kit, along with a regression formula to convert absorbance to micrograms per liter of DO for use with the spectrophotometer. No other standards are provided. CHEMetrics photometers are pre-calibrated for direct readout.
The CHEMetrics kit contains a blank ampoule used to zero a spectrophotometer or the CHEMetrics V-2000 photometer. The CHEMetrics V-1000 photometer is supplied with a "VVR Zeroing ampoule.
Interferences from total salinity, major dissolved inorganic species, dissolved gases, or temperature are negligible.
Table 6.2–4. Equipment and supplies for the spectrophotometric method of dissolved-oxygen determination
[mm, millimeter; DO, dissolved-oxygen concentration; mg/L, milligrams per liter; μS/cm, microsiemens per centimeter at 25 degrees Celsius]
Portable spectrophotometer, capable of accepting a 13-mm-diameter ampoule, or CHEMetrics multianalyte photometer (catalog no. V-2000 or V-1000)
Vacu-vial® kit CHEMetrics, Inc., Catalog number K-7553TM for a DO range of 0.1 to 0.8 mg/L when using a spectrophotometer or the V-1000 photometer, and 0.1 to 1.4 mg/L. when using the V-2000 photometer. (Note! The V-1000 is being discontinued.).
Submersible sampling tool, used in situ, to meet criteria described in White and others (1990). For example,
• Downhole sampler, or• Plastic sampler tube (overflow cell) and short length of C-flex tubing
Safety gloves, glasses, and apron
Waste disposal container
White background sheet
Deionized water (maximum conductivity of 1 μS/cm)
Bottle, squeeze dispenser, for deionized water
Chapter A6. Field Measurements Dissolved Oxygen, Version 2.1 (6/2006)
DO—27The spectrophotometric method is affected by the presence of reducible inorganic species such as chlorine, ferric and cupric ions, and hexavalent chromium, resulting in high-biased DO readings. The presence of cupric copper and ferric iron at less than 50 micrograms per liter (μg/L) cause a bias of less than 1 μg/L; at concentrations of 100 μg/L, cupric copper causes a bias of 5 μg/L and ferric iron causes a bias of 7μg/L. The effect from reducible inorganic species can be corrected if the concentrations of the interfering species are known (White and others, 1990).
Additional calibration is needed if the method will be used to determine DO in heavily contaminated or acidic waters. This can be done by equilibrating a water sample with known partial pressures of atmospheric oxygen (White and others, 1990). Atmospheric oxygen standards are available from suppliers of gas chromatography equipment.
Color and turbidity interfere with this test method, causing positively biased results. If using this method in colored or turbid water, first conduct an assessment of the amount of bias attributable to such effects.
MEASUREMENT 6.2.2.C Rhodazine-D™ reagent reacts with DO to produce an oxidized com-plex characterized by a red-blue color. The color intensity is propor-tional to the concentration of the initial DO present.
Follow the 8 steps below to measure DO using the spectrophotometric method:1. According to site characteristics and study objectives, purge the
well following guidelines in NFM 4.2.
2. Set the spectrophotometer to a wavelength of 555 nanometers.
3. Zero the spectrophotometer using the blank provided in the kit (follow the manufacturer’s instructions). Collect the sample.
4. Install either the downhole sampling tool (White and others, 1990) or use a plastic overflow-sampler tube with a suitable pump. (Use a positive-displacement submersible pump and high-density plas-tic or fluorocarbon polymer sample tubing that is relatively gas impermeable, if possible, throughout measurement; use equipment that avoids aeration; and operate equipment to mitigate losses or gains of dissolved gases—consult NFM 6.0 for proper downhole and flowthrough-chamber sampling procedures.)
Dissolved Oxygen, Version 2.1 (6/2006) U.S. Geological Survey TWRI Book 9
28—DO
● Downhole system—
a. Carefully lower a sampling tool attached to a wire line. b. At the collection point (in a well or in surface water), break
the scored tip of the ampoule using a sharp upward tug on the sampling tool. (This permits sample water to be drawn into the ampoule. During transit to the surface, progressively decreasing pressure in the ampoule prevents cross contamination from overlying water through the capillary tip.)
c. Withdraw the ampoule from the sampler and mix the contents of the ampoule by inverting it several times, allowing the bubble to travel from end to end.
d. Wipe all liquid from the exterior of the ampoule, using a lint-free tissue.
● Overflow cell—
a. Purge the well (NFM 4.2).
b. Connect the plastic overflow-sampler tube provided by CHEMetrics, Inc., to the outlet of the ground-water pump tubing with a short length (2 inches or less) of C-flex tubing. Reduce the pump flow rate to about 500 milliters (mL) per minute for sample collection. Continue pumping the well and allow the sample tube to overflow during sample collection.
● Use optically clear materials for the tubing and chamber (to check that entrained bubbles are not present). Air bub-bles that adhere to the sides of the tubing and flowthrough chamber will add significant error to low-level DO mea-surements (A.F. White, U.S. Geological Survey, written commun., 1993).
● Flush air bubbles from the tubing walls and flowthrough chamber. Tap the tubing with the blunt end of a tool to dis-lodge entrained air bubbles.
c. Insert the glass ampoule, tip first, into the overflowing sampler tube so that the tapered tip is at the bottom of the tube.
d. Snap the tip by gently pressing the upper end of the ampoule toward the wall of the sampling tube.
e. The ampoule will fill, leaving a bubble to facilitate mixing. Mix the contents of the ampoule by inverting it several times, allowing the bubble to travel from end to end.
f. Wipe all liquid from the exterior of the ampoule, using a lint-free tissue.
Chapter A6. Field Measurements Dissolved Oxygen, Version 2.1 (6/2006)
DO—29
5. Insert the ampoule directly into the 13-mm-diameter spectropho-tometer cell holder immediately after retrieval.
6. Read absorbance:
● Make spectrophometer readings as soon as possible after snap-ping the tip of the ampoule, optimally within 30 seconds.
● Read each DO value three times and record the median value.
7. Calculate the DO concentrations using regression equations pro-vided by CHEMetrics, Inc. (White and others, 1990).
8. Quality control—
● Repeat steps 5 through 7 twice to document precision.
● To document the variability of DO concentrations within the water system, repeat steps 3 through 7 on three sequentially collected samples.
IODOMETRIC (WINKLER) 6.2.3 METHOD
The USGS currently uses the Alsterberg-Azide modification to the Win-kler titration procedure for iodometric determination of dissolved oxy-gen. The accuracy of measurements using the iodometric method should be within at least ±0.05 mg/L.
The iodometric method currently is not being used as a standard field method in USGS investigations for measurement of dissolved oxygen because (1) the accuracy achievable can be variable and is dependent on the experience and technique of the data collector, (2) potential environmental interferences require advanced knowledge of sample chemistry, and (3) field conditions can make preventing exposure of the sample to atmospheric oxygen difficult. Nevertheless, use of the iodometric method can produce accurate results when correctly implemented.
The iodometric (Winkler) method is excellent for calibrating DO instrument systems in a laboratory environment.
— When calibrating amperometric instruments in the laboratory using the Winkler procedure, deionized water saturated with air is titrated to determine the DO; the DO instrument is then adjusted to the concentration determined from the titration.
— If a saline solution is used to approximate the environmental water, do not apply a salinity correction factor.
Dissolved Oxygen, Version 2.1 (6/2006) U.S. Geological Survey TWRI Book 9
30—DO
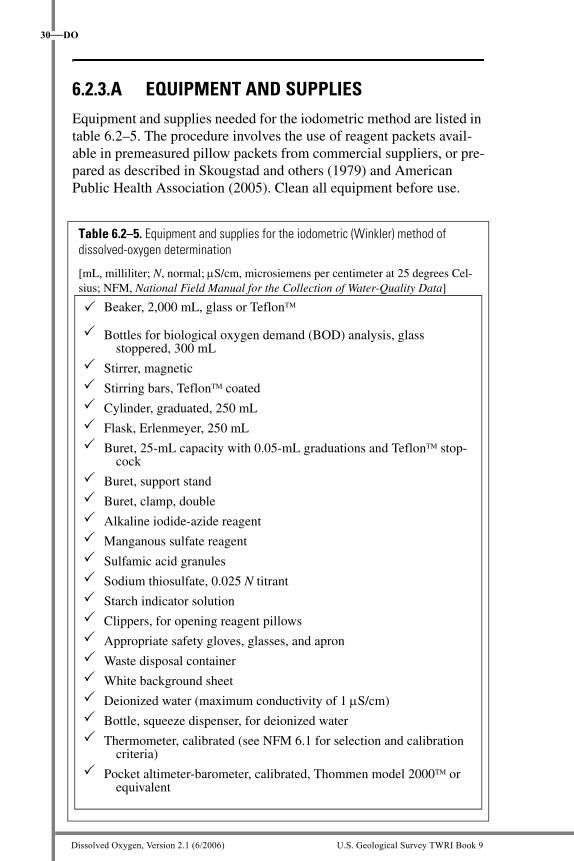
6.2.3.A EQUIPMENT AND SUPPLIESEquipment and supplies needed for the iodometric method are listed in table 6.2–5. The procedure involves the use of reagent packets avail-able in premeasured pillow packets from commercial suppliers, or pre-pared as described in Skougstad and others (1979) and American Public Health Association (2005). Clean all equipment before use.
Table 6.2–5. Equipment and supplies for the iodometric (Winkler) method of dissolved-oxygen determination
[mL, milliliter; N, normal; μS/cm, microsiemens per centimeter at 25 degrees Cel-sius; NFM, National Field Manual for the Collection of Water-Quality Data]
Beaker, 2,000 mL, glass or TeflonTM
Bottles for biological oxygen demand (BOD) analysis, glass stoppered, 300 mL
Stirrer, magnetic
Stirring bars, TeflonTM coated
Cylinder, graduated, 250 mL
Flask, Erlenmeyer, 250 mL
Buret, 25-mL capacity with 0.05-mL graduations and TeflonTM stop-cock
Buret, support stand
Buret, clamp, double
Alkaline iodide-azide reagent
Manganous sulfate reagent
Sulfamic acid granules
Sodium thiosulfate, 0.025 N titrant
Starch indicator solution
Clippers, for opening reagent pillows
Appropriate safety gloves, glasses, and apron
Waste disposal container
White background sheet
Deionized water (maximum conductivity of 1 μS/cm)
Bottle, squeeze dispenser, for deionized water
Thermometer, calibrated (see NFM 6.1 for selection and calibration criteria)
Pocket altimeter-barometer, calibrated, Thommen model 2000TM or equivalent
Chapter A6. Field Measurements Dissolved Oxygen, Version 2.1 (6/2006)
DO—31
MEASUREMENT 6.2.3.B Measure DO on at least two subsamples, for quality control. Results of two iodometric titrations should agree within 0.1 mg/L. If they do not agree, repeat the titration on a third subsample.
Follow steps 5 and 6 to perform the iodometric titration in duplicate. If the purpose is to check calibration of an amperometric or luminescent-sensor instrument, start at step 1 and continue to the end.
1. Fill a 2,000-mL beaker with deionized water that is near DO satu-ration. The water temperature should be close to the ambient (field or laboratory) temperature.
2. Prepare the DO instrument for operation according to the manu-facturer’s instructions.
3. Place the DO sensor in a beaker of distilled water. With a magnetic stirrer, maintain a velocity of at least 1 ft/s past the DO sensor.
4. Monitor the DO concentrations of the deionized water with the DO instrument and record the value after the readings have stabilized.
5. Carefully fill two biochemical oxygen demand (BOD) bottles with deionized water from the beaker, taking care to avoid introducing any air bubbles, and overflowing the bottles adequately to remove any trapped air bubbles.
6. Determine the DO concentration of the water in each BOD bottle, as follows:
a. Add one each of the following dry reagent pillow packets:● alkaline iodide-azide (white powder).
● manganous sulfate (pinkish-colored powder).
b. Recap the bottle. Do not allow air bubbles to be trapped in the bottle.
c. Invert the bottle 25 times or more to completely dissolve the reagents.
● An orange-brown flocculent indicates the presence of DO.
● Allow the flocculent to settle halfway down the bottle (approximately 5 minutes).
● Invert the bottle 25 times again; let the flocculent settle again until the upper half of the solution is clear.
d. Add one reagent pillow of sulfamic acid.
Dissolved Oxygen, Version 2.1 (6/2006) U.S. Geological Survey TWRI Book 9
32—DO
e. Recap the bottle without introducing air or air bubbles. Invert the bottle 25 times until all of the flocculent and granules are dissolved, leaving a yellow color.
f. Fill a clean 25-mL buret with 0.025 N (Normal) sodium thiosulfate titrant. Remove any air bubbles from the delivery tube beneath the stopcock and zero the meniscus.
g. Use a clean, graduated cylinder to measure 200 mL of the sample and pour the sample into a clean, wide-mouth Erlenmeyer flask.
h. Place the flask on a magnetic stirrer. Add a clean Teflon™ stirring bar and stir the sample at a moderate rate without aerating the sample.
i. Add increments of sodium thiosulfate titrant until the color turns pale straw-yellow.
j. Add 1 to 2 mL of starch indicator solution. (This causes the sample to turn dark blue.)
k. Very slowly add more sodium thiosulfate titrant until the sample just turns clear. (A white background behind the bottle will help you see the color change.)
l. Record the volume of sodium thiosulfate titrant used, in milliliters.
● For a 200-mL sample, the volume of titrant added is directly proportional to the amount of DO in milligrams per liter.
● To calculate DO for a sample volume greater or less than 200 mL,
m. Record the DO value. Rinse the equipment with deionized water.
n. Quality control—The titration values for the duplicate samples should agree within 0.1 mg/L. If they do not, repeat the titration on a third sample.
7. Recheck the field instrument for proper functioning, following the manufacturer’s instructions. Adjust the calibration control until the DO instrument system reads the DO concentration determined from the iodometric measurement.
DO (mg/L)200
sample volume---------------------------( ) titrant added, in mL×=
Chapter A6. Field Measurements Dissolved Oxygen, Version 2.1 (6/2006)
DO—33
REPORTING 6.2.4USGS personnel are instructed to enter the DO value on the National Water Quality Laboratory Analytical Services Request form and on the field form.
DO concentrations are determined to the nearest 0.1 mg/L.
If the concentration exceeds 20 mg/L, report “>20 mg/L.”
Note that the percentage of DO saturation in water can be greater than 100.
CORRECTION FACTORS FOR 6.2.5 OXYGEN SOLUBILITY AND SALINITY
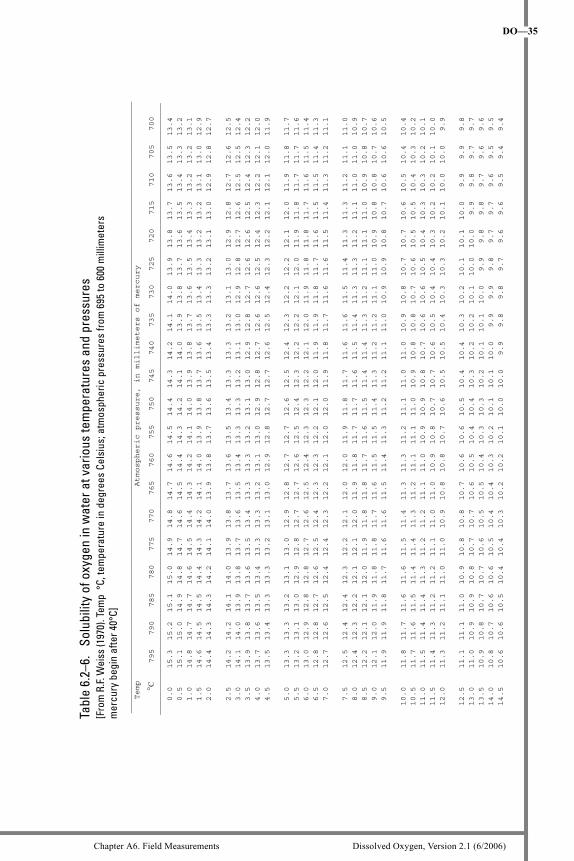
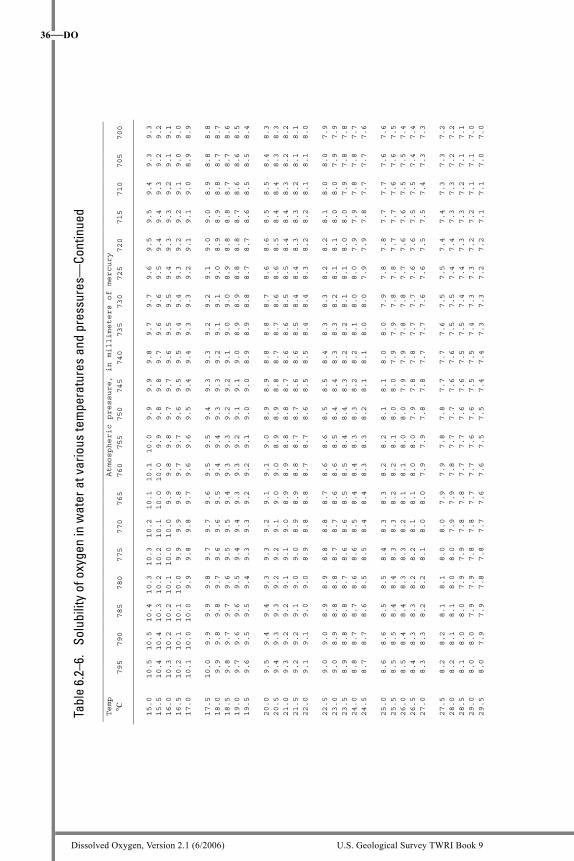
Correction factors for the solubility of oxygen at various temperatures and pressures and for salinity based on conductivity are given in tables 6.2–6 and 6.2–7, respectively. Tables 6.2–6 and 6.2–7 were generated from the equations of Weiss (1970) and can be customized to cover the range and decimal places needed (see U.S. Geological Survey Quality of Water Branch Technical Memorandum 81.11, 1981). Interactive software to generate a specific range of oxygen-solubility and salinity correction factors can be accessed at http://water.usgs.gov/software/dotables.html (accessed Apr. 28, 2006).
To convert oxygen-saturation values for salinity, use correction factors based on chloride concentration or conductivity. Refer to the manufac-turer’s instructions for the DO instrument before applying a salinity cor-rection.
Correcting DO solubility for saline waters (salinities greater than 2,000 microsiemens per centimeter or 1,000 mg/L chloride) varies with instrument type, calibration method, and the salts in solution.
The correction based on conductivity (table 6.2–7) is more useful because accurate conductivity can be determined easily from a field measurement. Salinity correction factors based on chloride can be calculated using information provided in U.S. Geological Survey Quality of Water Branch Technical Memorandum 79.10, 1979.
Dissolved Oxygen, Version 2.1 (6/2006) U.S. Geological Survey TWRI Book 9
34—DO
DO instruments use either an automatic internal salinity correction, a manual salinity control knob for internal correction, or the calibration control knob for manual salinity correction.
Check that instruments with automatic internal salinity correction use approved salinity correction factors.
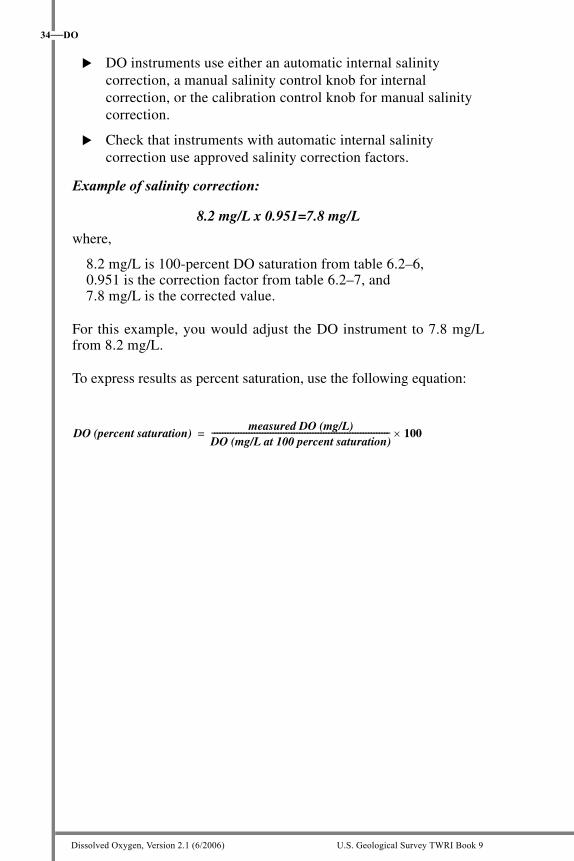
Example of salinity correction:
8.2 mg/L x 0.951=7.8 mg/L
where,
8.2 mg/L is 100-percent DO saturation from table 6.2–6, 0.951 is the correction factor from table 6.2–7, and 7.8 mg/L is the corrected value.
For this example, you would adjust the DO instrument to 7.8 mg/L from 8.2 mg/L.
To express results as percent saturation, use the following equation:
DO (percent saturation)measured DO (mg/L)
DO (mg/L at 100 percent saturation)------------------------------------------------------------------- 100×=
Chapter A6. Field Measurements Dissolved Oxygen, Version 2.1 (6/2006)
DO—35
Tabl
e 6.
2–6.
So
lubi
lity
of o
xyge
n in
wat
er a
t var
ious
tem
pera
ture
s an
d pr
essu
res
[Fro
m R
.F. W
eiss
(197
0). T
emp
°C,
tem
pera
ture
in d
egre
es C
elsi
us; a
tmos
pher
ic p
ress
ures
from
695
to 6
00 m
illim
eter
s m
ercu
ry b
egin
afte
r 40°
C]
Temp
Atmospheric pressure, in millimeters of mercury
C 795 790 785 780 775 770 765 760 755 750 745 740 735 730 725 720 715 710 705 700
___________________________________________________________________________________________________________________________________
___________________________________________________________________________________________________________________________________
0.0 15.3 15.2 15.1 15.0 14.9 14.8 14.7 14.6 14.5 14.4 14.3 14.2 14.1 14.0 13.9 13.8 13.7 13.6 13.5 13.4
0.5 15.1 15.0 14.9 14.8 14.7 14.6 14.5 14.4 14.3 14.2 14.1 14.0 13.9 13.8 13.7 13.6 13.5 13.4 13.3 13.2
1.0 14.8 14.7 14.7 14.6 14.5 14.4 14.3 14.2 14.1 14.0 13.9 13.8 13.7 13.6 13.5 13.4 13.3 13.2 13.2 13.1
1.5 14.6 14.5 14.5 14.4 14.3 14.2 14.1 14.0 13.9 13.8 13.7 13.6 13.5 13.4 13.3 13.2 13.2 13.1 13.0 12.9
2.0 14.4 14.3 14.3 14.2 14.1 14.0 13.9 13.8 13.7 13.6 13.5 13.4 13.3 13.3 13.2 13.1 13.0 12.9 12.8 12.7
2.5 14.2 14.2 14.1 14.0 13.9 13.8 13.7 13.6 13.5 13.4 13.3 13.3 13.2 13.1 13.0 12.9 12.8 12.7 12.6 12.5
3.0 14.1 14.0 13.9 13.8 13.7 13.6 13.5 13.4 13.3 13.3 13.2 13.1 13.0 12.9 12.8 12.7 12.6 12.5 12.5 12.4
3.5 13.9 13.8 13.7 13.6 13.5 13.4 13.3 13.3 13.2 13.1 13.0 12.9 12.8 12.7 12.6 12.6 12.5 12.4 12.3 12.2
4.0 13.7 13.6 13.5 13.4 13.3 13.3 13.2 13.1 13.0 12.9 12.8 12.7 12.6 12.6 12.5 12.4 12.3 12.2 12.1 12.0
4.5 13.5 13.4 13.3 13.3 13.2 13.1 13.0 12.9 12.8 12.7 12.7 12.6 12.5 12.4 12.3 12.2 12.1 12.1 12.0 11.9
5.0 13.3 13.3 13.2 13.1 13.0 12.9 12.8 12.7 12.7 12.6 12.5 12.4 12.3 12.2 12.2 12.1 12.0 11.9 11.8 11.7
5.5 13.2 13.1 13.0 12.9 12.8 12.7 12.7 12.6 12.5 12.4 12.3 12.2 12.2 12.1 12.0 11.9 11.8 11.7 11.7 11.6
6.0 13.0 12.9 12.8 12.8 12.7 12.6 12.5 12.4 12.3 12.3 12.2 12.1 12.0 11.9 11.8 11.8 11.7 11.6 11.5 11.4
6.5 12.8 12.8 12.7 12.6 12.5 12.4 12.3 12.3 12.2 12.1 12.0 11.9 11.9 11.8 11.7 11.6 11.5 11.5 11.4 11.3
7.0 12.7 12.6 12.5 12.4 12.4 12.3 12.2 12.1 12.0 12.0 11.9 11.8 11.7 11.6 11.6 11.5 11.4 11.3 11.2 11.1
7.5 12.5 12.4 12.4 12.3 12.2 12.1 12.0 12.0 11.9 11.8 11.7 11.6 11.6 11.5 11.4 11.3 11.3 11.2 11.1 11.0
8.0 12.4 12.3 12.2 12.1 12.1 12.0 11.9 11.8 11.7 11.7 11.6 11.5 11.4 11.3 11.3 11.2 11.1 11.0 11.0 10.9
8.5 12.2 12.1 12.1 12.0 11.9 11.8 11.8 11.7 11.6 11.5 11.4 11.4 11.3 11.2 11.1 11.1 11.0 10.9 10.8 10.7
9.0 12.1 12.0 11.9 11.8 11.8 11.7 11.6 11.5 11.5 11.4 11.3 11.2 11.2 11.1 11.0 10.9 10.8 10.8 10.7 10.6
9.5 11.9 11.9 11.8 11.7 11.6 11.6 11.5 11.4 11.3 11.2 11.2 11.1 11.0 10.9 10.9 10.8 10.7 10.6 10.6 10.5
10.0 11.8 11.7 11.6 11.6 11.5 11.4 11.3 11.3 11.2 11.1 11.0 11.0 10.9 10.8 10.7 10.7 10.6 10.5 10.4 10.4
10.5 11.7 11.6 11.5 11.4 11.4 11.3 11.2 11.1 11.1 11.0 10.9 10.8 10.8 10.7 10.6 10.5 10.5 10.4 10.3 10.2
11.0 11.5 11.4 11.4 11.3 11.2 11.2 11.1 11.0 10.9 10.9 10.8 10.7 10.6 10.6 10.5 10.4 10.3 10.3 10.2 10.1
11.5 11.4 11.3 11.2 11.2 11.1 11.0 11.0 10.9 10.8 10.7 10.7 10.6 10.5 10.4 10.4 10.3 10.2 10.2 10.1 10.0
12.0 11.3 11.2 11.1 11.0 11.0 10.9 10.8 10.8 10.7 10.6 10.5 10.5 10.4 10.3 10.3 10.2 10.1 10.0 10.0 9.9
12.5 11.1 11.1 11.0 10.9 10.8 10.8 10.7 10.6 10.6 10.5 10.4 10.4 10.3 10.2 10.1 10.1 10.0 9.9 9.9 9.8
13.0 11.0 10.9 10.9 10.8 10.7 10.7 10.6 10.5 10.4 10.4 10.3 10.2 10.2 10.1 10.0 10.0 9.9 9.8 9.7 9.7
13.5 10.9 10.8 10.7 10.7 10.6 10.5 10.5 10.4 10.3 10.3 10.2 10.1 10.1 10.0 9.9 9.8 9.8 9.7 9.6 9.6
14.0 10.8 10.7 10.6 10.6 10.5 10.4 10.4 10.3 10.2 10.1 10.1 10.0 9.9 9.9 9.8 9.7 9.7 9.6 9.5 9.5
14.5 10.6 10.6 10.5 10.4 10.4 10.3 10.2 10.2 10.1 10.0 10.0 9.9 9.8 9.8 9.7 9.6 9.6 9.5 9.4 9.4
Dissolved Oxygen, Version 2.1 (6/2006) U.S. Geological Survey TWRI Book 9
36—DO
Tabl
e 6.
2–6.
So
lubi
lity
of o
xyge
n in
wat
er a
t var
ious
tem
pera
ture
s an
d pr
essu
res—
Cont
inue
d________________________________________________________________________________________________________________________________
Temp
Atmospheric pressure, in millimeters of mercury
C 795 790 785 780 775 770 765 760 755 750 745 740 735 730 725 720 715 710 705 700
_________________________________________________________________________________________________________________________________
15.0 10.5 10.5 10.4 10.3 10.3 10.2 10.1 10.1 10.0 9.9 9.9 9.8 9.7 9.7 9.6 9.5 9.5 9.4 9.3 9.3
15.5 10.4 10.4 10.3 10.2 10.2 10.1 10.0 10.0 9.9 9.8 9.8 9.7 9.6 9.6 9.5 9.4 9.4 9.3 9.2 9.2
16.0 10.3 10.2 10.2 10.1 10.0 10.0 9.9 9.8 9.8 9.7 9.7 9.6 9.5 9.5 9.4 9.3 9.3 9.2 9.1 9.1
16.5 10.2 10.1 10.1 10.0 9.9 9.9 9.8 9.7 9.7 9.6 9.5 9.5 9.4 9.4 9.3 9.2 9.2 9.1 9.0 9.0
17.0 10.1 10.0 10.0 9.9 9.8 9.8 9.7 9.6 9.6 9.5 9.4 9.4 9.3 9.3 9.2 9.1 9.1 9.0 8.9 8.9
17.5 10.0 9.9 9.9 9.8 9.7 9.7 9.6 9.5 9.5 9.4 9.3 9.3 9.2 9.2 9.1 9.0 9.0 8.9 8.8 8.8
18.0 9.9 9.8 9.8 9.7 9.6 9.6 9.5 9.4 9.4 9.3 9.3 9.2 9.1 9.1 9.0 8.9 8.9 8.8 8.7 8.7
18.5 9.8 9.7 9.7 9.6 9.5 9.5 9.4 9.3 9.3 9.2 9.2 9.1 9.0 9.0 8.9 8.8 8.8 8.7 8.7 8.6
19.0 9.7 9.6 9.6 9.5 9.4 9.4 9.3 9.3 9.2 9.1 9.1 9.0 8.9 8.9 8.8 8.8 8.7 8.6 8.6 8.5
19.5 9.6 9.5 9.5 9.4 9.3 9.3 9.2 9.2 9.1 9.0 9.0 8.9 8.9 8.8 8.7 8.7 8.6 8.5 8.5 8.4
20.0 9.5 9.4 9.4 9.3 9.3 9.2 9.1 9.1 9.0 8.9 8.9 8.8 8.8 8.7 8.6 8.6 8.5 8.5 8.4 8.3
20.5 9.4 9.3 9.3 9.2 9.2 9.1 9.0 9.0 8.9 8.9 8.8 8.7 8.7 8.6 8.6 8.5 8.4 8.4 8.3 8.3
21.0 9.3 9.2 9.2 9.1 9.1 9.0 8.9 8.9 8.8 8.8 8.7 8.6 8.6 8.5 8.5 8.4 8.4 8.3 8.2 8.2
21.5 9.2 9.2 9.1 9.0 9.0 8.9 8.9 8.8 8.7 8.7 8.6 8.6 8.5 8.4 8.4 8.3 8.3 8.2 8.1 8.1
22.0 9.1 9.1 9.0 9.0 8.9 8.8 8.8 8.7 8.7 8.6 8.5 8.5 8.4 8.4 8.3 8.2 8.2 8.1 8.1 8.0
22.5 9.0 9.0 8.9 8.9 8.8 8.8 8.7 8.6 8.6 8.5 8.5 8.4 8.3 8.3 8.2 8.2 8.1 8.0 8.0 7.9
23.0 9.0 8.9 8.8 8.8 8.7 8.7 8.6 8.6 8.5 8.4 8.4 8.3 8.3 8.2 8.1 8.1 8.0 8.0 7.9 7.9
23.5 8.9 8.8 8.8 8.7 8.6 8.6 8.5 8.5 8.4 8.4 8.3 8.2 8.2 8.1 8.1 8.0 8.0 7.9 7.8 7.8
24.0 8.8 8.7 8.7 8.6 8.6 8.5 8.4 8.4 8.3 8.3 8.2 8.2 8.1 8.0 8.0 7.9 7.9 7.8 7.8 7.7
24.5 8.7 8.7 8.6 8.5 8.5 8.4 8.4 8.3 8.3 8.2 8.1 8.1 8.0 8.0 7.9 7.9 7.8 7.7 7.7 7.6
25.0 8.6 8.6 8.5 8.5 8.4 8.3 8.3 8.2 8.2 8.1 8.1 8.0 8.0 7.9 7.8 7.8 7.7 7.7 7.6 7.6
25.5 8.5 8.5 8.4 8.4 8.3 8.3 8.2 8.2 8.1 8.0 8.0 7.9 7.9 7.8 7.8 7.7 7.7 7.6 7.6 7.5
26.0 8.5 8.4 8.4 8.3 8.3 8.2 8.1 8.1 8.0 8.0 7.9 7.9 7.8 7.8 7.7 7.6 7.6 7.5 7.5 7.4
26.5 8.4 8.3 8.3 8.2 8.2 8.1 8.1 8.0 8.0 7.9 7.8 7.8 7.7 7.7 7.6 7.6 7.5 7.5 7.4 7.4
27.0 8.3 8.3 8.2 8.2 8.1 8.0 8.0 7.9 7.9 7.8 7.8 7.7 7.7 7.6 7.6 7.5 7.5 7.4 7.3 7.3
27.5 8.2 8.2 8.1 8.1 8.0 8.0 7.9 7.9 7.8 7.8 7.7 7.7 7.6 7.5 7.5 7.4 7.4 7.3 7.3 7.2
28.0 8.2 8.1 8.1 8.0 8.0 7.9 7.9 7.8 7.7 7.7 7.6 7.6 7.5 7.5 7.4 7.4 7.3 7.3 7.2 7.2
28.5 8.1 8.0 8.0 7.9 7.9 7.8 7.8 7.7 7.7 7.6 7.6 7.5 7.5 7.4 7.4 7.3 7.3 7.2 7.1 7.1
29.0 8.0 8.0 7.9 7.9 7.8 7.8 7.7 7.7 7.6 7.6 7.5 7.5 7.4 7.3 7.3 7.2 7.2 7.1 7.1 7.0
29.5 8.0 7.9 7.9 7.8 7.8 7.7 7.6 7.6 7.5 7.5 7.4 7.4 7.3 7.3 7.2 7.2 7.1 7.1 7.0 7.0
Chapter A6. Field Measurements Dissolved Oxygen, Version 2.1 (6/2006)
DO—37
Tabl
e 6.
2–6.
So
lubi
lity
of o
xyge
n in
wat
er a
t var
ious
tem
pera
ture
s an
d pr
essu
res—
Cont
inue
d___________________________________________________________________________________________________________________________________
Temp
Atmospheric pressure, in millimeters of mercury
C 795 790 785 780 775 770 765 760 755 750 745 740 735 730 725 720 715 710 705 700
___________________________________________________________________________________________________________________________________
30.0 7.9 7.8 7.8 7.7 7.7 7.6 7.6 7.5 7.5 7.4 7.4 7.3 7.3 7.2 7.2 7.1 7.1 7.0 7.0 6.9
30.5 7.8 7.8 7.7 7.7 7.6 7.6 7.5 7.5 7.4 7.4 7.3 7.3 7.2 7.2 7.1 7.1 7.0 7.0 6.9 6.9
31.0 7.8 7.7 7.7 7.6 7.6 7.5 7.5 7.4 7.4 7.3 7.3 7.2 7.1 7.1 7.0 7.0 6.9 6.9 6.8 6.8
31.5 7.7 7.6 7.6 7.5 7.5 7.4 7.4 7.3 7.3 7.2 7.2 7.1 7.1 7.0 7.0 6.9 6.9 6.8 6.8 6.7
32.0 7.6 7.6 7.5 7.5 7.4 7.4 7.3 7.3 7.2 7.2 7.1 7.1 7.0 7.0 6.9 6.9 6.8 6.8 6.7 6.7
32.5 7.6 7.5 7.5 7.4 7.4 7.3 7.3 7.2 7.2 7.1 7.1 7.0 7.0 6.9 6.9 6.8 6.8 6.7 6.7 6.6
33.0 7.5 7.5 7.4 7.4 7.3 7.3 7.2 7.2 7.1 7.1 7.0 7.0 6.9 6.9 6.8 6.8 6.7 6.7 6.6 6.6
33.5 7.4 7.4 7.3 7.3 7.2 7.2 7.1 7.1 7.1 7.0 7.0 6.9 6.9 6.8 6.8 6.7 6.7 6.6 6.6 6.5
34.0 7.4 7.3 7.3 7.2 7.2 7.1 7.1 7.0 7.0 6.9 6.9 6.8 6.8 6.7 6.7 6.7 6.6 6.6 6.5 6.5
34.5 7.3 7.3 7.2 7.2 7.1 7.1 7.0 7.0 6.9 6.9 6.8 6.8 6.7 6.7 6.6 6.6 6.5 6.5 6.5 6.4
35.0 7.3 7.2 7.2 7.1 7.1 7.0 7.0 6.9 6.9 6.8 6.8 6.7 6.7 6.6 6.6 6.5 6.5 6.4 6.4 6.3
35.5 7.2 7.2 7.1 7.1 7.0 7.0 6.9 6.9 6.8 6.8 6.7 6.7 6.6 6.6 6.5 6.5 6.4 6.4 6.3 6.3
36.0 7.2 7.1 7.1 7.0 7.0 6.9 6.9 6.8 6.8 6.7 6.7 6.6 6.6 6.5 6.5 6.4 6.4 6.3 6.3 6.2
36.5 7.1 7.0 7.0 7.0 6.9 6.9 6.8 6.8 6.7 6.7 6.6 6.6 6.5 6.5 6.4 6.4 6.3 6.3 6.2 6.2
37.0 7.0 7.0 6.9 6.9 6.9 6.8 6.8 6.7 6.7 6.6 6.6 6.5 6.5 6.4 6.4 6.3 6.3 6.2 6.2 6.1
37.5 7.0 6.9 6.9 6.8 6.8 6.8 6.7 6.7 6.6 6.6 6.5 6.5 6.4 6.4 6.3 6.3 6.2 6.2 6.1 6.1
38.0 6.9 6.9 6.8 6.8 6.7 6.7 6.7 6.6 6.6 6.5 6.5 6.4 6.4 6.3 6.3 6.2 6.2 6.1 6.1 6.0
38.5 6.9 6.8 6.8 6.7 6.7 6.6 6.6 6.6 6.5 6.5 6.4 6.4 6.3 6.3 6.2 6.2 6.1 6.1 6.0 6.0
39.0 6.8 6.8 6.7 6.7 6.6 6.6 6.5 6.5 6.5 6.4 6.4 6.3 6.3 6.2 6.2 6.1 6.1 6.0 6.0 6.0
39.5 6.8 6.7 6.7 6.6 6.6 6.5 6.5 6.5 6.4 6.4 6.3 6.3 6.2 6.2 6.1 6.1 6.0 6.0 6.0 5.9
40.0 6.7 6.7 6.6 6.6 6.5 6.5 6.4 6.4 6.4 6.3 6.3 6.2 6.2 6.1 6.1 6.0 6.0 5.9 5.9 5.9
Dissolved Oxygen, Version 2.1 (6/2006) U.S. Geological Survey TWRI Book 9
38—DO
Tabl
e 6.
2–6.
S
olub
ility
of o
xyge
n in
wat
er a
t var
ious
tem
pera
ture
s an
d pr
essu
res—
Cont
inue
d_____________________________________________________________________________________________________________________________________
Temp
Atmospheric pressure, in millimeters of mercury
C 695 690 685 680 675 670 665 660 655 650 645 640 635 630 625 620 615 610 605 600
_____________________________________________________________________________________________________________________________________
0.0 13.3 13.2 13.1 13.0 12.9 12.8 12.8 12.7 12.6 12.5 12.4 12.3 12.2 12.1 12.0 11.9 11.8 11.7 11.6 11.5
0.5 13.1 13.1 13.0 12.9 12.8 12.7 12.6 12.5 12.4 12.3 12.2 12.1 12.0 11.9 11.8 11.7 11.6 11.5 11.4 11.3
1.0 13.0 12.9 12.8 12.7 12.6 12.5 12.4 12.3 12.2 12.1 12.0 11.9 11.8 11.7 11.6 11.6 11.5 11.4 11.3 11.2
1.5 12.8 12.7 12.6 12.5 12.4 12.3 12.2 12.1 12.0 12.0 11.9 11.8 11.7 11.6 11.5 11.4 11.3 11.2 11.1 11.0
2.0 12.6 12.5 12.4 12.3 12.2 12.2 12.1 12.0 11.9 11.8 11.7 11.6 11.5 11.4 11.3 11.2 11.1 11.1 11.0 10.9
2.5 12.4 12.4 12.3 12.2 12.1 12.0 11.9 11.8 11.7 11.6 11.5 11.4 11.4 11.3 11.2 11.1 11.0 10.9 10.8 10.7
3.0 12.3 12.2 12.1 12.0 11.9 11.8 11.7 11.7 11.6 11.5 11.4 11.3 11.2 11.1 11.0 10.9 10.9 10.8 10.7 10.6
3.5 12.1 12.0 11.9 11.8 11.8 11.7 11.6 11.5 11.4 11.3 11.2 11.1 11.1 11.0 10.9 10.8 10.7 10.6 10.5 10.4
4.0 12.0 11.9 11.8 11.7 11.6 11.5 11.4 11.3 11.3 11.2 11.1 11.0 10.9 10.8 10.7 10.7 10.6 10.5 10.4 10.3
4.5 11.8 11.7 11.6 11.5 11.5 11.4 11.3 11.2 11.1 11.0 10.9 10.9 10.8 10.7 10.6 10.5 10.4 10.3 10.3 10.2
5.0 11.6 11.6 11.5 11.4 11.3 11.2 11.1 11.1 11.0 10.9 10.8 10.7 10.6 10.5 10.5 10.4 10.3 10.2 10.1 10.0
5.5 11.5 11.4 11.3 11.2 11.2 11.1 11.0 10.9 10.8 10.7 10.7 10.6 10.5 10.4 10.3 10.2 10.2 10.1 10.0 9.9
6.0 11.4 11.3 11.2 11.1 11.0 10.9 10.9 10.8 10.7 10.6 10.5 10.4 10.4 10.3 10.2 10.1 10.0 9.9 9.9 9.8
6.5 11.2 11.1 11.0 11.0 10.9 10.8 10.7 10.6 10.6 10.5 10.4 10.3 10.2 10.1 10.1 10.0 9.9 9.8 9.7 9.7
7.0 11.1 11.0 10.9 10.8 10.7 10.7 10.6 10.5 10.4 10.3 10.3 10.2 10.1 10.0 9.9 9.9 9.8 9.7 9.6 9.5
7.5 10.9 10.9 10.8 10.7 10.6 10.5 10.5 10.4 10.3 10.2 10.1 10.1 10.0 9.9 9.8 9.7 9.7 9.6 9.5 9.4
8.0 10.8 10.7 10.6 10.6 10.5 10.4 10.3 10.2 10.2 10.1 10.0 9.9 9.9 9.8 9.7 9.6 9.5 9.5 9.4 9.3
8.5 10.7 10.6 10.5 10.4 10.4 10.3 10.2 10.1 10.0 10.0 9.9 9.8 9.7 9.7 9.6 9.5 9.4 9.3 9.3 9.2
9.0 10.5 10.5 10.4 10.3 10.2 10.2 10.1 10.0 9.9 9.8 9.8 9.7 9.6 9.5 9.5 9.4 9.3 9.2 9.2 9.1
9.5 10.4 10.3 10.3 10.2 10.1 10.0 10.0 9.9 9.8 9.7 9.7 9.6 9.5 9.4 9.4 9.3 9.2 9.1 9.0 9.0
10.0 10.3 10.2 10.1 10.1 10.0 9.9 9.8 9.8 9.7 9.6 9.5 9.5 9.4 9.3 9.2 9.2 9.1 9.0 8.9 8.9
10.5 10.2 10.1 10.0 9.9 9.9 9.8 9.7 9.7 9.6 9.5 9.4 9.4 9.3 9.2 9.1 9.1 9.0 8.9 8.8 8.8
11.0 10.1 10.0 9.9 9.8 9.8 9.7 9.6 9.5 9.5 9.4 9.3 9.2 9.2 9.1 9.0 9.0 8.9 8.8 8.7 8.7
11.5 9.9 9.9 9.8 9.7 9.6 9.6 9.5 9.4 9.4 9.3 9.2 9.1 9.1 9.0 8.9 8.8 8.8 8.7 8.6 8.6
12.0 9.8 9.8 9.7 9.6 9.5 9.5 9.4 9.3 9.2 9.2 9.1 9.0 9.0 8.9 8.8 8.7 8.7 8.6 8.5 8.5
12.5 9.7 9.6 9.6 9.5 9.4 9.4 9.3 9.2 9.1 9.1 9.0 8.9 8.9 8.8 8.7 8.6 8.6 8.5 8.4 8.4
13.0 9.6 9.5 9.5 9.4 9.3 9.3 9.2 9.1 9.0 9.0 8.9 8.8 8.8 8.7 8.6 8.5 8.5 8.4 8.3 8.3
13.5 9.5 9.4 9.4 9.3 9.2 9.1 9.1 9.0 8.9 8.9 8.8 8.7 8.7 8.6 8.5 8.5 8.4 8.3 8.2 8.2
14.0 9.4 9.3 9.3 9.2 9.1 9.0 9.0 8.9 8.8 8.8 8.7 8.6 8.6 8.5 8.4 8.4 8.3 8.2 8.2 8.1
14.5 9.3 9.2 9.2 9.1 9.0 8.9 8.9 8.8 8.7 8.7 8.6 8.5 8.5 8.4 8.3 8.3 8.2 8.1 8.1 8.0
Chapter A6. Field Measurements Dissolved Oxygen, Version 2.1 (6/2006)
DO—39
Tabl
e 6.
2–6.
So
lubi
lity
of o
xyge
n in
wat
er a
t var
ious
tem
pera
ture
s an
d pr
essu
res—
Cont
inue
d___________________________________________________________________________________________________________________________________
Temp
Atmospheric pressure, in millimeters of mercury
C 695 690 685 680 675 670 665 660 655 650 645 640 635 630 625 620 615 610 605 600
___________________________________________________________________________________________________________________________________
15.0 9.2 9.1 9.1 9.0 8.9 8.8 8.8 8.7 8.6 8.6 8.5 8.4 8.4 8.3 8.2 8.2 8.1 8.0 8.0 7.9
15.5 9.1 9.0 9.0 8.9 8.8 8.8 8.7 8.6 8.6 8.5 8.4 8.4 8.3 8.2 8.2 8.1 8.0 8.0 7.9 7.8
16.0 9.0 8.9 8.9 8.8 8.7 8.7 8.6 8.5 8.5 8.4 8.3 8.3 8.2 8.1 8.1 8.0 7.9 7.9 7.8 7.7
16.5 8.9 8.8 8.8 8.7 8.6 8.6 8.5 8.4 8.4 8.3 8.2 8.2 8.1 8.0 8.0 7.9 7.8 7.8 7.7 7.7
17.0 8.8 8.7 8.7 8.6 8.5 8.5 8.4 8.3 8.3 8.2 8.2 8.1 8.0 8.0 7.9 7.8 7.8 7.7 7.6 7.6
17.5 8.7 8.6 8.6 8.5 8.5 8.4 8.3 8.3 8.2 8.1 8.1 8.0 7.9 7.9 7.8 7.7 7.7 7.6 7.6 7.5
18.0 8.6 8.6 8.5 8.4 8.4 8.3 8.2 8.2 8.1 8.0 8.0 7.9 7.9 7.8 7.7 7.7 7.6 7.5 7.5 7.4
18.5 8.5 8.5 8.4 8.3 8.3 8.2 8.2 8.1 8.0 8.0 7.9 7.8 7.8 7.7 7.7 7.6 7.5 7.5 7.4 7.3
19.0 8.4 8.4 8.3 8.3 8.2 8.1 8.1 8.0 7.9 7.9 7.8 7.8 7.7 7.6 7.6 7.5 7.4 7.4 7.3 7.3
19.5 8.4 8.3 8.2 8.2 8.1 8.0 8.0 7.9 7.9 7.8 7.7 7.7 7.6 7.6 7.5 7.4 7.4 7.3 7.2 7.2
20.0 8.3 8.2 8.2 8.1 8.0 8.0 7.9 7.8 7.8 7.7 7.7 7.6 7.5 7.5 7.4 7.4 7.3 7.2 7.2 7.1
20.5 8.2 8.1 8.1 8.0 7.9 7.9 7.8 7.8 7.7 7.6 7.6 7.5 7.5 7.4 7.3 7.3 7.2 7.2 7.1 7.0
21.0 8.1 8.1 8.0 7.9 7.9 7.8 7.8 7.7 7.6 7.6 7.5 7.5 7.4 7.3 7.3 7.2 7.2 7.1 7.0 7.0
21.5 8.0 8.0 7.9 7.9 7.8 7.7 7.7 7.6 7.6 7.5 7.4 7.4 7.3 7.3 7.2 7.1 7.1 7.0 7.0 6.9
22.0 8.0 7.9 7.8 7.8 7.7 7.7 7.6 7.5 7.5 7.4 7.4 7.3 7.2 7.2 7.1 7.1 7.0 7.0 6.9 6.8
22.5 7.9 7.8 7.8 7.7 7.6 7.6 7.5 7.5 7.4 7.3 7.3 7.2 7.2 7.1 7.1 7.0 6.9 6.9 6.8 6.8
23.0 7.8 7.7 7.7 7.6 7.6 7.5 7.5 7.4 7.3 7.3 7.2 7.2 7.1 7.0 7.0 6.9 6.9 6.8 6.8 6.7
23.5 7.7 7.7 7.6 7.6 7.5 7.4 7.4 7.3 7.3 7.2 7.2 7.1 7.0 7.0 6.9 6.9 6.8 6.7 6.7 6.6
24.0 7.7 7.6 7.5 7.5 7.4 7.4 7.3 7.3 7.2 7.1 7.1 7.0 7.0 6.9 6.9 6.8 6.7 6.7 6.6 6.6
24.5 7.6 7.5 7.5 7.4 7.4 7.3 7.2 7.2 7.1 7.1 7.0 7.0 6.9 6.8 6.8 6.7 6.7 6.6 6.6 6.5
25.0 7.5 7.5 7.4 7.3 7.3 7.2 7.2 7.1 7.1 7.0 6.9 6.9 6.8 6.8 6.7 6.7 6.6 6.6 6.5 6.4
25.5 7.4 7.4 7.3 7.3 7.2 7.2 7.1 7.1 7.0 6.9 6.9 6.8 6.8 6.7 6.7 6.6 6.6 6.5 6.4 6.4
26.0 7.4 7.3 7.3 7.2 7.2 7.1 7.0 7.0 6.9 6.9 6.8 6.8 6.7 6.7 6.6 6.5 6.5 6.4 6.4 6.3
26.5 7.3 7.2 7.2 7.1 7.1 7.0 7.0 6.9 6.9 6.8 6.8 6.7 6.6 6.6 6.5 6.5 6.4 6.4 6.3 6.3
27.0 7.2 7.2 7.1 7.1 7.0 7.0 6.9 6.9 6.8 6.7 6.7 6.6 6.6 6.5 6.5 6.4 6.4 6.3 6.3 6.2
27.5 7.2 7.1 7.1 7.0 7.0 6.9 6.8 6.8 6.7 6.7 6.6 6.6 6.5 6.5 6.4 6.4 6.3 6.3 6.2 6.2
28.0 7.1 7.1 7.0 6.9 6.9 6.8 6.8 6.7 6.7 6.6 6.6 6.5 6.5 6.4 6.4 6.3 6.3 6.2 6.1 6.1
28.5 7.0 7.0 6.9 6.9 6.8 6.8 6.7 6.7 6.6 6.6 6.5 6.5 6.4 6.4 6.3 6.2 6.2 6.1 6.1 6.0
29.0 7.0 6.9 6.9 6.8 6.8 6.7 6.7 6.6 6.6 6.5 6.5 6.4 6.4 6.3 6.2 6.2 6.1 6.1 6.0 6.0
29.5 6.9 6.9 6.8 6.8 6.7 6.7 6.6 6.6 6.5 6.5 6.4 6.3 6.3 6.2 6.2 6.1 6.1 6.0 6.0 5.9
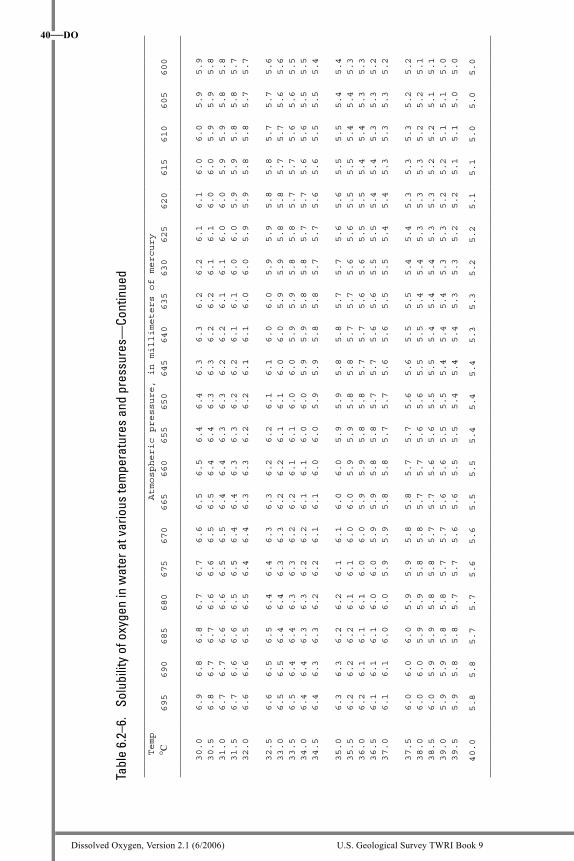
Dissolved Oxygen, Version 2.1 (6/2006) U.S. Geological Survey TWRI Book 9
40—DO
Tabl
e 6.
2–6.
So
lubi
lity
of o
xyge
n in
wat
er a
t var
ious
tem
pera
ture
s an
d pr
essu
res—
Cont
inue
d_____________________________________________________________________________________________________________________________________
Temp
Atmospheric pressure, in millimeters of mercury
C 695 690 685 680 675 670 665 660 655 650 645 640 635 630 625 620 615 610 605 600
_____________________________________________________________________________________________________________________________________
_____________________________________________________________________________________________________________________________________
30.0 6.9 6.8 6.8 6.7 6.7 6.6 6.5 6.5 6.4 6.4 6.3 6.3 6.2 6.2 6.1 6.1 6.0 6.0 5.9 5.9
30.5 6.8 6.7 6.7 6.6 6.6 6.5 6.5 6.4 6.4 6.3 6.3 6.2 6.2 6.1 6.1 6.0 6.0 5.9 5.9 5.8
31.0 6.7 6.7 6.6 6.6 6.5 6.5 6.4 6.4 6.3 6.3 6.2 6.2 6.1 6.1 6.0 6.0 5.9 5.9 5.8 5.8
31.5 6.7 6.6 6.6 6.5 6.5 6.4 6.4 6.3 6.3 6.2 6.2 6.1 6.1 6.0 6.0 5.9 5.9 5.8 5.8 5.7
32.0 6.6 6.6 6.5 6.5 6.4 6.4 6.3 6.3 6.2 6.2 6.1 6.1 6.0 6.0 5.9 5.9 5.8 5.8 5.7 5.7
32.5 6.6 6.5 6.5 6.4 6.4 6.3 6.3 6.2 6.2 6.1 6.1 6.0 6.0 5.9 5.9 5.8 5.8 5.7 5.7 5.6
33.0 6.5 6.5 6.4 6.4 6.3 6.3 6.2 6.2 6.1 6.1 6.0 6.0 5.9 5.9 5.8 5.8 5.7 5.7 5.6 5.6
33.5 6.5 6.4 6.4 6.3 6.3 6.2 6.2 6.1 6.1 6.0 6.0 5.9 5.9 5.8 5.8 5.7 5.7 5.6 5.6 5.5
34.0 6.4 6.4 6.3 6.3 6.2 6.2 6.1 6.1 6.0 6.0 5.9 5.9 5.8 5.8 5.7 5.7 5.6 5.6 5.5 5.5
34.5 6.4 6.3 6.3 6.2 6.2 6.1 6.1 6.0 6.0 5.9 5.9 5.8 5.8 5.7 5.7 5.6 5.6 5.5 5.5 5.4
35.0 6.3 6.3 6.2 6.2 6.1 6.1 6.0 6.0 5.9 5.9 5.8 5.8 5.7 5.7 5.6 5.6 5.5 5.5 5.4 5.4
35.5 6.2 6.2 6.2 6.1 6.1 6.0 6.0 5.9 5.9 5.8 5.8 5.7 5.7 5.6 5.6 5.5 5.5 5.4 5.4 5.3
36.0 6.2 6.1 6.1 6.1 6.0 6.0 5.9 5.9 5.8 5.8 5.7 5.7 5.6 5.6 5.5 5.5 5.4 5.4 5.3 5.3
36.5 6.1 6.1 6.1 6.0 6.0 5.9 5.9 5.8 5.8 5.7 5.7 5.6 5.6 5.5 5.5 5.4 5.4 5.3 5.3 5.2
37.0 6.1 6.1 6.0 6.0 5.9 5.9 5.8 5.8 5.7 5.7 5.6 5.6 5.5 5.5 5.4 5.4 5.3 5.3 5.3 5.2
37.5 6.0 6.0 6.0 5.9 5.9 5.8 5.8 5.7 5.7 5.6 5.6 5.5 5.5 5.4 5.4 5.3 5.3 5.3 5.2 5.2
38.0 6.0 6.0 5.9 5.9 5.8 5.8 5.7 5.7 5.6 5.6 5.5 5.5 5.4 5.4 5.3 5.3 5.3 5.2 5.2 5.1
38.5 6.0 5.9 5.9 5.8 5.8 5.7 5.7 5.6 5.6 5.5 5.5 5.4 5.4 5.4 5.3 5.3 5.2 5.2 5.1 5.1
39.0 5.9 5.9 5.8 5.8 5.7 5.7 5.6 5.6 5.5 5.5 5.4 5.4 5.4 5.3 5.3 5.2 5.2 5.1 5.1 5.0
39.5 5.9 5.8 5.8 5.7 5.7 5.6 5.6 5.5 5.5 5.4 5.4 5.4 5.3 5.3 5.2 5.2 5.1 5.1 5.0 5.0
40.0 5.8 5.8 5.7 5.7 5.6 5.6 5.5 5.5 5.4 5.4 5.4 5.3 5.3 5.2 5.2 5.1 5.1 5.0 5.0 5.0
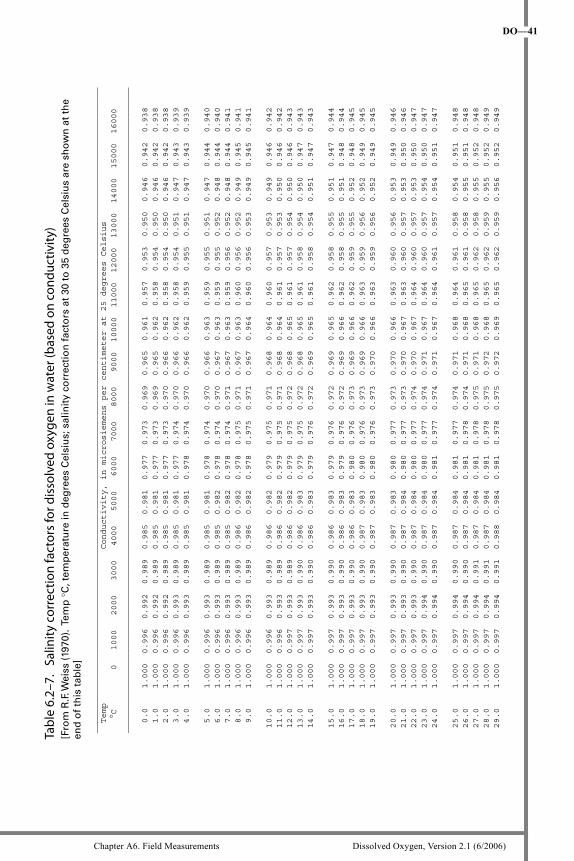
Chapter A6. Field Measurements Dissolved Oxygen, Version 2.1 (6/2006)
DO—41
Tabl
e 6.
2–7.
Sa
linity
cor
rect
ion
fact
ors
for d
isso
lved
oxy
gen
in w
ater
(bas
ed o
n co
nduc
tivity
) [F
rom
R.F
. Wei
ss (
1970
). T
emp
C
, tem
per
atu
re in
deg
rees
Cel
siu
s; s
alin
ity
corr
ecti
on
fac
tors
at
30 t
o 3
5 d
egre
es C
elsi
us
are
sho
wn
at
the
end
of
this
tab
le]
__________________________________________________________________________________________________________________________________
Temp Conductivity, in microsiemens per centimeter at 25 degrees Celsius
C 0 1000 2000 3000 4000 5000 6000 7000 8000 9000 10000 11000 12000 13000 14000 15000 16000
__________________________________________________________________________________________________________________________________
0.0 1.000 0.996 0.992 0.989 0.985 0.981 0.977 0.973 0.969 0.965 0.961 0.957 0.953 0.950 0.946 0.942 0.938
1.0 1.000 0.996 0.992 0.989 0.985 0.981 0.977 0.973 0.969 0.965 0.962 0.958 0.954 0.950 0.946 0.942 0.938
2.0 1.000 0.996 0.992 0.989 0.985 0.981 0.977 0.973 0.970 0.966 0.962 0.958 0.954 0.950 0.946 0.942 0.938
3.0 1.000 0.996 0.993 0.989 0.985 0.981 0.977 0.974 0.970 0.966 0.962 0.958 0.954 0.951 0.947 0.943 0.939
4.0 1.000 0.996 0.993 0.989 0.985 0.981 0.978 0.974 0.970 0.966 0.962 0.959 0.955 0.951 0.947 0.943 0.939
5.0 1.000 0.996 0.993 0.989 0.985 0.981 0.978 0.974 0.970 0.966 0.963 0.959 0.955 0.951 0.947 0.944 0.940
6.0 1.000 0.996 0.993 0.989 0.985 0.982 0.978 0.974 0.970 0.967 0.963 0.959 0.955 0.952 0.948 0.944 0.940
7.0 1.000 0.996 0.993 0.989 0.985 0.982 0.978 0.974 0.971 0.967 0.963 0.959 0.956 0.952 0.948 0.944 0.941
8.0 1.000 0.996 0.993 0.989 0.986 0.982 0.978 0.975 0.971 0.967 0.963 0.960 0.956 0.952 0.949 0.945 0.941
9.0 1.000 0.996 0.993 0.989 0.986 0.982 0.978 0.975 0.971 0.967 0.964 0.960 0.956 0.953 0.949 0.945 0.941
10.0 1.000 0.996 0.993 0.989 0.986 0.982 0.979 0.975 0.971 0.968 0.964 0.960 0.957 0.953 0.949 0.946 0.942
11.0 1.000 0.996 0.993 0.989 0.986 0.982 0.979 0.975 0.971 0.968 0.964 0.961 0.957 0.953 0.950 0.946 0.942
12.0 1.000 0.997 0.993 0.989 0.986 0.982 0.979 0.975 0.972 0.968 0.965 0.961 0.957 0.954 0.950 0.946 0.943
13.0 1.000 0.997 0.993 0.990 0.986 0.983 0.979 0.975 0.972 0.968 0.965 0.961 0.958 0.954 0.950 0.947 0.943
14.0 1.000 0.997 0.993 0.990 0.986 0.983 0.979 0.976 0.972 0.969 0.965 0.961 0.958 0.954 0.951 0.947 0.943
15.0 1.000 0.997 0.993 0.990 0.986 0.983 0.979 0.976 0.972 0.969 0.965 0.962 0.958 0.955 0.951 0.947 0.944
16.0 1.000 0.997 0.993 0.990 0.986 0.983 0.979 0.976 0.972 0.969 0.966 0.962 0.958 0.955 0.951 0.948 0.944
17.0 1.000 0.997 0.993 0.990 0.986 0.983 0.980 0.976 0.973 0.969 0.966 0.962 0.959 0.955 0.952 0.948 0.945
18.0 1.000 0.997 0.993 0.990 0.987 0.983 0.980 0.976 0.973 0.969 0.966 0.963 0.959 0.956 0.952 0.949 0.945
19.0 1.000 0.997 0.993 0.990 0.987 0.983 0.980 0.976 0.973 0.970 0.966 0.963 0.959 0.956 0.952 0.949 0.945
20.0 1.000 0.997 0.993 0.990 0.987 0.983 0.980 0.977 0.973 0.970 0.966 0.963 0.960 0.956 0.953 0.949 0.946
21.0 1.000 0.997 0.993 0.990 0.987 0.984 0.980 0.977 0.973 0.970 0.967 0.963 0.960 0.957 0.953 0.950 0.946
22.0 1.000 0.997 0.993 0.990 0.987 0.984 0.980 0.977 0.974 0.970 0.967 0.964 0.960 0.957 0.953 0.950 0.947
23.0 1.000 0.997 0.994 0.990 0.987 0.984 0.980 0.977 0.974 0.971 0.967 0.964 0.960 0.957 0.954 0.950 0.947
24.0 1.000 0.997 0.994 0.990 0.987 0.984 0.981 0.977 0.974 0.971 0.967 0.964 0.961 0.957 0.954 0.951 0.947
25.0 1.000 0.997 0.994 0.990 0.987 0.984 0.981 0.977 0.974 0.971 0.968 0.964 0.961 0.958 0.954 0.951 0.948
26.0 1.000 0.997 0.994 0.990 0.987 0.984 0.981 0.978 0.974 0.971 0.968 0.965 0.961 0.958 0.955 0.951 0.948
27.0 1.000 0.997 0.994 0.991 0.987 0.984 0.981 0.978 0.975 0.971 0.968 0.965 0.962 0.958 0.955 0.952 0.948
28.0 1.000 0.997 0.994 0.991 0.987 0.984 0.981 0.978 0.975 0.972 0.968 0.965 0.962 0.959 0.955 0.952 0.949
29.0 1.000 0.997 0.994 0.991 0.988 0.984 0.981 0.978 0.975 0.972 0.969 0.965 0.962 0.959 0.956 0.952 0.949
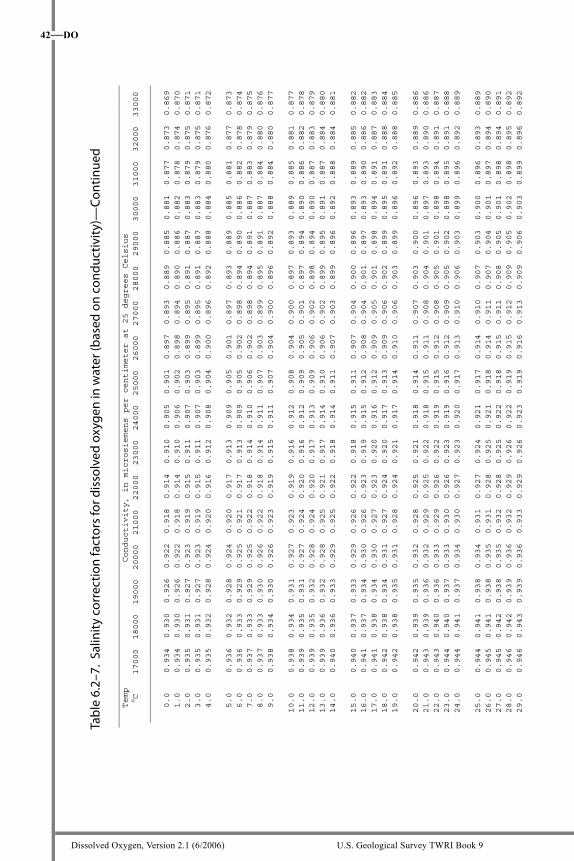
Dissolved Oxygen, Version 2.1 (6/2006) U.S. Geological Survey TWRI Book 9
42—DO
Tabl
e 6.
2–7.
Sal
inity
cor
rect
ion
fact
ors
for d
isso
lved
oxy
gen
in w
ater
(bas
ed o
n co
nduc
tivity
)—Co
ntin
ued
_________________________________________________________________________________________________________________________________
Temp
Conductivity, in microsiemens per centimeter at 25 degrees Celsius
C 17000 18000 19000 20000 21000 22000 23000 24000 25000 26000 27000 28000 29000 30000 31000 32000 33000
________________________________________________________________________________________________________________________________
0.0 0.934 0.930 0.926 0.922 0.918 0.914 0.910 0.905 0.901 0.897 0.893 0.889 0.885 0.881 0.877 0.873 0.869
1.0 0.934 0.930 0.926 0.922 0.918 0.914 0.910 0.906 0.902 0.898 0.894 0.890 0.886 0.882 0.878 0.874 0.870
2.0 0.935 0.931 0.927 0.923 0.919 0.915 0.911 0.907 0.903 0.899 0.895 0.891 0.887 0.883 0.879 0.875 0.871
3.0 0.935 0.931 0.927 0.923 0.919 0.915 0.911 0.907 0.903 0.899 0.895 0.891 0.887 0.883 0.879 0.875 0.871
4.0 0.935 0.932 0.928 0.924 0.920 0.916 0.912 0.908 0.904 0.900 0.896 0.892 0.888 0.884 0.880 0.876 0.872
5.0 0.936 0.932 0.928 0.924 0.920 0.917 0.913 0.909 0.905 0.901 0.897 0.893 0.889 0.885 0.881 0.877 0.873
6.0 0.936 0.933 0.929 0.925 0.921 0.917 0.913 0.909 0.905 0.902 0.898 0.894 0.890 0.886 0.882 0.878 0.874
7.0 0.937 0.933 0.929 0.925 0.922 0.918 0.914 0.910 0.906 0.902 0.898 0.894 0.891 0.887 0.883 0.879 0.875
8.0 0.937 0.933 0.930 0.926 0.922 0.918 0.914 0.911 0.907 0.903 0.899 0.895 0.891 0.887 0.884 0.880 0.876
9.0 0.938 0.934 0.930 0.926 0.923 0.919 0.915 0.911 0.907 0.904 0.900 0.896 0.892 0.888 0.884 0.880 0.877
10.0 0.938 0.934 0.931 0.927 0.923 0.919 0.916 0.912 0.908 0.904 0.900 0.897 0.893 0.889 0.885 0.881 0.877
11.0 0.939 0.935 0.931 0.927 0.924 0.920 0.916 0.912 0.909 0.905 0.901 0.897 0.894 0.890 0.886 0.882 0.878
12.0 0.939 0.935 0.932 0.928 0.924 0.920 0.917 0.913 0.909 0.906 0.902 0.898 0.894 0.890 0.887 0.883 0.879
13.0 0.939 0.936 0.932 0.928 0.925 0.921 0.917 0.914 0.910 0.906 0.902 0.899 0.895 0.891 0.887 0.884 0.880
14.0 0.940 0.936 0.933 0.929 0.925 0.922 0.918 0.914 0.911 0.907 0.903 0.899 0.896 0.892 0.888 0.884 0.881
15.0 0.940 0.937 0.933 0.929 0.926 0.922 0.918 0.915 0.911 0.907 0.904 0.900 0.896 0.893 0.889 0.885 0.882
16.0 0.941 0.937 0.934 0.930 0.926 0.923 0.919 0.915 0.912 0.908 0.904 0.901 0.897 0.893 0.890 0.886 0.882
17.0 0.941 0.938 0.934 0.930 0.927 0.923 0.920 0.916 0.912 0.909 0.905 0.901 0.898 0.894 0.891 0.887 0.883
18.0 0.942 0.938 0.934 0.931 0.927 0.924 0.920 0.917 0.913 0.909 0.906 0.902 0.899 0.895 0.891 0.888 0.884
19.0 0.942 0.938 0.935 0.931 0.928 0.924 0.921 0.917 0.914 0.910 0.906 0.903 0.899 0.896 0.892 0.888 0.885
20.0 0.942 0.939 0.935 0.932 0.928 0.925 0.921 0.918 0.914 0.911 0.907 0.903 0.900 0.896 0.893 0.889 0.886
21.0 0.943 0.939 0.936 0.932 0.929 0.925 0.922 0.918 0.915 0.911 0.908 0.904 0.901 0.897 0.893 0.890 0.886
22.0 0.943 0.940 0.936 0.933 0.929 0.926 0.922 0.919 0.915 0.912 0.908 0.905 0.901 0.898 0.894 0.891 0.887
23.0 0.944 0.940 0.937 0.933 0.930 0.926 0.923 0.919 0.916 0.912 0.909 0.905 0.902 0.898 0.895 0.891 0.888
24.0 0.944 0.941 0.937 0.934 0.930 0.927 0.923 0.920 0.917 0.913 0.910 0.906 0.903 0.899 0.896 0.892 0.889
25.0 0.944 0.941 0.938 0.934 0.931 0.927 0.924 0.921 0.917 0.914 0.910 0.907 0.903 0.900 0.896 0.893 0.889
26.0 0.945 0.941 0.938 0.935 0.931 0.928 0.925 0.921 0.918 0.914 0.911 0.907 0.904 0.901 0.897 0.894 0.890
27.0 0.945 0.942 0.938 0.935 0.932 0.928 0.925 0.922 0.918 0.915 0.911 0.908 0.905 0.901 0.898 0.894 0.891
28.0 0.946 0.942 0.939 0.936 0.932 0.929 0.926 0.922 0.919 0.915 0.912 0.909 0.905 0.902 0.898 0.895 0.892
29.0 0.946 0.943 0.939 0.936 0.933 0.929 0.926 0.923 0.919 0.916 0.913 0.909 0.906 0.903 0.899 0.896 0.892
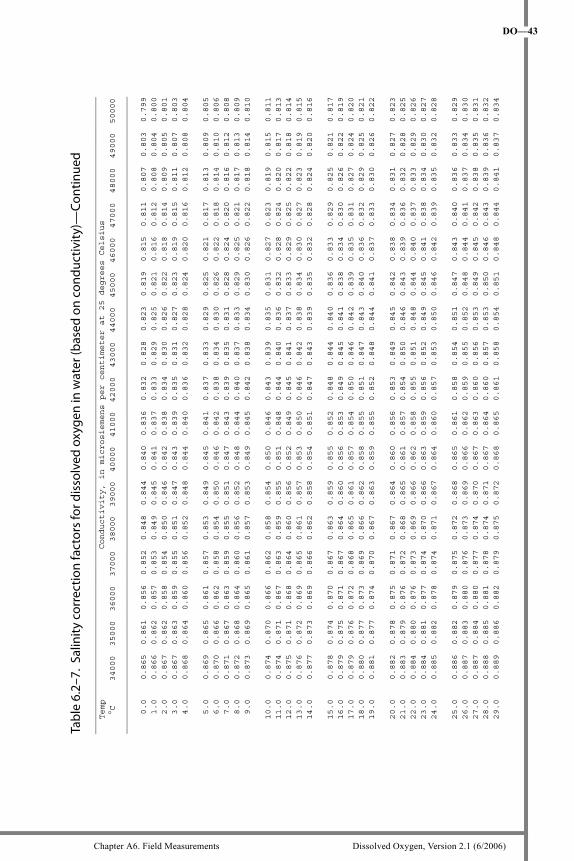
Chapter A6. Field Measurements Dissolved Oxygen, Version 2.1 (6/2006)
DO—43
Tabl
e 6.
2–7.
Sal
inity
cor
rect
ion
fact
ors
for d
isso
lved
oxy
gen
in w
ater
(bas
ed o
n co
nduc
tivity
)—Co
ntin
ued
________________________________________________________________________________________________________________________________
Temp
Conductivity, in microsiemens per centimeter at 25 degrees Celsius
C 34000 35000 36000 37000 38000 39000 40000 41000 42000 43000 44000 45000 46000 47000 48000 49000 50000
________________________________________________________________________________________________________________________________
0.0 0.865 0.861 0.856 0.852 0.848 0.844 0.840 0.836 0.832 0.828 0.823 0.819 0.815 0.811 0.807 0.803 0.799
1.0 0.866 0.862 0.857 0.853 0.849 0.845 0.841 0.837 0.833 0.829 0.825 0.821 0.816 0.812 0.808 0.804 0.800
2.0 0.867 0.862 0.858 0.854 0.850 0.846 0.842 0.838 0.834 0.830 0.826 0.822 0.818 0.814 0.809 0.805 0.801
3.0 0.867 0.863 0.859 0.855 0.851 0.847 0.843 0.839 0.835 0.831 0.827 0.823 0.819 0.815 0.811 0.807 0.803
4.0 0.868 0.864 0.860 0.856 0.852 0.848 0.844 0.840 0.836 0.832 0.828 0.824 0.820 0.816 0.812 0.808 0.804
5.0 0.869 0.865 0.861 0.857 0.853 0.849 0.845 0.841 0.837 0.833 0.829 0.825 0.821 0.817 0.813 0.809 0.805
6.0 0.870 0.866 0.862 0.858 0.854 0.850 0.846 0.842 0.838 0.834 0.830 0.826 0.822 0.818 0.814 0.810 0.806
7.0 0.871 0.867 0.863 0.859 0.855 0.851 0.847 0.843 0.839 0.835 0.831 0.828 0.824 0.820 0.816 0.812 0.808
8.0 0.872 0.868 0.864 0.860 0.856 0.852 0.848 0.844 0.840 0.837 0.833 0.829 0.825 0.821 0.817 0.813 0.809
9.0 0.873 0.869 0.865 0.861 0.857 0.853 0.849 0.845 0.842 0.838 0.834 0.830 0.826 0.822 0.818 0.814 0.810
10.0 0.874 0.870 0.866 0.862 0.858 0.854 0.850 0.846 0.843 0.839 0.835 0.831 0.827 0.823 0.819 0.815 0.811
11.0 0.874 0.871 0.867 0.863 0.859 0.855 0.851 0.848 0.844 0.840 0.836 0.832 0.828 0.824 0.820 0.817 0.813
12.0 0.875 0.871 0.868 0.864 0.860 0.856 0.852 0.849 0.845 0.841 0.837 0.833 0.829 0.825 0.822 0.818 0.814
13.0 0.876 0.872 0.869 0.865 0.861 0.857 0.853 0.850 0.846 0.842 0.838 0.834 0.830 0.827 0.823 0.819 0.815
14.0 0.877 0.873 0.869 0.866 0.862 0.858 0.854 0.851 0.847 0.843 0.839 0.835 0.832 0.828 0.824 0.820 0.816
15.0 0.878 0.874 0.870 0.867 0.863 0.859 0.855 0.852 0.848 0.844 0.840 0.836 0.833 0.829 0.825 0.821 0.817
16.0 0.879 0.875 0.871 0.867 0.864 0.860 0.856 0.853 0.849 0.845 0.841 0.838 0.834 0.830 0.826 0.822 0.819
17.0 0.879 0.876 0.872 0.868 0.865 0.861 0.857 0.854 0.850 0.846 0.842 0.839 0.835 0.831 0.827 0.824 0.820
18.0 0.880 0.877 0.873 0.869 0.866 0.862 0.858 0.855 0.851 0.847 0.843 0.840 0.836 0.832 0.829 0.825 0.821
19.0 0.881 0.877 0.874 0.870 0.867 0.863 0.859 0.855 0.852 0.848 0.844 0.841 0.837 0.833 0.830 0.826 0.822
20.0 0.882 0.878 0.875 0.871 0.867 0.864 0.860 0.856 0.853 0.849 0.845 0.842 0.838 0.834 0.831 0.827 0.823
21.0 0.883 0.879 0.876 0.872 0.868 0.865 0.861 0.857 0.854 0.850 0.846 0.843 0.839 0.836 0.832 0.828 0.825
22.0 0.884 0.880 0.876 0.873 0.869 0.866 0.862 0.858 0.855 0.851 0.848 0.844 0.840 0.837 0.833 0.829 0.826
23.0 0.884 0.881 0.877 0.874 0.870 0.866 0.863 0.859 0.856 0.852 0.849 0.845 0.841 0.838 0.834 0.830 0.827
24.0 0.885 0.882 0.878 0.874 0.871 0.867 0.864 0.860 0.857 0.853 0.850 0.846 0.842 0.839 0.835 0.832 0.828
25.0 0.886 0.882 0.879 0.875 0.872 0.868 0.865 0.861 0.858 0.854 0.851 0.847 0.843 0.840 0.836 0.833 0.829
26.0 0.887 0.883 0.880 0.876 0.873 0.869 0.866 0.862 0.859 0.855 0.852 0.848 0.844 0.841 0.837 0.834 0.830
27.0 0.887 0.884 0.880 0.877 0.874 0.870 0.867 0.863 0.860 0.856 0.853 0.849 0.845 0.842 0.838 0.835 0.831
28.0 0.888 0.885 0.881 0.878 0.874 0.871 0.867 0.864 0.860 0.857 0.853 0.850 0.846 0.843 0.839 0.836 0.832
29.0 0.889 0.886 0.882 0.879 0.875 0.872 0.868 0.865 0.861 0.858 0.854 0.851 0.848 0.844 0.841 0.837 0.834
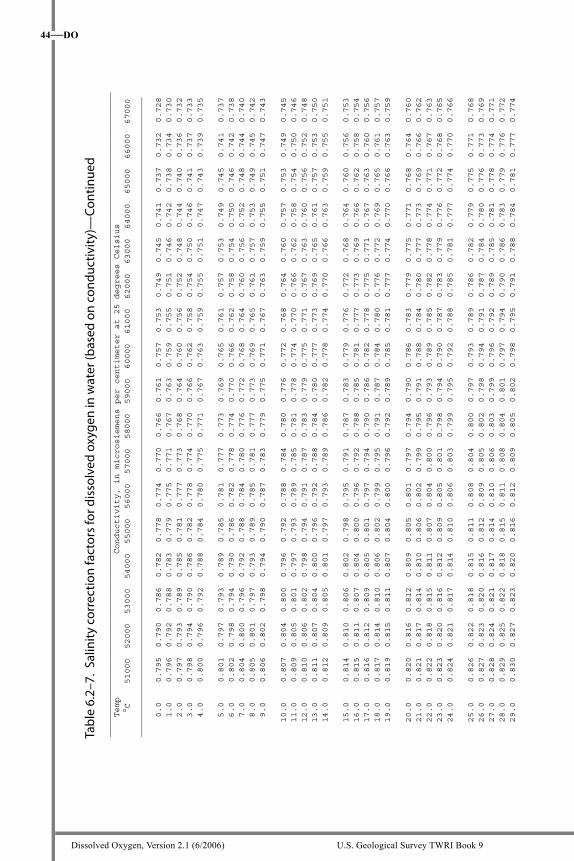
Dissolved Oxygen, Version 2.1 (6/2006) U.S. Geological Survey TWRI Book 9
44—DO
Tabl
e 6.
2–7.
Sal
inity
cor
rect
ion
fact
ors
for d
isso
lved
oxy
gen
in w
ater
(bas
ed o
n co
nduc
tivity
)—Co
ntin
ued
_________________________________________________________________________________________________________________________________
Temp
Conductivity, in microsiemens per centimeter at 25 degrees Celsius
C 51000 52000 53000 54000 55000 56000 57000 58000 59000 60000 61000 62000 63000 64000 65000 66000 67000
________________________________________________________________________________________________________________________________
0.0 0.795 0.790 0.786 0.782 0.778 0.774 0.770 0.766 0.761 0.757 0.753 0.749 0.745 0.741 0.737 0.732 0.728
1.0 0.796 0.792 0.788 0.783 0.779 0.775 0.771 0.767 0.763 0.759 0.755 0.751 0.746 0.742 0.738 0.734 0.730
2.0 0.797 0.793 0.789 0.785 0.781 0.777 0.773 0.768 0.764 0.760 0.756 0.752 0.748 0.744 0.740 0.736 0.732
3.0 0.798 0.794 0.790 0.786 0.782 0.778 0.774 0.770 0.766 0.762 0.758 0.754 0.750 0.746 0.741 0.737 0.733
4.0 0.800 0.796 0.792 0.788 0.784 0.780 0.775 0.771 0.767 0.763 0.759 0.755 0.751 0.747 0.743 0.739 0.735
5.0 0.801 0.797 0.793 0.789 0.785 0.781 0.777 0.773 0.769 0.765 0.761 0.757 0.753 0.749 0.745 0.741 0.737
6.0 0.802 0.798 0.794 0.790 0.786 0.782 0.778 0.774 0.770 0.766 0.762 0.758 0.754 0.750 0.746 0.742 0.738
7.0 0.804 0.800 0.796 0.792 0.788 0.784 0.780 0.776 0.772 0.768 0.764 0.760 0.756 0.752 0.748 0.744 0.740
8.0 0.805 0.801 0.797 0.793 0.789 0.785 0.781 0.777 0.773 0.769 0.765 0.761 0.757 0.753 0.749 0.745 0.742
9.0 0.806 0.802 0.798 0.794 0.790 0.787 0.783 0.779 0.775 0.771 0.767 0.763 0.759 0.755 0.751 0.747 0.743
10.0 0.807 0.804 0.800 0.796 0.792 0.788 0.784 0.780 0.776 0.772 0.768 0.764 0.760 0.757 0.753 0.749 0.745
11.0 0.809 0.805 0.801 0.797 0.793 0.789 0.785 0.781 0.778 0.774 0.770 0.766 0.762 0.758 0.754 0.750 0.746
12.0 0.810 0.806 0.802 0.798 0.794 0.791 0.787 0.783 0.779 0.775 0.771 0.767 0.763 0.760 0.756 0.752 0.748
13.0 0.811 0.807 0.804 0.800 0.796 0.792 0.788 0.784 0.780 0.777 0.773 0.769 0.765 0.761 0.757 0.753 0.750
14.0 0.812 0.809 0.805 0.801 0.797 0.793 0.789 0.786 0.782 0.778 0.774 0.770 0.766 0.763 0.759 0.755 0.751
15.0 0.814 0.810 0.806 0.802 0.798 0.795 0.791 0.787 0.783 0.779 0.776 0.772 0.768 0.764 0.760 0.756 0.753
16.0 0.815 0.811 0.807 0.804 0.800 0.796 0.792 0.788 0.785 0.781 0.777 0.773 0.769 0.766 0.762 0.758 0.754
17.0 0.816 0.812 0.809 0.805 0.801 0.797 0.794 0.790 0.786 0.782 0.778 0.775 0.771 0.767 0.763 0.760 0.756
18.0 0.817 0.814 0.810 0.806 0.802 0.799 0.795 0.791 0.787 0.784 0.780 0.776 0.772 0.769 0.765 0.761 0.757
19.0 0.819 0.815 0.811 0.807 0.804 0.800 0.796 0.792 0.789 0.785 0.781 0.777 0.774 0.770 0.766 0.763 0.759
20.0 0.820 0.816 0.812 0.809 0.805 0.801 0.797 0.794 0.790 0.786 0.783 0.779 0.775 0.771 0.768 0.764 0.760
21.0 0.821 0.817 0.814 0.810 0.806 0.802 0.799 0.795 0.791 0.788 0.784 0.780 0.777 0.773 0.769 0.766 0.762
22.0 0.822 0.818 0.815 0.811 0.807 0.804 0.800 0.796 0.793 0.789 0.785 0.782 0.778 0.774 0.771 0.767 0.763
23.0 0.823 0.820 0.816 0.812 0.809 0.805 0.801 0.798 0.794 0.790 0.787 0.783 0.779 0.776 0.772 0.768 0.765
24.0 0.824 0.821 0.817 0.814 0.810 0.806 0.803 0.799 0.795 0.792 0.788 0.785 0.781 0.777 0.774 0.770 0.766
25.0 0.826 0.822 0.818 0.815 0.811 0.808 0.804 0.800 0.797 0.793 0.789 0.786 0.782 0.779 0.775 0.771 0.768
26.0 0.827 0.823 0.820 0.816 0.812 0.809 0.805 0.802 0.798 0.794 0.791 0.787 0.784 0.780 0.776 0.773 0.769
27.0 0.828 0.824 0.821 0.817 0.814 0.810 0.806 0.803 0.799 0.796 0.792 0.789 0.785 0.781 0.778 0.774 0.771
28.0 0.829 0.825 0.822 0.818 0.815 0.811 0.808 0.804 0.801 0.797 0.794 0.790 0.786 0.783 0.779 0.776 0.772
29.0 0.830 0.827 0.823 0.820 0.816 0.812 0.809 0.805 0.802 0.798 0.795 0.791 0.788 0.784 0.781 0.777 0.774
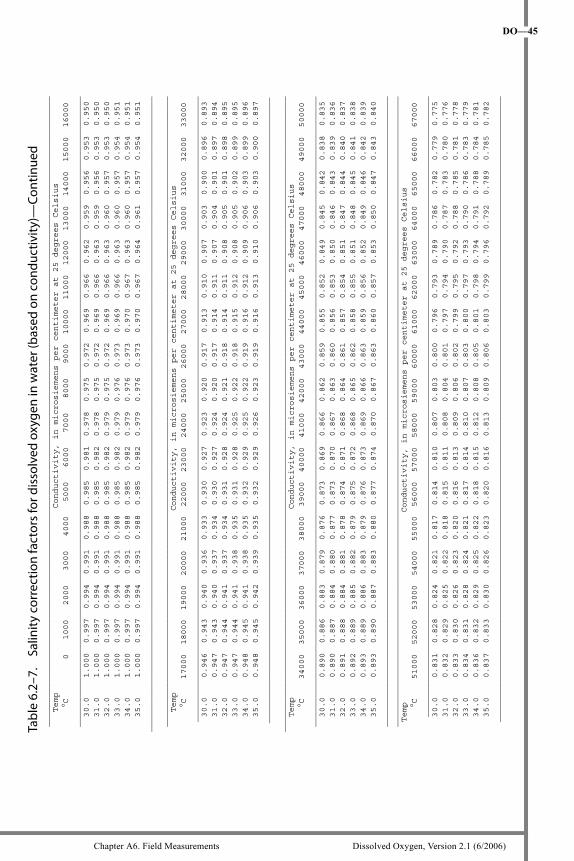
Chapter A6. Field Measurements Dissolved Oxygen, Version 2.1 (6/2006)
DO—45Ta
ble
6.2–
7.
Sal
inity
cor
rect
ion
fact
ors
for d
isso
lved
oxy
gen
in w
ater
(bas
ed o
n co
nduc
tivity
)—Co
ntin
ued
________________________________________________________________________________________________________________________________
Temp
Conductivity, in microsiemens per centimeter at 25 degrees Celsius
C 0 1000 2000 3000 4000 5000 6000 7000 8000 9000 10000 11000 12000 13000 14000 15000 16000
________________________________________________________________________________________________________________________________
30.0 1.000 0.997 0.994 0.991 0.988 0.985 0.981 0.978 0.975 0.972 0.969 0.966 0.962 0.959 0.956 0.953 0.950
31.0 1.000 0.997 0.994 0.991 0.988 0.985 0.982 0.978 0.975 0.972 0.969 0.966 0.963 0.959 0.956 0.953 0.950
32.0 1.000 0.997 0.994 0.991 0.988 0.985 0.982 0.979 0.975 0.972 0.969 0.966 0.963 0.960 0.957 0.953 0.950
33.0 1.000 0.997 0.994 0.991 0.988 0.985 0.982 0.979 0.976 0.973 0.969 0.966 0.963 0.960 0.957 0.954 0.951
34.0 1.000 0.997 0.994 0.991 0.988 0.985 0.982 0.979 0.976 0.973 0.970 0.967 0.963 0.960 0.957 0.954 0.951
35.0 1.000 0.997 0.994 0.991 0.988 0.985 0.982 0.979 0.976 0.973 0.970 0.967 0.964 0.961 0.957 0.954 0.951
_________________________________________________________________________________________________________________________________
________________________________________________________________________________________________________________________________
Temp
Conductivity, in microsiemens per centimeter at 25 degrees Celsius
C 17000 18000 19000 20000 21000 22000 23000 24000 25000 26000 27000 28000 29000 30000 31000 32000 33000
_______________________________________________________________________________________________________________________________
30.0 0.946 0.943 0.940 0.936 0.933 0.930 0.927 0.923 0.920 0.917 0.913 0.910 0.907 0.903 0.900 0.896 0.893
31.0 0.947 0.943 0.940 0.937 0.934 0.930 0.927 0.924 0.920 0.917 0.914 0.911 0.907 0.904 0.901 0.897 0.894
32.0 0.947 0.944 0.941 0.937 0.934 0.931 0.928 0.924 0.921 0.918 0.914 0.911 0.908 0.905 0.901 0.898 0.895
33.0 0.947 0.944 0.941 0.938 0.935 0.931 0.928 0.925 0.922 0.918 0.915 0.912 0.908 0.905 0.902 0.899 0.895
34.0 0.948 0.945 0.941 0.938 0.935 0.932 0.929 0.925 0.922 0.919 0.916 0.912 0.909 0.906 0.903 0.899 0.896
35.0 0.948 0.945 0.942 0.939 0.935 0.932 0.929 0.926 0.923 0.919 0.916 0.913 0.910 0.906 0.903 0.900 0.897
_______________________________________________________________________________________________________________________________
_________________________________________________________________________________________________________________________________
Temp
Conductivity, in microsiemens per centimeter at 25 degrees Celsius
C 34000 35000 36000 37000 38000 39000 40000 41000 42000 43000 44000 45000 46000 47000 48000 49000 50000
________________________________________________________________________________________________________________________________
30.0 0.890 0.886 0.883 0.879 0.876 0.873 0.869 0.866 0.862 0.859 0.855 0.852 0.849 0.845 0.842 0.838 0.835
31.0 0.890 0.887 0.884 0.880 0.877 0.873 0.870 0.867 0.863 0.860 0.856 0.853 0.850 0.846 0.843 0.839 0.836
32.0 0.891 0.888 0.884 0.881 0.878 0.874 0.871 0.868 0.864 0.861 0.857 0.854 0.851 0.847 0.844 0.840 0.837
33.0 0.892 0.889 0.885 0.882 0.879 0.875 0.872 0.868 0.865 0.862 0.858 0.855 0.851 0.848 0.845 0.841 0.838
34.0 0.893 0.889 0.886 0.883 0.879 0.876 0.873 0.869 0.866 0.863 0.859 0.856 0.852 0.849 0.846 0.842 0.839
35.0 0.893 0.890 0.887 0.883 0.880 0.877 0.874 0.870 0.867 0.863 0.860 0.857 0.853 0.850 0.847 0.843 0.840
________________________________________________________________________________________________________________________________
________________________________________________________________________________________________________________________________
Temp
Conductivity, in microsiemens per centimeter at 25 degrees Celsius
C 51000 52000 53000 54000 55000 56000 57000 58000 59000 60000 61000 62000 63000 64000 65000 66000 67000
______________________________________________________________________________________________________________________________
30.0 0.831 0.828 0.824 0.821 0.817 0.814 0.810 0.807 0.803 0.800 0.796 0.793 0.789 0.786 0.782 0.779 0.775
31.0 0.832 0.829 0.825 0.822 0.818 0.815 0.811 0.808 0.804 0.801 0.797 0.794 0.790 0.787 0.783 0.780 0.776
32.0 0.833 0.830 0.826 0.823 0.820 0.816 0.813 0.809 0.806 0.802 0.799 0.795 0.792 0.788 0.785 0.781 0.778
33.0 0.834 0.831 0.828 0.824 0.821 0.817 0.814 0.810 0.807 0.803 0.800 0.797 0.793 0.790 0.786 0.783 0.779
34.0 0.836 0.832 0.829 0.825 0.822 0.818 0.815 0.812 0.808 0.805 0.801 0.798 0.794 0.791 0.788 0.784 0.781
35.0 0.837 0.833 0.830 0.826 0.823 0.820 0.816 0.813 0.809 0.806 0.803 0.799 0.796 0.792 0.789 0.785 0.782
_______________________________________________________________________________________________________________________________
Dissolved Oxygen, Version 2.1 (6/2006) U.S. Geological Survey TWRI Book 9
46—DO
SELECTED REFERENCES American Public Health Association, 2005, Standard methods for the
examination of water and wastewater (21st ed.): Washington, D.C., American Public Health Association, American Water Works Association, and Water Environment Federation, p. 4-136 to 4-137, http://www.standardmethods.org/.
ASTM International, 2006, D888-05 standard test methods for dissolved oxygen in water: accessed May 17, 2006, at http://www.astm.org/cgi-bin/SoftCart.exe/DATABASE.CART/REDLINE_PAGES/D888.htm?L+mystore+zmtx1699.
ASTM International, 2005, D5543-94 (2005) standard test methods for low-level dissolved oxygen in water: accessed May 15, 2006, at http://www.astm.org/cgi-bin/SoftCart.exe/DATABASE.CART/REDLINE_PAGES/D5543.htm?L+mystore+aaam0310.
Brown, Eugene, Skougstad, M.W., and Fishman, M.J., 1970, Methods for collection and analysis of water samples for dissolved minerals and gases: U.S. Geological Survey Techniques of Water-Resources Investigations, book 5, chap. A1, p. 126-129.
CHEMetrics, Inc., 2006, Oxygen, dissolved: accessed May 15, 2006, from http://www.chemetrics.com/catalogpdfs.html.
Gilbert, T.W., Behymer, T.D., Castaneda, H.B., March 1982, Determination of dissolved oxygen in natural and wastewaters: American Laboratory, p. 119-134.
Hach Company, Hach LDO technology—real-world FAQ: accessed September 27, 2005 at http://www.hach.com/hc/view.document.only.invoker/View=HTML_LDO_REALWORLD_FAQ/NewLinkLabel=Hach+LDO+Technology:+Real-World+FAQ/PREVIOUS_BREADCRUMB_ID=HC_SEARCH_KEYWORD/SESSIONID|ATBwTU1URXlOemMwTmpVek9UazJNeVpuZFdWemRFVldXQT09QQ==|.
Hem, J.D., 1985, Study and interpretation of the chemical characteristics of natural water (3d ed.): U.S. Geological Survey Water-Supply Paper 2254, p. 155-156.
In-Situ Inc., Multi-parameter water quality Troll®9500, accessed April 29, 2006 at http://www.in-situ.com/In-Situ/Products/TROLL9500/TROLL9500.html.
Kane, J.A., Improved optical sensor for monitoring dissolved oxygen, in NASA Tech Briefs, KSC-11998, accessed September 27, 2005, at http://www.nasatech.com/Briefs/Nov99/KSC11998.html.
Skougstad, M.W., Fishman, M.J., Friedman, L.C., Erdmann, D.E., and Duncan, S.S., eds., 1979, Methods for determination of inorganic substances in water and fluvial sediments: U.S. Geological Survey Techniques of Water-Resources Investigations, book 5, chap. A1, 626 p.
Chapter A6. Field Measurements Dissolved Oxygen, Version 2.1 (6/2006)
DO—47
U.S. Geological Survey, 1979, Analytical methods—recommended procedures for calibrating dissolved oxygen meters: Quality of Water Branch Technical Memorandum 79.10, accessed March 17, 2006, at http://water.usgs.gov/admin/memo/QW/qw79.10.html.
U.S. Geological Survey, 1981, Water quality—new tables of dissolved oxygen saturation values: Quality of Water Branch Technical Memorandum 81,11, accessed March 17, 2006, at http://water.usgs.gov/admin/memo/QW/qw81.11.html.
U.S. Geological Survey, variously dated, National field manual for the collection of water-quality data: U.S. Geological Survey Techniques of Water-Resources Investigations, book 9, chaps. A1-A9, available online at http://pubs.water.usgs.gov/twri9A.
Wagner, R.J., Boulger, Jr., R.W., Oblinger, C.J., and Smith, B.A., 2006, Guidelines and standard procedures for continuous water-quality monitors — station operation, record computation, and data reporting: U.S. Geological Survey Techniques and Methods 1-D3, available online only at http://pubs.water.usgs.gov/tm1D3.
Weiss, R.F., 1970, The solubility of nitrogen, oxygen and argon in water and seawater: Deep Sea Research, v. 17, p. 721–735.
White, A.F., Peterson, M.L., and Solbau, R.D., 1990, Measurement and interpretation of low levels of dissolved oxygen in ground water: Ground Water, v. 28, no. 4, p. 584–590.
Wood, W.W., 1981, Guidelines for collection and field analysis of ground-water samples for selected unstable constituents: U.S. Geological Survey Techniques of Water-Resources Investigations, book 1, chap. D2, p. 22-24.
Dissolved Oxygen, Version 2.1 (6/2006) U.S. Geological Survey TWRI Book 9
48—DO
ACKNOWLEDGMENTSThis National Field Manual responds to advances in technology and science and to the developing needs for water-quality monitoring. Its aim is to provide scientifically sound guidance to USGS personnel and to document USGS requirements for collecting water-quality data. As a result, the expertise of numerous scientists has been tapped in devel-oping this manual and keeping it current. A great debt of gratitude is owed to the following original authors, editors, and reviewers of Chap-ter A6, Section 6.2 of this field manual: E.A. Ciganovich, I.M. Collies, J.V. Davis, C.M. Eberle, R.T. Iwatsubo, B.B. Palcsak, K.A. Pearsall, D.B. Radtke, D.A. Sherwood, A.H. Welch, F.D. Wilde, A.E. White, Chester Zenone, and the analysts of the USGS National Water Quality Laboratory.
Improvements to the technical quality of this revision to Section 6.2, Dissolved Oxygen, can be attributed to the expertise and conscientious efforts of technical reviewers Jacob Gibs, J.A. Kingsbury, and S.C. Skrobialowski. Special appreciation is extended to the scientists from the Hach, In-Situ Inc., and YSI Inc. companies, who were generous with their time and expertise in explaining luminescent-sensor technol-ogy. The editorial and production quality of this report is a credit to I.M. Collies and L.J. Ulibarri. Thanks go to F.D. Wilde, managing edi-tor of the National Field Manual, for maintaining the integrity of the technical and publication process.