measurement of the rate of aqueous humor flow
TRANSCRIPT

THE YALE JOURNAL OF BIOLOGY AND MEDICINE 64 (1991), 89-102
Measurement of the Rate ofAqueous Humor Flow
SCOTT D. SMITH, M.D.
Department of Ophthalmology and Visual Science, Yale University School ofMedicine,New Haven, Connecticut
Received October 3, 1990
Techniques which estimate the rate of aqueous flow generally require the use of tracersubstances. Determination of the distribution of the tracer in the relevant body compartmentspermits calculation of the rate of flow within the limits of accuracy of the method used. Theunderlying theory, as well as the advantages and limitations of methods employing systemic,topical, intracameral, and intravitreal administration of tracer substances are reviewed. Sincethese methods all assume that the rate of aqueous secretion is constant, yet the presence of adiurnal rhythm of flow has been demonstrated in both rabbits and humans, a compartmentalmodel of a circadian system based upon the vitreous depot technique is presented. This modelestimates the degree to which a continuously changing rate of aqueous flow limits the ability todetermine aqueous flow rate accurately by this particular method and illustrates this limitation,which is common to all tracer methods.
The ability to estimate the rate at which aqueous humor is secreted by the ciliaryepithelium has been a necessary tool in gaining knowledge about ocular physiologyand has been important in the development of effective agents in the treatment ofglaucoma. Techniques which estimate the rate of aqueous flow generally require theuse of tracer substances. Determination of the distribution of the tracer in therelevant body compartments permits calculation of the rate of flow within the limitsof accuracy of the method used. Several methods have been developed, somerequiring systemic and others requiring local (topical, intracameral, or intravitreal)administration of the test substance. Still others make use of endogenously producedsubstances as tracers.Techniques exist by which the facility of outflow from the anterior chamber can be
measured. These measurements, in conjunction with measurements of intraocularpressure and episcleral venous pressure, have been used to calculate the rate ofaqueous flow. They provide an indirect estimate of aqueous production, however,and will not be included in this discussion of methods permitting direct measurementof flow.
SYSTEMIC TRACERS
Early techniques employed a systemically administered tracer which enters theaqueous from the blood either by an active secretory process, by diffusion, or both.The tracer is administered by intravenous and intraperitoneal injection or bycontinuous intravenous infusion so that plasma tracer levels remain essentially
89Abbreviations: FITC: fluorescein isothiocyanate IOP: intraocular pressureAddress reprint requests before July 1, 1991, to: Scott D. Smith, M.D., Dept. of Medical Education,
Baylor University Medical Center, 3500 Gaston Avenue, Dallas, TX 75246Address reprint requests after July 1, 1991, to: Scott D. Smith, M.D., Massachusetts Eye & Ear
Infirmary, Ophthalmology Residents' Lounge, 243 Charles Street, Boston, MA 02114
Copyright © 1991 by The Yale Journal of Biology and Medicine, Inc.All rights of reproduction in any form reserved.

SCO1T D. SMITH
constant during the course of the experiment. The test substance is initially absentfrom the aqueous, but its concentration increases over time until it reaches asteady-state concentration, Cam, which is determined by the concentration in theplasma, the rate of aqueous flow, and the ability of the tracer to diffuse from plasmainto aqueous. By measuring Cax. and the rate at which the concentration of tracerapproaches this steady-state level, the rate of aqueous flow can be determined.
In a study of the steady-state distribution of various solutes between the blood andaqueous, Kinsey and Grant [1] presented the mathematical derivation of theequations upon which these methods are based. This derivation as adapted byBecker [2] argues that, if the tracer enters the aqueous strictly by diffusion and mixescompletely with the aqueous, the rate of change of concentration of tracer in theaqueous can be expressed:
dCdt= kd(Cp-CaY-kfCa [1]
where
kd = the coefficient of diffusion exchange of tracer between aqueous and plasmakf = the coefficient of escape of tracer from anterior chamber by bulk flow of
aqueousCp = the concentration of tracer in the plasma, which remains constantC, = the concentration of tracer in the aqueous humor
If
ko = kd+ kf
then equation 1 can be written:
dCadt = kdCp-koCa [2]
At steady state, i.e., when the rate of entrance of tracer by diffusion and the rate ofexit of tracer by diffusion and bulk flow are equal,
dCada 0 Ca = Cax
and
kd = Ca [3]CP
Substituting into equation 2:
dCadt = ko(Ca. - Ca) [4]
and, by integration:
Ca -Ca =Ca e-k [5]ln (Ca. - Ca) = ln (Ca.) - kot [6]
Experimental determination of Ca at at least one point in time, and Ca. after reaching
90

MEASUREMENT OF AQUEOUS HUMOR FLOW
the steady state, permits the calculation of k,. By substitution into equation 3 andfrom the measured value of C,, the value of kf can be determined.
If the tracer enters the aqueous solely by secretion, and therefore can leave the eyeonly by bulk flow, where ks is the coefficient of secretion of tracer into aqueous fromthe blood, equation 1 simplifies to:
dCadt sp kja [7]
and an analogous derivation leads to:
ln (Ca. - Ca) = ln (Cax,)- kft [8]In this case, kf can be determined directly from values for Ca,. and Ca.The relationship between the first-order rate constant for exit of tracer by bulk
flow kf and the rate of aqueous flow can be shown by the following simple derivation.Assuming that the tracer can exit only by bulk flow, the rate of change of mass oftracer in the anterior chamber can be expressed:
dmt =-a * f[9]
where
m = the mass of tracer in the anterior chamberCa = the concentration of tracer in the aqueousf = the rate of aqueous flow
But since
m = C, VIwhere Va is the volume of the anterior chamber, substituting and rearranging,equation 9 becomes:
dCa -fCa =-dt [10]C, VI
Integrating equation 10 we get:
C. = CO ekf [11]
where C0 is the initial concentration of tracer in the aqueous, and
fkf = [12]
demonstrating that kf represents the fractional rate of turnover of aqueous in theanterior chamber per unit of time.
This technique has been employed, using several different tracer substances, byvarious investigators. For example, Goldmann [3] and Nagataki [4] each usedintravenous fluorescein to measure aqueous flow in humans relative to the volume ofthe anterior chamber and obtained mean rates of 1.1 percent + 0.2 percent and 0.974percent + 0.094 percent per minute, respectively. This technique had the advantageof allowing the measurement to be made without removing aqueous from the eye,
91

SCOTT D. SMITH
but still required several blood samples. Becker [2] administered radioactive isotopesof iodine to rabbits by a combination of intraperitoneal and intravenous injection andcontinuous intravenous infusion. Using two different isotopes administered at dif-ferent times before sampling the aqueous permitted a single aqueous sample toprovide both data points required for the measurement. With this technique hefound a relative rate of aqueous flow per minute of 1.5 percent t 0.17 percent of thevolume of the anterior chamber.
In an attempt to alleviate the difficulties associated with maintaining constantplasma tracer levels, Bairainy and Kinsey [5,6] used intravenously administeredpara-aminohippuric acid, radioactive Rayopakel, and radioactive DiodrastI tomeasure the rate of aqueous flow in rabbits. These tracers were chosen because theyare quickly excreted by the kidney, providing a relatively constant, near-zero level inthe plasma. It was hoped that a detectable quantity of the test substance wouldremain in the eye until the plasma level was negligible and that diffusion of tracer outof the aqueous would be slow enough to ignore. If these conditions were met,measurement of the rate of disappearance of the tracer would accurately reflect therate of aqueous flow. The first term of equation 1 would approach zero, allowing thecalculation of flow rate from equations 11 and 12.
After measuring the rate of disappearance of tracer in groups of normal rabbits bytaking aqueous samples two and three hours after intravenous infusion of the testsubstance, the authors found that the plasma tracer concentration and diffusion oftracer out of the aqueous were not negligible. A correction factor was thereforeintroduced which required measurement in a separate group of animals of thesteady-state aqueous concentration at a constant plasma tracer level. This value wasdetermined in rabbits with ligated renal arteries to prevent excretion of the tracer,thus maintaining a constant plasma concentration. With this technique, the rate ofaqueous flow in normal rabbits was estimated to be in the range of 2.6 to 3.6,ulI/minute.
WASHOUT OF INTRACAMERALLY INJECTED TRACERS
In order to simplify the mathematical treatment, techniques involving systemicadministration of tracers generally require that the plasma level of tracer remainessentially constant. To avoid the difficulties associated with this requirement,methods involving direct injection of a tracer substance into the anterior chamberhave been developed by several investigators. A bolus of tracer is injected into theanterior chamber and is assumed to be completely mixed with the aqueous. Anequivalent volume of aqueous is removed in order to prevent elevation of intraocularpressure (IOP). As the tracer is washed out of the eye by bulk flow and diffusion,measurements of aqueous tracer concentration are made. Calculation of the rate ofaqueous flow under these conditions is analogous to that in the case of systemicadministration of tracer, but with an essentially constant plasma tracer level of zero.Furthermore, if the tracer is a relatively large molecule which cannot diffuse out ofthe anterior chamber but leaves only by bulk flow, the calculation of flow is furthersimplified, since the concentration follows a simple first-order exponential decaygiven by equations 11 and 12 above.
This method more effectively overcomes the complexities of systemic tracers whichBairainy and Kinsey [5,6] tried to overcome by using systemic tracers that are rapidlyeliminated from the blood. It does so, however, at the expense of a directly invasive
92

MEASUREMENT OF AQUEOUS HUMOR FLOW
procedure which may affect the normal physiology of the eye during the course of theexperiment. Tracers used by investigators employing this method have includedradioactively iodinated albumin [7,8], iodoantipyrene [9], iodohippurate [9], bluedextran [10], and fluorescein isothiocyanate-(FITC-) dextran [11].
DILUTION METHODS
Another group of methods to measure aqueous flow is based upon the dilution of atracer during continuous perfusion with a buffer solution containing tracer [12,13].Through a cannula placed in the anterior or posterior chamber, the buffer is infusedat a constant rate, where it is assumed to mix completely with newly forming aqueous.The degree of dilution of the tracer substance is related to the rate of aqueous humorformation. Aqueous leaves the eye through the normal outflow channels and throughanother cannula in the anterior chamber from which aqueous tracer concentrationmeasurements can be made. The height of the fluid column attached to this cannulais adjusted to maintain IOP at its initial level. Since after reaching a steady state therate of entry and exit of tracer must be equal,
rp Cp =(rp + f)Ca [13]
where
rp = the rate of perfusion with tracer-containing bufferf = the rate of aqueous humor formation
Cp = the concentration of tracer in the perfusateCa = the concentration of tracer in the aqueous
Rearranging equation 13 gives:
f=r Fp (C, - C.) [14]
As the rate of perfusion and concentration of tracer in the buffer are known,measurement of Ca permits calculation of the rate of aqueous flow.
This method allows observation of changes in the rate of aqueous flow in anindividual eye. For example, measurement of the concentration of tracer in theaqueous before and after administration of a drug is possible, allowing an eye to beused as its own control. Tracers used in this technique include '4C-labeled inulin [12],which requires discrete sampling of the aqueous for detection of 14C in a liquidscintillation counter, and "3'I-labeled albumin [13,14], which permits constant moni-toring of the concentration in the aqueous with a y detector.Animals must be under general anesthesia during the course of the measurements
since continuous cannulation of the eye is required. In addition, inflammationinduced by the required invasive procedures limits the duration of experimentationto four to six hours for each eye studied.
TOPICAL APPLICATION OF FLUORESCEIN (CORNEAL DEPOT)
Langley and MacDonald [15] suggested that relative changes in aqueous flowcould be determined by staining the cornea with fluorescein and measuring changesin its peak concentration in the aqueous. The first thorough quantitative discussionof how this method can be used to determine the absolute rate of aqueous flow waspresented by Jones and Maurice [16]. In this report, they asserted that the rate of
93

SCOTT D. SMITH
aqueous flow can be calculated by measuring the concentration of fluorescein in theaqueous over time. In addition, the determination of either the ratio of cornealfluorescein concentration to that in the aqueous or the total quantity of fluorescein inthe eye is required. Their derivation, as adapted by Coakes and Brubaker [17],requires the simultaneous solution of the linear differential equations which describethe rate of change of quantity of fluorescein in the anterior chamber:
dmadma k m- (ka+ ko)ma [15]dt a a
and in the corneal stroma:
dmcd kamc + kma [16]
where
ma = the mass of fluorescein in the anterior chamberMc = the mass of fluorescein in the corneaka = the mass transfer coefficient from cornea to anterior chamber
a = the mass transfer coefficient from anterior chamber to corneako = the mass transfer coefficient from aqueous to blood by bulk flow and
diffusion
The solutions take the form:
ma = ye-at- ye-pt [17]
m = Bet + (1 - S)e-' [18]
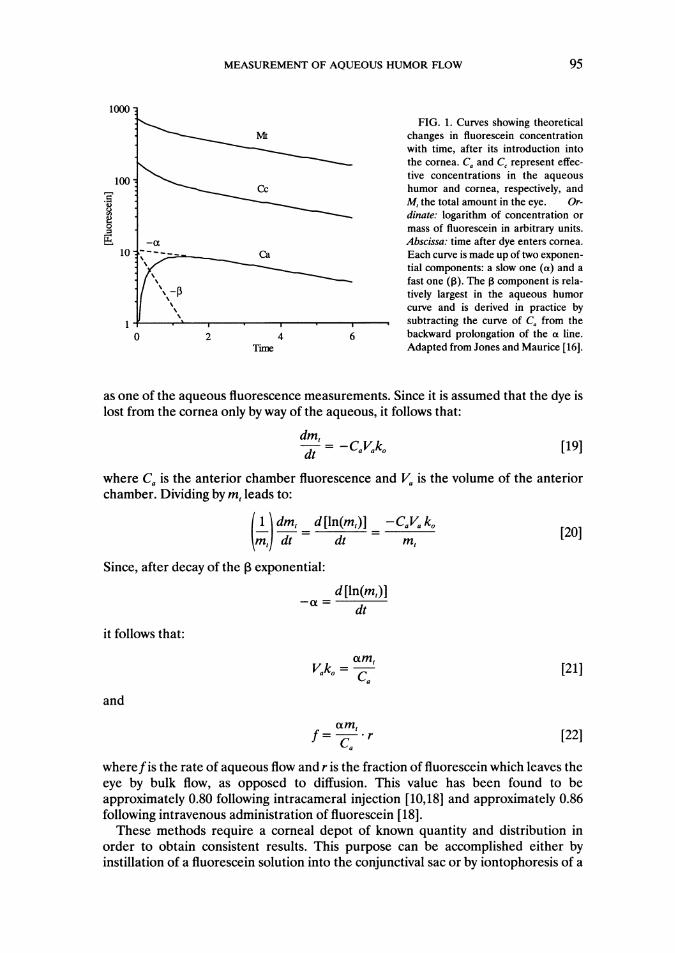
where a, ,3, -y, and 8 are complex expressions consisting of combinations of the masstransfer coefficients and have no readily interpretable physical meaning. The solu-tions are exponential functions in which the second term decays more quickly thanthe first. In other words, while both terms contribute to changes in concentration offluorescein early, only the a exponential influences the concentration at later times.The semilog plots of the concentration of fluorescein in the aqueous and the cornea,therefore, eventually become linear with slope -a (Fig. 1). The semilog plot of thetotal mass of fluorescein in the eye also decreases with the same slope.
Jones and Maurice [16] proposed two methods to calculate the rate of aqueousflow based on the above equations. The first requires the measurement of anteriorchamber fluorescence from the time the corneal fluorescein is instilled until sometime later when the , term has decayed. Plotting the values on semilog paper, theslope of the linear portion of the curve is, as mentioned above, -a. The differencebetween the original curve and the extrapolated line with slope -a represents the I8exponential term, and has slope -,13 (Fig. 1). The values of the mass transfercoefficients can be calculated from the values of a, f, and the ratio of the concentra-tion of fluorescein in the cornea to that in the aqueous on the linear portion of thecurves. This ratio is constant once the ,B exponential has decayed and needs to bemeasured only once during the experiment.
Their second method requires several measurements of anterior chamber fluores-cence a few hours after application of fluorescein once the 13 exponential has becomesmall. The total mass of fluorescein in the eye, mi, is also measured at the same time
94
MEASUREMENT OF AQUEOUS HUMOR FLOW 95
1000FIG. 1. Curves showing theoretical
_Mt changes in fluorescein concentrationwith time, after its introduction intothe cornea. C. and C, represent effec-
100 tive concentrations in the aqueousCc humor and cornea, respectively, and
4) M, the total amount in the eye. Or-dinate: logarithm of concentration or
0 mass of fluorescein in arbitrary units.ES-a Abscissa: time after dye enters cornea.
10 - - Ca Each curve is made up of two exponen-tial components: a slow one (a) and afast one (Is). The f component is rela-tively largest in the aqueous humorcurve and is derived in practice by
1 I " , . , , subtracting the curve of Ca from the0 2 4 6 backward prolongation of the a. line.
Time Adapted from Jones and Maurice [16].
as one of the aqueous fluorescence measurements. Since it is assumed that the dye islost from the cornea only by way of the aqueous, it follows that:
dmid= [19]
where Ca is the anterior chamber fluorescence and Va is the volume of the anteriorchamber. Dividing by m, leads to:
(ldm,-d[ln(m) -CV,k [20]
Since, after decay of the I exponential:
_d [In(m,)]dt
it follows that:
atmtVak= Ca [21]Ca
and
atmtf= Cam [22]
wheref is the rate of aqueous flow and r is the fraction of fluorescein which leaves theeye by bulk flow, as opposed to diffusion. This value has been found to beapproximately 0.80 following intracameral injection [10,18] and approximately 0.86following intravenous administration of fluorescein [18].These methods require a corneal depot of known quantity and distribution in
order to obtain consistent results. This purpose can be accomplished either byinstillation of a fluorescein solution into the conjunctival sac or by iontophoresis of a
SCOTIT D. SMITH
bolus of fluorescein into the corneal stroma. Topper et al. [19] showed that topicalinstillation of a fluorescein solution must be done several hours before any meaning-ful measurement of aqueous fluorescence can be made as it takes this length of timefor uniform staining of the corneal stroma to occur. No delay was required foreffective results after iontophoresis, as the procedure quickly provides a depot offluorescein with sharply defined boundaries. Since the first method of Jones andMaurice requires early measurements of aqueous fluorescence, iontophoresis isrequired for this technique.
Diffusional loss of topically applied fluorescein from the anterior chamber cannotbe determined by these techniques. The diffusional and flow components of theanterior chamber loss coefficient, k, cannot be separately evaluated. Thus, ininvestigating the effect of a drug or disease on the rate of aqueous flow, separatedetermination of a possible effect on the rate of diffusional loss of fluorescein mustbe undertaken.An estimate of aqueous flow obtained by one of the corneal depot techniques is
based on differences in fluorescence observed between at least two points in time. Itrepresents, therefore, an average flow value between the end points rather than ameasurement of flow at a discrete point in time. This fact becomes an importantconsideration in interpreting the results of experiments designed to detect changes inthe rate of aqueous flow or to define maximum and minimum flow rates.With the exception of the iontophoretic placement of the corneal fluorescein
depot, these methods are completely noninvasive. As a result, they are useful notonly in animal experimentation, but are ideal for clinical studies in humans.
VITREOUS DEPOT TECHNIQUE
A method of measuring aqueous humor flow in laboratory animals was devised byJohnson and Maurice [20], using an intravitreal injection of FITC-dextran, which canpresumably leave the eye only by diffusing across the interface between the vitreousand posterior chamber, and then exiting with the aqueous by bulk flow into theblood. After allowing several days for the tracer to become uniformly distributed inthe vitreous and for the concentration of tracer in the aqueous to reach a maximum,the concentration of fluorescein in the anterior chamber reflects the rate of aqueousflow. As the dye diffuses into the posterior chamber, it is diluted to varying degrees,depending upon the aqueous flow rate. At high rates of flow the tracer is relativelydilute, while at low rates of flow it is more concentrated.
It is assumed that complete mixing occurs, that a steady state exists, i.e., that therate of diffusion of FITC-dextran from the vitreous into the aqueous is equal to therate at which it is leaving the anterior chamber by bulk flow, that the rate of aqueousflow is constant, and that the mass of FITC-dextran in the vitreous does not changeappreciably during each measurement. Under these conditions, the rate of aqueousflow can be determined by the relationship:
kvm. = f - Ca [23]
kvm[Ca [24]
where kv is the coefficient of diffusion of FITC-dextran from the vitreous into theaqueous and m, is the mass of FITC-dextran in the vitreous. The authors demon-
96
MEASUREMENT OF AQUEOUS HUMOR FLOW
strated that once the tracer is uniformly distributed and Ca has reached a maximum,the concentrations of FITC-dextran in the vitreous and aqueous decrease exponen-tially with the same rate constant, k,. The value of ki for a given species can bedetermined, therefore, by following the change of concentration of FITC-dextran inthe aqueous or vitreous of a group of animals for several days. A semilog plot of thisdata is linear, with slope -kr. The rate of aqueous flow in an eye is determined bymeasuring Ca at some point in time, enucleating the eye, and measuring the quantityof FITC-dextran in the vitreous at the time the animal was sacrificed. Using the valueof k,, m, at the time of the measurement can be determined, permitting calculation ofthe absolute rate of aqueous flow.
This technique has the advantage of allowing measurement of aqueous flow overextended periods of time since the tracer remains at readily detectable levels for upto two weeks, depending upon the sensitivity of the detector used. The steady-stateassumption required for the flow calculation, however, can lead to errors if aqueousfluorescence measurements are made shortly after changes in flow rate. Thisproblem, which will be discussed in detail below, is not unique to the vitreous depottechnique; however, Gaul and Brubaker [21] found that this problem seems to bemagnified in this technique, for reasons which were not clear. They compared thevitreous depot method with the second method of Jones and Maurice [16] in thedetection of changes in aqueous flow rate after administration of acetazolamide andmannitol. During the hour after administration of either agent, the corneal depottechnique showed a 50 percent decrease in aqueous flow rate, while no statisticallysignificant difference was demonstrated by the vitreous depot method.
ENDOGENOUS TRACER SUBSTANCES
Quantification of endogenously produced compounds which diffuse or are se-creted from the blood into the aqueous can be used to calculate the rate of aqueousflow. Substances which enter the aqueous at constant or nearly constant rates behaveas if there were a systemic "depot" and permit measurement of relative changes inaqueous flow rate by applying the same theory as that underlying the vitreous depottechnique. Measurement of aqueous flare, which correlates with aqueous proteinconcentration, and determinations of aqueous ascorbate concentrations have beenused in this way [22,23,24,25,26,27]. It is not generally possible to make absolute flowmeasurements by these methods, however, as the rate of entrance of the tracer intothe aqueous is difficult to determine.
MEASUREMENT OF PUPILLARY FLOW OF AQUEOUS HUMOR
Holm and Krakau [28] proposed a method to measure the flow of aqueous humoras it passes from the posterior to the anterior chamber through the pupil. Thismethod uses fluorescein not as a tracer, but as a marker to delineate bubbles ofaqueous humor as they emerge from the posterior chamber. By staining the aqueousin the anterior chamber with topically administered fluorescein, new aqueouspassing through the pupil was found to form an unstained volume for up to 30seconds before mixing began to occur. A photographic method of determination ofthe volume of the newly formed unstained aqueous was used to estimate the aqueousflow rate. By thoroughly mixing the aqueous through eye movements, the processcould be repeated many times in a short period. Values obtained for rabbits were inthe range of 1.5 to 3.8 ,ul/minute.
97
SCOTT D. SMITH
Krakau later suggested a photoelectric method of quantifying the volume ofunstained aqueous by measuring the decrease in fluorescence in a "cuvette" enclos-ing the pupil created by a suitably masked slit lamp fluorophotometer [29]. Since theintensity of fluorescence is directly proportional to the concentration of fluorescein,
I(t)=I,-(k C-fCt) [25]
where
I(t) = the intensity of fluorescence at time tI = the intensity of fluorescence at time t = 0 (before any new aqueous is
formed)f = the rate of aqueous flow, assumed to be constantC = the concentration of fluorescein in the thoroughly mixed aqueousk = a proportionality constant relating C and I
After determining (k - C) by measuring the intensity of fluorescence in a knownvolume of well-mixed aqueous, flow can be determined by the equation.
f =(t)[26]k - C * t [6
Although this method allows rapid measurements which can be quickly repeated,it is relatively sensitive to eye movements during the period of measurement, whichcause mixing of newly formed aqueous with stained aqueous. In addition, thepresence of a small pupil is required, necessitating topical treatment with pilocarpinebefore the period of measurement.
EFFECT OF VARIATION OF FLOW RATE ON THE RESULTSOF TRACER METHODS
As noted above, methods of estimating the rate of aqueous flow assume this rate tobe constant. Previous studies have demonstrated, however, that diurnal variations inaqueous flow occur in both rabbits [30] and humans [31]. To study the errorintroduced by this invalid assumption, I have developed the following compartmen-tal model of a circadian system based on the vitreous depot technique. This modeldemonstrates the degree to which a continuously changing rate of aqueous flow canbe expected to limit the ability of this particular method to determine flow rateaccurately.
FITC-dextran was assumed to diffuse from the vitreous compartment into theaqueous compartment, then to leave the aqueous only by bulk flow. Back diffusionfrom the aqueous into the vitreous was assumed to be negligible, as Johnson andMaurice [20] have demonstrated that vitreous fluorescence levels average approxi-mately 26 times greater than aqueous levels, using dextrans of high molecular weight.With these assumptions, the rate of diffusion of tracer into the aqueous is given by:
(dMdt = k,M, e-k,t [27]
and the rate of exit of tracer from the aqueous is given by:
dMt =C, C f(t) [28]
98
MEASUREMENT OF AQUEOUS HUMOR FLOW
VariableConstant
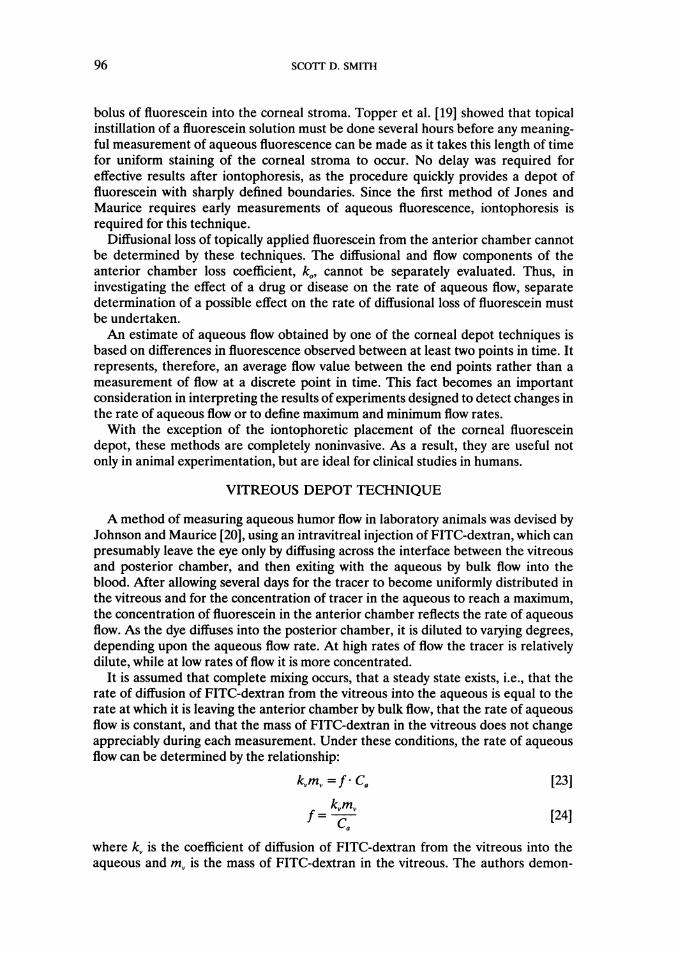
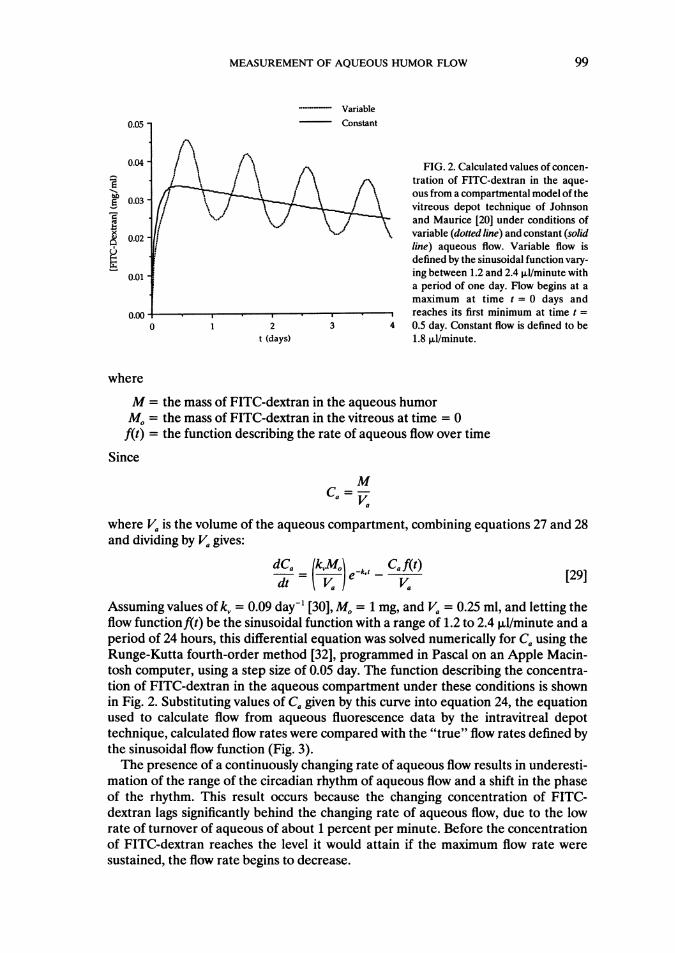
FIG. 2. Calculated values of concen-tration of FITC-dextran in the aque-
oo /-* \ / \ ous from a compartmental model of theg0.03/\ 5zzvitreous depot technique of Johnson
/ IXuJ V\<and Maurice [20] under conditions of
0.02 - variable (dotted line) and constant (solidline) aqueous flow. Variable flow isdefined by the sinusoidal function vary-ing between 1.2 and 2.4 pl/minute witha period of one day. Flow begins at amaximum at time t= 0 days and
0.00 reaches its first minimum at time t=0 1 2 3 4 0.5 day. Constant flow is defined to be
t (days) 1.8 p.l/minute.
where
M = the mass of FITC-dextran in the aqueous humorM = the mass of FITC-dextran in the vitreous at time = 0f(t) = the function describing the rate of aqueous flow over time
Since
MC, = -VI
where V. is the volume of the aqueous compartment, combining equations 27 and 28and dividing by Va gives:
dCa kM_Ca f(t) [29]
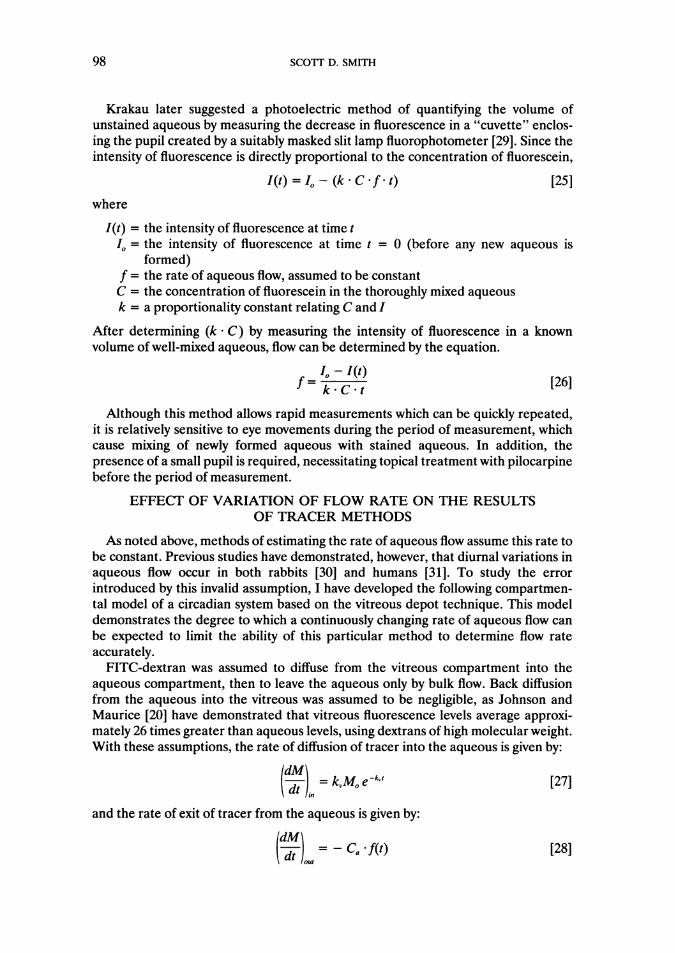
Assuming values of kI = 0.09 day-' [30], M0 = 1 mg, and Vj = 0.25 ml, and letting theflow functionf(t) be the sinusoidal function with a range of 1.2 to 2.4 pdl/minute and aperiod of 24 hours, this differential equation was solved numerically for Ca using theRunge-Kutta fourth-order method [32], programmed in Pascal on an Apple Macin-tosh computer, using a step size of 0.05 day. The function describing the concentra-tion of FITC-dextran in the aqueous compartment under these conditions is shownin Fig. 2. Substituting values of Ca given by this curve into equation 24, the equationused to calculate flow from aqueous fluorescence data by the intravitreal depottechnique, calculated flow rates were compared with the "true" flow rates defined bythe sinusoidal flow function (Fig. 3).The presence of a continuously changing rate of aqueous flow results in underesti-
mation of the range of the circadian rhythm of aqueous flow and a shift in the phaseof the rhythm. This result occurs because the changing concentration of FITC-dextran lags significantly behind the changing rate of aqueous flow, due to the lowrate of turnover of aqueous of about 1 percent per minute. Before the concentrationof FITC-dextran reaches the level it would attain if the maximum flow rate weresustained, the flow rate begins to decrease.
99

100 ~~~~~~SCOTrD. SMITH
I/ %I'l FIG. 3. Comparison of the"true" rate of aqueous flow
1.8 ~~~~~~~~~~~~~~~(dottedline) and the rateof aqueous flow calculatedfrom the aqueous concentra-
1.5 tion of FITC-dextran (solidline) in a compartmentalmodel of the vitreous depot
1.2 -- technique of Johnson andMaurice [20]. "True" flow isdefined by the sinusoidal
0.9 Ifunction varying between 1.20 1224 and 2.4 0U/minute with a
Hours period of 24 hours.
Although the above analysis is derived from the vitreous depot technique, these
principles apply to all tracer methods and can affect their results in a similar fashion.
CONCLUSION
Each of the methods previously discussed has differences in precision of measure-ment, technical simplicity, invasiveness, and ease of mathematical treatment of data,making a particular technique more suitable for a given research protocol. There areseveral factors, however, which prevent any of these techniques from measuring withcomplete accuracy the total quantity of aqueous secreted by the ciliary epithelium.First, it must be remembered that not all of the aqueous leaves the eye by oneparticular route. While the majority of the fluid passes into the anterior chamberthrough the pupil and leaves the eye by bulk flow through the canal of Schlemm, theuveoscleral pathway acts as a second site of bulk outflow through which aqueouspasses from the anterior chamber into the suprachoroidal space and from therethrough the sclera into periorbital tissues [33]. In addition, a small portion ofaqueous never enters the anterior chamber, but leaves the eye posteriorly throughthe vitreous and retina. Tracer techniques are measurements only of anteriorchamber turnover. The portion which exits the eye posteriorly cannot be measuredby any currently available technique.
In addition, the mathematical treatment of data in the above methods assumes therate of aqueous flow to be constant. Studies have shown, however, that a diurnalrhythm of aqueous flow exists both in rabbits [30] and in man [31]. As demonstratedby the model presented above, which assumes a continuously changing flow rate, thelow rate of turnover of aqueous-approximately 1 percent per minute--causes thetracer concentration to lag behind changes in flow and results in some degree ofinaccuracy, particularly in predicting maximum and minimum values.Although such considerations limit the ability of these methods to quantify the
rate of aqueous secretion precisely, relative changes in the rate of flow can still bereadily detected. Alterations in aqueous flow induced by pharmacologic interventionor interruption of the eye's innervation can be clearly determined. Such measure-ments enable investigators to define the physiologic regulators of aqueous secretion
100
MEASUREMENT OF AQUEOUS HUMOR FLOW 101
and to help discover the mechanism of action of drugs of potential usefulness in thetreatment of glaucoma.
REFERENCES
1. Kinsey VE, Grant WM: The mechanism of aqueous humor formation inferred from chemical studieson blood-aqueous humor dynamics. J Gen Physiol 26:131-149, 1942
2. Becker B: The measurement of rate of aqueous flow with iodide. Invest Ophthalmol 1:52-58, 19623. Goldmann H: Uber Fluorescein in der menschliche Vorderkammer. Ophthalmologica 119:65-95,
19504. Nagataki S: Aqueous humor dynamics of human eyes as studied using fluorescein. Jpn J Ophthalmol
19:235-249, 19755. Barany E, Kinsey VE: The rate of flow of aqueous humor: I. The rate of disappearance of
para-aminohippuric acid, radioactive Rayopake, and radioactive Diodrast from the aqueous humor ofrabbits. Am J Ophthalmol 32II:177-188, 1949
6. Kinsey VE, Barany E: The rate of flow of aqueous humor: II. Derivation of rate of flow and itsphysiologic significance. Am J Ophthalmol 3211:189-202, 1949
7. Kottler M, Brubaker R, Macri F: The decay kinetics of substances which leave the anterior chamberby bulk flow. Invest Ophthalmol 9:758-764, 1970
8. Macri FJ, O'Rourke J: Measurements of aqueous humor turnover rates using a gamma probe. ArchOphthalmol 83:741-745, 1970
9. O'Rourke J, Macri FJ, Berghoffer B: Studies in uveal physiology: I. Adaptation of isotope clearanceprocedures for external monitoring of anterior uveal bloodflow and aqueous humor turnover in thedog. Arch Ophthalmol 81:526-533, 1969
10. Elman J, Caprioli J, Sears ML: Direct determination of diffusional loss of fluorescein from theanterior chamber. Invest Ophthalmol Vis Sci 27(Supplement):289, 1986
11. Carter S, Elman J, Sears ML: A technique for determining aqueous humor flow after intracameralfluorescein-dextran. Invest Ophthalmol Vis Sci 28(Supplement):134, 1987
12. Oppelt WW: Measurement of aqueous humor formation rates by posterior-anterior chamber perfu-sion with inulin: Normal values and the effect of carbonic anhydrase inhibition. Invest Ophthalmol6:76-83, 1967
13. Bill A: The effect of changes in arterial blood pressure on the rate of aqueous humour formation in aprimate (Cercopithecus ethiops). Ophthalmic Res 1:193-200, 1970
14. Sperber GO, Bill A: A method for near-continuous determination of aqueous humor flow; effects ofanaesthetics, temperature and indomethacin. Exp Eye Res 39:435-453, 1984
15. Langley D, MacDonald RK: Clinical method of observing changes in the rate of flow of aqueoushumour in the human eye: I. Normal eyes. Br J Ophthalmol 36:432-437, 1952
16. Jones RF, Maurice DM: New methods of measuring the rate of aqueous flow in man with fluorescein.Exp Eye Res 5:208-220, 1966
17. Coakes RL, Brubaker RF: Method of measuring aqueous humor flow and corneal endothelialpermeability using a fluorophotometry nomogram. Invest Ophthalmol Vis Sci 18:288-302, 1979
18. Brubaker RF, Ghargozloo NZ, Kalnic PH, Kerstetter JR, Neault JR, McLaren JW: Diffusional loss offluorescein from the eye. Invest Ophthalmol Vis Sci 29(Supplement):324, 1988
19. Topper JE, McLaren J, Brubaker RF: Measurement of aqueous humor flow with scanning ocularfluorophotometers. Curr Eye Res 3:1391-1395, 1984
20. Johnson F, Maurice D: A simple method of measuring aqueous humor flow with intravitrealfluoresceinated dextrans. Exp Eye Res 39:791-805, 1984
21. Gaul GR, Brubaker RF: Measurement of aqueous flow in rabbits with corneal and vitreous depots offluorescent dye. Invest Ophthalmol Vis Sci 27:1331-1335, 1986
22. Anjou CIN: Physiological variations of the aqueous flare density in normal human eyes. ActaOphthalmol 39:525-539, 1961
23. Krakau CET: On the connection between aqueous flow and flare. Ophthalmologica 144:153-163,1962
24. Anjou CIN, Krakau CET: Aqueous flare and protein content in the anterior chamber of normalrabbits' eyes. Acta Ophthalmol 39:95-101, 1961
25. Oshika T, Araie M, Masuda K: Diurnal variation of aqueous flare in normal human eyes measuredwith laser flare-cell meter. Jpn J Ophthalmol 32:143-150, 1988

102 SCOTT D. SMITH
26. McLaren JW, Trocme SD, Relf S, Brubaker RF: Rate of flow of aqueous humor determined frommeasurements of aqueous flare. Invest Ophthalmol Vis Sci 31:339-346, 1990
27. Linner E: Ascorbic acid as a test substance for measuring relative changes in the rate of plasma flowthrough the ciliary processes: I. The effect of unilateral ligation of the common carotid artery inrabbits on the ascorbic acid content of the aqueous humor at varying plasma levels. Acta Physiol Scand26:57-69, 1952
28. Holm 0, Krakau CET: Measurements of the flow of aqueous humor according to a new principle.Experientia 22:773-774, 1966
29. Krakau CET: A photoelectric method for estimating the pupillary flow of aqueous humour. Experien-tia 23:928, 1967
30. Smith SD, Gregory DS: A circadian rhythm of aqueous flow underlies the circadian rhythm of IOP inNZW rabbits. Invest Ophthalmol Vis Sci 30:775-778, 1989
31. Reiss GR, Lee DA, Topper JE, Brubaker RF: Aqueous humor flow during sleep. Invest OphthalmolVis Sci 25:776-778, 1984
32. Johnson LW, Reiss RD: Numerical Analysis. Reading, MA, Addison-Wesley, 1977, p 30233. Bill A: The aqueous humor drainage mechanism in the Cynomolgus monkey (Macaca irus) with
evidence for unconventional routes. Invest Ophthalmol 4:911-919, 1965