maximising registration and ier
DESCRIPTION
Maximising Registration and IER. Charlotte Snelling Social Researcher, Customer Registration Team, Constitution Group, Cabinet Office. Individual Electoral Registration. - PowerPoint PPT PresentationTRANSCRIPT

Maximising Registration and IER
Charlotte Snelling
Social Researcher, Customer Registration Team, Constitution Group, Cabinet Office

Individual Electoral Registration
2 Maximising Registration and IER
A change from the current system of ‘household registration’ to one where everyone registers individually.
IER will include a modern electoral registration system with personal responsibility.
Applicants will have their identity confirmed or verified before being added to the electoral register.
For the first time, citizens will be able to register to vote online.

How does IER work?
3
All electors must register to vote individually and have their application verified before being added to the register.
Each must provide:
Name National Insurance Number and Date of birth
These are cross checked with DWP before names are added to the register, or appropriate proof of identity can be provided to an Electoral Registration Officer (ERO). There are alternative ways to verify for those unable to find their National Insurance Number.
Requirement for signature dropped –allowing online registration.
Maximising Registration and IER

The IER Digital Service
4
Data Checked
Online Application
IER Digital Service
Local Authority
Citizen
Local Authority
Local Authority
Local Authority
Local Authority ………………………
Maximising Registration and IER

Maximising registration fund 2013/14
5 Maximising Registration and IER
Date FundingJuly 2013 • £4.2 million maximising registration funding announced
October 2013
• £385,848 to Local Authorities/Valuation Joint Boards in 2013 (Activity Oct 2013 – Feb/Mar 2014)
February 2014
• £3.6 million distributed equitably to every ERO to help them with the costs of local activities for maximising registration.
• Funds distributed equitably to EROs according to levels of under-registration.
• Five national organisations awarded funding from the Democratic Engagement Innovation Fund (£215,932).
• Rock Enrol! learning resource available to all EROs.

Why ‘maximising registration’?
EROs have a duty to maintain an accurate and complete electoral register.
The Government is determined to support EROs in ensuring as complete and accurate a register as possible, as part of the transition to IER.
This includes funding and promoting work at a national and local level to maximise registration levels.
6 Maximising Registration and IER
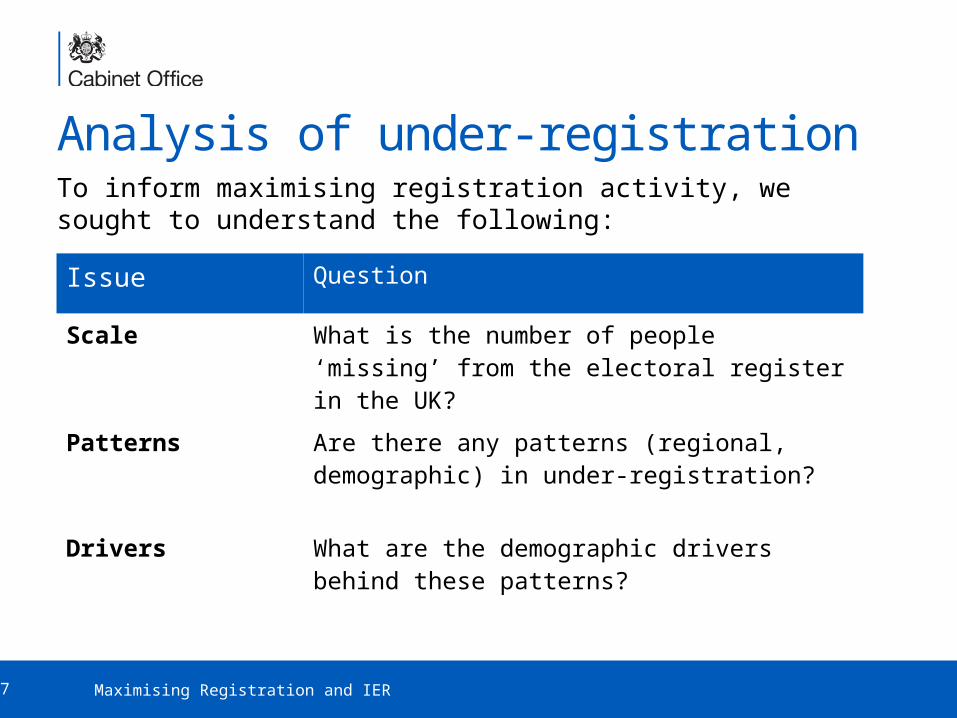
Analysis of under-registrationTo inform maximising registration activity, we sought to understand the following:
7 Maximising Registration and IER
Issue Question
Scale What is the number of people ‘missing’ from the electoral register in the UK?
Patterns Are there any patterns (regional, demographic) in under-registration?
Drivers What are the demographic drivers behind these patterns?

Decline in registration
2000 2001 2002 2003 2004 2005 2006 2007 2008 200975.0
80.0
85.0
90.0
95.0
100.0
Decline in Registration rates - 2000- 2009
UK % England % Scotland % Wales %
Perc
enta
ge
• Registration rates have been in steady decline for decades
• Electoral register 85% to 87% complete in 2011
• Approx 6m people ‘missing’ from register
• Members of certain groups are statistically less likely to be on the register
8 Maximising Registration and IER
Source: The Electoral Office for Northern Ireland, 2009Sources: Electoral Commission: Great Britain’s ElectoralRegisters, 2011 and the Wilks-Heeg Literature Review: ElectoralRegistration in the UK

Completeness levels
9 Maximising Registration and IER
65+ 55-64 19-24 17-180%
10%20%30%40%50%60%70%80%90%
100%
White resident BME communities 72%
74%
76%
78%
80%
82%
84%
86%
88%
Home owner Mortgage payer private renter 0%
10%20%30%40%50%60%70%80%90%
100%
Completeness rate by tenure of housing
Over five years Less than a year 0%
10%20%30%40%50%60%70%80%90%
100%
Completeness rate by length of residence
Completeness rate by age range Completeness rate by ethnicity
Source: Electoral Commission: Great Britain’s Electoral Registers , 2011

Under-registered groups (URGs)
The UK Electoral Commission research on patterns of under-registration:
10 Maximising Registration and IER
Group Register completeness
Private renters 56%
Social renters 78%
BME groups 77%
Young people (17-18) 55%
Young people (19-24) 56%
EU nationals 56%
Irish and Commonwealth nationals 68%
Source: Great Britain’s Electoral Registers, 2011: register completeness in under-registered groups (Electoral Commission, 2011)

Regression analysis aimed to find out whether these factors (tenure, ethnicity, age etc.) drive under-registration.
Data used:
• 2011 Census
• Mid-year population estimates
• UK Electoral Registration Statistics
11 Maximising Registration and IER
LA’s registration
rate
Private renters
Social renters
Deprivation
Young people
/students
BME residents
Foreign-born
residentsEducation
LA size
Religion
Socio-economic
group
Unemployment

Highlighted in blue are demographic characteristics with a statistically significant relationship to under-registration.
Source: Electoral Registration Analysis (Cabinet Office, 2013)
12 Maximising Registration and IER
LA’s registration
rate
Private renters
Social renters
Deprivation
Young people
/students
BME residents
Foreign-born
residentsEducation
LA size
Religion
Socio-economic
group
Unemployment

Confirmation1. Matching of existing electoral register against records held by
DWP.
2. Electors ‘passported’ to new system without being required to provide personal identifiers.
3. Electoral administrators free to focus limited resources on minority of electors who cannot be confirmed and those currently unregistered.
Confirmation Dry Run (CDR), Summer 2013
All LAs in England and Wales, and all VJBs in Scotland; 46 million people’s records checked.
13 Maximising Registration and IER

CDR resultsGreen flag – positive result, individual confirmed
Amber flag – possible match, may be confirmed by local data matching
Red flag – no match found
• Average green match rate of 78%, median of 81% (range 47-86%).
• Average increases to 85% with local data matching.
• 15 to 22% of currently registered electors unlikely to confirm.
• Lower in: urban areas, student towns, predominantly private renter areas...
Source: Simplifying the transition to Individual Electoral Registration: An evaluation of the ‘confirmation dry run’ – using data matching to confirm electors on the electoral register (Cabinet Office , 2013)
14 Maximising Registration and IER

• Students• HMO residents• Private renters
Less likely to confirm
• Young people (18-24)• People born outside UK• Social housing residents• BME individuals
More likely to confirm
15 Maximising Registration and IER
Source: Electoral Registration Analysis (Cabinet Office, 2013)
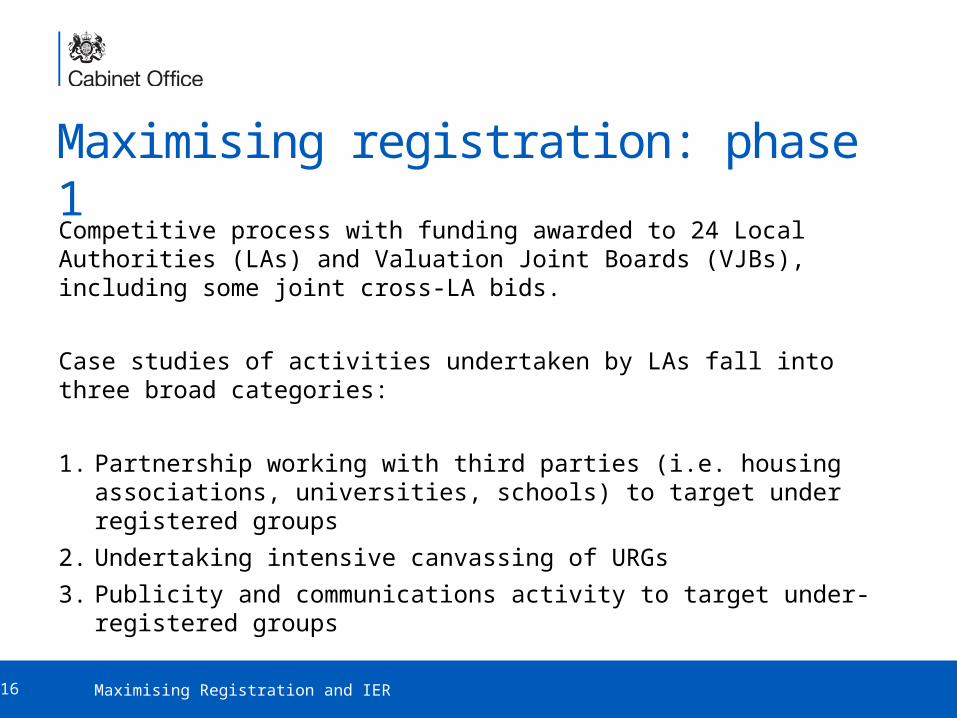
Maximising registration: phase 1
Competitive process with funding awarded to 24 Local Authorities (LAs) and Valuation Joint Boards (VJBs), including some joint cross-LA bids.
Case studies of activities undertaken by LAs fall into three broad categories:
1. Partnership working with third parties (i.e. housing associations, universities, schools) to target under registered groups
2. Undertaking intensive canvassing of URGs3. Publicity and communications activity to target under-registered groups
16 Maximising Registration and IER

Examples of engagement activitiesPartnership working with third parties• Attending Youth Service meetings• Registration sessions in schools• Liaising with social housing providers to include registration forms in welcome packs
for new tenants
Intensive Canvassing• Targeted mail-outs to wards with low registration rates• Identifying the numbers of specific URGs against Census data of the total number
living in the authority. Local data could then establish where wards have a higher proportion of households with URG profiles.
Publicity / communications activity• Face-to-face promotion at sixth form colleges and universities• Announcements on university radio channels• Promotional flyers with Council Tax bills and Social Housing tenant newsletters• Social media, QR codes and bespoke videos to universities and colleges
17 Maximising Registration and IER

18 Maximising Registration and IER
25%
21%
54%
Figure 1 Proposed activities
Publicity Partnership
Traditional EROSoc
ial re
nters
Private
rente
rs
HMO rente
rs
Young
peop
le (18
-24)
Attaine
rs (16
-17)
Studen
ts
BME commun
ities
People
with
disa
bilitie
s0
2
4
6
8
10
12
14
Figure 2 Target groups
Num
ber o
f LA
s/V
JBs

Evaluation To help inform future registration maximising strategies, and develop future funding opportunities for LAs/VJBs.
To measure impact and process.- How many new registrations?- How were the registrations achieved?- How cost-effective were the activities?
To identify examples of good practice suitable for wider roll-out. - Successful activities- Lessons learnt- Recommendations
To make a wider contribution to debates on the efficiency and effectiveness of traditional canvass activity versus more innovative approaches.
19 Maximising Registration and IER
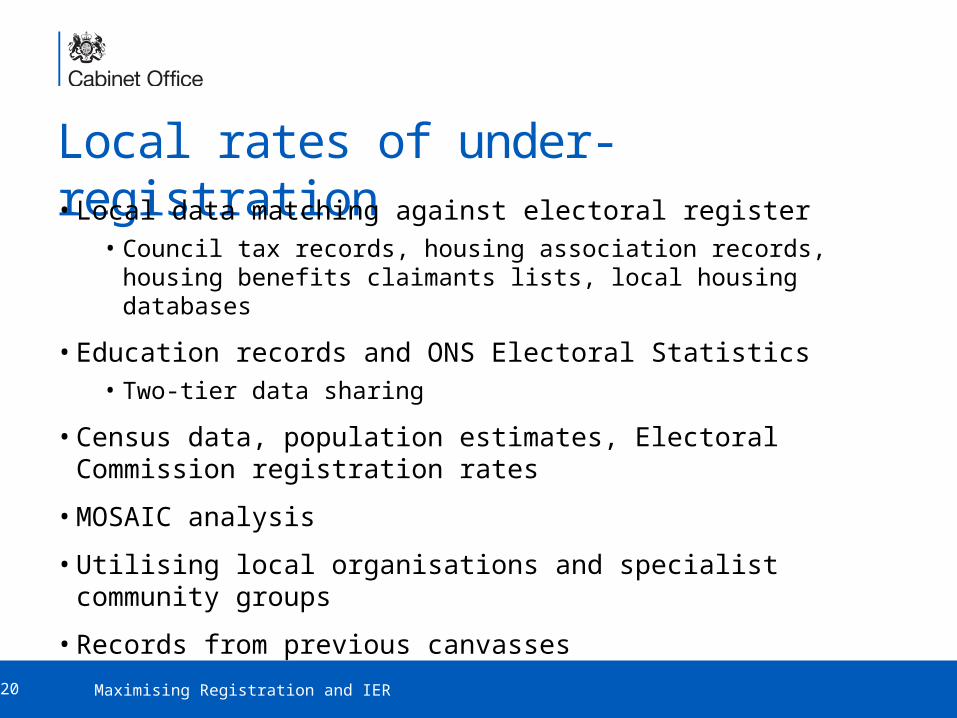
Local rates of under-registration• Local data matching against electoral register
• Council tax records, housing association records, housing benefits claimants lists, local housing databases
• Education records and ONS Electoral Statistics• Two-tier data sharing
• Census data, population estimates, Electoral Commission registration rates
• MOSAIC analysis
• Utilising local organisations and specialist community groups
• Records from previous canvasses
20 Maximising Registration and IER

Impact- Overall impact on registration rate- URG completeness before/after- % increase- % registered of those targeted (success rate)
• Colour coded/marked forms, website sign up, pre-populated forms• Noting duplicate, incomplete, ineligible forms
- Cost per elector targeted and cost per elector registered
- Estimating registrations from engagement- Tracking registration figures against events- Control areas and social ‘experiments’
21 Maximising Registration and IER

Process1. Objectives
– Why targeting chosen URGs? How targeting chosen URGs?
2. Delivery– Any changes? Any obstacles? What was successful? Partnerships?
3. Impact on workflows– Any additional training needs? Extra work? How easily incorporated?
4. Evaluation method– How were registrations captured? Engagement? Feedback?
5. Costs– Additional costs? Efficiency savings?
6. Lessons learnt– Recommendations? Future changes?
22 Maximising Registration and IER

Preliminary findings...• Responses from 20 of 24 LAs/VJBs received
• Process of analysis ongoing
• Interviews and case studies planned
• We have also produced evaluation guidance and forms for LAs/VJBs which received funding following the announcement in Feb 2014.
• Initial assessments are currently coming in outlining plans for activity.
• Evaluation is being strongly encouraged across LAs and VJBs.
23 Maximising Registration and IER

Any questions?
Charlotte Snelling
Social Researcher, Customer Registration, Constitution Group, Cabinet Office
24 Maximising Registration and IER