material mixing in shock-induced pseudotachylites
TRANSCRIPT

Material mixing in shock-induced pseudotachylites, Vredefort impact structure,
South Africa
Elizaveta Kovalevaa*
, Matthew S. Hubera, Roger Dixon
b
aDepartment of Geology, University of the Free State, 205 Nelson Mandela Drive, 9300
Bloemfontein, South Africa
bDepartment of Geology, University of Pretoria, 0028 Pretoria, South Africa
*Corresponding author. E-mail address: [email protected]

Dolerite-hosted pseudotachylites contain exotic clasts of granite
Within granite clasts, shocked zircon and monazite are in contact with one another
Intermediate composition of pseudotachylites due to material mixing
Material mobilized due to fracture dilation in dolerite
Quartz phase transition allowed material mixing to take place
Impact pseudotachylites are not strictly in situ melts
*Highlights

Graphical Abstract

ABSTRACT
Impact-generated pseudotachylites (PTs) have been extensively studied in the Vredefort
Impact Structure, South Africa, and have been shown to correspond chemically and isotopically
to their host rocks. Such melts are frequently described as forming strictly in situ with lithic
clasts derived from the immediate wall rocks. Mixed compositions are rare, where PTs are
observed directly along a lithological contact. In this study, we document the presence of vast
numbers of granitic clasts within dolerite-hosted PT veins within the Vredefort impact structure.
The groundmasses of dolerite-hosted PT veins have two distinct geochemical compositions: (1)
mafic, and (2) intermediate. The two compositional melt phases have a sharp contact, indicating
immiscibility and/or mingling. Shocked zircon and monazite within the granite clasts enclosed in
a dolerite-hosted PT vein indicate shock deformation prior to clast transport into the dolerite. In
monazite, we report a new shock microtwin geometry 180°/[104].
The mechanisms by which granitic clasts were emplaced in the dolerite-hosted veins are
complex. Previous experimental work has suggested that varying shock velocity in different
lithologies may be responsible for material mixing. In addition, the thermal pulse accompanying
the shock wave would have caused quartz in the granite to transform into volumetrically larger
high-temperature polymorphs, significantly increasing the granite volume compared to the
adjacent dolerite. Together with fluctuation of stresses (post-impact reverberations) after the
passage of the main shock wave, this volume adjustment initiated brittle fracturing of the
dolerite. A negative pressure gradient was thus generated within the dolerite that allowed granitic
material to be injected into the dolerite-hosted melt veins.

1. Introduction
Impact generated pseudotachylites (PTs) are fine-crystalline melt veins and networks of
veins (network breccia) from a few millimetres to tens of metres thick, laden with fragments
of wall rock (Killick and Reimold, 1990; Reimold and Colliston, 1994). The exact
mechanisms of formation are debated and may include shock melting, pore/cavity collapse at
the shock wave front, decompression melting, friction melting, acoustic fluidization, shock
recovery melting and post-impact seismic “shaking” (Garde and Klausen, 2016; Kowitz et
al., 2013; Martini, 1978, 1991; Melosh, 2005; Reimold, 1995; Reimold et al., 2016; Spray,
2010). Pseudotachylites are abundant in the Vredefort impact structure core and have been
observed in all pre-impact lithologies (Bisschoff, 1988).
The majority of studies in Vredefort have focused at the abundant and easily accessible
PTs in granitic rocks in the Vredefort basement granite, in quarries and river pavements
(Bisschoff, 1988; Harris et al., 2013; Lieger et al., 2011; Mohr-Westheide and Reimold,
2010; Mohr-Westheide et al., 2009; Reimold and Colliston, 1994; Reimold et al., 2016, 2017;
Riller et al., 2010). Only a few studies at Vredefort have reported PT veins in mafic rocks,
such as garnet hornfels (Bisschoff, 1988; Wilshire, 1971) and dolerite/gabbroic dikes and sills
(Hart et al., 1999; Killick and Reimold, 1990). The mafic intrusions in the Greenlands
Greenstone Complex show rare <1 cm-wide PT veinlets, but some contain up to 1 m-wide PT
breccia zones, particularly occurring near lithological contacts with quartzite or shale
(Reimold and Colliston, 1994).
Studies of PTs within Vredefort have consistently shown that their composition closely
matches the composition of their host (Harris et al., 2013; Mohr-Westheide and Reimold,
2010; Reimold and Colliston, 1994; Reimold et al., 2016, 2017). Geochemically, PTs in
felsic host rocks (granites, quartzites, shales) typically are slightly more mafic than their host
rocks (Willemse, 1937; Wilshire, 1971), because of initial preferential ultracataclasis and

subsequent melting of ferromagnesian and hydrous minerals under non-equilibrium
conditions. Preferential melting of certain phases occurs due to their low fracture toughness
and low melting point (e.g., Spray, 2010). In contrast, PTs in mafic host rocks such as
epidiorite, mafic lavas, garnet hornfels, or nepheline syenite, are more felsic than their host
rock (Killick et al., 1988; Wilshire, 1971). This contradicts both the phenomenon of
preferential fusion of mafic phases into PT melt and the idea of in situ formation (Maddock,
1992; Reimold and Colliston, 1994; Spray, 2010; Thompson and Spray, 1996). On the other
hand, PTs hosted by more than one lithology, such as along lithological contacts, have mixed
compositions, which include tectonic (Killick et al., 1988; Maddock, 1992), Sudbury
(Thompson and Spray, 1996) and Vredefort PTs (Lieger et al., 2011; Reimold et al., 2017).
Typically, lithic clasts in PTs are derived from the immediate host rock (Mohr-
Westheide and Reimold, 2010). A few authors have described singular exotic clasts (Reimold
et al., 2016; Wilshire, 1971), and transport of clasts (Bisschoff, 1988), but no constraints or
analyses of the transportation mechanism have been made. In this study, we examine PTs
hosted entirely by mafic rocks, but containing a significant felsic component, including lithic
clasts. We suggest a potential mechanism responsible for the observed compositional mixing
and clast transport.
2. Geological Background
The Vredefort impact structure is located ~120 km SSW from Johannesburg, South
Africa (Fig. 1A). The age of shock deformation is estimated at ~2020 ± 3 Ma (Kamo et al.,
1996; Moser, 1997; Spray et al., 1995). Only the central uplift of the structure is preserved, as
the structure was deeply eroded to the depth of ~8–10 km after the impact event (Schreyer,
1983). The visible diameter of the central uplift is 100–120 km along its N-S axis (Bisschoff,
1988). Geophysical modelling (Henkel and Reimold, 1998) suggested that the original impact

structure was ~250 km in diameter, whereas numerical modelling (Ivanov, 2005) suggested
an initial diameter of ~180 km. The Vredefort structure is also notable for the presence of
shallow Moho beneath the structure (Youssof et al., 2013).
The Outer Granite Gneiss (OGG) tonalite-trondhjemite-granodiorite (TTG) suite is
exposed at the surface within the core of the structure (Fig. 1A). The OGG has a whole-rock
87Rb,
232Th,
238U and
235U isotopic ages of 3.05 Ga and experienced regional metamorphism
at 2.8 Ga (Hart et al., 1981). U-Pb dating of zircon from the OGG suite by Kamo et al. (1996)
yielded an average of 3.03 Ga, roughly consistent with the whole rock dating by Hart et al.
(1981). The basement granites are intruded by abundant dolerite dikes and small bodies that
are shocked, but not tectonically deformed, and have a U-Pb zircon age of ≥ 2560 Ma,
suggesting Ventersdorp age of intrusions (Hart et al., 1999). These dolerite intrusions are
often cut by impact-generated PT veins (Hart et al., 1999; Killick and Reimold, 1990).
3. Field Observations
Samples for this study were collected from the granitic core of the structure (Fig. 1A).
Metamorphosed basement granite in contact with a dolerite intrusion is exposed southwest of
Parys near the Lesothospruit creek (26°57'09.2"S 27°22'51.4"E). The granite is pink, coarse-
grained, deformed, foliated, has typical granitic mineralogy (biotite, quartz, and feldspars),
and locally contains migmatites. Apatite, zircon, and monazite are accessory phases. The
dolerite is exposed in a 100 x 80 m (8 000 m2) outcrop surrounded by granite. In the contour
map of the magnetic data (reduced to the pole), recorded across the study area, dolerite
extends below the erosional level as an oval body of ca. 100 x 60 m, stretching from WSW to
ENE (Kovaleva et al., 2018). The dolerite has a massive and uniform texture with no
evidence of foliation and is grey on fresh surfaces and brown on weathered surfaces. It is
composed of medium-grained (up to 2 mm) laths of plagioclase (up to 70 vol. %), grains of

clinopyroxene, amphibole, ilmenite, and rare crystals of olivine (for additional field
descriptions and magnetometer survey results see Kovaleva et al., 2018).
Pseudotachylites crosscut both the granite and dolerite. The abundance and thickness of
PTs in both rocks decrease with increasing distance from their lithological contact. The PT
veins in granite are dark-grey to black and contain numerous clasts of the wall rock, but
exotic clasts (e.g., dolerite) have not been observed, even though PT veins up to 20 cm thick
are abundant in granite. Within the dolerite, PT veins occur up to 12 cm thick; they are dark-
grey or brown and contain numerous angular to rounded clasts of both dolerite and granite,
with clast size ranging from a few mm to a few cm. The PT veins in dolerite are not uniform,
with some veins having clasts of only dolerite (herein described as Melt 1) and some veins
having clasts of both dolerite and granite (herein described as Melt 2, Fig. 1B-C). Granite
clasts within the dolerite-hosted PT veins are up to 7 cm in diameter, decreasing in size and
abundance with increasing distance from the contact with granite towards the centre of the
dolerite outcrop. Veins containing granite clasts strike at 179° and 305° into the dolerite
body, i.e., the granite clasts are introduced from different directions with respect to the crater
centre. We observed hundreds to thousands of granitic clasts within dolerite-hosted PT veins
over an area of approximately 30 m2 and intruding up to 13 m from the contact.
The contact between granite and dolerite is not directly exposed, but can be inferred.
Between dolerite and granite outcrops, along the inferred contact, a wide zone (varying from
30 cm to 4 m in width) of massive PT is exposed (Fig. 1D), which surrounds the dolerite
intrusion on all sides. This rock is dark-grey, has a fine-crystalline matrix, and contains
multiple granitic clasts (locally up to 70%) of various sizes and shapes, but no dolerite clasts
are observed (Fig. 1D).
4. Samples and Methods

4.1. Optical and scanning electron microscopy (SEM)
We collected representative samples of granite and dolerite with PT veins, as well as
massive PTs along the granite-dolerite contact, and dolerite samples with PT veins that do not
have visible granite clasts (“Melt 1”) and PT veins that have granite clasts (“Melt 2”).
Polished petrographic thin sections were prepared for samples of dolerite, contact zone, and
granite, and were analysed with an Olympus BX51 optical microscope equipped with an
Olympus U-TVO.63XC camera (Department of Geology, University of the Free State). Thin
sections were studied using a Jeol JSM-6610 SEM equipped with an energy-dispersive
Thermo Scientific Ultradry X-ray (EDX) spectrometer (Department of Geology, University
of the Free State). The EDX detector was used to identify mineral phases qualitatively. The
analytical conditions for collecting the backscattered electron (BSE) images and qualitative
chemical maps were 15 KV accelerating voltage, 8 nA probe current, 10 mm working
distance, and a 9.6 x 10⁻⁵
Pa vacuum.
4.2. Wavelength dispersive X-ray fluorescence (WD-XRF)
Samples were analysed at the Department of Geology, University of the Free State.
Samples were crushed to powder for fusion discs (used for elements of major quantities) and
pressed pellets (used to measure Na and trace element contents). For the fusion discs, 10 g of
powder was heated to 110°C to dehydrate and devolatilize the sample, which was then heated
to 1050°C to break down minerals such as carbonates and produce the indicated total loss on
ignition (LOI). 0.28 g of the sample was mixed with flux (0.2445 g La2O3, 0.705 g Li2B4O7,
0.5505 g Li2CO3, and 0.02 g NaNO3), melted at 1000°C for approximately 5 min in a Pt
crucible and cast into a disc. The pressed pellet was prepared by adding 8 g of the sample to 3
g of Hoechst wax (C6H8O3N2), mixing for 20 min in a Turbula mixer to ensure homogeneity
and pressed at > 395 N/m2.

Chemical analyses were conducted using a PANalytical Axios WD-XRF machine, with
an Rh end window tube, 4 kW Rh anode, and a W cathode filament (Department of Geology,
University of the Free State). The applications included “IGS majors”, “UIC traces” and
“Sodium only.” Zn, Zr, P, Cd, and Ag were measured for correction of line overlaps. Raw
data were processed with X-ray analyses software SuperQ 4.0R with the toolbox for trace
elements Pro-Trace (PANalytical B.V.).
4.3. Energy-dispersive micro-X-ray fluorescence spectrometry (µ-ED-XRF)
The interior of a sample of dolerite was mapped for element distribution using a Bruker
M4 Tornado μ-ED-XRF spectrometer at the Stoneman Laboratory, University of Pretoria.
The instrument has a large analytical area, up to 20 x 16 cm, and can hold a mass of up to 5
kg, so samples for were cut and ground flat with no further sample preparation. Elemental
imaging is characterized with a complete element spectrum for each pixel, and the processed
image can be assembled from the addition of user-selected element spectra.
The instrument was configured with a Rhodium tube operated at 50 kV, 500 μA and 30
W. The polychromatic beam (0–50 keV) was focused by means of a polycapillary lens to a
spot size of < 25 μm at this wavelength, with the incident beam and take-off angles at 51°.
The instrument is equipped with two silicon drift detectors with an energy resolution of 145
eV for Mn Kα, which face each other at a 180° angle and 90° to the tube with respect to the
sample surface. The sample chamber was evacuated to < 20 mbar to enable light elements
such as sodium to be measured. Typically, step size and integration time per pixel were set to
100 µm and 50 ms. Selected smaller areas were scanned at a step size of 50 µm, for greater
resolution.
4.4. Electron backscatter diffraction (EBSD) analysis

Crystallographic orientation mapping of deformed zircon and monazite grains by EBSD
was performed at the Laboratory for scanning electron microscopy and focused ion beam
applications at the University of Vienna, Austria.
The thin section sample was chemo-mechanically polished using Struers OP-S
Suspension of colloidal silica, and a rotary-head polishing machine. The polished sample was
carbon-coated with a thin carbon layer (5-10 nm). Orientation contrast images were produced
using an FSE detector mounted on the EBSD-tube of an FEI Quanta 3D FEG instrument,
equipped with a Schottky field emission electron source, an EDAX Pegasus Apex 4 system
consisting of a Digiview IV EBSD camera and an Apollo XV silicon drift detector for EDX
analysis. Electron beam conditions for analyses were 15 kV accelerating voltage, 4 nA probe
current using the analytic mode. Stage settings were at 70° tilt and 14 mm working distance.
After potentially deformed crystals were identified based on orientation contrast images,
EBSD crystallographic orientation mapping was applied to selected zircon and monazite
crystals. An EBSD camera binning of 4 x 4 was used to index single frame data at 49 ms
exposure time, reaching indexing rates of ca. 20 points per second. The Kikuchi pattern
contrast was improved by applying both static and dynamic background subtraction and
intensity histogram normalization. Hough transformation settings were at 120 x 120 pixels
binned pattern size and 1° Theta step size, while the Rho fraction was limited to the inner
88% of the Kikuchi pattern. A 9 x 9 convolution mask was applied to index 3 – 15 peaks with
a minimum peak distance of 8 pixels in Hough space. The following lattice parameters were
used for reference: Zircon, di-tetragonal, Laue group 4/mmm, a=b=6.612 Å, c=5.983 Å,
ɑ=β=γ=90° (Finch et al., 2001); Monazite: monoclinic prismatic, Laue group 2/m, a=6.79 Å,
b=7.02 Å, c=6.467 Å, ɑ=γ=90°, β=103.38° (Ni et al., 1995). Map data were collected in
hexagonal grid mode using step sizes of 220 nm for the zircon map, and 120 nm for the
monazite map. The EDX intensities and EBSD data were collected simultaneously using

OIM v7.3 data collection software. The EBSD data were re-indexed, plotted and analysed
with EDAX OIM v7.3 analysis software. Data re-indexing was assisted by assigning data
points to phases based on selected EDX intensity ranges in EDX energy regions of interest.
Crystal orientation maps were cleaned using the Confidence Index Standardization (CIS)
procedure, which unifies the confidence index of equally oriented points within a grain
(presuming a minimum grain size of 3 pixels in more than one row, and a tolerance angle of
5°). The Confidence Index (CI) represents the difference in the number of triangles (found
between three bands each) between the first and second orientation solution, divided by the
total number of identified triangles. No orientation data were changed during clean-up. The
data were filtered for CI > 0.05 for the zircon map and CI > 0.1 for the monazite map to
exclude single, statistically poor data points, which do not belong to a “grain.”
5. Results
5.1. XRF data: composition of target rocks and associated PT veins
Chemical analyses of two samples of dolerite, one sample of PT in dolerite without
granite clasts (Melt 1), one sample of PT in dolerite with granitic clasts (Melt 2), three
samples of massive PT from the contact zone, two samples of granite and two samples of PT
in the granite are summarized in Tables 1 and 2.
Melt 1 is geochemically close to the host dolerite, having a more mafic picro-basaltic
composition (Fig. 2A). This is consistent with the fracture toughness and breakdown
temperature values for various minerals, with the lowest values for micas, inosilicates being
in the middle, and feldspars being the toughest and the most refractory (Spray, 2010).
Therefore, it is expected that the PT melt in dolerite is depleted in Na and K compared host
dolerite (Fig. 2A), as the feldspars in dolerite should be breaking down and melting last. The
composition of Melt 2 is andesitic (Fig. 2A). It is intermediate between the compositional

range of granite and dolerite for both major and trace elements, suggesting approximately
equal mixing of granite and dolerite (Fig. 2A, B). For trace elements, the elemental
proportions are variable, possibly suggesting incomplete mixing or nugget effects. The PT
extracted from granite and massive PT from the contact zone are geochemically
indistinguishable from the analysed granite, with only a slight shift towards more mafic
compositions. The compositional shift is also consistent with preferential melting of mafic
phases prior to felsic phases, as has been documented in previous works (e.g., Wilshire,
1971).
5.2. Sample surface description and compositional mapping
A representative sample of dolerite (~10 x 14 cm) with PT veins containing both Melt 1
and Melt 2 was chemically mapped. In this sample, Melt 2 is optically slightly darker in
colour than Melt 1 (Fig. 3A-B). The largest granitic clast within Melt 2 is ~1 x 2 cm in size,
irregularly-shaped, rounded at the edges, and is composed primarily of quartz and feldspar,
with some biotite and accessory apatite. Numerous smaller (< 2 mm) fragments of quartz and
feldspar are present within Melt 2. Coarse-grained areas of the dolerite in the centre of the
sample are surrounded by PT veins and either represent a variation of grain size in host
dolerite, or exotic gabbroic clasts (Fig. 3D). For further details about the microstructures of
the Melt 1 PTs in the dolerite, see Kovaleva et al. (2018).
Compositional mapping by µXRF confirms the existence of two distinct compositional
domains of PT (Fig. 3C-D). Melt 1 is homogeneous in composition. Coarse-grained dolerite
clasts are found within Melt 1. Melt 2 contains conspicuous fine-grained and coarse-grained
inclusions of dolerite (Fig. 3C-D). Si-rich clasts in Melt 2 are compositionally distinct from
the host rock (Fig. 3C-D) and are absent in Melt 1.
Between Melt 1 and Melt 2, a sharp boundary is defined by a compositional shift in Ba,
Ca, Co, Fe, K, Mn, Si, and Sr, which is likely a result of the immiscible mingling of the two
melts (Fig. 3C, lower left to top centre). An enrichment of K, Sr, and Si in Melt 2 (Fig. 3D) is
consistent with disaggregated and melted quartz and K-feldspar from granite. A depletion in
Fe and Ca in Melt 2 points to a dilution of a mafic component. A lens of Melt 2 ~1 cm long is
completely enclosed in Melt 1 within the surface of the sample (Fig. 3A, arrow).
5.3. SEM and EBSD data: Shocked minerals
In thin section, an elongated fractured granitic clast ~8 x 3 mm within a Melt 2 vein
(Fig. 4A) consists of plagioclase, quartz, K-feldspar, and biotite. Zircon, monazite, apatite,
and FeO are accessory phases (Fig. 4B). The clast contains adjacent grains of shocked zircon
and monazite (Fig. 5).
The euhedral zircon grain is 70 x 45 µm and is fractured in the central part with small
displacements. Zircon preserves initial growth zoning (non-indexed zones in Fig. 5A) and
hosts a number of (sub)grains that are up to 5 µm in diameter and have a cumulative
misorientation of > 15°. These (sub)grains are isometric to elongate and are concentrated
along fractures or at fracture intersects. Besides, zircon grain contains one discontinuous
microtwin lamella, 300–500 nm thick, and is 25 µm long in its longest section. The lamella is
crystallographically rotated by 65° with respect to the host crystal, sharing one of the <110>
axes with the host (Fig. 5B).
The monazite is adjacent to the zircon grain, has a sub-angular shape, and is 20 x 15 µm
in size. The monazite displays moderate crystal-plastic deformation (> 15° intragranular
misorientation) with a checkerboard lattice distortion pattern and hosts two sets of short (< 5
µm), up to 1 µm thick, irregularly-spaced microtwin lamellae (Fig. 5C). Both twin sets in
monazite are rotated crystallographically by 180° with respect to the host, sharing the [010]

axis with the host crystal, while twin lamellae set 1 also shares the [001] axis (Fig. 5D). Axes
[100] of both sets are symmetrically rotated about [100] of the main grain by ~25°. Grain
boundary analyses show that twin set 1 is rotated about the [100] crystallographic axis,
whereas set 2 is rotated about the [104] crystallographic axis of the host crystal, thus giving
the twin relationships 180°/[100] and 180°/[104] respectively.
6. Discussion
6.1. Nature of the dolerite-hosted veins
The dolerite-hosted veins have qualities consistent with forming as a melt rather than as
a cataclasite. Some researchers have stated that the original nature of the veins in Vredefort
cannot be distinguished due to recrystallization and overprinting of veins (e.g., Reimold,
1995; Reimold and Gibson, 2005). Although this lack of distinctiveness holds true in many
examples, in the case of the dolerite-hosted PT veins examined in this study, several lines of
evidence point to the presence of melt rather than cataclasite. Firstly, the inclusion of
relatively large granitic clasts compared to the thickness of the veins up to distances of 13 m
from the visible dolerite-granite contact shows that the conditions allowed for the flow of
material without mechanical disaggregation as might be expected in a cataclasite. Secondly,
the mingling structures at the compositional boundary between Melt 1 and Melt 2 (Fig. 3)
suggest the existence of two immiscible fluids in contact with one another. Thirdly, the
intermediate chemical composition of Melt 2 between basaltic and dacitic (Fig. 2) suggests
efficient compositional mixing of granite and dolerite, which is most likely achieved by a
melt. Additional textural relationships are described by Kovaleva et al. (2018).
6.2. Exotic clasts in pseudotachylite

In this study, we observed an unusual relationship between PT and host rocks that
appears to contradict traditional thinking on PT formation in Vredefort (Reimold et al., 2016;
2017). In natural samples, PT vein compositions have repeatedly been shown to correspond
to the host rock (Harris et al., 2013; Reimold et al., 2016, 2017), and have been suggested to
form exclusively in situ without any significant material transport (Mohr-Westheide and
Reimold, 2010; Reimold et al., 2017). At least one study, however, expressed the opposite
opinion that pseudotachylite could represent allochtonous melt (Lieger et al., 2011).
Our data demonstrate that abundant exotic clasts can be transported within PT melt
veins for distances of at least tens of metres. This is unlike similar occurrences reported in the
Vredefort structure, where compositionally mixed PTs develop along a contact between
contrasting lithologies, e.g., granite and amphibolite in contact at the Kudu quarry (Reimold
et al., 2016). In that case, the PT is parallel to the lithological contact and contains clasts
derived from both walls. Notably, the massive PT developed along the contact in the present
study does not show mixed composition, but is granitic (Fig. 2, Table 1). In another Vredefort
location (the Otavi quarry), PT is hosted by granite gneisses and contains a few large rounded
clasts of dolerite (Reimold et al., 2016). There, the PT veins are several metres thick, and thus
the inclusion of dolerite clasts is likely caused by the total disaggregation of a small dolerite
dyke or sill and its incorporation into a larger melt dyke, rather than transmission of clasts
through a narrow PT vein. Field examinations of the area around the Otavi quarry by us and
previous researchers (Reimold et al., 2016), have not revealed the location of the dolerite
parent body, suggesting that it was completely disaggregated and incorporated within a
massive PT dyke with a predominantly granitic composition.
6.3. Nature vs. experiment

Kenkmann et al. (2000) experimentally shocked a composite sample of dunite and
quartzite, thereby generating melt along the contact. In the experimental product, the melt
intruded into one of the two adjacent lithologies and terminated as clast-bearing injection
veins. This provides a similar case to the observations of dolerite in contact with granite
described in our study. The different response to the pressure waves propagation by granite
and dolerite created a thick zone of clast-laden melt between the two.
However, the findings of Kenkmann et al. (2000) show that the injection veins more
frequently intrude into quartzite, because the higher shock velocity within dunite enhanced
material transport from mafic to felsic rock, but not in the opposite direction (Heider and
Kenkmann, 2003). These observations contrast with the Vredefort outcrops reported in this
study, where firstly, PTs were developed on both sides of the lithological contact and
secondly, felsic material was transported into mafic rock, and not vice versa. In the sampled
outcrop, thousands of granitic clasts were transported sufficiently far into a dolerite-hosted
PT to allow their incorporation into dolerite melt (Figs. 2, 3). The substantial difference
between experimental and field observations show that either the lithological differences
between nature and experiment (granite-dolerite vs. quartzite-dunite interface, respectively)
substantially changes the nature of the interaction, or that not all natural factors could be
accounted for in a small-scale experiment. Importantly, the experimental work of Kenkmann
et al. (2000) was performed on rocks that were not under lithostatic pressure, as opposed to
the deeply buried rocks at Vredefort. Both rock types in the experiment thus would have been
in the brittle deformation regime, whereas in the case presented here, the granite was in a
ductile deformation regime, while the adjacent dolerite was close to the brittle regime
(Kovaleva et al., 2018).
Moreover, the duration of experiment was only several seconds before the sample was
quenched, which did not allow for further development of PT that occurs in the impact

process, where the rocks continue experiencing post-shock deformation effects after the
impact (i.e., central uplift collapse, crater modification, post-impact thermal overprint, etc.).
Discrepancies between natural observations and experimental products may also suggest that
a previously undocumented and/or unconsidered mechanism(s) affected PTs development
during the Vredefort impact event. The missing mechanism(s) can be constrained based on
the field relationships, the timing of deformation, and the composition of the rocks involved.
6.4. Field constraints
The geometry of the system was constrained based on field relationships. The
pseudotachylite that rings the dolerite outcrop has a large exposure. In total, an area of ca. 8
000 m2 of dolerite outcrops, enclosed into pseudotachylite with granitic composition, was
investigated in the field. The zone of massive PT developed at the lithological contact
contains disaggregated clasts of granite, but not dolerite. There is no evidence of dolerite
migrating into granite in the field observations, hand sample observations, or in the
geochemical analyses (Fig. 2). This melt zone could be analogous to the early PTs produced
in experiments of Kenkmann et al. (2000) and is a reasonable source of granite clasts injected
into dolerite-hosted PT veins.
The thickness and frequency of PT veins in dolerite are greatest near the contact and
have the highest abundance of exotic granite clasts. Dolerite outcrops > 12–13 m from the
contact with granite have either no PT veins or thin (< 1 cm thick) veins filled with Melt 1
with no exotic clasts. Although we cannot constrain the vertical component (i.e., the amount
of dolerite that has eroded away), based on observations of the two dimensional relationships
and geophysical data (Kovaleva et al., 2018), the dolerite was most likely extending vertically
either as a diapir or as a sill. In either case, the distances to the contact in a vertical direction
would not appear to be significantly less than the observed distance to the exposed contact.

Importantly, the direction of movement of granite clasts into dolerite body was inconsistent in
every outcrop examined, where granite clasts were trapped in veins with varying orientations.
6.5. Timing constraints based on shock microstructures
The timing of events is constrained by the presence of shocked minerals within granite
clasts. Zircon {112} shock microtwins are thin lamellae that are rotated by 65° about the
[110] axis of the host zircon (Cavosie et al., 2015; Moser et al., 2011), consistent with the
lamellae observed in this study. Shocked monazite has at least 12 distinct documented
orientations of shock microtwins (Erickson et al., 2016, 2017), of which, the 180º/[100]
relationship is present in shock twin set 1. The geometry of shock twin set 2 (180°/[104]) has
not been described previously, thus representing a new shock twin relationship.
This shock deformation must have occurred prior to fragmentation and granite clast
incorporation into the dolerite. Extreme differential stress, required to form shock microtwins
in zircon (Jones et al., 2018), most likely corresponds to the interaction of the rarefaction
wave with the shock wave (Cox et al., 2018; Huber and Kovaleva, 2019). Because the host
PT vein could not have formed before the passage of the shock wave, the granite must have
been shocked before its fragments were incorporated into the PT vein. Therefore, the
presence of shocked monazite and zircon strongly suggests that these events took place in the
following order: 1) shock deformation of zircon and monazite; 2) disaggregation of the host
granite, liberating the clast hosting shocked minerals; 3) transport and inclusion of the granite
clasts into dolerite-hosted PT veins.
6.6. Material mixing model
6.6.1. Difference in deformation regimes

To drive material from one lithology towards another at depth, a driving force must be
present, and that force must have been related to the conditions of the two lithologies during
and immediately after the shock event. A schematic diagram showing the material migration
process is presented in the Figure 9.
The granite and dolerite were most likely located at depths of 10–15 km before the
impact, where the granite was close to the brittle-ductile transition, and the dolerite was in the
brittle regime (Kovaleva et al., 2018). Fluctuating stresses during the post-shock
reverberations following the passage of the primary shock wave initiated brittle fracturing in
dolerite, cataclasis and melting followed by incipient opening of the fractures (see below).
6.6.2. Role of quartz in fracturing
A key compositional difference in the sampled outcrops is the presence of quartz in the
granite and absence in the dolerite. Post-shock elevated temperatures (Kenkmann et al.,
2000; Potter et al., 2013) must transform silica to high-temperature polymorphs (Fig. 6; e.g.,
Hartlieb et al., 2016), including β-quartz (573ºC at atmospheric pressure), tridymite (870ºC at
atmospheric pressure), and β-cristobalite (900ºC at atmospheric pressure; Ohno et al., 2006;
temperatures of phase transitions at varying pressure can be read from Fig. 6). The molar
volume of α-quartz is 22.688 cm3/mol, and β-quartz is 23.865 cm
3/mol (Swamy and Saxena,
1994; Fig. 7). Tridymite can exist in multiple crystal systems, ranging in volume from 26.530
cm3/mol to 27.510 cm
3/mol (Swamy and Saxena, 1994). Αlpha-cristobalite is 25.739
cm3/mol, and β-cristobalite is 27.40 cm
3/mol (Swamy and Saxena, 1994). In experiments,
these phase transitions occur instantaneously with the onset of elevated temperatures and
cumulatively result in as much as 37 vol. % thermal expansion of SiO2 (Ringdalen, 2014),
and substantially more thermal expansion of granite directly compared to basalt (Hartlieb et

al., 2016). Basement granitoids within the Vredefort structure have up to 50% quartz content,
which would potentially result in volume expansion in granite up to 18.5%.
At pressures up to 2-4 GPa, the transition temperatures vary insignificantly, increasing
with increasing pressure; and above the 2-4 GPa pressure range, all silica phases transform to
coesite (Fig. 6). Evidence of the SiO2 phase transition to cristobalite and tridymite are known
in many younger impact structures and should occur in all shock metamorphic settings (e.g.,
Ferrière et al., 2009). Unfortunately, at Vredefort, there is poor preservation of SiO2 phase
transitions due to the well-documented post-impact thermal overprint (e.g., Gibson et al.,
1998, 2002; Kamo et al., 1996; Martini, 1978; 1991; Reimold et al., 2002). Grossly
recrystallized and partially molten quartz clasts from the PT in granite are shown in optical
images in Figure 8; similar textures are presented in Reimold et al. (2016) from a different
Vredefort locality.
The volumetrically larger high-temperature phases induced a volume imbalance in the
crust, as the expanded granite needed to be spatially accommodated. As the granite was under
high confining pressure, the only direction of accommodation would be vertical. Meanwhile,
the dolerite body that was entirely enclosed within the granite did not experience internal
volume expansion. Dolerite was dragged and deformed by the expanding host granite, with
extension accommodated by brittle fractures. The dilation of fractures would cause a negative
pressure gradient that would allow for material (clasts and melt) migration from the
surrounding granitic pseudotachylite envelope (Fig. 9).
In impact conditions, granitic melt can obtain low enough viscosity to migrate rapidly
(Melosh, 2005). Thus, the andesitic composition of some of the veins in dolerite could have
been achieved not only by migration and partial incorporation of granite clasts, but also by
mixing with granitic melt, which was possible at initial impact-generated temperatures, and
consistent with our observations (Fig. 3). When the system cooled and collapsed, the

fractures closed, which allowed for the clasts that are larger in diameter than their host veins
to be present in the dolerite (Fig. 4a).
These mechanisms predict that material transport between lithologies is more likely to
occur from a felsic rock to a mafic rock and may also explain the observations of a more
felsic PT composition in some mafic hosts (e.g., Wilshire, 1971), and granite clast transport
into dolerite-hosted PT veins.
7. Conclusions and Implications
Presently, 200 impact structures are known on Earth (Schmieder and Kring, 2020).
Practically all of the impact structures formed in targets of mixed lithology. Experimental and
numerical studies on impact events often focus on the effects of shock deformation using a
simplified, essentially homogeneous target composition. Our work shows that mixing of
material can occur during the cratering process, even at the deep stratigraphic levels. This
interaction of lithologies is not well understood.
This study demonstrates that PTs might not have the same composition as their host
rocks, despite repeated studies from numerous groups demonstrating the compositional
similarity between host rock and PT vein (therefrom “monomict breccia”). A possible reason
for such discrepancy is that the majority of the studies in Vredefort have focused on granite-
hosted PT veins. In order to study the effect of material transport in PT veins, it is necessary
to find host lithologies that are not homogeneous. We suggest that literature describing the
similarity of PTs and their host rocks may not always be applicable to large impact structures
with inhomogeneous target rocks.
Acknowledgments

This work was supported by the National Research Foundation (NRF) [grant numbers
98443, 106511], received by E.K. We are grateful to C. van Rensburg and A.J. van Coller for
the access to outcrops. We acknowledge J. Choane for preparing the samples and M.
Purchase for obtaining the XRF data. L. Pittarello is acknowledged for her useful comments
and discussions. Thanks to G. Habler for assisting in EBSD data collection and processing,
and for her useful comments. W.U. Reimold and N. Timms are thanked for commenting on
the earlier versions of this work. R. van der Westhuizen prepared an illustration for this study
(Fig. 9). We are grateful to L. van der Westhuizen for the proof-reading of the final version of
the manuscript. The editor M. Scambelluri is thanked for his editorial handling and reviewers
A. Garde, P. Buchanan and J. Melosh are acknowledged for their useful comments and
suggestions.

References
Bisschoff, A.A., 1988. The history and origin of the Vredefort Dome. Suid-Afrikaanse
Tydskrif Vir Wetenskap 84, 413–417.
Buchanan, P.C., Reimold, W.U., 2002. Planar deformation features and impact glass in
inclusions from the Vredefort Granophyre, South Africa. Meteoritics & Planetary
Science 37, 807–822.
Cavosie, A.J., Erickson, T.M., Timms, N.E., Reddy, S.M., Talavera, C., Montalvo, S.D.,
Pincus, M.R., Gibbon, R.J., Moser, D., 2015. A terrestrial perspective on using ex situ
shocked zircons to date lunar impacts. Geology 43, 999–1002.
Cox, M.A., Cavosie, A.J., Bland, P.A., Miljković, K., Wingate, M.T.D., 2018.
Microstructural dynamics of central uplifts: Reidite offset by zircon twins at the
Woodleigh impact structure, Australia. Geology 46, 983–986.
Erickson, T.M., Cavosie, A.J., Pearce, M.A., Timms, N.E., Reddy, S.M., 2016. Empirical
constraints on shock features in monazite using shocked zircon inclusions. Geology 44,
635–638.
Erickson, T.M., Timms, N.E., Kirkland, C.L., Tohver, E., Cavosie, A.J., Pearce, M.A.,
Reddy, S.M., 2017. Shocked monazite chronometry: integrating microstructural and in
situ isotopic age data for determining precise impact ages. Contributions to Mineralogy
and Petrology 172, 11.
Ferrière, L., Koeberl, C., Reimold, W.U., 2009. Characterisation of ballen quartz and
cristobalite in impact breccias: new observations and constraints on ballen formation.
European Journal of Mineralogy 21, 203–217.
Finch, R.J, Hanchar, J.M., Hoskin, P.W.O., Burns, P.C., 2001. Rare-earth elements in
synthetic zircon: Part 2. A single-crystal X-ray study of xenotime substitution.
American Mineralogist 86, 681–689.

Fiske, P.S., Nellis, W.J., Lipp, M., Lorenzana, H., Kikuchi, M., Syono, Y., 1995.
Pseudotachylites generated in shock experiments: Implications for impact cratering
products and processes. Science 270, 281–283.
Gibson, R.L., Reimold, W.U., Stevens, G., 1998. Thermal-metamorphic signature of an
impact event in the Vredefort Dome, South Africa. Geology 26, 787–790.
Gibson, R.L., Reimold, W.U., Ashley, A.J., Koeberl, C., 2002. Metamorphism on the Moon:
A terrestrial analogue in the Vredefort dome, South Africa? Geology 30, 475–478.
Grieve, R.A.F., Langenhorst, F., Stöffler, D., 1996. Shock metamorphism of quartz in nature
and experiment: II. Significance in geoscience. Meteoritics & Planetary Science 31, 6–
35.
Harris, C., Fourie, D. S. and Fagereng, A., 2013. Stable isotope evidence for impact-related
pseudotachylite formation at Vredefort by local melting of dry rocks. South African
Journal of Geology 116, 101–118.
Hart, R.J., Welke, H.J., Nicolaysen, L.O., 1981. Geochronology of the deep profile through
Archean basement at Vredefort, with implications for early crustal evolution. Journal
of Geophysical Research 86, 10663–10680.
Hart, R.J., Moser. D., Andreoli, M., 1999. Archean age for the granulite facies metamorphism
near the center of the Vredefort structure, South Africa. Geology 27, 1091–1094.
Hartlieb, P., Toifl, M., Kuchar, F., Meisels, R., Antretter, T., 2016. Thermo-physical
properties of selected hard rocks and their relation to microwave-assisted
comminution. Minerals Engineering 91, 34–41.
Heider, N., Kenkmann, T., 2003. Numerical simulation of temperature effects at fissures due
to shock loading. Meteoritics & Planetary Science 38, 1451–1460.

Henkel, H., Reimold, W.U., 1998. Integrated geophysical modelling of a giant, complex
impact structure: anatomy of the Vredefort Structure, South Africa. Tectonophysics
287, 1–20.
Huber, M.S., Kovaleva, E., 2019. Microstructural dynamics of central uplifts: reidite offset
by zircon twins at the Woodleigh impact structure, Australia: COMMENT. Geology
47, e465.
Ivanov, B.A., 2005. Numerical modeling of the largest terrestrial meteorite craters. Solar
System Research 39, 381–409.
Ivanov, B.A., Deutsch, A., 1999. Sudbury impact event: Cratering mechanics and thermal
history, in: Dressler, B.O., Sharpton, V.L. (Eds.), Large meteorite impacts and
planetary evolution II. Geological Society of America Special Paper 339, Boulder,
Colorado, pp. 389–397.
Jones, G., Moser, D.E., Shieh, S.R., 2018. A numerical model for twin nucleation in shocked
zircon and comparison with natural samples. Geophysical Research Letters 45, 10298–
10304.
Kamo, S.L., Reimold, W.U., Krogh, T.E., Colliston, W.P., 1996. A 2.023 Ga age for the
Vredefort impact event and a first report of shock metamorphosed zircons in
pseudotachylitic breccias and Granophyre. Earth and Planetary Science Letters 144,
369–387.
Kenkmann, T., Hornemann, U., Stöffler, D., 2000. Experimental generation of shock-induced
pseudotachylites. Meteoritics & Planetary Science 35, 1275–1290.
Killick, A.M., Reimold, W.U., 1990. Review of the pseudotachylites in and around the
Vredefort “Dome”, South Africa. South African Journal of Geology 93, 350–365.

Killick, A.M., Thwaites, A.M., Germs, G.J.B., Schoch, A.E., 1988. Pseudotachylite
associated with a bedding-parallel fault zone between the Witwatersrand and
Ventersdorp Supergroups, South Africa. Geologische Rundschau 77, 329–344.
Kovaleva, E., Huber, M.S., Fourie, F., Pittarello, L., 2018. Comparative study of
pseudotachylite microstructures in mafic and felsic rocks from the Vredefort impact
structure, South Africa. Implications for the experimental studies. South African
Journal of Geology 121, 403–420.
Kowitz, A., Güldemeister, N., Reimold, W.U., Schmitt, R.T. and Wünnemann, K., 2013.
Diaplectic quartz glass and SiO2 melt experimentally generated at only 5 GPa shock
pressure in porous sandstone: Laboratory observations and meso-scale numerical
modeling. Earth and Planetary Science Letters 384, 17-26.
LeBas, M.J., LeMaitre, R.W., Streckeisen, A., Zenettin, B., 1986. A chemical classification
of volcanic rocks based on the total alkali-silica diagram. Journal of Petrology 27, 745–
750.
Lieger, D., Riller, U., Gibson, R.L., 2011. Petrographic and geochemical evidence for an
allochthonous, possibly impact melt, origin of pseudotachylite from the Vredefort
Dome, South Africa. Geochimica et Cosmochimica Acta 75, 4490–4514.
Maddock, R.H., 1992. Effect of lithology, cataclasis and melting on the composition of fault-
generated pseudotachylites, Lewisian gneiss, Scotland. Tectonophysics 204, 261–278.
Martini, J.E.J., 1978. Coesite and stishovite in the Vredefort Dome, South Africa. Nature 272,
715–717.
Martini, J.E.J., 1991. The nature, distribution and genesis of the coesite and stishovite
associated with the pseudotachylite of the Vredefort Dome, South Africa. Earth and
Planetary Science Letters 103, 285–300.
Melosh, H.J., 2005. The mechanics of pseudotachylite formation in impact events, in:
Koeberl, C., Henkel, H. (Eds.), Impact tectonics. Springer, Berlin Heidelberg, pp. 55–
80.
Mohr-Westheide, T., Reimold, W.U., 2010. Microchemical investigation of small-scale
pseudotachylitic breccias from the Archaean gneiss of the Vredefort Dome, South
Africa, in: Gibson, L.R., Reimold, W.U. (Eds.), Large Meteorite Impacts and Planetary
Evolution IV. Geological Society of America Special Paper 465, Boulder, Colorado,
pp. 619–643.
Mohr-Westheide, T., Reimold, W.U., Riller, U., Gibson, R.L., 2009. Pseudotachylitic breccia
and microfracture networks in Archean gneiss of the central uplift of the Vredefort
impact structure, South Africa. South African Journal of Geology 112, 1–22.
Moser, D.E., 1997. Dating the shock wave and thermal imprint of the giant Vredefort impact,
South Africa. Geology 25, 7–10.
Moser, D.E., Cupelli, C.L., Barker, I.R., Flowers, R.M., Bowman, J.R., Wooden, J., Hart,
J.R., 2011. New zircon shock phenomena and their use for dating and reconstruction of
large impact structures revealed by electron nanobeam (EBSD, CL, EDS) and isotopic
U–Pb and (U–Th)/He analysis of the Vredefort dome. Canadian Journal of Earth
Sciences 48, 117–139.
Ni, Y., Hughes, J.M., Mariano, A.N., 1995. Crystal chemistry of the monazite and xenotime
structures. American Mineralogy 80, 21–26.
Ohno, I., Harada, K., Yoshitomi, C., 2006. Temperature variation of elastic constants of
quartz across the α-β transition. Physics and Chemistry of Minerals 33, 1–9.
Potter, R.W.K., Kring, D.A., Collins, G.S., Kiefer, W.S., McGovern, P.J., 2013. Numerical
modeling of the formation and structure of the Orientale impact basin. Journal of
Geophysical Research: Planets 118, 963–979.

Reimold, W.U., 1995. Pseudotachylite in impact structures – generation by friction melting
and shock brecciation? A review and discussion. Earth-Science Reviews 39, 247–265.
Reimold, W.U., Gibson, R.L., 2005. "Pseudotachylites" in Large Impact Structures, in:
Koeberl, C., Henkel, H., (Eds.), Impact tectonics. Springer, Berlin Heidelberg, pp. 1–
53.
Reimold, W.U., Colliston, W.P., 1994. Pseudotachylites of the Vredefort Dome and the
surrounding Witwatersrand Basin, South Africa, in: Dressler, B.O., Grieve, R.A.F.,
Sharpton, V.L. (Eds.), Large Meteorite Impacts and Planetary Evolution. Geological
Society of America Special Paper 293, Boulder, Colorado, pp. 177–196.
Reimold, W.U., Leroux, H., Gibson, R.L., 2002. Shocked and thermally metamorphosed
zircon from the Vredefort impact structure, South Africa: a transmission electron
microscopic study. European Journal of Mineralogy 14, 859–868.
Reimold, W.U., Hoffmann, M., Hauser, N., Schmitt, R-T., Zaag, P.T., Mohr-Westerheide, T.,
2016. A geochemical contribution to the discussion about the genesis of impact-related
pseudotachylitic breccias: Studies of PTB in the Otavi and Kudu Quarries of the
Vredefort Dome support the “In Situ Formation” hypothesis. South African Journal of
Geology 119, 453–472.
Reimold, W.U., Hauser, N., Hansen, B.T., Thirlwall, M., Hoffmann, M., 2017. The impact
pseudotachylitic breccia controversy: Insights from first isotope analysis of Vredefort
impact-generated melt rocks. Geochimica et Cosmochimica Acta 214, 266–281.
Riller, U., Lieger, D., Gibson, R.L., Grieve, R.A.F., Stöffler, D., 2010. Origin of large-
volume pseudotachylite in terrestrial impact structures. Geology 38, 619–622.
Riller, U., IODP–ICDP Expedition 364 Science Party, 2018. Rock fluidization during peak-
ring formation of large impact structures. Nature 562, 511–518.
Ringdalen, E., 2014. Changes to quartz during heating and the possible effects on Si
production. Journal of the Minerals, Metals & Materials Society 67, 484–492.
Schmieder, M., Kring, D.A., 2020. Earth’s Impact Events Through Geologic Time:
A List of Recommended Ages for Terrestrial Impact Structures and Deposits. Astrobiology
20, 91–141.
Schreyer, W., 1983. Metamorphism and Fluid Inclusions in the Basement of the Vredefort
Dome, South Africa: Guidelines to the Origin of the Structure. Journal of Petrology 24,
26–47.
Spray, J.G., 2010. Frictional melting processes in planetary materials: From hypervelocity
impact to earthquakes. Annual Review of Earth and Planetary Science 38, 221–254.
Spray, J.G., Kelley, S.P., Reimold, W.U., 1995. Laser-probe 40
Ar/39
Ar dating of coesite- and
stishovite-bearing pseudotachylytes and the age of the Vredefort impact event.
Meteoritics 30, 335–343.
Swamy, V., Saxena, S., 1994. A thermodynamic assessment of silica phase diagram. Journal
of Geophysical Research 99, 11787–11794.
Thompson, L.M., Spray, J.G., 1996. Pseudotachylyte petrogenesis: constraints from the
Sudbury impact structure. Contributions of Mineralogy and Petrology 125, 359–374.
Willemse, J., 1937. On the old granite of the Vredefort Region and some of its associated
rocks. Transactions of the Geological Society of South Africa 40, 43–119.
Wilshire, H.G., 1971. Pseudotachylite from the Vredefort Ring, South Africa. The Journal of
Geology 79, 195–206.
Youssof, M., Thybo, H., Artemieva, I.M., Levander, A., 2013. Moho depth and crustal
composition in Southern Africa. Tectonophysics 609, 267–287.

Figure Captions
Figure 1. Sampling locality and photographs of the outcrops. A: Inlay of South Africa
with the location of the Vredefort Dome, and simplified geological map of the Vredefort
structure, modified after Buchanan and Reimold (2002). The sampling locality is marked
with a white cross. B: Dolerite outcrop with PT vein network. A black arrow denotes rounded
granite clasts. C: Dolerite outcrop with 2 types of veins: Melt 1 (dark-brown) contains
dolerite clasts, Melt 2 (pink) contains multiple mm-size granite clasts, as well as dolerite
clasts. D: Outcrop of the massive PT with granite clasts at the contact between granite (left,
not seen in the photograph) and dolerite (right).
Figure 2. WD-XRF analyses results. A: Total alkali-silica classification of samples in
this study (LeBas et al., 1986). B: Trace element concentrations in rocks of this study. Melt 1
is slightly more mafic than the host dolerite, whereas Melt 2 systematically shifts towards
granitic composition. PTs from the contact zone and within the granite have a composition of
the host granite.
Figure 3. PTs in dolerite. A: Photograph of a sample surface with PT veins and a large
(~24 mm in length) rounded granitic clast. Arrow points to a lens of Melt 2 within the Melt 1.
B: Schematic sketch of the sample surface shown in (A). Host dolerite is in grey, “Melt 1” is
a lighter melt phase with no granitic clasts, “Melt 2” is a darker melt with a granitic clast
coded by “+”. Areas for (C) and (D) are indicated. C: Chemical map of combined Si, Sr, and
Ba. The host dolerite contains PTs with Melt 1 (orange, right). The contact with Melt 2 is in
light-blue, numerous clasts of granitic affinity are in light-blue (left). D: Chemical map of
combined Si, K, Rb, and Sr. The large granite clast with smaller granitic fragments within the
Melt 2 are visible (pink and light-blue, top left, bottom centre). The vein network hosts clasts
of coarse-grained dolerite (gabbro) distinct from the finer-grained host dolerite, suggesting

that coarse-grained dolerite analogue composes another type of exotic clast. The Si-K-rich
light-green lens separating Melt 1 and Melt 2 is visible (top right).
Figure 4. The petrological context for the analysed shocked minerals. A: Photograph of
the thin section of dolerite with the PT vein (black) that contains granitic clasts (light). Area
for (B) indicated by a rectangle. B: Backscattered electron image of a granitic clast within the
melt vein in dolerite. Arrows indicate veinlets of melt, injecting into granite clast. Mineral
abbreviations: Ap = apatite, Bt = biotite, Kfs = K-feldspar, Mnz = monazite, Pl = plagioclase,
Q = quartz, Zrn = zircon.
Figure 5. EBSD data on shocked minerals. The petrological context is shown in Fig. 4.
A: Cumulative misorientation EBSD map of zircon, arrows point to discontinuous twin
lamella. B: Equal-area lower hemisphere projection pole figures, showing [001] and <110>
axes of the host grain (blue to white) and microtwin lamellae (red to white). Black points are
zircon domains, which are not color-coded. C: Cumulative misorientation EBSD map of
monazite adjacent to zircon in (A). Arrows point to two sets of microtwin lamellae, color-
coded green and red. D: Pole figures of [001], [010] and [100] axes of the host grain (blue to
white) and microtwin lamellae (green and red).
Figure 6. Phase transition diagram for SiO2, after Swamy and Saxena (1994). A
hypothetical clockwise P-T path for quartz in granite is shown by a dashed blue line, and the
path for quartz in pseudotachylite in granite is shown by a solid red line. The red and blue
triangles represent the relative molar size of the SiO2 phase with respect to ɑ-quartz (black
empty triangle); see also Figure 7. Molar volumes for SiO2 phases are from Swamy and
Saxena (1994). P-T conditions: starting conditions calculated as 100–150 MPa and 400ºC
based on pre-impact depth of 10–15 km (Schreyer, 1983; Gibson et al., 1998), and post-shock
temperatures from Ivanov (2005) and Ivanov and Deutsch (1999). Crs = cristobalite.
Figure 7. Histograms representing molar volumes of the discussed SiO2 phases. These
phase transitions would be experienced by SiO2 in an impact event, with the pre-shock alpha
quartz on the left, and subsequent phases in expected order of transition.
Figure 8. Optical plane-polarized images of recrystallized and partially molten quartz
textures, preserved in the clasts in pseudotachylite veins in granite. In D and F resorption of
clasts occurs along the semi-circular boundaries, which could potentially be remnants of
ballen texture.
Figure 9. Schematic sketch summarizing the incorporation process of granitic clasts
into dolerite-hosted PTs. Stage 1: the shock wave passes, shock wave forms initial PT at the
contact and within granite and dolerite. Minerals are shocked at this stage. Post-shock
reverberations cause fracturing of the dolerite while the temperature of the system increases
(Kenkmann et al., 2000; Ivanov, 2005; Riller et al., 2018). Stage 2: SiO2 transitions from α-
quartz to β-quartz, tridymite and, locally, β-cristobalite, resulting in significant volume
expansion, driving the further development of the PT zone between gabbro and granite, and
initiating more fractures within dolerite. The opening of fractures creates a negative pressure
gradient within the dolerite body. Granite fragments and melt are injected into the adjacent
dolerite. Stage 3: Granitic clasts are transported through the dolerite-hosted PTs. As
temperature decreases, SiO2 transitions back to α-quartz and fractures in dolerite narrow,
trapping the granite clasts inside.


Rock Dolerite
Melt 1 = vein
in dolerite
(no granite
clasts) Dolerite
Melt 2 = vein
in dolerite
with granite
clasts
Massive PT at the contact
zone Granite PT veins in granite
Sample
N
DGP16-
09 DGP16-09-V
DGP16-
11 DGP16-11B
CZD
18-01
CZD
18-02
CZD
18-03
GPT17-
01 H1
GPT17-
01 H2
GPT17-01
V1
GPT17-01
V2
SiO2 48.59 44.4 50.51 59.17 68.73 67.51 67.35 68.81 69.76 68.16 67.97
TiO2 2.51 2.36 2.43 1.51 0.49 0.5 0.56 0.4 0.35 0.46 0.52
Al2O3 12.08 11 11.43 12.61 15.34 15.58 15.14 14.98 15.61 13.99 15.19
Fe2O3 18.33 17.84 18.81 12.37 3.42 3.42 3.95 5.66 3.3 4.05 4.4
MgO 4.95 4.73 4.97 3.57 0.95 0.78 1.41 0.24 0.55 1.37 1.37
MnO 0.22 0.12 0.13 0.09 0.02 0.02 0.04 0.04 0.03 0.05 0.08
CaO 8.88 7.66 8.69 6.28 2.04 1.89 2.34 1.93 1.99 2.29 2.24
Na2O 2.29 - 2.62 2.805 4.04 4.23 3.56 4.69 4.91 4.17 4.26
K2O 1.04 1.26 1.2 2.01 2.89 3.42 2.83 2.5 2.76 2.85 2.99
P2O5 0.45 0.38 0.34 0.28 0.21 0.22 0.19 0.16 0.18 0.2 0.22
LOI 0.43 0.45 -0.26 0.71 0.68 0.7 1 0.6 0.26 0.64 0.73
Total 99.76 90.20 100.84 98.61 98.82 98.26 98.38 100.00 99.68 98.21 99.98
Table 1. WD-XRF analyses results (major elements), wt % oxides. LOI = loss on ignition, a measure of the weight loss when a sample is heated to
1050°C, expressed as wt%. The total of the DGP16-09-V is low, as the size of the analyzed sample was relatively small due to the difficulty of
separation of the vein from the bulk sample. For the same reason, Na was not analyzed for this sample, as well as trace elements (see Table 2).
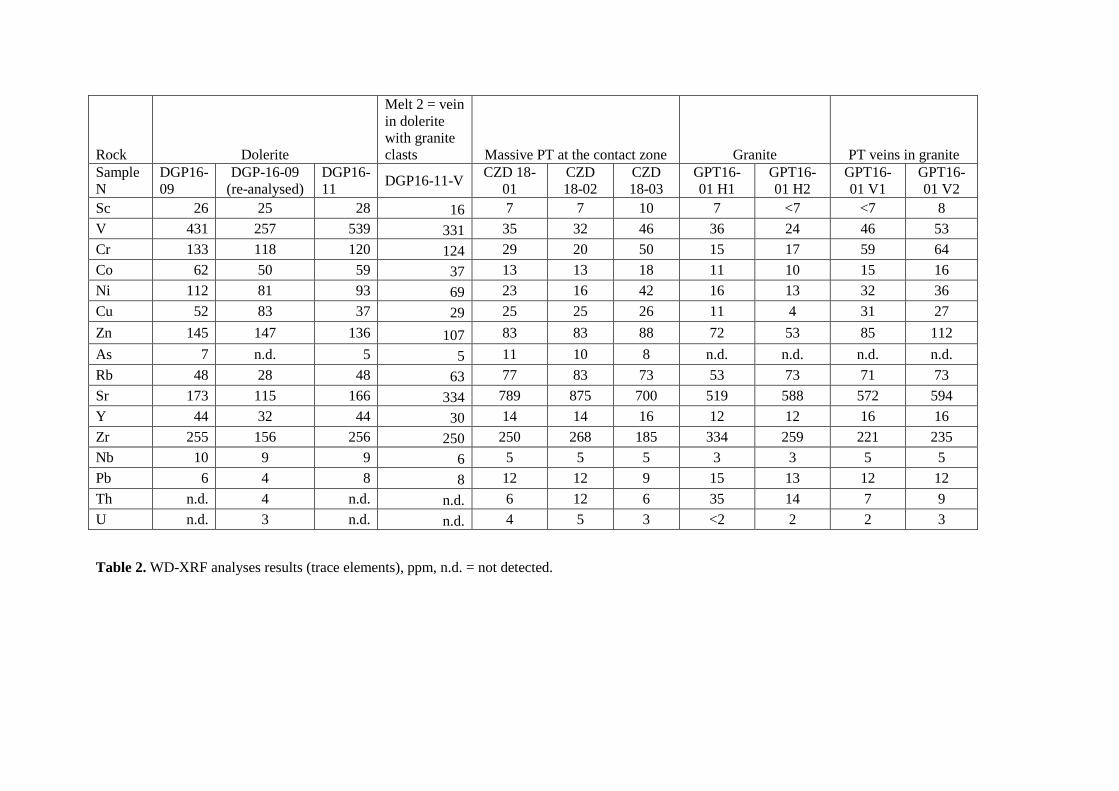
Rock Dolerite
Melt 2 = vein
in dolerite
with granite
clasts Massive PT at the contact zone Granite PT veins in granite
Sample
N
DGP16-
09
DGP-16-09
(re-analysed)
DGP16-
11 DGP16-11-V
CZD 18-
01
CZD
18-02
CZD
18-03
GPT16-
01 H1
GPT16-
01 H2
GPT16-
01 V1
GPT16-
01 V2
Sc 26 25 28 16 7 7 10 7 <7 <7 8
V 431 257 539 331 35 32 46 36 24 46 53
Cr 133 118 120 124 29 20 50 15 17 59 64
Co 62 50 59 37 13 13 18 11 10 15 16
Ni 112 81 93 69 23 16 42 16 13 32 36
Cu 52 83 37 29 25 25 26 11 4 31 27
Zn 145 147 136 107 83 83 88 72 53 85 112
As 7 n.d. 5 5 11 10 8 n.d. n.d. n.d. n.d.
Rb 48 28 48 63 77 83 73 53 73 71 73
Sr 173 115 166 334 789 875 700 519 588 572 594
Y 44 32 44 30 14 14 16 12 12 16 16
Zr 255 156 256 250 250 268 185 334 259 221 235
Nb 10 9 9 6 5 5 5 3 3 5 5
Pb 6 4 8 8 12 12 9 15 13 12 12
Th n.d. 4 n.d. n.d. 6 12 6 35 14 7 9
U n.d. 3 n.d. n.d. 4 5 3 <2 2 2 3
Table 2. WD-XRF analyses results (trace elements), ppm, n.d. = not detected.