plate impact experiments to investigate shock-induced ... · plate impact experiments to...
TRANSCRIPT

International Journal of Rock Mechanics & Mining Sciences 60 (2013) 277–287
Contents lists available at SciVerse ScienceDirect
International Journal ofRock Mechanics & Mining Sciences
1365-16
http://d
n Corr
E-m
vikas.pr
journal homepage: www.elsevier.com/locate/ijrmms
Plate impact experiments to investigate shock-induced inelasticityin Westerly granite
Fuping Yuan a,b, Vikas Prakash a,n
a Case School of Engineering, Department of Mechanical and Aerospace Engineering, Case Western Reserve University, Cleveland, OH 44106-7222, USAb State Key Laboratory of Nonlinear Mechanics, Institute of Mechanics, Chinese Academy of Sciences, Beijing 100190, China
a r t i c l e i n f o
Article history:
Received 25 January 2012
Received in revised form
22 July 2012
Accepted 21 December 2012Available online 28 February 2013
Keywords:
Westerly granite
Plate impact
Shock response
Spall strength
Soft recovery experiments
Micro-cracking
Fragmentation
09/$ - see front matter & 2012 Elsevier Ltd. A
x.doi.org/10.1016/j.ijrmms.2012.12.024
esponding author. Tel.: þ1 216 368 6440.
ail addresses: [email protected] (F. Yu
[email protected] (V. Prakash).
a b s t r a c t
In the present study, plate-impact experiments are employed to better understand the stress threshold
for inelasticity in Westerly granite. The experiments are designed to obtain the Hugoniot Elastic Limit
(HEL) as well as spall strength following shock-induced compression in the Westerly granite samples.
The HEL for Westerly granite is estimated to be in the range 3.2 to 3.5 GPa, while the spall strength is
�50 MPa for a pulse duration of 3 ms, and is nearly independent of the compression stress level in the
stress range employed in the experiments (i.e. 0.7–5.0 GPa). In addition, soft-recovery plate-impact
experiments are employed to better understand the threshold for initiation of micro-cracking in the
granite samples. These recovery experiments are conducted at the same stress levels as the normal
plate impact experiments (�0.7 GPa), and the duration of the tensile pulse is varied from 20 to 500 ns
by varying the pre-set gap between the specimen and the momentum trap. The results indicate that the
stress pulse duration threshold for initiation of spall is about 120 ns at an applied tensile stress level of
�0.7 GPa. In addition, tensile fracture in Westerly granite is observed to be time dependent with the
spall strength dependent on the duration of the tensile pulse. For the soft recovery experiments that do
not show a clear spall signal, the recovered granite specimens show relatively large micro-cracks (30–
40 mm in width) near the plane where the unloading waves from the flyer and target free surfaces
intersect. The spall plane reveals a relatively rough and a tortuous fracture surface. At higher
magnifications, several cracks and pits/holes are detected on the spall plane. The fracture/damage
mode is seen to be predominantly brittle, with damage initiating at the weak grain boundaries.
& 2012 Elsevier Ltd. All rights reserved.
1. Introduction
Shock-induced response of geological materials has been thefocus of attention for last several decades due to its applicationsin planetary impact, explosive crater formations, response of geo-materials to blast/explosive loading, rock fragmentation research[1–9], to name a few. In these applications strain rates of theorder of 105 s�1 and higher are common and the loading processis usually adiabatic. In order to better understand the variousdeformation mechanisms and failure, it is important to characterizeshock response in geological materials under well-characterizedloading conditions.
Shock-induced properties of geological materials have beeninvestigated using a variety of techniques including explosivedetonation loading, impact cratering experiments, and flyer-plateimpact studies. For example, Kovalev et al. [10] used explosive
ll rights reserved.
an),
loading along with manganin pressure gages to investigate elasto-plastic shock-wave profiles in marble, quartzite and granite. Theyfound the shock-wave front to split into a leading elastic pre-cursor followed by a plastic (in-elastic) compressive wave; theamplitude of the elastic precursor is observed to decrease withincreasing propagation distance in the samples. Tilert et al. [9]studied explosively-induced movement as well as spall due toburied detonation charges in granite blocks with thicknesses inthe range 60–300 mm. Their results suggest a critical spalldistance of around 210 mm for buried charges of 1 g highexplosives, beyond which no spalling was observed. Ai andAhrens [6] measured compressional wave speeds as well asattenuation coefficients in 1 cm cube samples cut from a SanMarcos granite block recovered from a lead bullet impact crateringexperiment. Based on the measured longitudinal wave (P-wave)velocities in three orthogonal directions, they obtained an estimatefor the damage parameters in the shocked granite.
In order to further investigate the shock behavior in geologicalmaterials, e.g. the shock Hugoniot curve, Hugoniot elastic limit (HEL),dynamic shear strength, and spall strength under well controlledshock wave loading conditions, normal plate-impact experiments
7075-T6 Al, D3 Steelor WC Flyer
Granite Target
PMMA Window
VISAR Probe
82.5 mm Single Stage Gas Gun
Fiberglass ProjectileTarget Holder
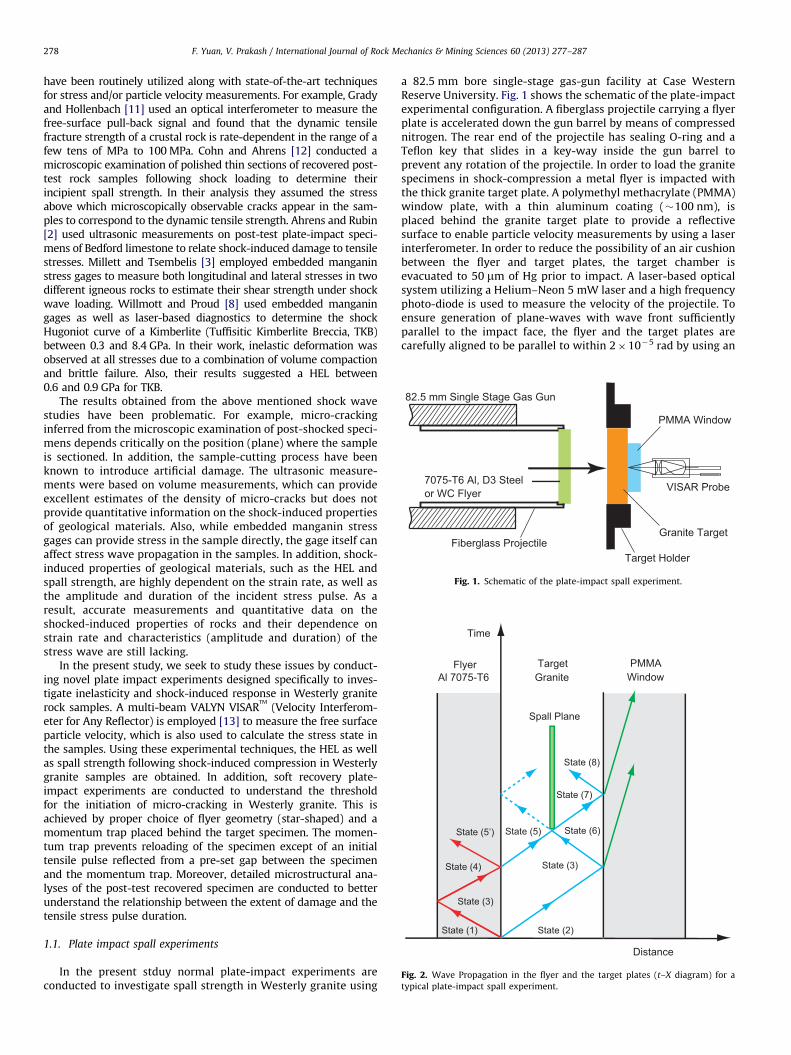
Fig. 1. Schematic of the plate-impact spall experiment.
State (4)
State (5) State (6)
State (7)
FlyerAl 7075-T6
State (1) State (2)
State (3)
State (3)
Spall Plane
Time
Distance
TargetGranite
State (5’)
State (8)
PMMAWindow
Fig. 2. Wave Propagation in the flyer and the target plates (t–X diagram) for a
typical plate-impact spall experiment.
F. Yuan, V. Prakash / International Journal of Rock Mechanics & Mining Sciences 60 (2013) 277–287278
have been routinely utilized along with state-of-the-art techniquesfor stress and/or particle velocity measurements. For example, Gradyand Hollenbach [11] used an optical interferometer to measure thefree-surface pull-back signal and found that the dynamic tensilefracture strength of a crustal rock is rate-dependent in the range of afew tens of MPa to 100 MPa. Cohn and Ahrens [12] conducted amicroscopic examination of polished thin sections of recovered post-test rock samples following shock loading to determine theirincipient spall strength. In their analysis they assumed the stressabove which microscopically observable cracks appear in the sam-ples to correspond to the dynamic tensile strength. Ahrens and Rubin[2] used ultrasonic measurements on post-test plate-impact speci-mens of Bedford limestone to relate shock-induced damage to tensilestresses. Millett and Tsembelis [3] employed embedded manganinstress gages to measure both longitudinal and lateral stresses in twodifferent igneous rocks to estimate their shear strength under shockwave loading. Willmott and Proud [8] used embedded manganingages as well as laser-based diagnostics to determine the shockHugoniot curve of a Kimberlite (Tuffisitic Kimberlite Breccia, TKB)between 0.3 and 8.4 GPa. In their work, inelastic deformation wasobserved at all stresses due to a combination of volume compactionand brittle failure. Also, their results suggested a HEL between0.6 and 0.9 GPa for TKB.
The results obtained from the above mentioned shock wavestudies have been problematic. For example, micro-crackinginferred from the microscopic examination of post-shocked speci-mens depends critically on the position (plane) where the sampleis sectioned. In addition, the sample-cutting process have beenknown to introduce artificial damage. The ultrasonic measure-ments were based on volume measurements, which can provideexcellent estimates of the density of micro-cracks but does notprovide quantitative information on the shock-induced propertiesof geological materials. Also, while embedded manganin stressgages can provide stress in the sample directly, the gage itself canaffect stress wave propagation in the samples. In addition, shock-induced properties of geological materials, such as the HEL andspall strength, are highly dependent on the strain rate, as well asthe amplitude and duration of the incident stress pulse. As aresult, accurate measurements and quantitative data on theshocked-induced properties of rocks and their dependence onstrain rate and characteristics (amplitude and duration) of thestress wave are still lacking.
In the present study, we seek to study these issues by conduct-ing novel plate impact experiments designed specifically to inves-tigate inelasticity and shock-induced response in Westerly graniterock samples. A multi-beam VALYN VISAR
TM
(Velocity Interferom-eter for Any Reflector) is employed [13] to measure the free surfaceparticle velocity, which is also used to calculate the stress state inthe samples. Using these experimental techniques, the HEL as wellas spall strength following shock-induced compression in Westerlygranite samples are obtained. In addition, soft recovery plate-impact experiments are conducted to understand the thresholdfor the initiation of micro-cracking in Westerly granite. This isachieved by proper choice of flyer geometry (star-shaped) and amomentum trap placed behind the target specimen. The momen-tum trap prevents reloading of the specimen except of an initialtensile pulse reflected from a pre-set gap between the specimenand the momentum trap. Moreover, detailed microstructural ana-lyses of the post-test recovered specimen are conducted to betterunderstand the relationship between the extent of damage and thetensile stress pulse duration.
1.1. Plate impact spall experiments
In the present stduy normal plate-impact experiments areconducted to investigate spall strength in Westerly granite using
a 82.5 mm bore single-stage gas-gun facility at Case WesternReserve University. Fig. 1 shows the schematic of the plate-impactexperimental configuration. A fiberglass projectile carrying a flyerplate is accelerated down the gun barrel by means of compressednitrogen. The rear end of the projectile has sealing O-ring and aTeflon key that slides in a key-way inside the gun barrel toprevent any rotation of the projectile. In order to load the granitespecimens in shock-compression a metal flyer is impacted withthe thick granite target plate. A polymethyl methacrylate (PMMA)window plate, with a thin aluminum coating (�100 nm), isplaced behind the granite target plate to provide a reflectivesurface to enable particle velocity measurements by using a laserinterferometer. In order to reduce the possibility of an air cushionbetween the flyer and target plates, the target chamber isevacuated to 50 mm of Hg prior to impact. A laser-based opticalsystem utilizing a Helium–Neon 5 mW laser and a high frequencyphoto-diode is used to measure the velocity of the projectile. Toensure generation of plane-waves with wave front sufficientlyparallel to the impact face, the flyer and the target plates arecarefully aligned to be parallel to within 2�10�5 rad by using an
ParticleVelocity
Stre
ssvimpact
vspall
σspall
No Spall
vmaxvmin
Granite
PMMA
Aluminum
State (4)
State (7’)
State (7)
State (1)State (2)
State (6)
State (5,5’) State (8, start)State (8, end)
v0
State (3)
vA vB
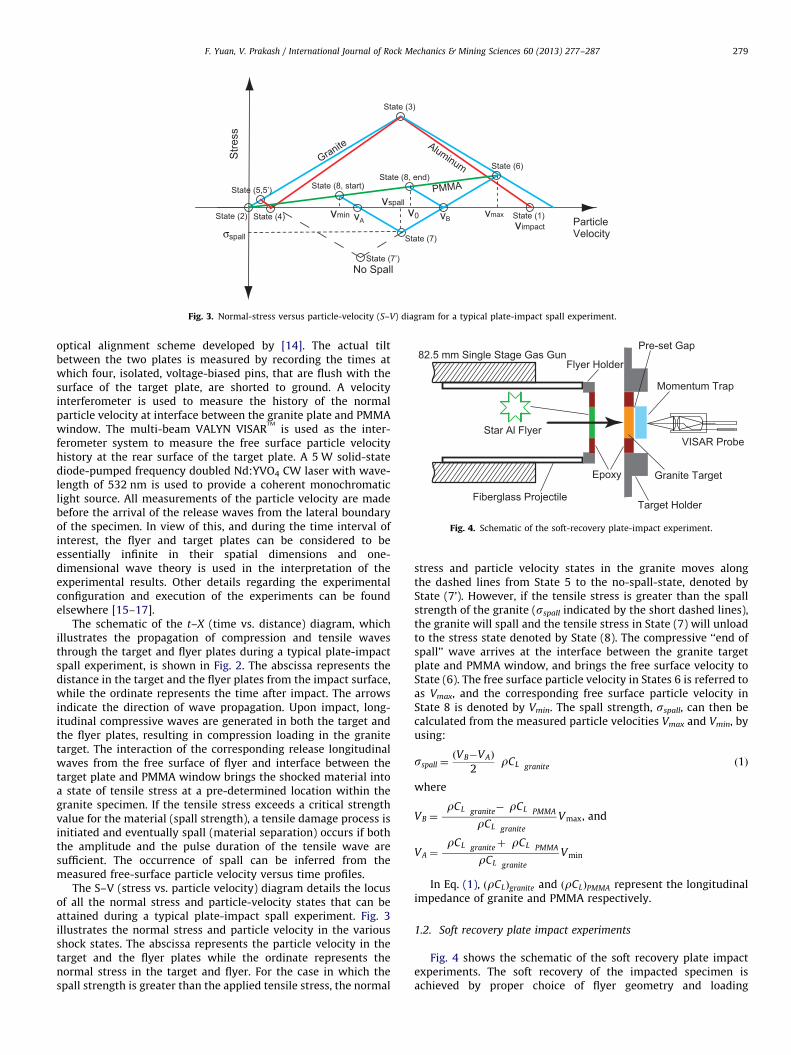
Fig. 3. Normal-stress versus particle-velocity (S–V) diagram for a typical plate-impact spall experiment.
Granite Target
Momentum Trap
VISAR Probe
82.5 mm Single Stage Gas Gun
Fiberglass Projectile Target Holder
Epoxy
Flyer Holder
Star Al Flyer
Pre-set Gap
Fig. 4. Schematic of the soft-recovery plate-impact experiment.
F. Yuan, V. Prakash / International Journal of Rock Mechanics & Mining Sciences 60 (2013) 277–287 279
optical alignment scheme developed by [14]. The actual tiltbetween the two plates is measured by recording the times atwhich four, isolated, voltage-biased pins, that are flush with thesurface of the target plate, are shorted to ground. A velocityinterferometer is used to measure the history of the normalparticle velocity at interface between the granite plate and PMMAwindow. The multi-beam VALYN VISAR
TM
is used as the inter-ferometer system to measure the free surface particle velocityhistory at the rear surface of the target plate. A 5 W solid-statediode-pumped frequency doubled Nd:YVO4 CW laser with wave-length of 532 nm is used to provide a coherent monochromaticlight source. All measurements of the particle velocity are madebefore the arrival of the release waves from the lateral boundaryof the specimen. In view of this, and during the time interval ofinterest, the flyer and target plates can be considered to beessentially infinite in their spatial dimensions and one-dimensional wave theory is used in the interpretation of theexperimental results. Other details regarding the experimentalconfiguration and execution of the experiments can be foundelsewhere [15–17].
The schematic of the t–X (time vs. distance) diagram, whichillustrates the propagation of compression and tensile wavesthrough the target and flyer plates during a typical plate-impactspall experiment, is shown in Fig. 2. The abscissa represents thedistance in the target and the flyer plates from the impact surface,while the ordinate represents the time after impact. The arrowsindicate the direction of wave propagation. Upon impact, long-itudinal compressive waves are generated in both the target andthe flyer plates, resulting in compression loading in the granitetarget. The interaction of the corresponding release longitudinalwaves from the free surface of flyer and interface between thetarget plate and PMMA window brings the shocked material intoa state of tensile stress at a pre-determined location within thegranite specimen. If the tensile stress exceeds a critical strengthvalue for the material (spall strength), a tensile damage process isinitiated and eventually spall (material separation) occurs if boththe amplitude and the pulse duration of the tensile wave aresufficient. The occurrence of spall can be inferred from themeasured free-surface particle velocity versus time profiles.
The S–V (stress vs. particle velocity) diagram details the locusof all the normal stress and particle-velocity states that can beattained during a typical plate-impact spall experiment. Fig. 3illustrates the normal stress and particle velocity in the variousshock states. The abscissa represents the particle velocity in thetarget and the flyer plates while the ordinate represents thenormal stress in the target and flyer. For the case in which thespall strength is greater than the applied tensile stress, the normal
stress and particle velocity states in the granite moves alongthe dashed lines from State 5 to the no-spall-state, denoted byState (7’). However, if the tensile stress is greater than the spallstrength of the granite (sspall indicated by the short dashed lines),the granite will spall and the tensile stress in State (7) will unloadto the stress state denoted by State (8). The compressive ‘‘end ofspall’’ wave arrives at the interface between the granite targetplate and PMMA window, and brings the free surface velocity toState (6). The free surface particle velocity in States 6 is referred toas Vmax, and the corresponding free surface particle velocity inState 8 is denoted by Vmin. The spall strength, sspall, can then becalculated from the measured particle velocities Vmax and Vmin, byusing:
sspall ¼VB�VAð Þ
2rCL
� �granite
ð1Þ
where
VB ¼rCL
� �granite
� rCL
� �PMMA
rCL
� �granite
Vmax, and
VA ¼rCL
� �granite
þ rCL
� �PMMA
rCL
� �granite
Vmin
In Eq. (1), ðrCLÞgranite and ðrCLÞPMMA represent the longitudinalimpedance of granite and PMMA respectively.
1.2. Soft recovery plate impact experiments
Fig. 4 shows the schematic of the soft recovery plate impactexperiments. The soft recovery of the impacted specimen isachieved by proper choice of flyer geometry and loading

FlyerAl 7075-T6
Spall Region
Time
Distance
TargetGranite
MomentumTrap
First Pulse
Second Pulse
12
3
45
6
7 8
9 10
11
Third Pulse
Duration for closing the gap
Fig. 5. Wave Propagation in the flyer and the target plates (t–X diagram) for a
typical soft recovery plate-impact experiment.
Particle Velocity
Stre
ss
vimpact
Granite Aluminum
12
3,8,11
7
5
6,104,9
Fig. 6. Normal-stress versus particle-velocity (S–V) diagram for a typical soft
recovery plate-impact experiment.
Table 1Summary of the plate-impact experiments on Westerly granite.
Exp. no.Flyer
(mm)
Target granite
(mm)
Impact velocity
(m/s)
Impact stress
(GPa)
Shot 6 Al, 8.85 19.05 91.5 0.7
Shot 4 Al, 9.12 18.90 156.5 1.2
Shot 3 Al, 8.95 18.70 249.1 1.8
Shot 1 Al, 8.95 19.01 364.5 2.9
Shot 2 Al, 8.93 19.27 561.3 3.9
Shot 5 Steel, 8.55 19.20 491.5 5.0
Shot 7 WC, 6.00 19.01 489.4 5.8
Table 2Material density, longitudinal wave speed, and the elastic longitudinal impedance,
for the Westerly granite specimen, aluminum flyer plate, steel flyer plate, and the
WC flyer plate, used in the present study.
Density
g/cm3
Longitudinal wave
speed km/s
Longitudinal impedance
GPa/(mm/ms)
Westerly granite
specimen
2.6 5.4 14.04
Aluminum flyer
plate
2.8 6.23 17.44
Steel flyer plate 7.86 5.98 47.00
WC flyer plate 15.2 6.99 106.25
F. Yuan, V. Prakash / International Journal of Rock Mechanics & Mining Sciences 60 (2013) 277–287280
conditions such that damage is confined to regions of highlylocalized stresses and the surrounding regions of lower stressprovide resistance to the coalescence and propagation of macro-cracks. In order to achieve this, an eight-pointed star-shaped flyer[18,19] is used to subject a central octagonal region of the granitespecimen to a plane compressive pulse. A momentum trap(quartz) sitting behind the target specimen is used to preventreloading of the specimen except of an initial tensile pulsereflected from a pre-set gap between the specimen and themomentum trap. In order to initiate various levels of micro-structural damage in the granite specimen, the duration of thetensile pulse is varied by the magnitude of the gap. In particular,the results of the experiments help us to establish a threshold fortensile pulse duration for the occurrence of spall.
In order to understand the loading history in the central regionof the granite specimen we consider a linear elastic wave analysisof the impact problem. Figs. 5 and 6 show the t–X (time vs.distance) diagram and the S–V (stress vs. particle velocity)diagram for the soft recovery experiments. Upon impact, two
compression waves are generated from the impact surface. Onewave travels into the star flyer, and the other travels into granitecausing the compressive stress. When the first part of the com-pressive pulse reaches the rear surface of the granite specimens, thegap between and the granite specimen and the momentum trapcauses the surface of the granite specimen to act like a free surfacefor a time equal to the time for the particle velocity to close the gap.Before the gap is closed, the interaction of the corresponding release(unloading longitudinal wave) from the free surfaces of flyer andthe target plates brings the shocked granite material to a state oftensile stress (State 7). Next, the tensile wave reflects at theinterface between the star flyer and the granite specimen as acompressive pulse, which travels through the specimen (State 11)before entering the momentum trap. The initial compressive pulse(minus the reflected part at the target/momentum–trap interface)travels through the momentum trap, reflects from the free surface,and becomes a tensile pulse. When this tensile pulse reaches theinterface between the granite specimen and the momentum trap,the momentum trap separates from the granite specimen, since thisinterface cannot support tension. The momentum trap flies off,leaving the specimen nearly unstressed and with essentially zeromomentum. The specimen can then be recovered and examined inmore detail to determine the type and extent of damage from theloading history.
2. Experimental results
2.1. Plate-impact spall experiments
In the present study, a total of seven normal plate-impactexperiments were conducted on Westerly granite to obtain itsHEL and spall strength. Five of these experiments were conductedwith an aluminum flyer plate, one with a steel flyer, and one witha tungsten carbide (WC) flyer. Table 1 lists the key parameters forthe seven experiments—it provides the Shot #, thickness of thegranite target plate, thickness of the flyer plates, impact velocity,and the shock-induced compressive stress level at impact. Table 2

Fig. 7. Particle-velocity versus time profiles for seven normal plate-impact
experiments conducted in the present study.
Fig. 8. Calculation of Hugoniot Elastic Limit (HEL) for Westerly granite from the
measured particle velocity profiles.
Time after impact (μs)
Part
icle
vel
ocity
at g
rani
te /P
MM
A in
terf
ace
(m/s
)
0 2 4 6 8 100
50
100
150
200
250
300Shot 3Impact Velocity: 249.1 m/sFlyer: 7075-T6 Al (8.95 mm)Target: Granite (18.70 mm)
Vmax = 206.1 m/s
Vmin = 124.8 m/s
Vno spall = 7.8 m/s
Fig. 9. Calculation of spall strength illustrated for Shot 3.
Impact stress (GPa)
Spal
l str
engt
h (M
Pa)
0 1 2 3 4 5 60
100
200
300
400
500Westerly graniteShock pulse duration: 3 μs
Fig. 10. Spall strength vs. impact stress for Westerly granite.
F. Yuan, V. Prakash / International Journal of Rock Mechanics & Mining Sciences 60 (2013) 277–287 281
lists the density, the longitudinal wave speed and the longitudinalimpedance of all the plates and the specimen used in theexperiments. The shock-induced impact stresses were estimatedfrom the measured impact velocity and the knowledge of theelastic longitudinal impedance of the Westerly granite target andthe flyer plates.
Fig. 7 shows the measured particle-velocity profiles for all theseven experiments. At higher impact stresses (Shots 5 and 7), themeasured particle-velocity profiles (shown in Fig. 8) show a cleartwo-wave structure indicative of elastic-plastic response. Thekink in the two-wave structure is used to estimate the HEL forthe Westerly granite specimens. From the profiles shown in Fig. 8,the particle velocities at the HEL for Westerly granite VHEL, aremeasured to be 343 m/s and 382 m/s for Shots 5 and 7, respec-tively. From these particle velocity measurements the HEL can be
estimated by using:
sHEL ¼rCL
� �granite
þ rCL
� �PMMA
2 rCL
� �granite
rCL
� �granite
VHEL, ð2Þ
where, ðrCLÞgranite and ðrCLÞPMMA are the longitudinal impedancesfor granite and PMMA, respectively. From these measurementsthe spall strength in Westerly granite is estimated to be in therange of 3.2 to 3.5 GPa.
Fig. 9 shows typical particle velocity data for Shot 3 that isused to estimate the spall strength of the Westerly granite rocksample. At the arrival of the compression wave at the free surfaceof the target plate, the particle velocity increases to Vmax. Due tothe inherent heterogeneity of the Westerly granite rock samples,the measured particle velocity profiles are oscillatory in natureand Vmax is taken to be the average particle velocity duringthe first shock-induced Hugoniot state. After the spall event,
Exp. 6Impact vel. 91.5 m/s
Exp. 4Impact vel. 156.5 m/s
Exp. 3Impact vel. 249.1 m/s
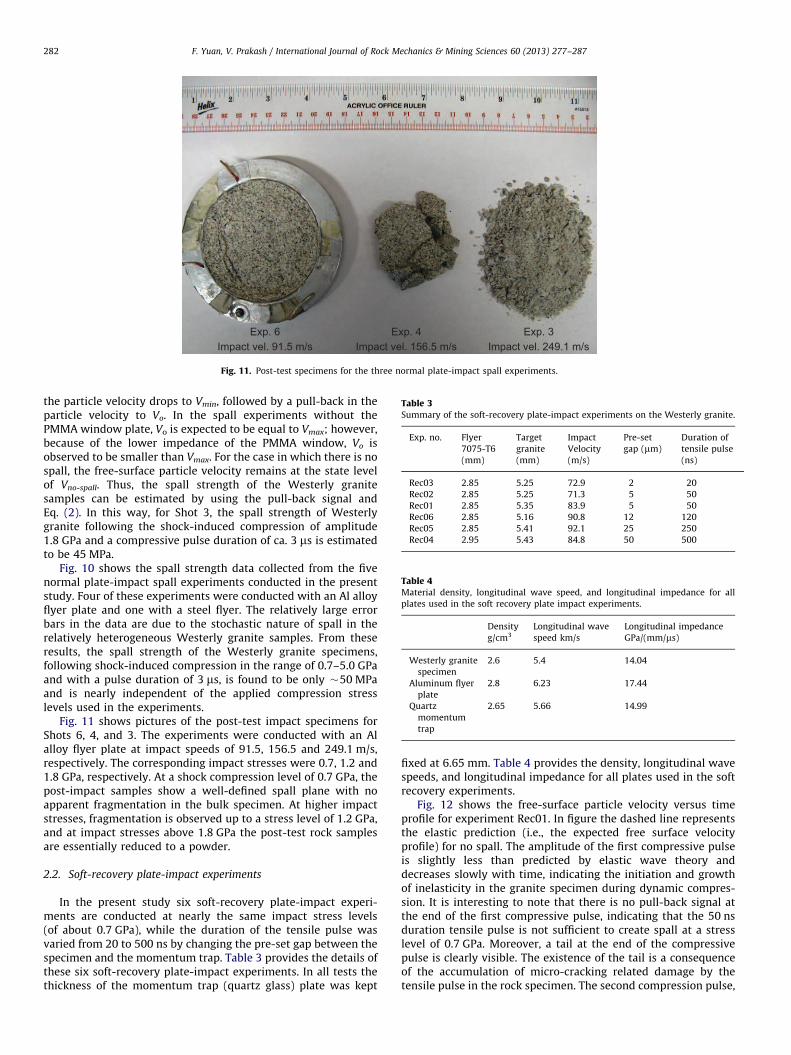
Fig. 11. Post-test specimens for the three normal plate-impact spall experiments.
Table 3Summary of the soft-recovery plate-impact experiments on the Westerly granite.
Exp. no. Flyer
7075-T6
(mm)
Target
granite
(mm)
Impact
Velocity
(m/s)
Pre-set
gap (mm)
Duration of
tensile pulse
(ns)
Rec03 2.85 5.25 72.9 2 20
Rec02 2.85 5.25 71.3 5 50
Rec01 2.85 5.35 83.9 5 50
Rec06 2.85 5.16 90.8 12 120
Rec05 2.85 5.41 92.1 25 250
Rec04 2.95 5.43 84.8 50 500
Table 4Material density, longitudinal wave speed, and longitudinal impedance for all
plates used in the soft recovery plate impact experiments.
Density
g/cm3
Longitudinal wave
speed km/s
Longitudinal impedance
GPa/(mm/ms)
Westerly granite
specimen
2.6 5.4 14.04
Aluminum flyer
plate
2.8 6.23 17.44
Quartz
momentum
trap
2.65 5.66 14.99
F. Yuan, V. Prakash / International Journal of Rock Mechanics & Mining Sciences 60 (2013) 277–287282
the particle velocity drops to Vmin, followed by a pull-back in theparticle velocity to Vo. In the spall experiments without thePMMA window plate, Vo is expected to be equal to Vmax; however,because of the lower impedance of the PMMA window, Vo isobserved to be smaller than Vmax. For the case in which there is nospall, the free-surface particle velocity remains at the state levelof Vno-spall. Thus, the spall strength of the Westerly granitesamples can be estimated by using the pull-back signal andEq. (2). In this way, for Shot 3, the spall strength of Westerlygranite following the shock-induced compression of amplitude1.8 GPa and a compressive pulse duration of ca. 3 ms is estimatedto be 45 MPa.
Fig. 10 shows the spall strength data collected from the fivenormal plate-impact spall experiments conducted in the presentstudy. Four of these experiments were conducted with an Al alloyflyer plate and one with a steel flyer. The relatively large errorbars in the data are due to the stochastic nature of spall in therelatively heterogeneous Westerly granite samples. From theseresults, the spall strength of the Westerly granite specimens,following shock-induced compression in the range of 0.7–5.0 GPaand with a pulse duration of 3 ms, is found to be only �50 MPaand is nearly independent of the applied compression stresslevels used in the experiments.
Fig. 11 shows pictures of the post-test impact specimens forShots 6, 4, and 3. The experiments were conducted with an Alalloy flyer plate at impact speeds of 91.5, 156.5 and 249.1 m/s,respectively. The corresponding impact stresses were 0.7, 1.2 and1.8 GPa, respectively. At a shock compression level of 0.7 GPa, thepost-impact samples show a well-defined spall plane with noapparent fragmentation in the bulk specimen. At higher impactstresses, fragmentation is observed up to a stress level of 1.2 GPa,and at impact stresses above 1.8 GPa the post-test rock samplesare essentially reduced to a powder.
2.2. Soft-recovery plate-impact experiments
In the present study six soft-recovery plate-impact experi-ments are conducted at nearly the same impact stress levels(of about 0.7 GPa), while the duration of the tensile pulse wasvaried from 20 to 500 ns by changing the pre-set gap between thespecimen and the momentum trap. Table 3 provides the details ofthese six soft-recovery plate-impact experiments. In all tests thethickness of the momentum trap (quartz glass) plate was kept
fixed at 6.65 mm. Table 4 provides the density, longitudinal wavespeeds, and longitudinal impedance for all plates used in the softrecovery experiments.
Fig. 12 shows the free-surface particle velocity versus timeprofile for experiment Rec01. In figure the dashed line representsthe elastic prediction (i.e., the expected free surface velocityprofile) for no spall. The amplitude of the first compressive pulseis slightly less than predicted by elastic wave theory anddecreases slowly with time, indicating the initiation and growthof inelasticity in the granite specimen during dynamic compres-sion. It is interesting to note that there is no pull-back signal atthe end of the first compressive pulse, indicating that the 50 nsduration tensile pulse is not sufficient to create spall at a stresslevel of 0.7 GPa. Moreover, a tail at the end of the compressivepulse is clearly visible. The existence of the tail is a consequenceof the accumulation of micro-cracking related damage by thetensile pulse in the rock specimen. The second compression pulse,

Time after impact (μs)
Free
sur
face
vel
ocity
(m/s
)
0 1 2 3 4 5 60
25
50
75
100
125
150
175
200Exp. Rec01Flyer: 7075-T6 Al (2.85 mm)Target: Granite (5.35 mm)Momentum trap: Quartz (6.65 mm)Prescribed gap: 5 μmImpact velocity: 83.9 m/s
Elastic Predictionfor no spall
Experimental Data
Fig. 12. Free-surface particle-velocity profile for experiment Rec01.
Time after impact (μs)
Free
sur
face
vel
ocity
(m/s
)
0 1 2 3 4 5 60
20
40
60
80
100
120
140
160Rec01, gap 5 μmRec02, gap 5 μmRec03, gap 2 μm
Fig. 13. Free surface particle velocity profile for experiments Rec03, Rec02
and Rec01.
Fig. 14. Free surface versus particle velocity profile for experiment Rec04.
F. Yuan, V. Prakash / International Journal of Rock Mechanics & Mining Sciences 60 (2013) 277–287 283
which was expected to arrive at the monitoring point on the freesurface of the target plate at around 4 ms, is not present in thevelocity versus time profile. This attenuation of the compressionpulse can be attributed to dispersion of the relatively shortduration tensile pulse (�50 ns) due to the inherent heterogeneityof the rock microstructure, and also to the accumulation ofdamage that occurs while the pulse is tensile (i.e., Region 7 inFig. 5). The amplitude and duration of the second pulse can alsobe affected by scattering as the reflected compressive pulsetravels through the damaged material (i.e., Region 7 in Fig. 5).The other wave signatures, i.e., between the first and the secondand the second and third compressive pulses, can be attributed inpart to wave spreading during damage in compression and fromthe simultaneous arrival of the diffracted spherical waves ema-nating from the re-entrant corners of the star-shaped flyer. Thethird pulse in Fig. 12 is a reflection of the main compressive pulseafter it makes a round trip through the thickness of the
momentum trap. Similarity of the first and the third pulses isan indication of the nearly elastic response of the momentum trapand the dominance of the plane waves in the central region of thespecimen. Any inelasticity and/or non-planar wave effects causethe shape and duration of the third pulse to differ from the first.The observed difference in the shape of the first and the thirdwave profiles is understood to be due to scattering by theheterogeneity in the rock samples and also non-planarity due tothe gap between the momentum trap and the granite specimen.
Fig. 13 shows the free surface velocity profile for experimentsRec03, Rec02 and Rec01. The duration of the tensile pulse in thesethree experiments is varied from 20 to 50 ns. In each case theobserved free surface particle velocity is similar to that observedfor Shot Rec01—there is an absence of the spall signal followingthe first compressive wave, and the second compressive wave,which was to arrive at �4 ms, is absent. Furthermore, theduration of the tail at the end of the first compressive pulse isobserved to become longer as the impact velocity is increased.Since the existence of the tail and spreading of the second pulseare immediate consequences of damage due to the tensile pulse,the wave profiles in Fig. 13 indicate that more damage occurs inShot Rec01 when compared to the other two experiments. Thepost-test specimens are observed to be radially cracked in eachcase, perhaps due to a combination of boundary release wavesand tensile stresses resulting from bending/flexure of the speci-men during impact [18,20]. More importantly, the recoveredgranite specimens have the same thickness as prior to impact,indicating the absence of spall failure in the three experiments.This is also consistent with the absence of the pull-back signal inthe three experiments, indicating that the tensile pulse durationthreshold required for spall in Westerly granite is larger than50 ns at a stress level of 0.7 GPa.
Fig. 14 shows the free-surface particle velocity profile for theexperiment Rec04. Unlike Shots Rec01, Rec02 and Rec03, whichwere conducted with pre-set gaps of 5, 5, and 2 mm, respectively,Shot Rec04 has a pre-set gap of 50 mm, which corresponds to atensile pulse of duration 500 ns. The dashed line shows the elasticprediction for the case of no spall. The attenuation of the firstcompressive pulse as a function of time indicates that damage incompression due to micro-cracking occurs in the Westerly granitesamples during the passage of the compressive pulse. The pull-back signal corresponding to a spall can be clearly seen at the end

Fig. 15. Free surface particle velocity versus time profile for experiment Rec05.
Fig. 16. Free surface particle velocity versus time profile for experiment Rec06.
F. Yuan, V. Prakash / International Journal of Rock Mechanics & Mining Sciences 60 (2013) 277–287284
of the first compressive pulse in Fig. 14. The spall strength basedon this pull back signal is estimated to be 450 MPa. Fig. 15 showsthe particle velocity profile for experiment Rec05, which wasconducted with a pre-set gap of 25 mm (which corresponds totensile pulse duration of 250 ns). Again damage in compression aswell as a pull-back signal corresponding to a spall can be seen inthe velocity time profile just after the end of the compressivewave pulse. The spall strength was estimated to be 610 MPa.Fig. 16 shows the free-surface particle velocity profile for theexperiment Rec06. In this case the pre-set gap is 12 mm, whichcorresponds to tensile pulse duration of ca. 120 ns. Spall strengthof ca. 710 MPa is estimated in this case. In the three experiments,the arrival of the second compressive pulse can be inferred fromthe measured velocity time profiles; however, the tensile pulse isdiffused and has much lower amplitude than that predictedusing the elastic wave theory. Again, the strong attenuation ofthe second compressive pulse can be attributed primarily to theintense damage created by the first compressive pulse and the
tensile pulse in the Westerly granite samples. Moreover, forexperiments Shot Rec05 and Shot Reco 06, a rather large pulse-shape difference is observed between the first and the thirdcompressive waves, indicating that non-planar conditions maybe present during the experiment. These non-planar conditionsmay perhaps be attributed to pre-set gap between the momen-tum trap and the specimen, which may not be perfectly planar.From experience, it has been difficult to control the planarity ofpre-set gaps when rather large gaps are used in plate impact softrecovery experiments.
Optical microscopy examination of the post-test specimensfrom experiments Rec04, Rec05 and Rec06 indicate a smallerthickness of the recovered specimens when compared to theinitial sample thickness, indicating the occurrence of spall duringthe experiments. Moreover, the average size of the radiallyfractured pieces is smaller for the case of experiments conductedwith a large pre-set gap between the momentum trap and thegranite specimen. Again this can be attributed to the combinedeffects of the longer duration tensile pulse due to the larger pre-set gap between the specimen and the momentum trap and thedevelopment of bending stresses in the specimen during impactof the granite target plate with a smaller star-shape flyer.
2.3. Scanning electron microscopy
Soft recovery experiments in which a spall signal was notapparent in the particle velocity versus time profiles (Rec02 andRec03) but underwent extensive radial macro-cracking, a lowmagnification optical microscope examination of the impact faceyields the presence of a high density of micro-cracks and a fewmacro-cracks outside the central impact region. This damagepattern is consistent with the tensile stresses induced by theunloading (lateral) cylindrical and spherical waves. At the rearface of the specimen, a damage ring coincident with the eightentrant corners of the flyer plate is also observed. The divergentcharacter of the unloading waves from the corners makes theselocations the most favorable regions for stress-induced micro-cracking; consequently, the level of tensile stresses that propa-gates into the central octagonal region is attenuated to a levelbelow the fracture stress threshold for micro cracking in Westerlygranite. The net effect is the generation of a protective ring thateliminates the undesired effects during the generation of themain compressive pulse.
The recovered post-test granite pieces were impregnated inepoxy and then sectioned with a low-speed diamond saw toreveal a surface parallel to the impact direction. Fig. 17 shows thescanning electron microscopy map of a cross-sectional surfaceparallel to the impact direction for shot Rec02 with the tensilepulse duration of 50 ns. From the figure, it can be seen that eventhough the specimen did not undergo spall failure, a relativelylarge micro-crack (about 40 mm in width) is nucleated at theintersection of the two unloading waves from the flyer and targetboundaries. The micro-cracking is predominantly inter-granularand is observed to nucleate preferably at the grain boundarybetween the two grains. Besides this crack, several other smallermicro-cracks are observed on the specimen surface.
Fig. 18 shows the scanning electron microscopy map of thecross-sectional surface parallel to the impact direction for ShotRec03 (subjected to a tensile pulse of duration of 20 ns). Again, arelatively large micro-crack can be observed in the specimen atthe plane where the unloading waves from the flyer and thetarget intersect. The width of this micro-crack is about 30 mm,which is a little smaller than that observed for shot Rec02,perhaps due to the shorter duration of the tensile pulse. For thesoft recovery experiments which indicate a pull-back signal in theparticle velocity profile (Rec04, Rec05 and Rec06), a clear spall

det HV spot mag WDETD 20KV 5.0 55x 5.3mm 500 μm
Impact surface
Free surface
Interaction site oftwo unloading waves
det HV spot mag WDETD 20KV 5.0 1800x 5.3mm 20 μm
40 μm
Fig. 17. Scanning electron microscopy map of a cross-sectional surface parallel to the impact direction for Shot Rec02 (tensile pulse duration is 50 ns).
det HV spot mag WD ETD 20KV 5.0 54x 5.5mm 500 μm
Impact surface
Free surface
Interaction site oftwo unloading waves
det HV spot mag WDETD 20KV 5.0 1800x 5.3mm 20 μm
30 μm
Fig. 18. Scanning electron microscopy map of a cross-sectional surface parallel to the impact direction for Shot Rec03 (tensile pulse duration of 20 ns).
F. Yuan, V. Prakash / International Journal of Rock Mechanics & Mining Sciences 60 (2013) 277–287 285
plane can be observed in the post-impacted specimens. Thethickness of the post-impacted specimens is observed to be lessthan the thickness of the specimens prior to the test, furtherindicating the occurrence of spall in these experiments.
Fig. 19 shows the SEM picture of the spall plane for shot Rec05with a tensile pulse of duration 250 ns. The SEM picture reveals arelatively rough fracture surface. At the higher magnifications,several micro-cracks and surface pits can be observed in themicrostructure. These pits are probably formed when inter-grainboundary undergoes extensive damage, and the grains literallypop out of the microstructure. Moreover, the fracture/damagemode is observed to be predominantly brittle in nature.
3. Discussion and summary of results
In the present study, plate-impact experiments are conductedto obtain the stress threshold for inelasticity in Westerly graniteby estimating its Hugoniot Elastic Limit (HEL) under shock-induced compression. These experiments are designed to alsoprovide information on the spall strength following the shock-induced compression in the granite samples. The HEL for Wes-terly granite is estimated to be between 3.2 and 3.5 GPa. The spallstrength is measured to be small (�50 MPa) with a shock pulseof duration 3 ms, and is found to be nearly independent of theapplied compression level in the impact stress range of 0.7–5.0 GPa.
The post-impact samples show a well-defined spall plane with noapparent fragmentation at a shock compression level of 0.7 GPa.At higher impact stresses, fragmentation is observed up to 1.2 GPa,while the rock samples are reduced to essentially a powder atimpact stress levels of above 1.8 GPa.
Furthermore, in the present study, soft recovery plate-impactexperiments are conducted to better understand the threshold forinitiation of micro-cracking in Westerly granite. These recoveryexperiments are conducted at the same stress level as the normalplate impact experiments (�0.7 GPa), and the duration of thetensile pulse is varied from 20 to 500 ns by varying the pre-setgap between the specimen and the momentum trap. Fig. 20shows the spall strength vs. the time duration of the tensile pulsefor all normal plate-impact and the soft-recovery plate-impactexperiments conducted on Westerly granite. The results indicatethat the stress pulse duration threshold for the initiation of spallis about 120 ns when the applied tensile stress level is �0.7 GPa.Moreover, it can be seen that tensile fracture in Westerly graniteis a time-dependent phenomena, in which the spall strengthdepends on the duration of the tensile stress pulse. A generalspall criterion along these lines was proposed by Tuler andButcher [21]. They showed that the dynamic fracture (spall)phenomena is time-dependent, and that the critical spall stresslevel depends on the tensile stress pulse duration as s�s0ð Þ
lDt¼ K ,where, s is the applied tensile stress level, s0 is the stress belowwhich spall will not occur even for very long stress pulse durations,
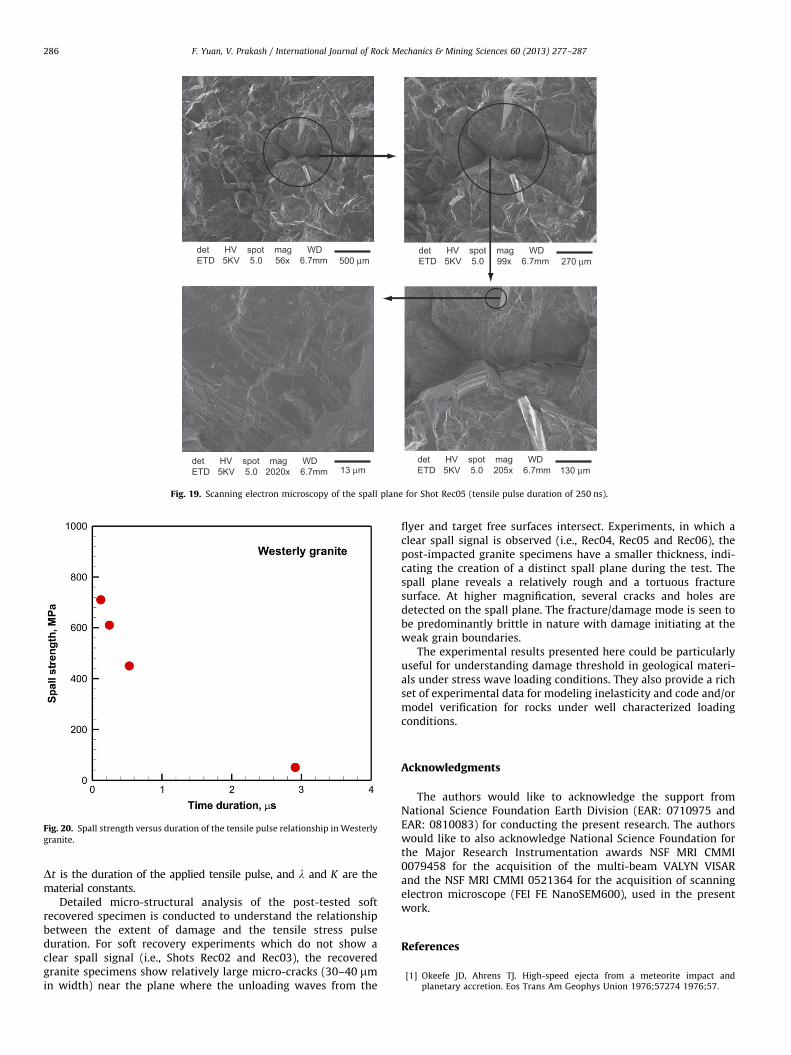
det HV spot mag WDETD 5KV 5.0 56x 6.7mm 500 μm
det HV spot mag WDETD 5KV 5.0 99x 6.7mm 270 μm
13 μmdet HV spot mag WDETD 5KV 5.0 2020x 6.7mm
det HV spot mag WDETD 5KV 5.0 205x 6.7mm 130 μm
Fig. 19. Scanning electron microscopy of the spall plane for Shot Rec05 (tensile pulse duration of 250 ns).
Fig. 20. Spall strength versus duration of the tensile pulse relationship in Westerly
granite.
F. Yuan, V. Prakash / International Journal of Rock Mechanics & Mining Sciences 60 (2013) 277–287286
Dt is the duration of the applied tensile pulse, and l and K are thematerial constants.
Detailed micro-structural analysis of the post-tested softrecovered specimen is conducted to understand the relationshipbetween the extent of damage and the tensile stress pulseduration. For soft recovery experiments which do not show aclear spall signal (i.e., Shots Rec02 and Rec03), the recoveredgranite specimens show relatively large micro-cracks (30–40 mmin width) near the plane where the unloading waves from the
flyer and target free surfaces intersect. Experiments, in which aclear spall signal is observed (i.e., Rec04, Rec05 and Rec06), thepost-impacted granite specimens have a smaller thickness, indi-cating the creation of a distinct spall plane during the test. Thespall plane reveals a relatively rough and a tortuous fracturesurface. At higher magnification, several cracks and holes aredetected on the spall plane. The fracture/damage mode is seen tobe predominantly brittle in nature with damage initiating at theweak grain boundaries.
The experimental results presented here could be particularlyuseful for understanding damage threshold in geological materi-als under stress wave loading conditions. They also provide a richset of experimental data for modeling inelasticity and code and/ormodel verification for rocks under well characterized loadingconditions.
Acknowledgments
The authors would like to acknowledge the support fromNational Science Foundation Earth Division (EAR: 0710975 andEAR: 0810083) for conducting the present research. The authorswould like to also acknowledge National Science Foundation forthe Major Research Instrumentation awards NSF MRI CMMI0079458 for the acquisition of the multi-beam VALYN VISARand the NSF MRI CMMI 0521364 for the acquisition of scanningelectron microscope (FEI FE NanoSEM600), used in the presentwork.
References
[1] Okeefe JD, Ahrens TJ. High-speed ejecta from a meteorite impact andplanetary accretion. Eos Trans Am Geophys Union 1976;57274 1976;57.
F. Yuan, V. Prakash / International Journal of Rock Mechanics & Mining Sciences 60 (2013) 277–287 287
[2] Ahrens TJ, Rubin AM. Impact-induced tensional failure in rock. J Geophys ResPlanets 1993;98:1185–203.
[3] Millett JCF, Tsembelis K, Bourne NK. Longitudinal and lateral stress measure-ments in shock-loaded gabbro and granite. J Appl Phys 2000;87:3678–82.
[4] Melosh HJ. Shock viscosity and rise time of explosion waves in geologicmedia. J Appl Phys 2003;94:4320–5.
[5] Ai HA, Ahrens TJ. Simulation of dynamic response of granite: a numericalapproach of shock-induced damage beneath impact craters. Int J Imp Eng2006;33:1–10.
[6] Ai HA, Ahrens TJ. Effects of shock-induced cracks on the ultrasonic velocityand attenuation in granite. J Geophys Res Solid Earth 2007:112.
[7] Chen DP, He HL, Jing FQ. Delayed failure of the shock compressed inhomogeneousbrittle material. J Appl Phys 2007:102.
[8] Willmott GR, Proud WG. The shock Hugoniot of Tuffisitic Kimberlite Breccia.Int J Rock Mech Min Sci 2007;44:228–37.
[9] Tilert D, Svedbjork G, Ouchterlony F, Nilsson B, Temun A, Mattsson L.Measurement of explosively induced movement and spalling of granitemodel blocks. Int J Impact Eng 2007;34:1936–52.
[10] Kovalev AE, Pavlovskii MN, Bel’skii VM, Komissarov VV. Elastoplastic behaviorof marble, granite, and quartzite under shock compression. Tech Phys 2001;46:686–9.
[11] Grady DE, Hollenbach RE. Dynamic fracture strength of rock. Geophys ResLett 1979;6:73–6.
[12] Cohn SN, Ahrens TJ. Dynamic tensile strength of Lunar rock types. J GeophysRes 1981;86:1794–802.
[13] Barker LM, Hollenbach RE. Laser interferometer for measuring high velocities
of any reflecting surface. J Appl Phys 1972;43:4669–75.[14] Kumar P, Clifton RJ. Optical alignment of impact faces for plate impact
experiments. J Appl Phys 1977;48:1366–7.[15] Yuan F, Prakash V, Lewandowski JJ. Spall strength and Hugoniot elastic limit
of a Zirconium-based bulk metallic glass under planar shock compression.J Maters Res 2007;22:402–11.
[16] Shazly M, Prakash V. Shock response of a gamma titanium aluminide alloy.J Appl Phys 2008;104:083513.
[17] Tsai L, Yuan F, Prakash V, Dandekar DP. Shock compression behavior of aS2-glass fiber reinforced polymer composite. J Appl Phys 2009;105:093526.
[18] Raiser G, Clifton RJ, Ortiz M. A soft-recovery plate impact experiment forstudying microcracking in ceramics. Mech Maters 1990;10:43–58.
[19] Kumar P, Clifton RJ. A star-shaped flyer fpr plate-impact recovery experi-ments. J Appl Phys 1977;48:4850.
[20] Espinosa HD, Raiser G, Clifton RJ, Ortiz M. Performance of the star-shapedflyer in the study of brittle materials: three dimensional computer simula-tions and experimental observations. J Appl Phys 1992;72:3451–7.
[21] Tuler FR, Butcher BM. A criterion for the time dependence of dynamicfracture. Int J Fract 1968;4:431–7.