characterizing wave-induced mixing energy in ohmsett … · 2018-03-30 · characterizing...
TRANSCRIPT

Characterizing wave-induced mixing energy in OHMSETT wave basin for dispersant effectiveness testing
David W. Wang and Hemantha W. Wijesekera
Oceanography Division, Naval Research Laboratory, Code 7332,
Stennis Space Center, MS 39529
Acknowledgements
This study was funded by the Bureau of Safety and Environmental Enforcement (BSEE),
U.S. Department of the Interior, Washington D.C. under Contract E14PG00059, Project 1059.
Disclaimer
This final report has been reviewed by BSEE and approved for publication. Approval
does not signify that the contents necessarily reflect the views or policies of BSEE, nor does
mention of trade names or commercial products constitute endorsement or recommendation for
use.

OHMSETT WAVE MIXING ENERGY 1
Table of Contents
Executive Summary …………………………………………………………………. 2
Background ………………………………………………………………………….. 4
Experiment facility and Instrumentation ……………………………………………. 7
Experiment procedure and Data processing …………………………………………10
Results and Discussion ………………………………………………………………14
Conclusion ………………………………………………………………………….. 20
Recommendation …………………………………………………………………… 21

OHMSETT WAVE MIXING ENERGY 2
Executive Summary
The goal of this study is to quantify and characterize the mixing energy under
breaking wave actions in the Ohmsett facility. Mixing energy associated with surface
wave breaking in the wave tank was evaluated by estimating turbulent kinetic energy
(TKE) directly from measurements of microscale velocity shear. A total of 38 test runs
were carried out to measure turbulent mixing levels for two types of wave conditions,
namely (1) long-duration wave action for the standard dispersant effectiveness tests and
(2) short-duration wave actions prior to the presence of reflected waves from the tank
boundary. The wave conditions for the dispersant effectiveness testing were based on
wave maker setting of frequency 33.3 cycles per minute and stroke distance of 15.2 cm.
Wave conditions for the rest of the test runs were based on wave maker settings of 35 and
40 cycles per minute and 15.2 and 20.3 cm. Surface wave characteristics, TKE
dissipation rates, background currents, and temperature and salinity in the tank were
collected from multiple sensing packages mounted on the tank bridge-platform while
moving at a speed of 0.53 m/s. The major findings of this study are:
• The monochromatic waves generated by the wave maker modulated rapidly into
wave groups as they propagated downstream. The period of the modulated wave
group was 4 to 10 times larger than the period of the initial monochromatic wave
produced by the wave maker. Largest near-surface TKE dissipation rates were found
at or near the center of the modulated wave group. Our observations indicate that
wave breaking occurs when the wave steepness reaches the critical geometric limit
during the modulation process. During wave breaking events, the near-surface TKE
dissipation rate reached to about of the order of 10-2 (hereafter O( )) W/kg which is

OHMSETT WAVE MIXING ENERGY 3
two to three orders of magnitude larger than before and after the wave breaking. The
strongest dissipation was observed within the near-surface layer of thickness
equivalent to a significant wave height of about ~ 0.4 m.
• Vertical profiles of TKE dissipation rate, >< ε , were constructed for long- and short-
duration wave actions. For wave breaking under short-duration wave actions without
the effects from wave reflections, >< ε decreased from O(10-3 ) W/kg at 0.15 m to
O(10-5) W/kg at 0.4 m below the water level. However, >< ε decayed rapidly with
depth under long-duration wave actions (i.e., dispersant effectiveness test), where
>< ε dropped from O(10-3)W/kg at 0.15 m to O(10-6)W/kg at 0.4 m. The depth
dependence of >< ε can be approximated by the power law, nz−∝>< ε , where z is
the depth measured from the water surface, 5=n for the long-duration dispersant
effectiveness test, and 3=n for the short-duration test without impact from reflected
waves. At depths deeper than 0.4 m below the water level, the TKE dissipation rate
of long-duration wave actions was about 3x10⁻⁶ W/kg, which was one order of
magnitude smaller than that of short-duration wave actions.
• The enhancement of the TKE dissipation rate by wave breaking near or at the center
of modulated-wave group is consistent with open ocean observations. The magnitude
and vertical profile of the TKE dissipation rate under short-duration wave actions are
comparable with open ocean observations.

OHMSETT WAVE MIXING ENERGY 4
Background
Approximately 3 million gallons of oil are spilled into the waters of the United States
every year (NRC 2005). The primary response methods consist of the deployment of mechanical
on-water containment and recovery systems. However, mechanical recovery systems often
become insufficient when the environmental conditions at the spill are outside the effective
operation ranges of the equipment. There is a need to use on-water chemical dispersants to
change the inherent chemical and physical properties of oil to enable it to mix with water more
easily. The purpose of dispersant is to break up the oil slick spill into numerous small droplets
which become rapidly diluted into the water column and subsequently degraded by naturally
occurring micro-organisms (NRC 2005). The use of dispersant enhances the amount of oil
mixing into the water column. This can greatly reduce the potential contamination effect of
surface slicks to habitats and bird, marine mammals and other organisms that live on or near the
water surface or shorelines. However, by enhancing the mixing of oil into the water column,
dispersant also increase the potential exposure of the water-column to the spill oil. The
application of dispersant represents a critical decision making for reducing the risk to organisms
at the water surface and near the shoreline while increasing the potential harm to organisms in
the water column and at the sea floor. The use of dispersants must be considered carefully, to
take into account the pros and cons of using them under various sea-state and weather conditions.
Before any dispersant is approved for application to any spill in US waters, both the
toxicity and effectiveness of the chemical dispersants must be evaluated. The effectiveness of
chemical dispersants are often evaluated in laboratory standardized bench-scale tests (Kaku et
al., 2005), such as the Swirling Flask Test (SFT) and Baffled Flask Test (BFT). The mixing
process generated in the laboratory flask tests cannot account for the transport and dilution

OHMSETT WAVE MIXING ENERGY 5
effects in the water column caused by turbulence induced by the action of surface waves as
observed in the open ocean (Venosa et al., 2005; Boufadel et al., 2008). The methods of
generating turbulence motions by shaking of laboratory flasks, by breaking surface waves, or by
shear-driven near-surface motions are not identical, and therefore the mixing energy in a
laboratory set up and in an oceanic environment require better quantification. Furthermore, the
efficiency of mixing in both cases would not be similar. In support of an operational validation
of the dispersant for oil dispersion effectiveness, a full-scale field evaluation test under various
wave conditions is desirable and necessary. However, such a test is logistically difficult and
expensive. The applicability of evaluation results are hampered by limited and uncontrolled
wave conditions. The large outdoor Ohmsett wave tank facility (Figure 1) is designed and
equipped to simulate realistic sea conditions by producing regular waves (up to 1 m height) and
random waves that can’t be generated in smaller tanks (Li et al., 2008; Wickley-Olsen et al.,
2008). The evaluation of dispersant effectiveness can be carried out under controlled and
reproducible wave conditions, and is cost effective and operationally feasible. The evaluation of
dispersant effectiveness has been carried out in the past using the Ohmsett facility (S. L. Ross,
2005; Mullin & Trudel, 2006).
The mixing energy in the water column resulting from small-scale velocity-shear plays a
key role in the breakup of an oil slick into tiny droplets and in dispersion of the spilled oil into
the water column in the presence of a chemical dispersant (Venosa et al., 2006; Li et al., 2008).
The magnitude of turbulent kinetic energy (TKE) near the surface is the key factor determining
the effectiveness of the oil dispersant. Therefore, understanding how TKE dissipation rates of
mechanically-generated surface waves relate to various wave conditions is necessary for
correlating the wave tank measurements with oceanic observations (Belore et al., 2005).

OHMSETT WAVE MIXING ENERGY 6
The turbulent kinetic energy is dissipated by viscous friction. The resulting energy
dissipation rate, ε for homogeneous isotropic turbulence is expressed as (Tennekes & Lumley,
1972)
2
5.7
∂∂
=xuνε , (1)
where ( )2/ xu ∂∂ is the variance of the velocity shear in 1/s; v is the kinematic molecular
viscosity in m2/s; ε is in W/kg, and the angle brackets denote either time or space average. Thus,
ε from turbulent velocity shear is directly linked to the intensity of the mixing energy (NRC
2005). When the Reynolds number is sufficiently large, there exists an inertial subrange where
production and dissipation scales are separable. The velocity shear variance can be estimated by
resolving the spatial gradient of turbulent velocity fluctuations at scales ranging from O(mm) to
O(m). Therefore the dissipation method (or shear spectral method) provides a direct estimate of
the TKE dissipation rate.
The goal of this project is to provide a scientifically validated method to determine
mixing energy based on direct measurements of the TKE dissipation rate in the wave tank under
wave conditions comparable to the oceanic environment. This report describes methodology and
findings of direct measurements of TKE dissipation rates in the Ohmsett wave tank. Section 2
provides a description of the experiment facility and instrumentation setup. Section 3 discusses
measurement procedure and data processing. Results and discussion are presented in Section 4.
Finally, a short summary and recommendations are given in Section 5.

OHMSETT WAVE MIXING ENERGY 7
Experiment facility and Instrumentation
We conducted two experiments at the Ohmsett tank facility during January 12-17, and
during September 21-25, 2015. Each experiment consisted of multiple test runs covering a wide
range of wave actions with varying frequencies and amplitudes produced by the wave maker
(Tables 1 and 2). The experiment conducted in January 2015 (Table 1) was a proof-of-concept
for measuring microscale velocity shear and quantifying platform noise levels from sensors
mounted on the bridge platform (Figure 1). In the following, we describe experiment setups,
measurements, and results, while focusing on the experiment conducted in September 2015
(Table 2).
Wave tank and Instrument platform
The outdoor tank at Ohmsett is 203 m long, 20 m wide, and 3.5 m deep (Figure 1a). The
tank is equipped with a bottom-hinged flap-type wave maker with an adjustable paddle stroke-
frequency and distance (Asher, 2005; Guarino et al., 2010; Brown & Guarino, 2010). The wave
maker is located at the south end of the tank, and a wave-damping beach system is installed at
the north end to reduce wave reflection of incoming waves. During our experiments, the beach
was raised from the tank floor to the water line to dampen incident wave energy. Details of the
wave damping system are given in Guarino et al. (2010). The Ohmsett tank is equipped with
three movable bridges with tow speeds up to 3.2 m/s.
The microstructure measurements were made from sensors mounted on an
instrumentation-platform (also referred as the NRL platform), which was constructed by
combining a cylindrical pole (hereafter “pole”) attached to a 2.3 m long H-beam. The NRL
platform was connected to the main tank-bridge to make underway measurements from the
movable bridge. In this set up, only the H-beam was attached rigidly to the bridge (Figure 1b).

OHMSETT WAVE MIXING ENERGY 8
The pole was mounted on the beam in such a way that the pole could be moved vertically (up
and down) along the beam to position the microstructure-sensors at different depths. Three
microstructure sensing packages (MicroRider-1000, hereafter “MR”) and one acoustic Doppler
velocimeter (ADV) were mounted on the pole (Figures 1b and c). A Conductivity-Temperature-
Depth (CTD) package and another ADV were attached at fixed locations on the H-beam. An
upward looking acoustic Doppler current profiler (ADCP) was mounted on a horizontal
extension beam attached to the bottom of the H-beam (Figures 1c and d). The flow field around
the instrument-platform can be distorted as waves pass the NRL-platform. Therefore the
microstructure sensing packages were mounted on the pole so that the turbulent sensors, such as
shear probes and fast thermistors were placed about 0.8 m from the center of the H-beam to
avoid the distorted flow field (Figure 1c). The ADV was about 0.4 m from the center of the
beam. Note that all the sensing elements were directed toward the wave maker.
Apart from measurements inside the tank, background wind speed, wind direction, and
air temperature were also recorded from the weather station next to the tank at 8 m above the
ground. Environmental conditions and wave maker settings for the two experiments are given in
Tables 1 and 2, respectively.
Turbulent shear probe
The turbulence shear probe is part of a self-contained turbulence microstructure sensing
package (MicroRider-1000) developed by Rockland Scientific Inc. (e.g., Goodman et al. 2006;
Wolk et al. 2009). It is about 10 cm in diameter, 1 m long, and weighs 5.5 kg in air. The nose
cone of the instrument (Figure 3) holds the following sensors: two shear probes (SPM-38), two
fast-response thermistors (FP07) and high resolution pressure, acceleration and tilt sensors. The
instrument is powered by 9 – 18 VDC and data are recorded internally on a memory card.

OHMSETT WAVE MIXING ENERGY 9
Sampling frequencies for individual channels can be between 8 Hz and 4096 Hz. Apart from
TKE dissipation rates, the MicroRider-1000 is capable of measuring turbulent temperature
variance (TTV) dissipation rate. Dissipation rate of TTV is also a mixing energy estimator when
stratification is important. The sampling rate of shear probes and fast thermistors is 512 Hz, and
the rest of sensors sample at 64 Hz. For the January experiment, only one MR was deployed. For
the September experiment, we mounted three MRs at depth intervals of about 0.23 and 0.25 m
(Figures 1 and 2). As mentioned above, the three MRs were mounted on the movable pole on the
NRL instrument platform that was adjusted vertically to obtain dissipation estimates between
0.16 m and 0.75 m depths (Figure 2).
Acoustic Doppler velocimeters (ADV)
Two acoustic Doppler velocimeters (ADV), owned by Ohmsett, were also used to
measure the turbulence velocities under wave actions. The ADV samples the flow field in three
perpendicular directions (along tank, cross tank, and vertical) at a rate of 32 Hz. The accuracy of
the measurement is about 1 mm/s. One ADV was placed 0.25 m below the three MRs on the
movable pole and a second ADV was placed on the beam at depth 1.5 m below the water
surface.
Acoustic Doppler current profiler (ADCP)
The ADCP mounted on the bottom of the NRL platform was a 1200-kHz broadband
Workhorse Sentinels (RD Instruments). Furthermore, two 600-kHz ADCPs were placed on the
bottom of the tank floor (35m and 163 m, respectively, to the wave maker) (Figure 1). The
ADCPs recorded profiles of currents and bubble echo intensity during both experiments.
OHMSETT WAVE MIXING ENERGY 10
Measurement procedure and Data processing
Measurement procedure
We conducted TKE dissipation measurements for both short- and long-duration wave
actions. Tests under short-duration wave actions focused on TKE dissipation measurements prior
to the presence of reflected waves from the tank boundary. Tests under long-duration wave
actions represented the standard dispersant effectiveness testing (S.L. Ross, 2001).
During short-duration testing, the bridge and instrument-platform were first positioned at
a distance of 170 m from the wave maker before starting the wave maker. Once waves were
generated, the bridge-instrument platform moved toward the wave maker from its initial position
to a location 35 m from the wave maker at a steady towing speed of 0.53 m/s, while encountering
wave breaking events and collecting concurrent measurements of microscale velocity shear,
currents, and temperature and salinity in the tank. Depending on the wave periods generated by
different paddle-frequency settings (Table 2), the waves reflected from the beach end reached the
moving bridge and instrument platform within 240 – 290 sec after the start of wave actions.
The protocol of the standard dispersant effectiveness tests at Ohmsett requires a 5-min
wave generation for the development of wave conditions prior to the release of oil and dispersant
into the tank. The duration of the dispersant effectiveness test can last 30 min or longer (Fingas
& Decola, 2006; S.L. Ross, 2001). Strong interactions among incoming and reflected waves
were observed during the long-duration wave actions. TKE production and dissipation rates
under these long-duration wave actions were affected by reflected waves.
For a given test run, microscale velocity shears were measured at three different depths
with vertical spacing of about 0.23 and 0.25 m (Figure 1c and Table 2). Each test run lasted
about 250 sec. We repeated this measurement procedure to construct vertical profiles of TKE
OHMSETT WAVE MIXING ENERGY 11
dissipation rates by adjusting the vertical position of the pole at increments of 2 cm to 5 cm to
construct vertical profile of TKE dissipation rate between 0.16 m and 0.75 m below the water
level. The wave maker settings for wave actions of monochromatic as well as random waves
based on the Pierson–Moskowitz (PM) spectra are given in Tables 1 and 2.
TKE dissipation from shear probe measurements
For homogeneous isotropic turbulence, the TKE dissipation rate is computed from the
variance of the turbulent velocity gradients (1). In practice, the velocity shear variance,
>∂∂< 2)/( xu , is estimated directly by integrating the shear spectrum from a specified
wavenumber band ranging from a low-wavenumber representing inertial subrange motions to the
dissipation wavenumber (or the Kolmogorov wavenumber, 4/13)/( νε ). However, when turbulent
motions are highly energetic, such as during surface wave-breaking events, the shear probes used
in microstructure sensing packages do not fully resolve the shear spectrum at higher
wavenumbers, thus underestimating the TKE dissipation rate. When the turbulent dissipation is
weak, and the background noise is large or comparable with the velocity shear signal, shear
probes observations are contaminated by the background noise (such as vibrations resulting from
the measuring platform). Therefore, the area under the measured velocity shear spectra
represents only part of the total variance of shear. To estimate the dissipation rate, the measured
shear spectra are fit to the Nesmith universal spectrum (Oakey, 1982; Wolk et al., 2009) or the
theoretical spectral shape in the inertial-subrange
3/13/23/41 )2()( kAk επαφ = , (2)
where A1=24/55 for the transverse spectrum, and α=1.5 is the universal constant. Note that the
wavenumber k is in cycles per meter (hereafter cpm). The dissipation rate can be estimated by
fitting the theoretical form of )(kφ (2) to the observed shear spectrum, )(kMφ , in the inertial

OHMSETT WAVE MIXING ENERGY 12
subrange wavenumber band from ka to kb. By combining (2) and the observed transverse
wavenumber spectrum, )(kMφ , we determined the TKE dissipation rate as (e.g.,Tennekes &
Lumley, 1972; Bluteau et al., 2016):
2/33/43/43/41 )]()2(/()3/4[( ab kkAE −= παε , (3)
where .)(∫=b
a
k
kM dkkE φ
During the experiments, the two shear probes in each MR were mounted orthogonal to
each other to measure the cross-stream and vertical velocities gradients while the sensor platform
was moving along the tank or the along-stream direction. We computed transverse spectra of
velocity shear for the two orthogonal components (cross-stream and vertical), and then averaged
both together to construct a representative spectrum for a given data segment, )(kMφ , where k is
the wavenumber in the direction of the mean flow (i.e., along the tank-axis). The measurements
from the moving platform enable the conversion of the velocity-shear frequency spectrum into a
wavenumber spectrum using Taylor’s frozen turbulence hypothesis. For a sampling rate of 512
Hz and a platform speed of 0.53 m/s, velocity fluctuations can be resolved at 1 mm spatial scales.
Velocity-shear frequency spectra, )( fMφ , were calculated for 1-sec segments of velocity-shear
measurements. The frequency spectra )( fMφ were converted to the wavenumber spectrum,
where )()( fUk MBM φφ = , k=f/UB, UB is the towing speed of the bridge in m/s, and f is the
frequency in Hz. Examples of velocity shear spectra for 1-sec data segments from Test 15 (Table
2) for three different dissipation levels are illustrated in Figure 4 along with the Nasmyth
empirical spectrum. The TKE dissipation rate (3) was evaluated first by averaging spectral
estimates from two shear probes, and then by integrating the averaged shear spectrum between

OHMSETT WAVE MIXING ENERGY 13
ka=10 cpm and kb=35 cpm. Estimated TKE dissipation rates based on (3) for the spectra shown
in Figure 4 are 2.99x10⁻⁶ W/kg, 1.37x10⁻⁴ W/kg, and 7.35x10⁻² W/kg, respectively.
TKE dissipation from ADV measurements
We collected three-dimensional turbulent velocity fluctuations in the along-stream
(along-tank), cross-stream (cross-tank), and vertical directions from the ADVs mounted on the
platform. The sampling rate of 32 Hz was sufficient to resolve the inertial-subrange velocity
fluctuations at a bridge speed of 0.53 m/s. As discussed above, the inertial-subrange velocity
spectral level can be used to evaluate the TKE dissipation rate by fitting a theoretical turbulent
longitudinal velocity spectrum,
3/53/23/22 )2()( −−= kAku επαφ , (4)
where A2=18/55. The velocity frequency spectrum, )( fuMφ was computed for each 10-second
segment of ADV data, and then the wavenumber spectrum, )(kuMφ was constructed by
following Taylor’s frozen hypothesis, where )()( fUk uMBuM φφ = . Examples of )(kuMφ from the
two ADVs at 0.9 m and 1.5 m depths during Test 15 are shown in Figures 5a and b, respectively
(Table 4). The spectral peaks in Figure 5a represents the wave orbital velocity motions of the
monochromatic waves generated by the wave maker with a frequency setting of 35 cycles per
minute. Note that peak wavenumbers (Figure 5) of the velocity spectra from the ADVs on the
NRL platform were a slightly higher than those corresponding to the paddle frequency due to the
Doppler shift by the platform’s moving speed BU . At higher wavenumbers, a -5/3 spectral slope
can be clearly identified despite the presence of a spectral peak at wavenumber 7.5 cpm, which
could be caused by vibration of the bridge during towing. By fitting the velocity spectra, )(kuMφ ,
to the spectral model (4) between k=3.5 cpm and 5.5 cpm, TKE dissipation rates were estimated.

OHMSETT WAVE MIXING ENERGY 14
Resulting dissipation rates for the spectra shown Figures 5a and b, are about 2x10⁻⁴ W/kg and
3x10⁻⁵ W/kg, respectively.
Wave parameters
During the experiments, surface wave elevations were obtained from measurements by
pressure sensors in the MRs at a sampling rate of 512 Hz and by the downward-looking sonic-
altimeters mounted on the bridge platform at a sampling rate of 10 Hz. Surface wave elevations
estimated from the altimeters and the pressure sensors were very similar. For a better
synchronization with velocity shear measurements from the MRs, we used surface elevations
derived from the pressure sensor in MR121 (Figure 1c). Wave actions in the tank were
characterized by the significant wave height, 2/14σ=SH , where σ is the variance of wave
elevation of a specified time segment. In addition, the local wave amplitude, a, and frequency, fp,
were derived from wave elevations by using the wavelet analysis method (Huang et al., 2007;
Wang & Wijesekera, 2017). The local frequency, fp , was corrected for the Doppler shift by the
moving platform. We then computed the local steepness, ga /2ωδ = , where pfπω 2= and g is the
gravitational constant.
Results and Discussion
During these experiments, TKE dissipation measurements were carried out under wave
actions with frequent occurrences of wave breaking. Figure 6a shows a snap shot of whitecap
formations from wave breakings. The occurrences of whitecaps were evenly distributed in the
along-tank direction but with considerable patchiness. Figure 6b shows a wave breaking event
near the instrument-platform. Depth-averaged velocity between 0.4 m and 0.6 m (Figure 7) was
obtained from the bottom mounted ADCP placed at 163 m from the wave maker (Figure 1). The

OHMSETT WAVE MIXING ENERGY 15
5-min averaged, along- and cross-tank velocities fluctuated with a magnitude of 5 cm/s or less
during the experiment. The backscatter echo-intensity from the ADCP increased when the wave
maker was running and the background flow was relatively large (Figure 7b). The deepening of
high echo-intensity (Figure 7b) suggests stirring and movement of particles in the tank by
currents and turbulent motions, and entrainment of bubbles generated by wave breaking. Time
series of temperature and salinity were also collected from the CTD mounted near the bottom of
the tank (Figure 8). CTD observations showed no changes in salinity during the testing period
during September 25-26, but the temperature followed a diurnal cycle with a temperature
difference of about 1oC. A small increase in temperature (~0.05oC) was found when the wave
maker was active (Figure 7b).
TKE dissipation measurements under short-duration wave actions
Two examples of observations of short-duration wave actions made from the MRs are
shown in Figures 9 and 10, representing, respectively, paddle stroke frequency (cycles per
minute)/distance (cm) of 35/8 (Test 15, Table 2), and 40/6 (Test 5, Table 2). Both tests
produced similar results (Figures 9 and 10). In the following, we discuss results from Test 15 in
more detail. The 200-sec short segment of measurements, shown in Figure 9, was not affected by
the reflected waves from the beach end of the tank. The MRs first encountered the incoming
waves from the wave maker at about 10 sec into the measurements (Figure 9a). Surface wave
elevations showed highly modulated wave groups as depicted by the wave amplitude (Figure 9a).
The modulated wave groups are caused by the Benjamin-Feir instability mechanism (BFM),
which is the interaction between a strong carrier harmonic wave and waves at adjacent side-band
frequencies. The BFM leads to modulation of the initially monochromatic wave train, and as a
result some waves can become very large at the expense of others and ultimately break

OHMSETT WAVE MIXING ENERGY 16
(Benjamin & Feir, 1967; Babanin et al. 2007). Figure 9b illustrates time evolution of wave
steepness, δ, and microscale velocity-shear squared Sh2, which is used as an indicator of the
TKE dissipation rate. The velocity shear, Sh, was obtained by filtering velocity shear
measurements of the MR140 between frequencies of 5.3 Hz and 18.6 Hz and the corresponding
wavenumbers are 10 cpm and 35 cpm, respectively, for UB=0.53 m/s. The time series of TKE
dissipation rates were estimated from 1-sec segments of velocity shear data at 0.19m, 0.44m and
0.67m below the water level (Figure 9c).
Both δ and Sh2 peak near or at the center of the wave group (Figure 9b). Modulation
instability increased wave steepness to the geometry limits (Tulin & Waseda, 1999; Babanin et
al., 2007; Tian et al., 2012), and eventually led to wave breaking while injecting turbulence into
the water column. The periodicity of wave breaking at or near the center of the modulated group
is similar to observations from the open ocean described by Donelan et al. (1972) and Gemmrich
& Farmer (2004). Near-surface TKE dissipation at 0.19 m below the water surface varied in a
periodic manner in most occasions. The TKE dissipation rate varied between 10-6 W/kg and 10-2
W/kg and the strongest dissipations were found during breaking events. The enhancement of
dissipation rate was highly correlated with the increasing wave steepness (Figure 9). However,
the relationships among wave breaking, wave steepness, and the resulting TKE dissipation rates
at depths deeper than one wave height (0.53 m) are less correlated and dissipation rates remained
at O(10-6) to O(10-4) W/kg. Similar results were also observed in TKE measurements for slightly
different wave maker settings (Figure 10). .
TKE dissipation measurements under long-duration wave actions
Figure 11 shows a 200-sec of wave and TKE dissipation measurements under wave
actions after a 5-minute wave development, representing wave conditions for dispersant

OHMSETT WAVE MIXING ENERGY 17
effectiveness test (S.L. Ross, 2001). The wave fields under the long-duration wave actions were
affected by reflective wave energy. As a result, time series of surface wave elevations show
strong wave modulation and formation of wave groups (Figures. 11a and b). Near-surface TKE
dissipation rate at 0.21 m below the surface was strongest at or near the center of wave groups
(Figure 11c). Wave breakings inject turbulent energy and increase the instantaneous dissipation
rate from 10-6 W/kg to 10-2 W/kg. Variations in TKE dissipations at deeper depths (0.46 and 0.69
m) are less significant under breaking waves. These results are similar to the measurements
under short-duration wave actions (Figures 8 and 9).
Results of TKE dissipation measurements are presented by time-averaging TKE
dissipation rate, <ε> over a selected 80-sec segment for each test run. Here the 80-sec segment
from the moving bridge at UB=0.53 m/s covers about a 42-m length of the tank. Averaged TKE
dissipation rates under short-duration and long-duration wave actions are tabulated in Table 3
and 4, respectively.
Vertical profiles of TKE dissipation
Vertical profiles of TKE dissipation were constructed by time averaging dissipation
estimates at depths from 0.15 m to 0.75 m. Figure 12 shows vertical profiles of TKE dissipation
for both experiments. The vertical profiles of TKE dissipation rate for long-duration wave
actions, >< Lε are from the observations made during the second experiment conducted in
September 2015 (Table 5). The vertical profiles of TKE dissipation rate for short-duration wave
actions, >< Sε were obtained by combining both January and September experiments. At depths
less than 0.2 m, the near-surface >< Lε is O(10-4 )W/kg, which is comparable with >< Sε .
However, the vertical structure of >< Lε and >< Sε are significantly different at depths below
0.3 m. >< Lε decreases with depth more rapidly than >< Sε . At depths below 0.4 m, >< Lε

OHMSETT WAVE MIXING ENERGY 18
became one order of magnitude smaller than >< Sε . These observations suggest that the injected
turbulence generated by breaking waves under long-duration wave actions has less impact on the
vertical distribution of TKE dissipation as compared to that of short-duration wave actions. The
difference in the depth-dependent vertical structure of TKE dissipation is likely caused by the
wave flow fields influenced by strong interactions between incident and reflected waves during
long-duration wave actions. Further study is needed.
In general, >< Lε and >< Sε decrease with depth (Figure 12) following a power law
relation and can be approximately represented by
m4.0z m1.0,103 58 ≤≤×>=< −− zLε , and (5)
. m5.0z m1.0,105 36 ≤≤×>=< −− zSε (6)
At depths below 0.4 m, both >< Lε and >< Sε do not change significantly with depth. >< Lε
remains about 3x10⁻⁶ W/kg, which is one order of magnitude smaller than >< Sε that is about
4x10⁻⁵ W/kg.
Comparison with open ocean observations
Near-surface TKE dissipation rates in the ocean are on the order of 10-4 to 10-2 W/kg for
winds reaching 20 m/s and wave heights exceeding 7 m (Thomson et al. 2016). Similar
dissipation rates were also found during moderate wind conditions (e.g., Gemmrich, 2010;
Schwendeman et al., 2014; Sutherland & Melville, 2015). Germmrich and Farmer (2004)
measured TKE dissipation rates associated with individual breaking events at winds up to 14
m/s. They showed that the background TKE dissipation at 1-m depth prior to the breaking event
was about 5x10⁻⁶ W/kg and that the dissipation at the same depth during breaking was as large as

OHMSETT WAVE MIXING ENERGY 19
8x10⁻³ W/kg. Furthermore, they reported that wave breaking occurred near the crest of the largest
wave in the wave group. These observations are consistent with the magnitude and pattern of
dissipation rate enhancement during wave breakings in our tank experiments, even though the
length and time scales of waves in the tank are much smaller than wave conditions in the open
ocean. More recently, Callaghan et al. (2016) suggested that space and time averaged TKE
dissipation rates in actively breaking waves are largely independent of length and time scales of
breaking waves. They postulated that more energetic breaking waves increase air entrainment
but not significantly increase the averaged turbulent intensity. Vertical profiles of near-surface
TKE dissipation in the open ocean tend to follow the power law, z-m, where m varies from 1 to 2
(e.g. Sutherland & Melville, 2015; Thomson et al., 2016), and is close to the vertical structure of
>< Sε with wave breaking without the influence of reflected waves (6).
TKE dissipation by ADV measurements
During these experiments, TKE dissipation rate was also computed from velocity
measurements by the two ADVs. The ADV on the movable pole measured currents at 0.92 to
0.97 m depths. The second ADV was at a fixed depth of 1.5 m. The results are shown in Table
4. The TKE dissipation rates from the ADVs are in the range of O(10-4) to O(10-5) W/kg that is
relatively higher than those from MRs considering that the ADVs are at deeper depths. We
suspect this could be caused by contamination of velocity data at high frequencies due to the
vibration from the moving platform as shown in Figure 5. Veron (2009) measured dissipations
by an ADV at 0.53 m depth and reported dissipation in the range of O(10-3) to O(10-4)W/kg.
Further study is needed for the validity of using ADV measurements for TKE dissipation at
Ohmesett.

OHMSETT WAVE MIXING ENERGY 20
Conclusions
A total of 38 test runs were carried out to evaluate turbulent mixing levels for two types of
wave conditions, namely (1) long-duration wave action for the standard dispersant effectiveness
tests, and (2) short-duration wave actions prior to the presence of reflected waves from the tank
boundary. The monochromatic waves, generated by the wave maker, modulated rapidly into
wave groups as they propagated downstream. Periods of the modulated wave groups were 4 to
10 times the initial periods of the monochromatic waves. Largest near-surface TKE dissipation
rates were found at or near the center of the modulated wave groups, where the wave steepness
was large. The observations suggest that the modulation instability increased wave steepness to
its critical geometric limit, thus initiating wave breaking. During wave breaking events, the near-
surface TKE dissipation was on the order of 10-2 W/ kg, which was two to three orders of
magnitude larger than before and after the wave breaking. The strongest turbulent mixing was
limited to a near-surface layer of about 0.4 m (~ equivalent to a significant wave height).
Vertical profiles of TKE dissipation rate were constructed by time-averaging dissipation
estimates. The vertical profiles of long-duration wave actions, >< Lε , and short-duration wave
actions, >< Sε , are comparable at depths less than 0.2 m. However, the vertical structure of
>< Lε and >< Sε were significantly different at deeper depths. >< Lε decreased with depth
more rapidly than that of >< Sε . At depths below 0.4 m, >< Lε became one order magnitude
smaller than >< Sε . The depth dependence of >< ε can be approximated by the power law,
nz−∝>< ε , where z is the depth from the water surface, 5=n for long-duration dispersant
effectiveness tests, and 3=n for short-duration tests without impact from reflected waves.
OHMSETT WAVE MIXING ENERGY 21
The enhancement of TKE dissipation by wave breaking occurring near or at the center of
wave groups is consistent with the open ocean observations. The magnitude and vertical profile
of TKE dissipation rate under breaking waves of short-duration wave actions are comparable
with open ocean observations.
Recommendations
1. We find significant differences in the vertical structure of TKE dissipation rate for wave
breaking under short-duration monochromatic wave actions and long-duration more
complex wave conditions caused by reflected waves. The vertical structure of TKE
dissipation rate under short-duration wave actions is closer to results from field
observations. We recognize that the dispersant effectiveness test at Ohmsett requires a
long-duration of wave actions (30 min or longer, S. L. Ross 2001). Therefore, the impacts
of reflective waves on wave breaking, breaking mechanisms, and the resulting energy
dissipation under long-duration wave actions should be further examined. The energy-
damping setup in the tank partially absorbs the incident wave energy, and the wave
conditions under the effect of reflected waves could result in stronger modulations, and
more wave breakings. We recommend that vertical profile measurements of TKE
dissipation should be conducted at a fixed time interval to characterize the temporal and
spatial evolution of TKE dissipation under longer duration wave actions.
2. A redesign of the energy damping beach to reduce impacts of wave reflections during
long-duration tests should be considered.

OHMSETT WAVE MIXING ENERGY 22
References
Asher, W. (2005). Data report for a wave characterization study at the Ohmsett wave basin.
Report to Minerals Management Service.
Babanin, A., Chalikov, D., Young, I., & Savelyev, I. (2007). Predicting the breaking onset of
surface water waves. Geophysical Research Letters, 34(7).
Belore, R. C.,Trudel, B. K., & Lee. K., (2005). Correlating wave tank dispersant effectiveness
tests with At-Sea trials. in International Oil Spill Conference, 1, 65-70, American
Petroleum Institute.
Benjamin, T. B., & Feir, J. E. (1967). The disintegration of wave trains on deep water Part 1.
Theory. Journal of Fluid Mechanics, 27(03), 417-430.
Bluteau, C. E., Jones, N. L., & Ivey, G. N., (2016). Estimating turbulent dissipation from
microstructure shear measurements using maximum likelihood spectral fitting over the
inertial and viscous subrange. Journal of Atmospheric and Oceanic Technology, 33, 4,
pp. 713-722.
Boufadel, M. C., Wickley-Olsen, E., King, T., Li, Z., Lee,K., & Venosa. A. D., (2008).
Theoretical foundation for predicting dispersion effectiveness due to waves. in
International Oil Spill Conference, Vol. 2008, No. 1, pp. 509-513. American Petroleum
Institute.
Brown, N., & Guarino, A., (2010). The Ohmsett Ocean Energy Test Facility, In proceedings of
the 29th American Towing Tank Conference, p. 165-170.
Callaghan, A. H., Deane, G. B., & Stokes, M. D. (2016). Laboratory air‐entraining breaking
waves: Imaging visible foam signatures to estimate energy dissipation. Geophysical
Research Letters 43, no. 21.
OHMSETT WAVE MIXING ENERGY 23
Donelan, M., Longuet-Higgins, M. S. & Turner, J. S., (1972). Periodicity in whitecaps. Nature,
Vol. 239, pp. 449-451.
Fingas, M. F., & Decola, E. (2006). Oil Spill Dispersant Effectiveness Testing in OHMSETT,
February-March 2006. Prince William Sound Regional Citizens' Advisory Council.
Gemmrich, J., (2010). Strong turbulence in the wave crest region. J. Phys. Oceanogr., 40, 583–
595
Gemmrich, J., & Farmer, D., (2004). Near-surface turbulence in the presence of breaking waves.
J. Phys. Oceanogr., 34, 1067–1086,
Goodman, L., Levine, E. R., & Lueck, R. G., (2006). On measuring the terms of the turbulent
kinetic energy budget from an AUV. Journal of Atmospheric & Oceanic Technology,
23(7).
Guarino, A., Schmidt, B., Meyer, P., & Delgado, J., (2010). Recent Testing, Training, and
Research Conducted at Ohmsett - The National Oil Spill Response Research &
Renewable Energy Test Facility. In proceedings of the 29th American Towing Tank
Conference, p. 147-156.
Huang, Z. C., & Hwung, H. H., (2007). Local properties of wave modulation observed by
wavelet analysis. In the Seventeenth International Offshore and Polar Engineering
Conference. International Society of Offshore and Polar Engineers.
Kaku, V. J., Boufadel, M., & Venosa, A. D., (2005). Evaluation of turbulence parameters in
laboratory flasks used for dispersant effectiveness testing. International Oil Spill
Conference Proceedings, 395- 398
OHMSETT WAVE MIXING ENERGY 24
Li, Z., Lee, K., King, T., Boufadel, M. C., & Venosa, A. D., (2008). Assessment of chemical
dispersant effectiveness in a wave tank under regular non-breaking and breaking wave
conditions. Marine Pollution Bulletin 56, 903-912.
Lueck R. G., Wolk, F., & Yamazaki, H., (2002). Oceanic velocity microstructure measurements
in the 20th Century. Journal of Oceanography. Vol 58, 153-174.
Mullin, J. V., & Trudel, K., (2006). Five years of dispersant testing in the OHMSETT wave tank:
controversial problems, limits of response technology, methods and training. Proceedings
from Interspill. NRC.
National Research Council (2005).Understanding oil spill dispersants: Efficacy and Effects.
National Academies Press. Washington DC.
Oakey, N. S. (1982). Determination of the rate of dissipation of turbulent energy from
simultaneous temperature and velocity shear microstructure measurements. J. Phys.
Oceanogr., 12, 256-271.
S.L. Ross Environmental Research Ltd. (2001). Ohmsett dispersant test protocol development,
Report to the U.S. Department of the Interior, Minerals Management Service, Herndon,
VA.
S.L. Ross Environmental Research Ltd. (2005). Dispersant effectiveness testing: Relating results
from Ohmsett to at-sea tests. Report to the U.S. Department of the Interior, Minerals
Management Service, Herndon, VA.
Schwendeman, M., Thomson, J., & Gemmrich, J., (2014). Wave breaking dissipation in a young
wind sea. J. Phys. Oceanogr., 44, 104–127,
Sutherland, P., & Melville, W. K. (2015). Field measurements of surface and near-surface
turbulence in the presence of breaking waves. J. Phys. Oceanogr., 45, 943-965.

OHMSETT WAVE MIXING ENERGY 25
Tennekes, H. and J. L. Lumley, (1972). A first course in turbulence. MIT press, 1972.
Thomson, J., Schwendeman, M. S., Zippel, S. F., Moghimi, S., Gemmrich, J. , & Rogers, W. E.
(2016). Wave-breaking turbulence in the ocean surface layer, J. Phys. Oceanogr., 46,
1857–1870.
Tian, Z., Perlin, M., & Choi, W., (2012). An eddy viscosity model for two-dimensional breaking
waves and its validation with laboratory experiments. Phys. Fluids 24:036601
Tulin, M. P., & Waseda, T. (1999). Laboratory observations of wave group evolution, including
breaking effects. J. Fluid Mech. 378:197–232
Venosa, A. D., Kaku, V. J., & Boufadel, M., (2005). Measuring energy dissipation rates in a
wave tank. International Oil Spill Conference Proceedings,183-196.
Venosa, A. D, Lee, K., Boufadel, M., Li, Z., Wickley-Olsen, E., & King, T., (2006). Dispersant
effectiveness as a function of energy dissipation rate in an experiment wave tank.
International Oil Spill Conference Proceedings: 777-783.
Veron, F. (2009). Surface turbulence measurements at Ohmsett. Report to US Minerals
Management Service. S. L. Ross Environmental Research, Ottawa, ON, Canada.
Veron, F., & W. K. Melville, (1999). Pulse-to-pulse coherent Doppler measurements of waves
and turbulence. J. Atmos. and Ocean. Technol., 16, 1580-1597. (1999).
Wang, D. W., & Wijesekera, H. W., (2017). Observations of breaking wave energy dissipation
under modulated wave groups (to be submitted).
Wickley-Olsen, E., Boufadel, M. C., King, T., Li, Z., Lee, K., & Venosa, A. D., (2008). Regular
and breaking waves in wave tank for dispersion effectiveness testing. In International Oil
Spill Conference, 1, 499-508. American Petroleum Institute.

OHMSETT WAVE MIXING ENERGY 26
Wolk, F., Lueck, R.G., & St. Laurent L., (2009). Turbulence measurements from a glider. 13th
Workshop on Physical Processes in Natural Waters, Palermo, Italy, 1-4 September 2009.
OHMSETT WAVE MIXING ENERGY 27
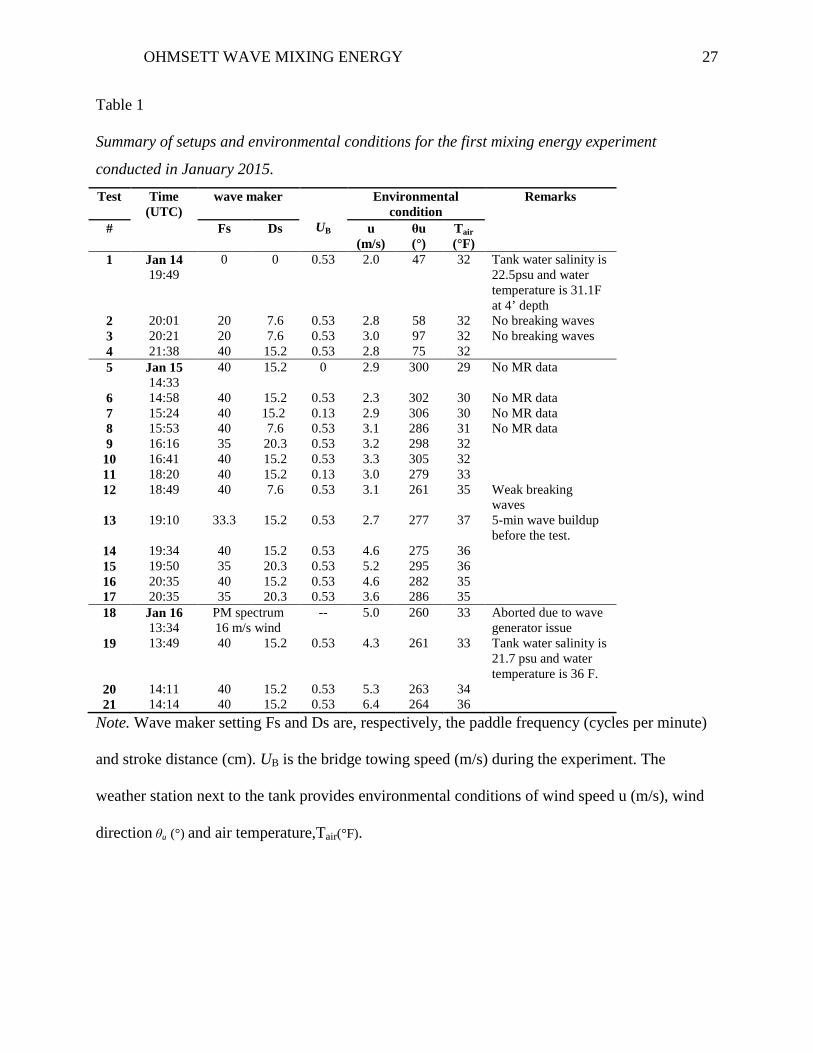
Table 1
Summary of setups and environmental conditions for the first mixing energy experiment
conducted in January 2015.
Test Time (UTC)
wave maker
UB
Environmental condition
Remarks
# Fs
Ds
u (m/s)
θu (°)
Tair (°F)
1 Jan 14 19:49
0 0 0.53 2.0 47 32 Tank water salinity is 22.5psu and water temperature is 31.1F at 4’ depth
2 20:01 20 7.6 0.53 2.8 58 32 No breaking waves 3 20:21 20 7.6 0.53 3.0 97 32 No breaking waves 4 21:38 40 15.2 0.53 2.8 75 32 5 Jan 15
14:33 40 15.2 0 2.9 300 29 No MR data
6 14:58 40 15.2 0.53 2.3 302 30 No MR data 7 15:24 40 15.2 0.13 2.9 306 30 No MR data 8 15:53 40 7.6 0.53 3.1 286 31 No MR data 9 16:16 35 20.3 0.53 3.2 298 32
10 16:41 40 15.2 0.53 3.3 305 32 11 18:20 40 15.2 0.13 3.0 279 33 12 18:49 40 7.6 0.53 3.1 261 35 Weak breaking
waves 13 19:10 33.3 15.2 0.53 2.7 277 37 5-min wave buildup
before the test. 14 19:34 40 15.2 0.53 4.6 275 36 15 19:50 35 20.3 0.53 5.2 295 36 16 20:35 40 15.2 0.53 4.6 282 35 17 20:35 35 20.3 0.53 3.6 286 35 18 Jan 16
13:34 PM spectrum 16 m/s wind
-- 5.0 260 33 Aborted due to wave generator issue
19 13:49 40 15.2 0.53 4.3 261 33 Tank water salinity is 21.7 psu and water temperature is 36 F.
20 14:11 40 15.2 0.53 5.3 263 34 21 14:14 40 15.2 0.53 6.4 264 36
Note. Wave maker setting Fs and Ds are, respectively, the paddle frequency (cycles per minute)
and stroke distance (cm). UB is the bridge towing speed (m/s) during the experiment. The
weather station next to the tank provides environmental conditions of wind speed u (m/s), wind
direction θu (°) and air temperature,Tair(°F).
OHMSETT WAVE MIXING ENERGY 28
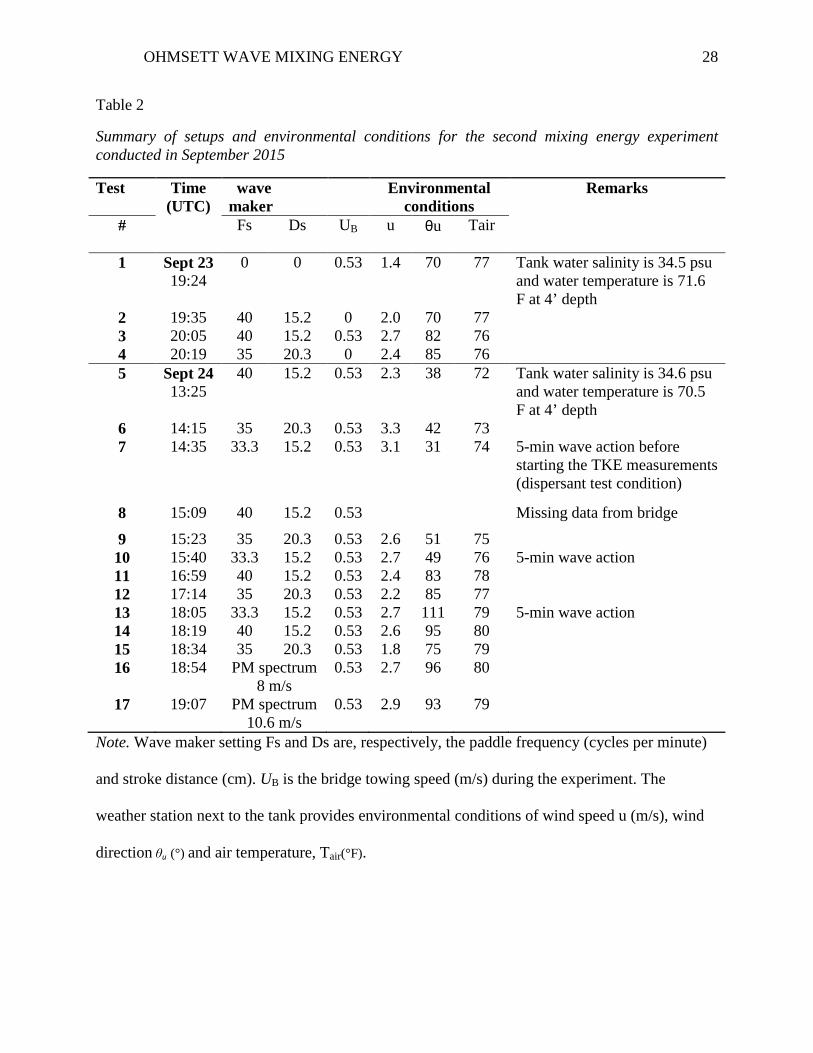
Table 2
Summary of setups and environmental conditions for the second mixing energy experiment conducted in September 2015
Test Time (UTC)
wave maker
Environmental conditions
Remarks
# Fs
Ds
UB
u θu Tair
1 Sept 23 19:24
0 0 0.53 1.4 70 77 Tank water salinity is 34.5 psu and water temperature is 71.6 F at 4’ depth
2 19:35 40 15.2 0 2.0 70 77 3 20:05 40 15.2 0.53 2.7 82 76 4 20:19 35 20.3 0 2.4 85 76 5 Sept 24
13:25 40 15.2 0.53 2.3 38 72 Tank water salinity is 34.6 psu
and water temperature is 70.5 F at 4’ depth
6 14:15 35 20.3 0.53 3.3 42 73 7 14:35 33.3 15.2 0.53 3.1 31 74 5-min wave action before
starting the TKE measurements (dispersant test condition)
8 15:09 40 15.2 0.53 Missing data from bridge
9 15:23 35 20.3 0.53 2.6 51 75 10 15:40 33.3 15.2 0.53 2.7 49 76 5-min wave action 11 16:59 40 15.2 0.53 2.4 83 78 12 17:14 35 20.3 0.53 2.2 85 77 13 18:05 33.3 15.2 0.53 2.7 111 79 5-min wave action 14 18:19 40 15.2 0.53 2.6 95 80 15 18:34 35 20.3 0.53 1.8 75 79 16 18:54 PM spectrum
8 m/s 0.53 2.7 96 80
17 19:07 PM spectrum 10.6 m/s
0.53 2.9 93 79
Note. Wave maker setting Fs and Ds are, respectively, the paddle frequency (cycles per minute)
and stroke distance (cm). UB is the bridge towing speed (m/s) during the experiment. The
weather station next to the tank provides environmental conditions of wind speed u (m/s), wind
direction θu (°) and air temperature, Tair(°F).

OHMSETT WAVE MIXING ENERGY 29
Table 3
Summary of turbulent mixing measurements of the first mixing energy experiment
Test wave maker
wave
TKE dissipation
# Fs
Ds
Hs m
z m
<ε>x104
W/kg 19 40 15.2 0.47 0.15 31.81 10 40 15.2 0.43 0.22 2.41 20 40 15.2 0.43 0.30 1.30 14 40 15.2 0.42 0.38 0.41 16 40 15.2 0.41 0.53 0.55 9 35 20.3 0.58 0.22 5.15 15 35 20.3 0.54 0.38 1.29 17 35 20.3 0.59 0.53 0.31 2 20 7.6 0.18 0.22 0.00072 3 20 7.6 0.16 0.22 0.00041 12 40 7.6 0.25 0.22 0.04 13 33.3 15.2 0.50 0.22 1.34
Note. Hs is the significant wave height. <ε> is the ensemble average TKE dissipation over the 80-
sec TKE dissipation measurements. z is the MicroRider depth to the water line.

OHMSETT WAVE MIXING ENERGY 30
Table 4
Summary of turbulent mixing measurements of the second mixing energy experiment.
Test wave maker
TKE dissipation rate <ε> MR ID
TKE dissipation rate <ε> ADV ID
MR 140 MR121 MR088 ADV 9659 ADV 9677 # Fs
Ds
Hs m
z m
<ε> x104
z m
<ε> x104
z m
<ε> x104
z m
<ε> x104
z m
<ε> x104
3 40 15.2 0.41 0.16 9.10 0.41 1.00 0.64 0.55
5 40 15.2 0.41 0.16 8.31 0.41 1.16 0.64 0.45
14 40 15.2 0.31 0.19 0.80 0.44 0.07 0.67 0.02 0.90 0.29 1.50 0.27
8 40 15.2 0.39 0.21 1.91 0.46 0.34 0.69 0.38 0.92 0.71 1.50 0.24
11 40 15.2 0.40 0.26 1.33 0.51 0.43 0.74 0.10 0.97 0.41 1.50 0.15
6 35 20.3 0.58 0.16 25.74 0.41 0.06 0.64 0.03
15 35 20.3 0.53 0.19 20.02 0.44 0.95 0.67 0.82 0.90 2.63 1.50 0.37
9 35 20.3 0.46 0.21 11.72 0.46 0.95 0.69 0.30 0.92 2.14 1.50 0.68
12 35 20.3 0.48 0.26 4.71 0.51 1.01 0.74 0.35 0.97 2.11 1.50 0.48
7 33.3 15.2 0.49 0.16 4.4 0.41 0.03 0.64 0.03
10 33.3 15.2 0.41 0.21 2.0 0.46 0.05 0.69 0.02 0.92 0.74 1.50 0.05
13 33.3 15.2 0.47 0.26 0.11 0.51 0.02 0.74 0.02 0.97 3.53 1.50 0.24
16 PM spectra 8 m/s
0.19 0.001 0.44 0.001 0.67 0.005
17 PM spectra 10.6 m/s
0.19 0.004 0.44 0.002 0.67 0.006
Note. Hs is the significant wave height. <ε> is the ensemble average TKE dissipation of 80-sec
measurement segments. z is the MicroRider depth to the water surface.

OHMSETT WAVE MIXING ENERGY 31
Table 5
Vertical profile of TKE dissipation rate
Depth TKE dissipation rate
95% confidence interval <ε>
z (m) <ε> x104
W/kg Upper ε
x104 W/kg
Lower ε x104 W/kg
0.16 4.42 10.60 1.84 0.21 2.03 4.49 0.92 0.26 0.11 0.158 0.072 0.41 0.032 0.044 0.024 0.46 0.045 0.065 0.032 0.51 0.022 0.028 0.018 0.64 0.031 0.042 0.023 0.69 0.024 0.030 0.019 0.74 0.021 0.025 0.017
Note. Ensemble average <ε>, upper and lower limits of 95% confidence interval of 80-sec TKE
measurement segments under long-duration wave actions generated according to wave maker
setting of paddle stroke frequency of 33.3 cycles per minute and distance of 15.2 cm.

OHMSETT WAVE MIXING ENERGY 32
(c) (d)
Figure 1. (a) Ohmsett aerial photo, (b) schematic diagram of the wave tank, the NRL
instrument platform, and locations of three MRs (red) and two ADVs (blue), three
ADCPs (yellow), CTD (brown) and Altimeter (green). (c) Configuration of the
instrument platform and sensors, and (d) photo of the platform and mounted sensors
before the deployment.

OHMSETT WAVE MIXING ENERGY 33
(a) (b) Figure 2. (a) installation of the instrument platform to the main bridge, and (b)
adjustment of platform vertical position during the experiments.

OHMSETT WAVE MIXING ENERGY 34
(a) (b) Figure 3. (a) The three MRs and the mounting bracket of the NRL platform for the second
experiment. (b) A close-up look of MR nose cone showing two shear probes and two
thermistors.

OHMSETT WAVE MIXING ENERGY 35
Figure 4. Velocity shear wavenumber spectra for TKE dissipation rate of 2.99x10⁻⁶,
1.37x10⁻⁴ and 7.35x10⁻² W/kg. The velocity shear data are from the MR140 at 0.19 m
depth below water surface during Test 15 (Table 2). The gray curves represent the
universal Nysmith spectra for dissipation rates from 10-1 to 10-6 W/kg.

OHMSETT WAVE MIXING ENERGY 36
Figure 5. Longitudinal velocity wavenumber spectra from Test 15 by (a) ADV9659 and
(b) ADV9677 with TKE dissipation rates 2x10⁻⁴ and 3.1x10⁻⁵ W/kg, respectively. The
red dashed lines represent the k-5/3 fitting for the inertial subrange based on the spectral
energy between 3.5 to 5.5 cpm as indicated by the two red circles, respectively.

OHMSETT WAVE MIXING ENERGY 37
(a) (b) Figure 6. Photos of whitecaps from wave breakings during the experiments. (a) periodic
occurrence of whitecaps in along-tank direction (wave is travelling from photo’s bottom
to top ) and (b) whitecap of an individual wave breaking near the NRL platform (wave is
traveling away from the platform)

OHMSETT WAVE MIXING ENERGY 38
Figure 7. Time series of velocity measurements from the ADCP on the floor (163 m to
the wave maker) during the second experiment. (a) 5-min averaged along-tank (blue) and
cross-tank (red) velocities between 0.4 to 0.6 m depth (b) vertical profiles of echo
intensity.

OHMSETT WAVE MIXING ENERGY 39
Figure 8. Time series of (a) water temperature and (b) salinity measurements from the
CTD during the second experiment.

OHMSETT WAVE MIXING ENERGY 40
Figure 9. TKE dissipation measurements of Test 15. A 200-sec segment of (a) surface
wave elevation(blue) and amplitude of modulated wave group (red dashed line), (b)
band-passed velocity-shear squared, Sh2/1000 (red), and wave steepness, δ,(blue) and
(c) TKE energy dissipation rate of 1-sec velocity shear measurement segments from the
MRs at depths z= 0.19m (red), 0.44m (blue) and 0.67 m (black).

OHMSETT WAVE MIXING ENERGY 41
Figure 10. TKE dissipation measurements of Test 5. A 200-sec segment of (a) surface
wave elevation(blue) and amplitude of modulated wave group (red), (b) band-passed
velocity- shear squared, Sh2/1000, (red) and local wave steepness, δ, (blue) and (c) TKE
energy dissipation rate of 1-sec velocity shear measurement segments from the three MRs
at depth z= 0.16 (red), 0.41 (blue) and 0.64 m (black), respectively.

OHMSETT WAVE MIXING ENERGY 42
Figure 11. TKE dissipation measurements of Test 10. A 200-sec segment of (a) surface
wave elevation(blue) and amplitude of modulated wave group (red), (b) band-passed
velocity shear squared, Sh2/500, (red) and local wave steepness, δ, (blue) , and (c) TKE
dissipation rate of 1-sec velocity shear measurement segments from MRs at depth z= 0.21
(red), 0.46 (blue) and 0.69 m (black).

OHMSETT WAVE MIXING ENERGY 43
Figure 12. Vertical profile of TKE dissipation under wave actions. <εL> from long-
duration wave actions from the second experiment are represented by solid red circles.
<εS> from the short-duration wave actions tests of the first and second experiment are
represented, respectively, by blue triangles and circles. Horizontal solid lines represent
95% confidence intervals. The thick black dashed line represents an empirically-fitted
power law function, z-5, for near-surface <εL>. The dotted blue line represents the z-3 fit
for <εS> and z is measurement depth to the water surface of the tank.