market!share productioncosts · pdf filecocacola sample pepsico ... horizontal!integration! !...
TRANSCRIPT

-‐
83 www.tutor2u.net
Competition and Monopoly in Markets What is a market structure? A market structure describes the characteristics of a market that can affect the behaviour of businesses and also affect the welfare of consumers. Some of the main aspects of market structure are listed below:
• The number of firms in the market and the market share of the largest firms
• The nature of production costs e.g. the ability of businesses to exploit economies of scale
• The extent of product differentiation i.e. to what extent do the businesses try to make their products different from those of competing firms?
• The price and cross price elasticity of demand for different products
• The number and the power of buyers of the industry’s main products
• The turnover of customers -‐ this is a measure of the number of consumers who switch suppliers each year and it is affected by the strength of brand loyalty and the effects of marketing.
Competitive markets Competitive markets are industries where they intensity of competition between suppliers is high
• There are many key characteristics of competitive markets
• Many sellers none of whom has a dominant monopoly position
• Sellers produce slightly differentiated products giving consumers plenty of choice – leading to a high cross-‐price elasticity of demand
• The barriers to entering the market are low, allowing new firms with new products to come into the market in pursuit of profit
• Each seller has good access to the prevailing industry technologies
• Consumer loyalty to established businesses is fairly weak
• Consumers and sellers have full information about prices so that it easy for buyers to find the seller offering the best value for money
• The more competitive is a market, the more likely that an allocatively efficient outcome is achieved
The chart below shows the market share for the leading grocers in the UK in July 2015. It is widely regarded as an increasingly competitive market even though the leading three businesses together have well over 50 per cent of total grocery sales. Discount retailers such as Aldi and Lidl are increasing their market share.
28.4% 17.1%
16.4% 10.9%
6% 5.1% 5.3%
3.7% 2.1% 2.9%
2.1%
0.0% 5.0% 10.0% 15.0% 20.0% 25.0% 30.0%
Tesco Asda
Sainsbury's Morrisons
The Co-‐operalve Waitrose
Aldi Lidl
Iceland Other outlets
Symbols and Independent
Market share of total grocers
Grocers
SAM
PLE
-‐
84 www.tutor2u.net
What is a monopoly?
1. A pure monopolist in an industry is a single seller. It is rare for a firm to have a pure monopoly – except when the industry is state-‐owned and has a legally protected monopoly.
2. A working monopoly: A working monopoly is any firm with greater than 25% of the industries' total sales. In practice, there are many markets where businesses enjoy some degree of monopoly power even if they do not have a twenty-‐five per cent market share.
3. An oligopolistic industry is characterised by the existence of a few dominant firms, each has market power and which seeks to protect and improves its position over time.
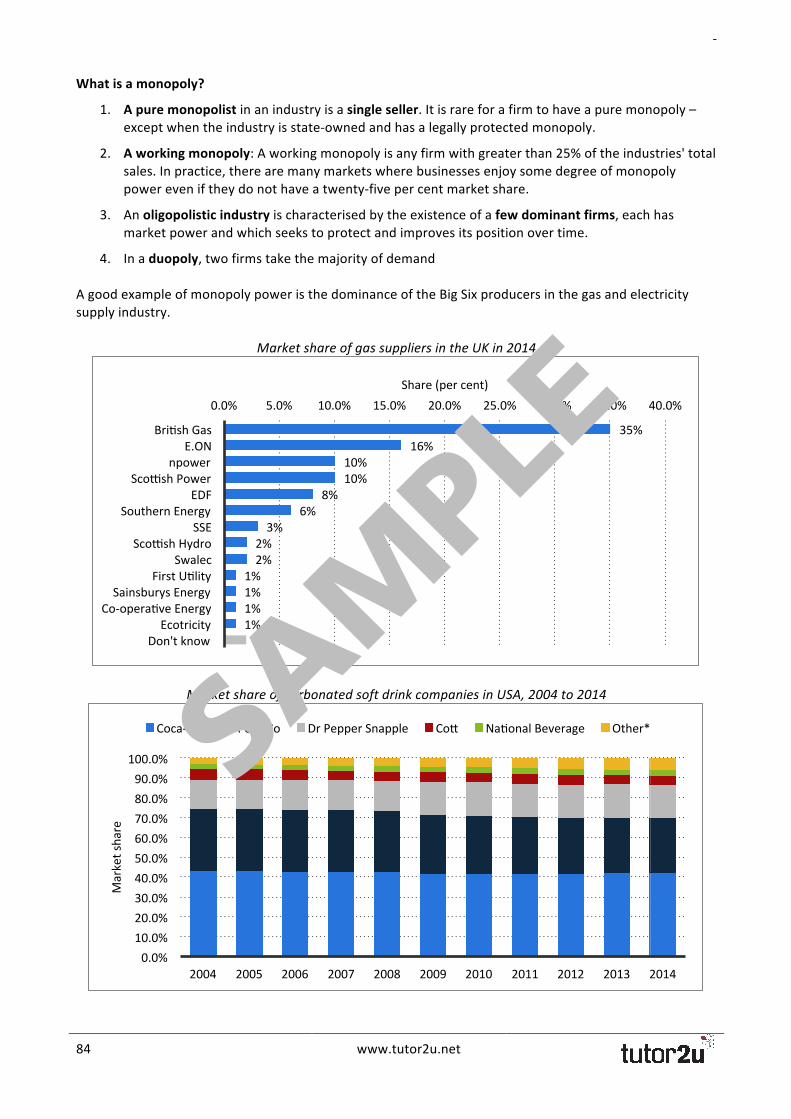
4. In a duopoly, two firms take the majority of demand A good example of monopoly power is the dominance of the Big Six producers in the gas and electricity supply industry.
Market share of gas suppliers in the UK in 2014
Market share of carbonated soft drink companies in USA, 2004 to 2014
35% 16%
10% 10%
8% 6%
3% 2% 2%
1% 1% 1% 1% 2%
0.0% 5.0% 10.0% 15.0% 20.0% 25.0% 30.0% 35.0% 40.0%
Brilsh Gas E.ON
npower Sco�sh Power
EDF Southern Energy
SSE Sco�sh Hydro
Swalec First Ullity
Sainsburys Energy Co-‐operalve Energy
Ecotricity Don't know
Share (per cent)
0.0% 10.0% 20.0% 30.0% 40.0% 50.0% 60.0% 70.0% 80.0% 90.0% 100.0%
2004 2005 2006 2007 2008 2009 2010 2011 2012 2013 2014
Market share
Coca-‐Cola PepsiCo Dr Pepper Snapple Cow Nalonal Beverage Other* SAM
PLE

-‐
85 www.tutor2u.net
Google has a near monopoly in the web search market in the UK. This is shown in the chart below.
Market Share in UK Web Searches – July 2015
How monopolies can develop Monopoly power can come from the successful organic (internal) growth of a business or through mergers and acquisitions (also known as the integration of firms).
Horizontal Integration This is where two firms join at the same stage of production in one industry. For example two car manufacturers may decide to merge, or a leading bank successfully takes-‐over another bank. Vertical Integration This is where a firm integrates with businesses at different stages of production e.g. by buying its suppliers or controlling the main retail outlets. A good example is the oil industry where leading companies are explorers, producers and refiners of crude oil and have retail networks for the sale of petrol and diesel and other products.
• Forward vertical integration occurs when a business merges with another business further forward in the supply chain
92.92%
3.8%
2.94%
0.08%
0.17%
0.01%
0.02%
0.04%
0.03%
0.0% 10.0% 20.0% 30.0% 40.0% 50.0% 60.0% 70.0% 80.0% 90.0% 100.0%
Yahoo!
bing
Ask Jeeves
DuckDuckGo
Webcrawler
AOL
Baidu
Other
Market share in July 2015 (per cent)
Close to a pure monopoly – but some compellon e.g. from
taxis
Working monopoly – but also an oligopoly
because of the dominance of the leading grocers
Costa is the dominant UK coffee firm in a
compellve oligopoly
Pepsi and Coca Cola dominate in a
duopoly SAM
PLE

-‐
86 www.tutor2u.net
• Backward vertical integration occurs when a firm merges with another business at a previous stage of the supply chain
The Internal Expansion of a Business Firms can generate higher sales and increased market share and exploiting possible economies of scale. This is internal rather than external growth and therefore tends to be a slower means of expansion contrasted to mergers and acquisitions. Barriers to Entry Barriers to entry are the means by which potential competitors are blocked. Monopolies can then enjoy higher profits in the longer-‐term. There are several different types of entry barrier including the following:
! Patents: Patents are legal property rights to prevent the entry of rivals. They are generally valid for 12-‐20 years and give the owner an exclusive right to prevent others from using patented products, inventions, or processes. Owners can sell licences to other businesses to produce versions of their patented product.
! Advertising and marketing: Developing consumer loyalty by establishing branded products can make successful entry into the market by new firms much more expensive. Advertising can also cause an outward shift of the demand curve and make demand less sensitive to price
! Brand proliferation: In many industries multi-‐product firms engaging in brand proliferation can give a false appearance of competition. This is common in markets such as detergents, confectionery and household goods – it is non-‐price competition.
Monopoly, market failure and government intervention Should the government intervene to break up or control the monopoly power of firms in market?
• Profits at the expense of consumers: The conventional argument against market power is that monopolists can earn abnormal (supernormal) profits at the expense of efficiency and the welfare of consumers and society.
• The monopoly price is assumed to be higher than both marginal cost leading to a loss of allocative efficiency and a failure of the market. The monopolist is extracting a price from consumers that is above the cost of resources used in making the product and, consumers’ needs and wants are not being satisfied, as the product is being under-‐consumed.
• Higher monopoly prices can have regressive effects on lower income households, for example utility businesses exploiting their market power may make essential goods and services less affordable for relatively poorer families.
• The absence of genuine market competition may lead to production inefficiencies and X-‐inefficiencies such as wasteful production and advertising spending
• Higher prices can limit the final output and lead to fewer economies of scale being exploited
• Protected markets means that there is less drive to innovate
• Monopolistic firms may get too big leading to diseconomies of scale (rising long run average cost)
• The higher average cost if there are inefficiencies in production means that the firm is not making optimum use of scarce resources. Under these conditions, there may be a case for government intervention for example through competition policy or market deregulation to make an industry more contestable.
SAM
PLE

-‐
87 www.tutor2u.net
Higher costs – loss of productive efficiency:
• Another possible cost of monopoly power is that businesses may allow the lack of real competition to cause a rise in costs and a loss of productive efficiency.
• When competition is tough, businesses must keep firm control of their costs because otherwise, they risk losing market share.
• Some economists go further and say that monopolists may be even less efficient because, if they believe that they have a protected market, they may be less inclined to spend money on research and improved management.
• These inefficiencies can lead to a waste of scarce resources.
Evaluation – Potential Economic Benefits of Monopoly The possible benefits of monopoly power suggest that the government and the competition authorities should be careful about intervening directly in markets and try to break up a monopoly.
1. Research and development spending: Huge corporations enjoying big profits are well placed to fund capital investment and research and development projects. The positive spillover effects of research can be seen in more innovation. This is particularly the case in industries such as telecommunications and pharmaceuticals. This can lead to gains in dynamic efficiency and social benefits.
2. Exploitation of economies of scale: Because monopoly producers often supply on a large scale, they may achieve economies of scale – leading to a fall in average costs.
3. Monopolies and international competitiveness: The British economy needs multinational companies operating on a scale large enough to compete in global markets. A firm may enjoy domestic monopoly power, but still face competition in overseas markets.
SAM
PLE

-‐
88 www.tutor2u.net
20 companies with the highest spending on research and development in 2014
Analysis diagram to show the possible benefits from monopoly power in markets
13.5 13.4
10.6 10.4
10 9.9
9.1 8.2 8
7.5 7.2 7
6.7 6.6 6.4
0 2 4 6 8 10 12 14 16
Volkswagen Samsung
Intel Microsov
Roche Holding Novarls Toyota
Johnson & Johnson Google
Merck & Co. General Motors
Daimler Pfizer
Amazon Ford
Expenditure (in billion U.S. dollars)
SAM
PLE
www.tutor2u.net
Page 59
14. Multiplier and Accelerator Effects What is the multiplier process?
• An initial change in aggregate demand can have a much greater final impact on the level of equilibrium national income (GDP)
• This is known as the multiplier effect • It comes about because injections of new demand for goods and services into the circular flow of
income stimulate further rounds of spending leading to an expansion of output, incomes and profits
• In other words “one person’s spending is another’s income” • This can lead to a bigger final effect on output and employment • The multiplier is a number – a coefficient showing the size of the final impact on national income
What is a simple definition of the multiplier? It is the number of times a rise in national income exceeds the rise in injections of demand that caused it Examples of the multiplier effect at work
• Consider a £300 million increase in capital investment– for example created when an overseas company decides to build a new production plant in the UK
• This can set off a chain reaction of increases in expenditures. • Firms who produce the capital goods and construction businesses who win contracts to build the
new factory will see an increase in their incomes and profits • If they and their employees in turn, collectively spend about 3/5 of that additional income, then
£180m will be added to the incomes of others.
At this point, total income has grown by (£300m + (0.6 x £300m). The sum will continue to increase as the producers of the additional goods and services realize an increase in their incomes, of which they in turn spend 60% on even more goods and services.
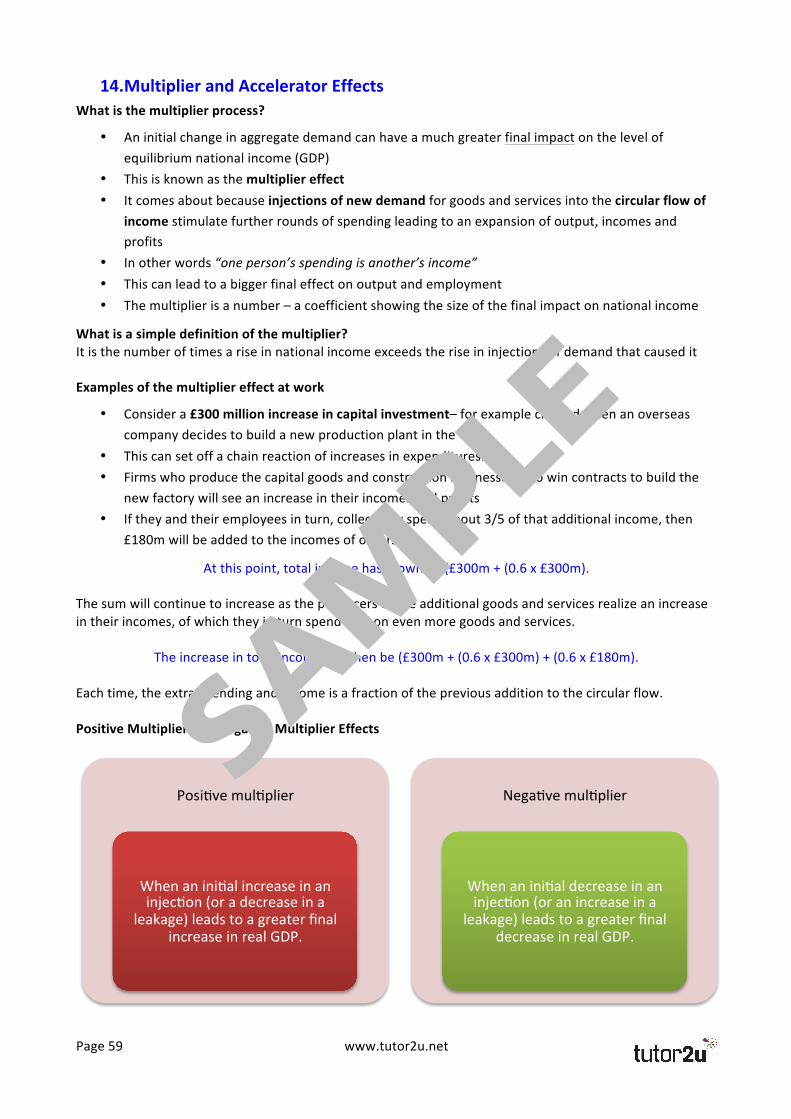
The increase in total income will then be (£300m + (0.6 x £300m) + (0.6 x £180m). Each time, the extra spending and income is a fraction of the previous addition to the circular flow. Positive Multiplier and Negative Multiplier Effects
Positve multplier
When an inital increase in an injecton (or a decrease in a
leakage) leads to a greater final increase in real GDP.
Negatve multplier
When an inital decrease in an injecton (or an increase in a
leakage) leads to a greater final decrease in real GDP.
SAM
PLE

www.tutor2u.net
Page 60
Importance of the Marginal Propensity to Consume and Save
Marginal Rate of Leakage and the Multiplier Value
Marginal propensity to consume (MPC)
MPC = change in consumpton following a change in income
= change in total consumpton / change in gross income
E.g. if gross income increases by £5,000 and spending rises by £4,000 then the MPC = £4,000 / £5,000 = 0.8
Marginal propensity to save (MPS)
MPS = change in savings following a change in income
= change in total savings / change in gross income
If rise in gross income = £5,000 and rise in C = £4,000, then change in saving = £1,000
Therefore MPS = £1,000 / £5,000 = 0
SAM
PLE

www.tutor2u.net
Page 61
Simple and a more complex Multiplier Calculation
The main factors that affect the value (coefficient) of the multiplier effect
1. The multiplier process requires that there is sufficient spare capacity for extra output to be produced. If short-‐run aggregate supply is inelastic, the full multiplier effect is unlikely to occur, because increases in AD will lead to higher prices rather than a full increase in real national output. In contrast, when SRAS is perfectly elastic a rise in AD causes a large increase in national output.
2. Crowding out – this is where (for example) increased government spending or lower taxes can lead to a rise in government borrowing and/or inflation which causes interest rates to rise and has the effect of slowing down economic activity.
Simple Multplier
Assume no tax or imports
Only leakage is saving
Multplier coefficient k = 1 / (1-‐MPC)
If MPC = 0.8
Then multplier = 1 / (1-‐0.8) = 1/0.2 = 5
More Complex Multplier
Three leakages (savings, imports and taxaton)
Multplier coefficient k = 1 / (MPS +MRT + MPM)
If sum of marginal rate of leakage = 0.7
Then multplier = 1/0.7 = 1.43
The value of the multplier
Propensity to import
Propensity to save
Propensity to tax
Amount of spare
capacity
Avoiding crowding
out
SAM
PLE

www.tutor2u.net
Page 62
In short – the multiplier effect will be larger when
1. The propensity to spend extra income on domestic goods and services is high 2. The marginal rate of tax on extra income is low 3. The propensity to spend extra income rather than save is high 4. Consumer confidence is high (this affects willingness to spend gains in income) 5. Businesses in the economy have the capacity to expand production to meet increases in demand
Time lags and the multiplier effect
• It is important to remember that the multiplier effect will take time to come into full effect • A good example is the fiscal stimulus introduced into the US economy by the Obama government.
They have set aside many billions of dollars of extra spending on infrastructure spending but these capital projects can take years to be completed. Delays in sourcing raw materials, components and finding sufficient skilled labour can limit the initial impact of the spending projects.
Elasticity of Aggregate Supply & the Multiplier Effect
The Multiplier and Keynesian Economics
• The concept of the multiplier process became important in the 1930s when John Maynard Keynes suggested it as a tool to help governments to maintain high levels of employment
• This “demand-‐management approach”, designed to help overcome a shortage of capital investment, measured the amount of government spending needed to reach a level of national income that would prevent unemployment.
SAM
PLE