marketing in a connected world (pdf | 13mb)
TRANSCRIPT

Marketing in a
Connected World

India #2 country behind China
721mn
462mn
286mn
139mn 115mn 102mn
China India United States Brazil Japan Russia
Internet usage across the pyramid Large feature & growing smartphone segmentsSmart Phone vs Feature Phone: Market Share In India
vs
78 72 71 68 65
22 28 29 32 350
50
100
Feature Phone Smart Phone
India growing at 44% vs. rest of the world at 9%
LSM 8+
LSM 4-7
LSM 0-3
82%
48%
22%
India: A Unique Market
Global GrowthIndia Internet Users
60%
50%
40%
30%
20%
10%
0%2008 2009 2010 2011 2012 2013 2014 2015
Sources: www.internetlivestats.comMary Meeker Report, IDC India

Enablers To Win in India
Pioneer andExperiment
Deploy with Scale
Build Partner Eco-System
Content & Technology partners

Pillars to win in a connected world
Entertain and connect via voice
Democratize video
MO
BIL
E
Build rewarding relationships
Win across micro moments of search
Harness ecommerce
INTE
RN
ET
Lead Trends

Winning on search
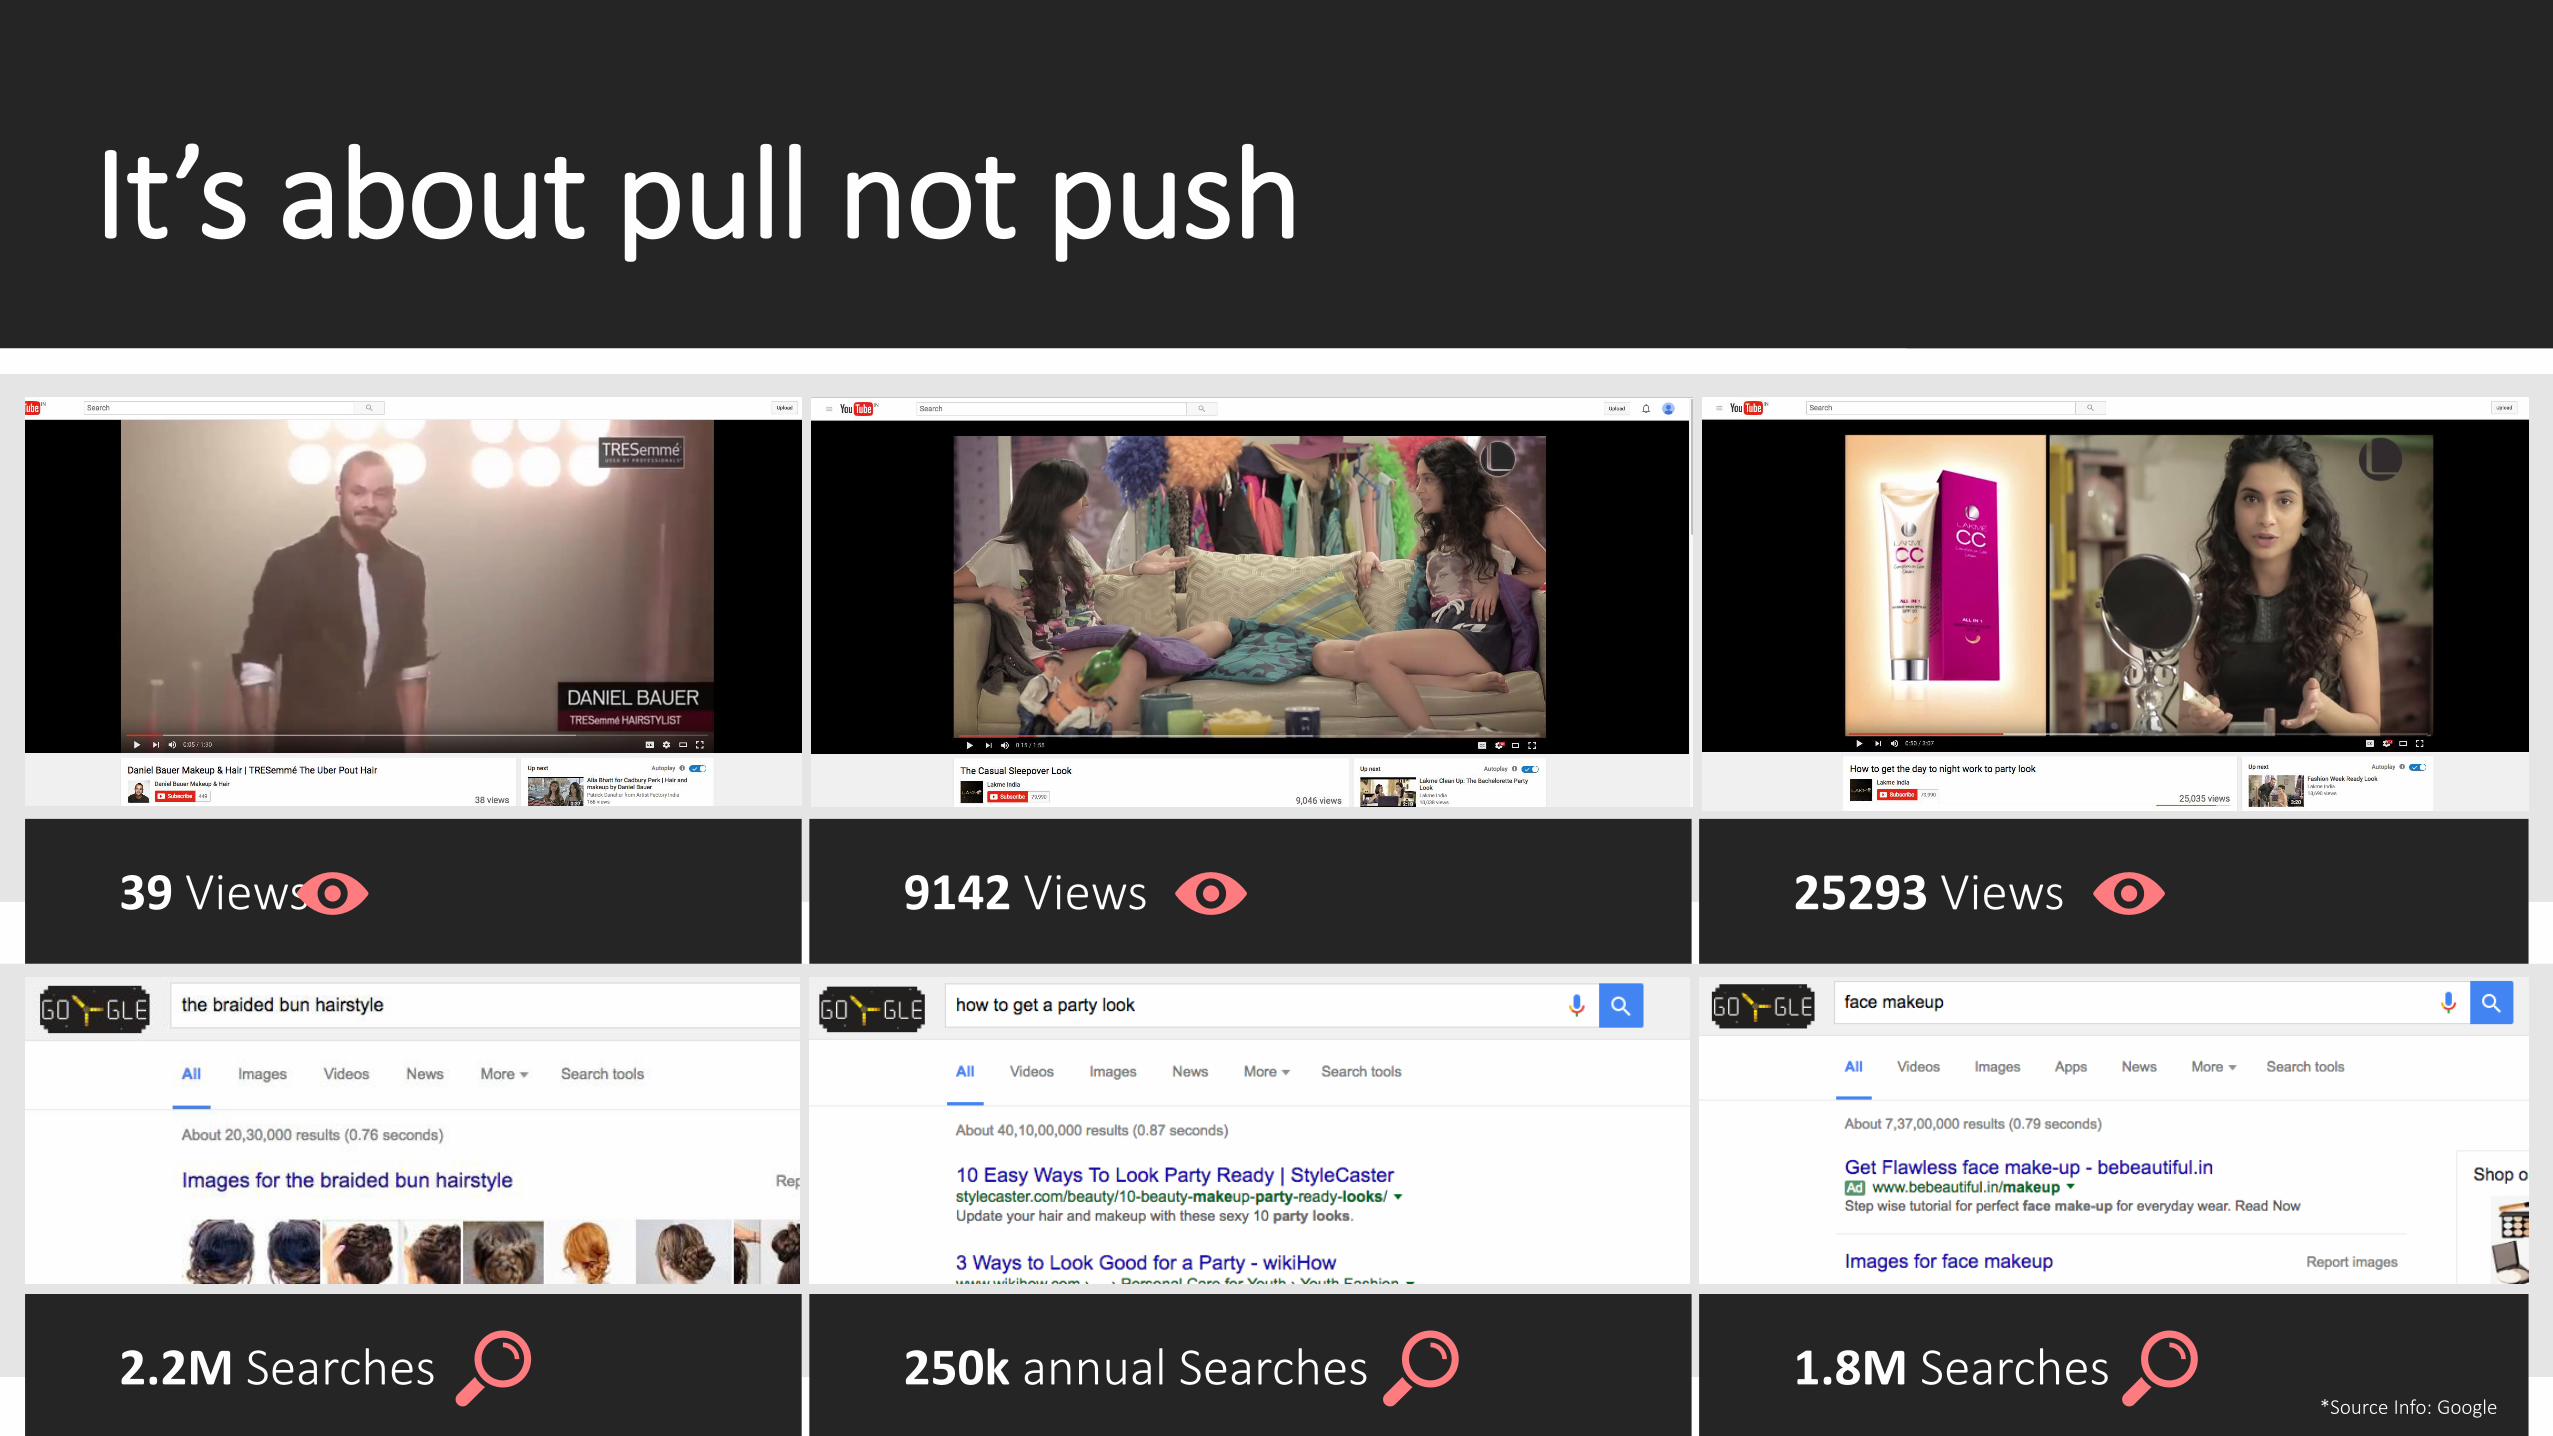
It’s about pull not push
39 Views 9142 Views 25293 Views
2.2M Searches 250k annual Searches 1.8M Searches*Source Info: Google

THE
VIS
ION
Be the Wikipedia of Personal Care
360M Beauty searches annually growing at 44%
18%
61%
Dramatic rise in mobile searches vs 2013
Be the WIKIPEDIA Of PC with Unilever brands serving 70% of all beauty searches organically

KNOW
•How to use
•Which outfit
• Latest Trends
• To salons •Experiment
•Use perfectly
•Occasion led looks
•A specific brand
•Best product
•The complete look
The Micro-moments of Search
GO DO BUY

In Depth Understanding of Searches
Make-upHair
12M unbranded
2.6M branded
18M monthly
3.5Mirrelevant
13M unbranded
2M branded
23M monthly
8Mirrelevant
5M unbranded
4.5M branded
12M monthly
2.5Mirrelevant
Skin
*Source Info: Google*Internal HUL analysisData as of June 2015

Searches Are Surprisingly Basic
Skin
Make-up
Hair

The Beauty Wikipedia

The Be-Beautiful Ecosystem
Distribution Partner
Content Partner
Ecomm Partner
Tech Partner
Brands

Extensive Text & Video Content
350+ Articles 100+ videos

Covering Regional Languages Too
3M Hindi searches in 2015 42% Growth in language searches
*Source Info: Google

1.11min
1.38min
1.32min
2:48min
Making Be-Beautiful A Leading Beauty Publisher
1.1 MNAverage Monthly Visitors(June 2015 – June 2016)
Average Minutes per Visit
2015 Data
1.58min
0.5 MN
0.1MN0.1MN
0.5 MN
*Sourced from a similar web

Helping Our Brands Win On Search
+700bpsconsideration amongst viewers*
3X CTR vs benchmark
Doubledwebsite trafficto a million (June 2016)
*Google Brand Lift study

Leveraging Be-Beautiful Further
Defined sharper target audiences
Customized creative for each audience profile
Leading to 10x better
conversion on E-commerce
A gateway to a relevant and engaged audience
*Sourced : Google

Leading Trends

We Are Trend Leaders In New Segments
in all these segments
Fabric Conditioner BB Cream / CC Cream Green Tea Hair Conditioner

Pioneer Beauty Trends at Lakmé Fashion Week

Amplified To Millions Real time
Unique Reach of TG in 5 days
Engagement rate vs norm
Increase in LFW awareness on FB
Increase in Purchase interest on Twitter among those engaged
+710bps50% >5X +1310bps


FALBeauty on duty
8.98M Views8% increase in awareness among viewers (“best-in-class” as per India
benchmarks*)
*Source- Google Brand Lift study

*Source- Google Brand Lift study

Lakmé Make-up Pro India’s 1st Real Time Make-Up App
Revolutionizing Make-up Trial
Choose from 100+ pro-stylist looks
Shop the look on the app
1.8M downloads in a year

Status in 2015
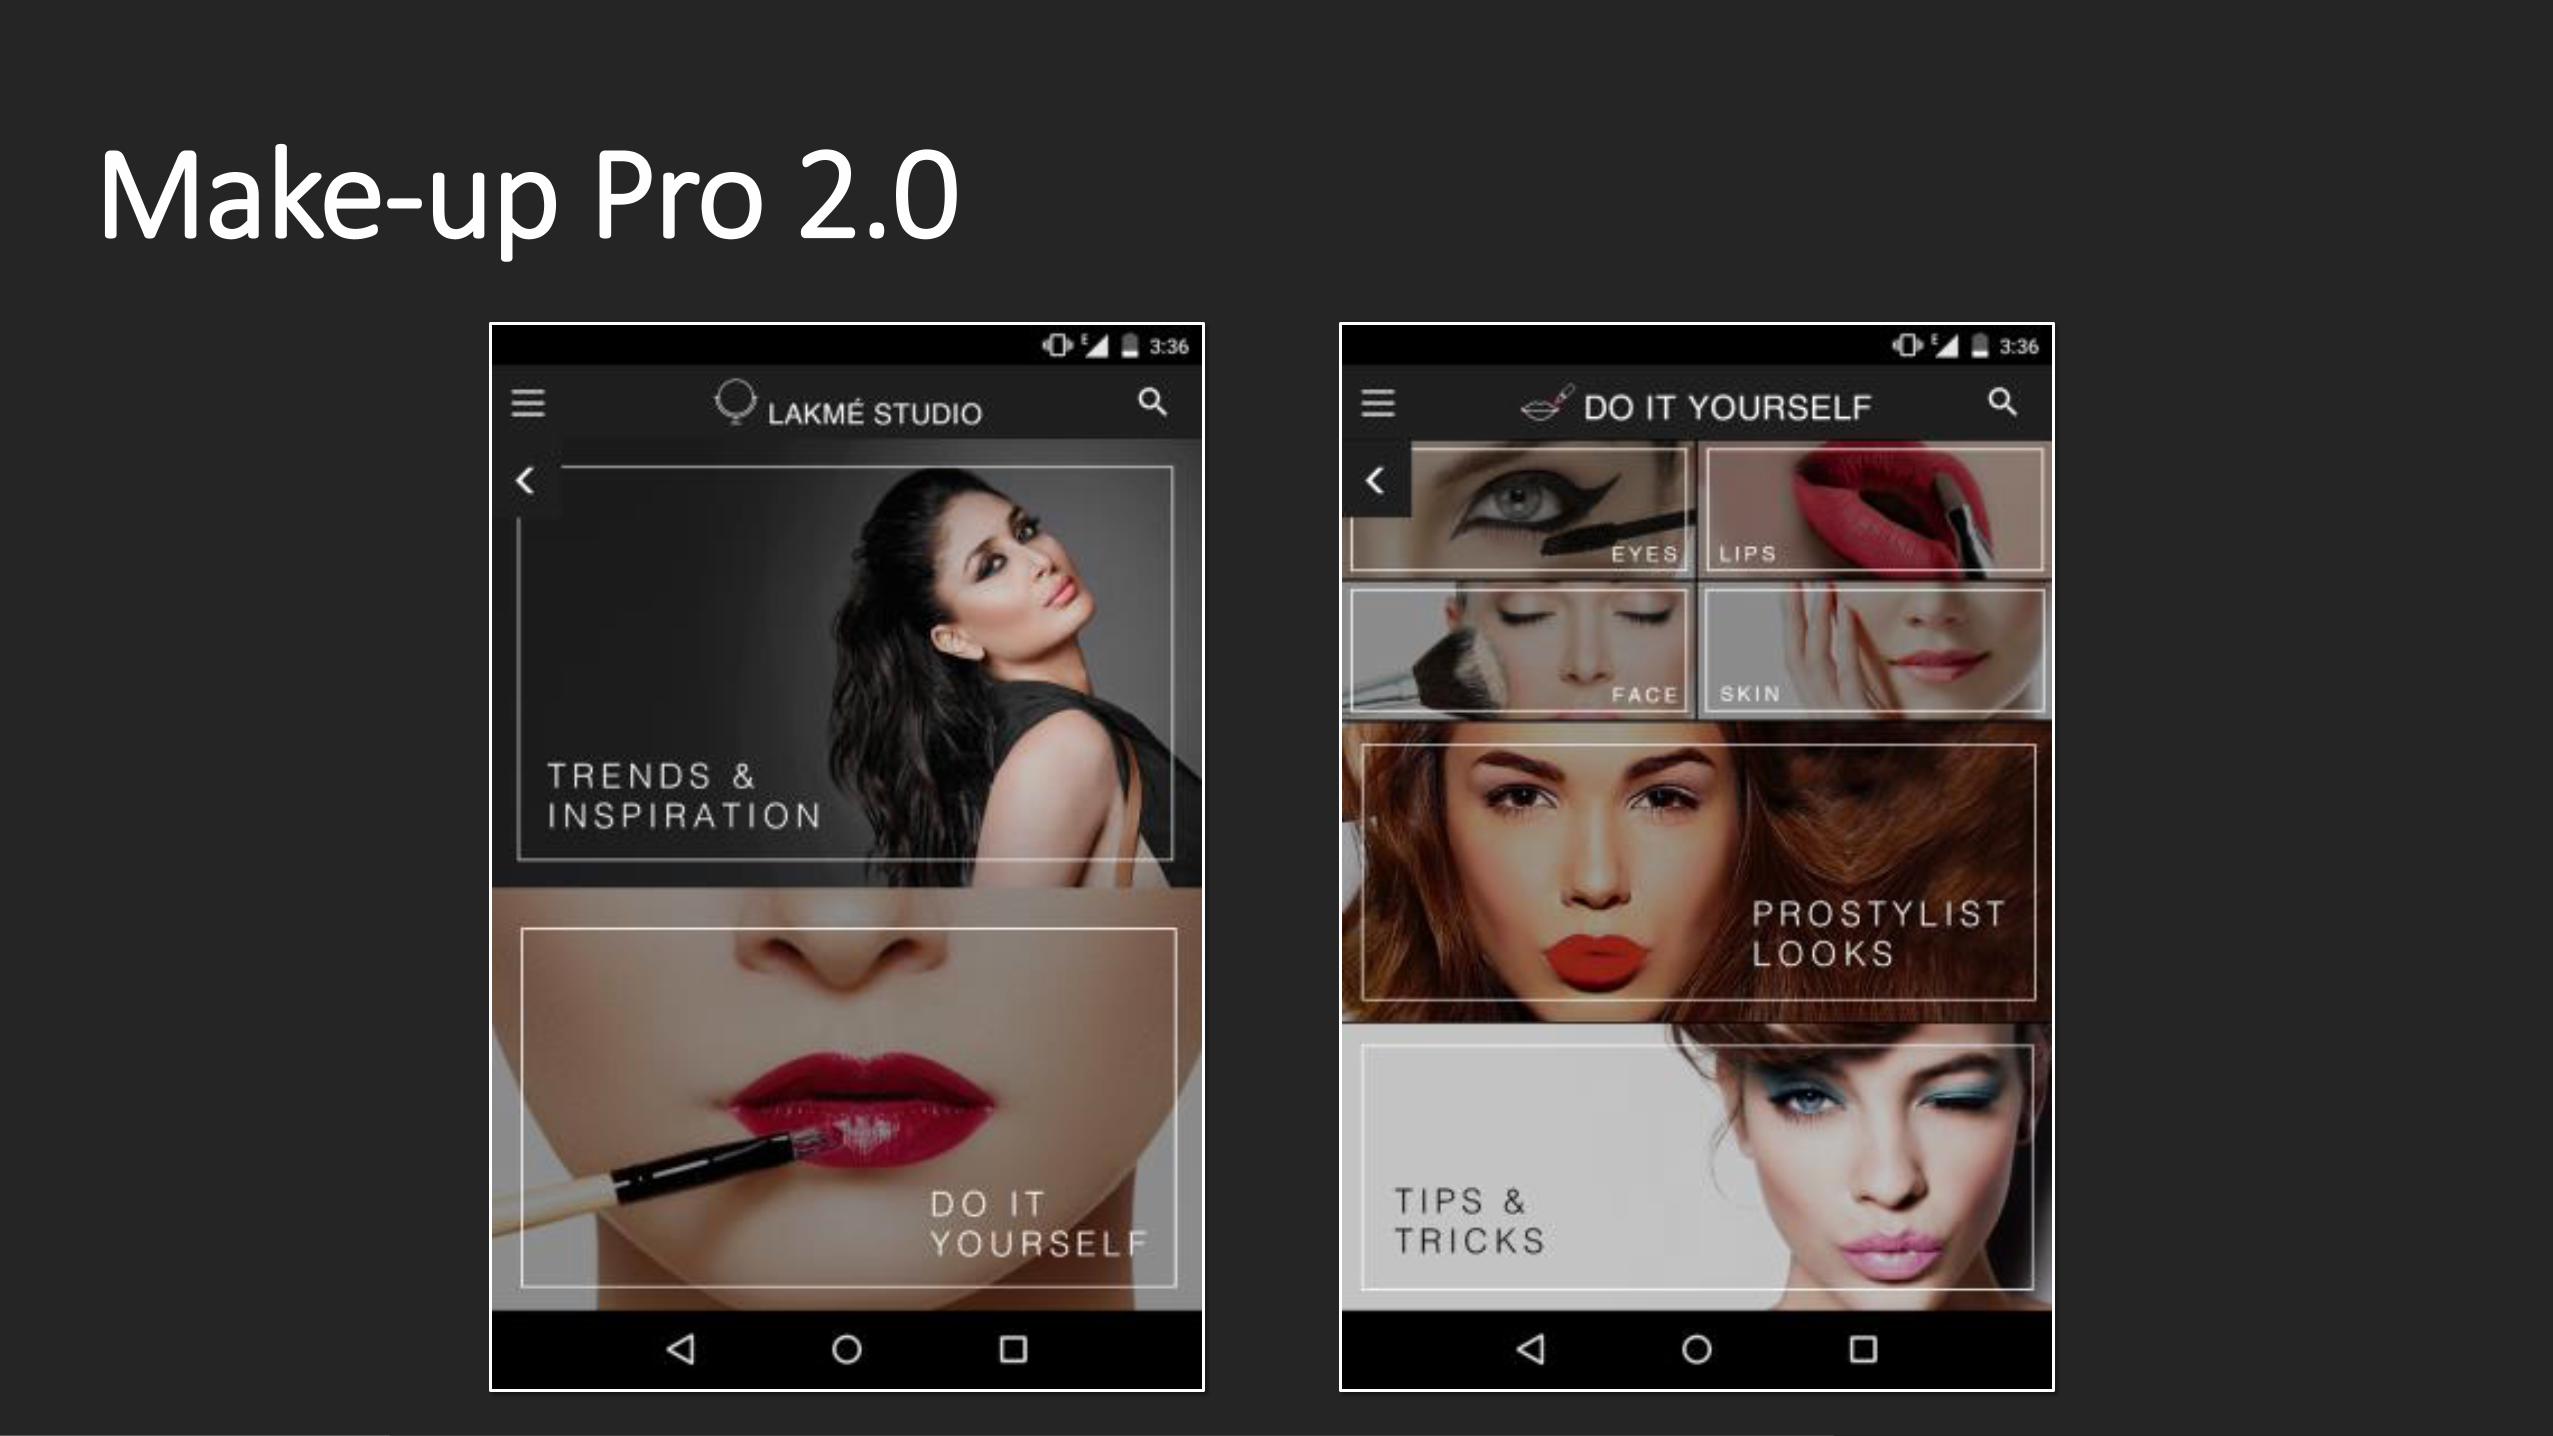
Make-up Pro 2.0


Harness E-Commerce

Can be >10% of retail like in USA
E-Commerce as % of Total Retail Sales, USA, 2000-2015
E-C
om
mer
ce a
s %
of
Tota
l Ret
ail S
ales
(%
)
0%
12%
10%
8%
6%
4%
2%
20
00
20
01
20
02
20
03
20
04
20
06
20
07
20
08
20
09
20
10
20
11
20
12
20
13
20
14
20
15
$340B+ of E-Commerce
Spend
220M online shoppers by 2020
Figure 3. Online shoppers (in million) of internet user in India (includes only B2C e-tail excluding online travel and classifieds)
20
39
140
220
2013 2015 2018* 2020*
Spend to increase 5X vs 2015
Figure 4. Average spend per online shopper in India (includes B2C a-tail, online travel classifieds)
E-commerce in India: An Exploding Opportunity
2013 2015 2018* 2020*
9903
16641
19403
31260
CAGR
18%
*Mary Meeker Internet trends report*Google Bain Study 2015*Google Bain Study 2015

Planning For The Future
MT Enablers
20
00
20
15
Modern Trade Team MT Supply Chain Marketing Excellence
Fit to Win eCom Team SC 2.0 Fit for eCom Marketing Excellence E-Com Enablers


Marketing ExcellenceImprove content available online

Bollywood movie Association
4X conversions
4X Increase in AOV
LFW Online Store
25X conversions
1.6X Increase in AOV
Online Bridal Store
12X conversions
1.6X Increase in AOV
Lakmé Fashion Week The Bridal Occasion
Marketing Excellence The Shop The Look Model
Pop Culture


Tea & Coffee Store
Marketing Excellence Destination Stores
Home care store
1.4Xjump in offtakes
Valentine Day activation
+205bpsshare delta for PC
6X jump in laundry and dishwash sales

Our E-commerce Business is Share & Profit Accretive
E-COM MT GT

Mobile Marketing

Mobile Landscape
TVPenetration
59%
MobilePenetration
81%
Mobile is themedium with the widest reach
*Source: eMarketer, India Data

Diverse Consumer Base and Needs
Feature phone UsersNo Data Usage, talk-time starved
Voice is the big driver
Low end Smartphone UsersRestrictive Data Usage
Democratize Video
High end Smartphone UsersNo restriction in usage, WiFi Access
Build rewarding relationships
LSM 0-3 LSM 4-7 LSM 8+
*Source: Primary research

Diverse Portfolio of brands to Address Each Segment
LSM 0-3 LSM 4-7 LSM 8+


Targeted to the mass end of the spectrumVoice based, solving an unmet consumer need
43 MNTotal Subscribers
3 MNActive Subs. per/month
30 MinAvg. Engagement
Now getting rolled out in Bangladesh as
(Kanamachi Station)
*Source: Internal Data

KKT leading to an ECO system
Personalization
Telecom
Operators
Voice
Analytics
Recharges


Communication IdeaWheel rekindles the husband wife romance through its fragrance
The CampaignA medium to the wives to talk to their husbands for FREE


Results
Total Reach
16M
Impact in TOM Awareness
+145%
Won
Cannes Lion(Bronze) in Media category
Sale Increase vs All India
6X
*Source: Internal Data
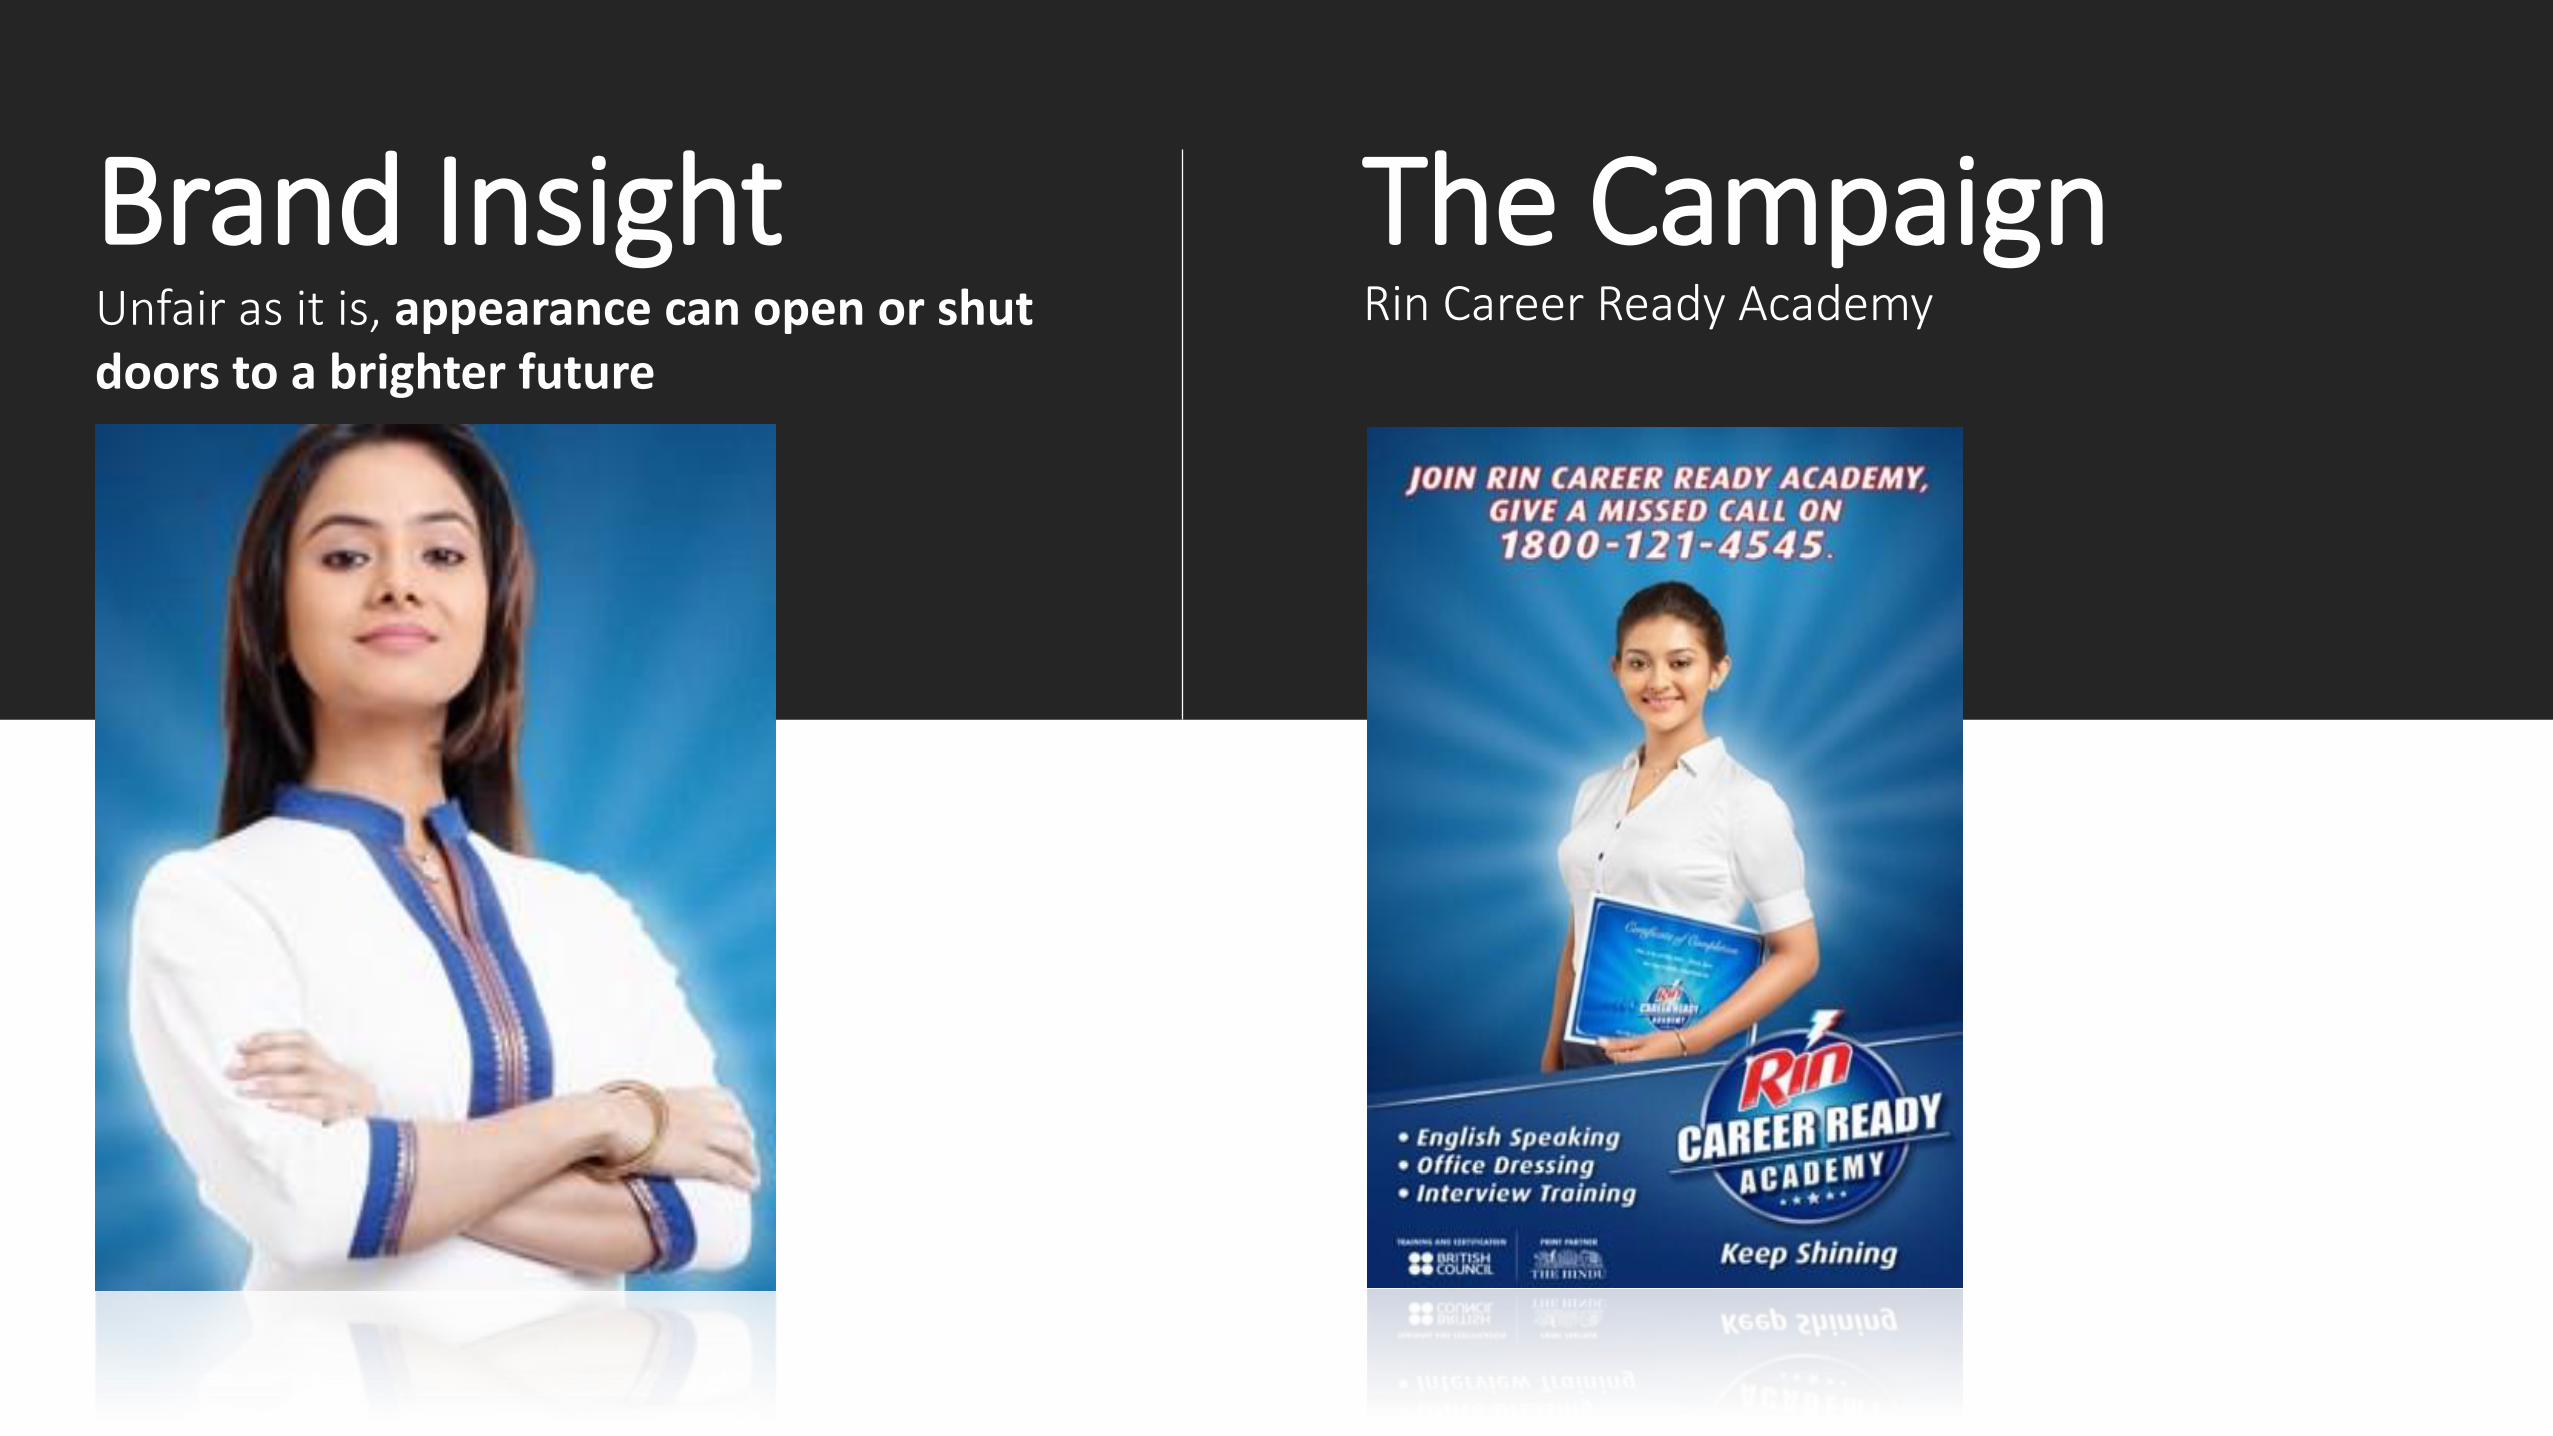
Brand InsightUnfair as it is, appearance can open or shut doors to a brighter future
The CampaignRin Career Ready Academy


*Source- Google Brand Lift study

Results
Penetration
+290 BpsAttribute Mind Measure
+1100 BpsEngagement Duration
5M mins
*Source: Internal Data

Video on Mobile
21.2%
26.3%29.8%
33.4%36%
39%
Shar
e o
f m
ob
ile u
sers
wit
h s
mar
tph
on
e
2014 2015 2016 2017 2018 2019
Smartphones have proliferated Internet usage has grown
But data ARPU has not increased
“I know I can watch video on Mobiles but it consumes more of my data pack”
© Statista 2016
Data ConsumptionSmartphone Penetration
“Bad Data networks causes the video to load forever”
115
230
310
430
680
750
2013 2014 2015
2G
3G*
0
50
100
150
200
250
300
350
400
450
500
Q1 2014 Q2 2014 Q3 2014 Q4 2014 Q1 2015 Q2 2015 Q3 2015 Q4 2015 Q1 2016 Q2 2016 FY 2016
*Source: Statista; Nokia MBTI Study*Source: eMarketer, India Data
Due to high data costs & poor networks


Build Rewarding Relationships


How do we Stay Ahead of the Curve?

DIGITAL
EFFICIENCY
DIGITAL
WHEEL
E-CommerceEngagement
& Ad models
Digital
Media
Research
&
evaluation
Content
Creation &
curation
IOTSupply Chain
Efficiency
Market
places
Analytics
Shopper
Marketing
Unilever Foundry: Building Partnerships For The Future

Pioneering & Experimenting
Holistic approach to digital
Deploying with scale
Eco-system of partners
Grow our brands & business sustainably
Marketing in a connected world

Thank you