managing interest rate risk: gap and earnings sensitivity chapter 8 bank management 5th edition....
TRANSCRIPT

MANAGING INTEREST RATE RISK: GAP AND EARNINGS SENSITIVITY
Chapter 8
Bank ManagementBank Management, 5th edition.5th edition.Timothy W. Koch and S. Scott MacDonaldTimothy W. Koch and S. Scott MacDonaldCopyright © 2003 by South-Western, a division of Thomson Learning
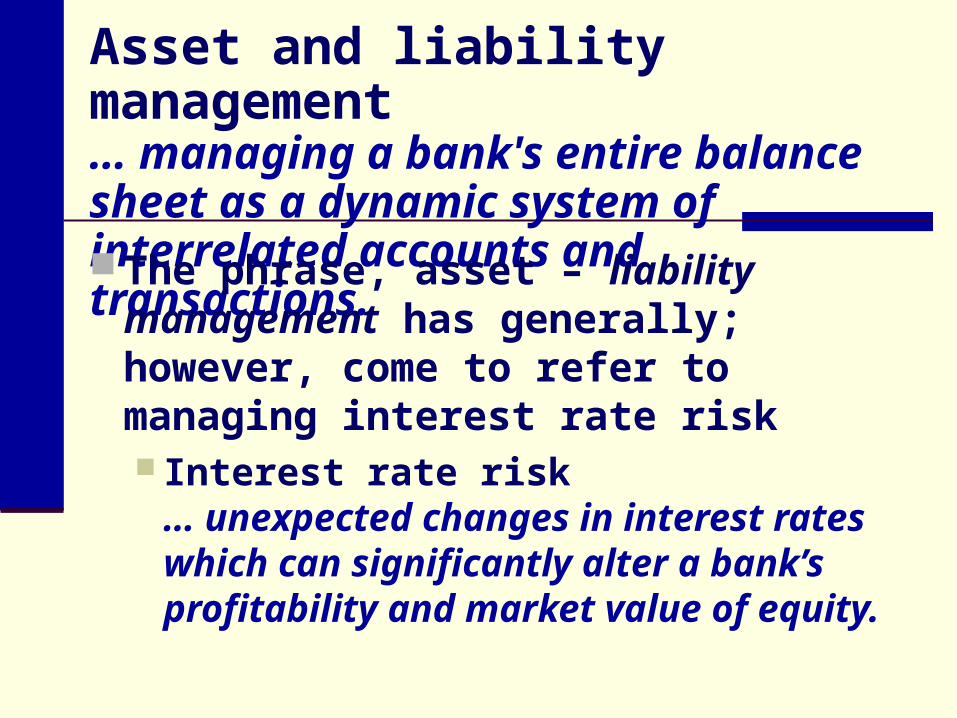
Asset and liability management… managing a bank's entire balance sheet as a dynamic system of interrelated accounts and transactions.
The phrase, asset – liability management has generally; however, come to refer to managing interest rate risk Interest rate risk
… unexpected changes in interest rates which can significantly alter a bank’s profitability and market value of equity.
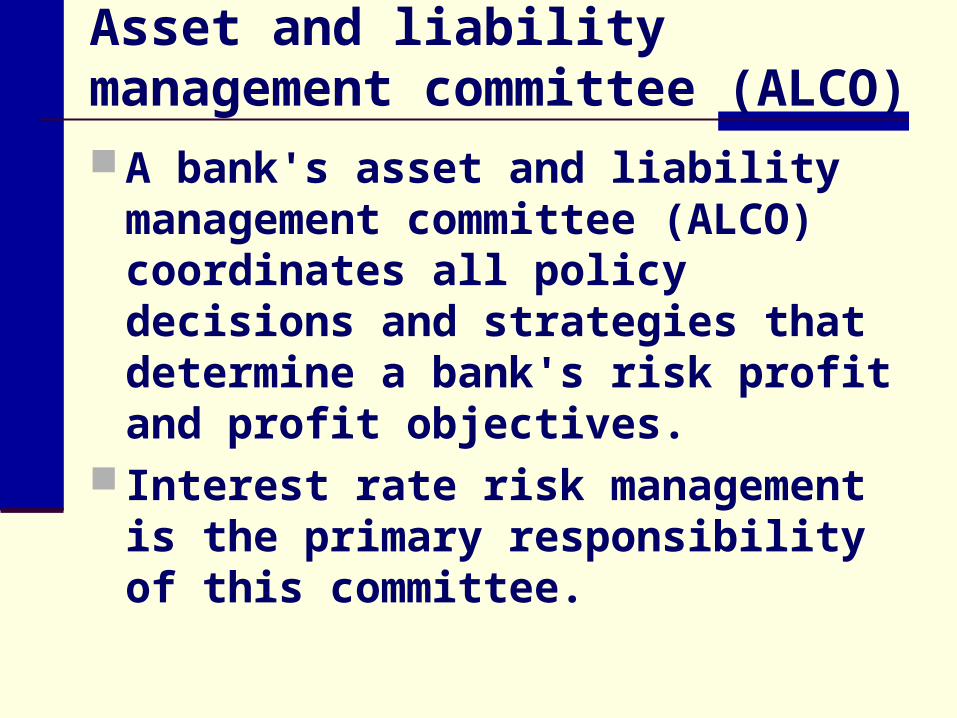
Asset and liability management committee (ALCO) A bank's asset and liability
management committee (ALCO) coordinates all policy decisions and strategies that determine a bank's risk profit and profit objectives.
Interest rate risk management is the primary responsibility of this committee.
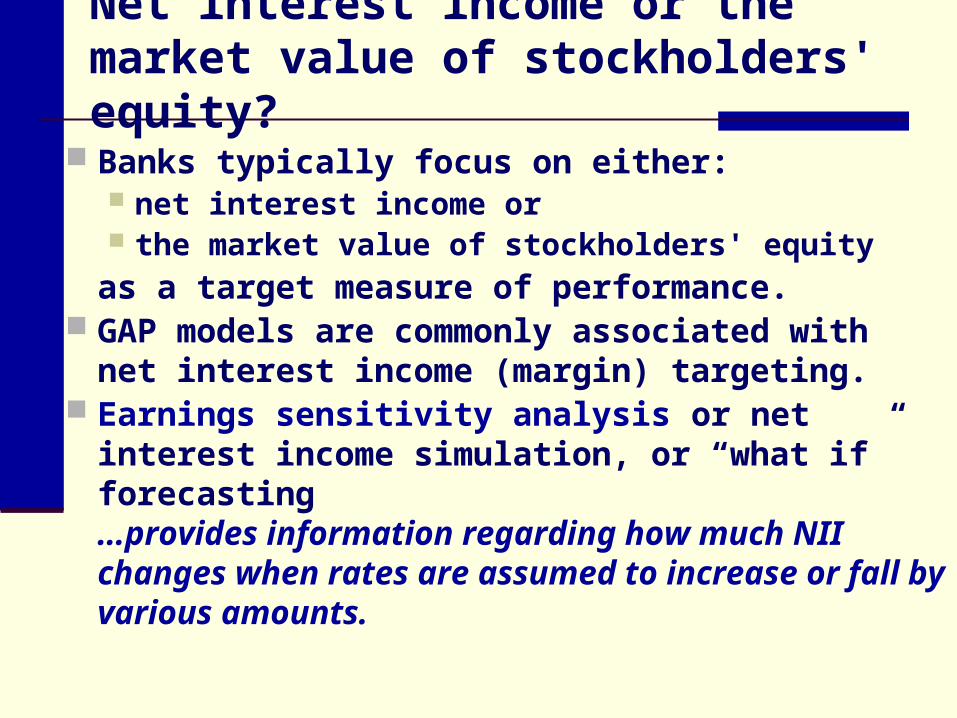
Net interest income or the market value of stockholders' equity?
Banks typically focus on either: net interest income or the market value of stockholders' equity
as a target measure of performance. GAP models are commonly associated with net
interest income (margin) targeting. Earnings sensitivity analysis or net interest
income simulation, or “what if” forecasting…provides information regarding how much NII changes when rates are assumed to increase or fall by various amounts.
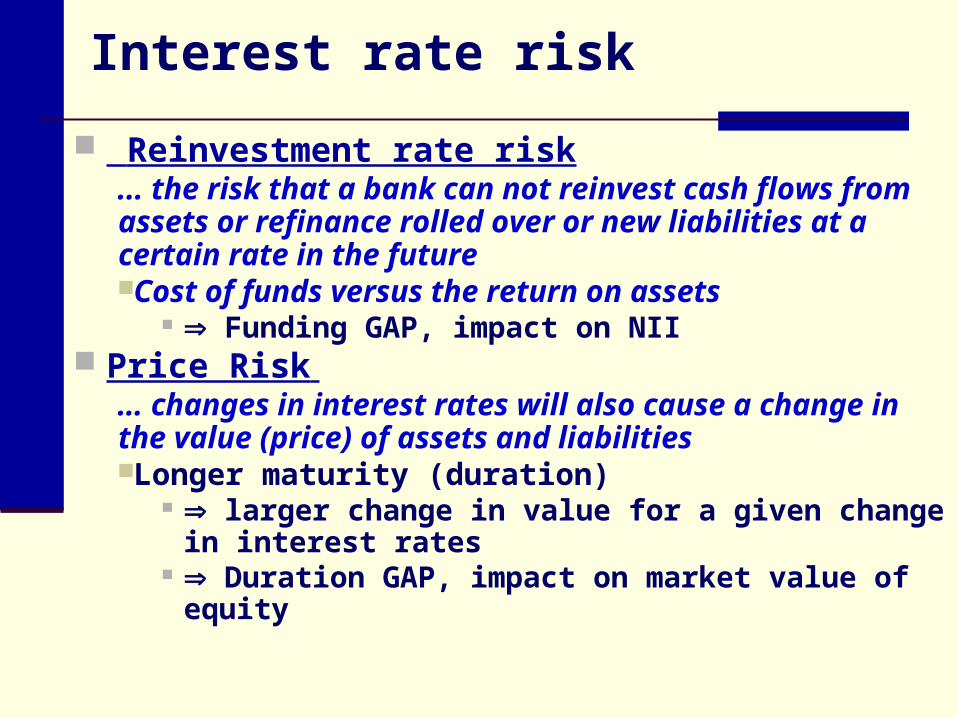
Interest rate risk
Reinvestment rate risk... the risk that a bank can not reinvest cash flows from assets or refinance rolled over or new liabilities at a certain rate in the futureCost of funds versus the return on assets
Funding GAP, impact on NII Price Risk
… changes in interest rates will also cause a change in the value (price) of assets and liabilitiesLonger maturity (duration)
larger change in value for a given change in interest rates
Duration GAP, impact on market value of equity
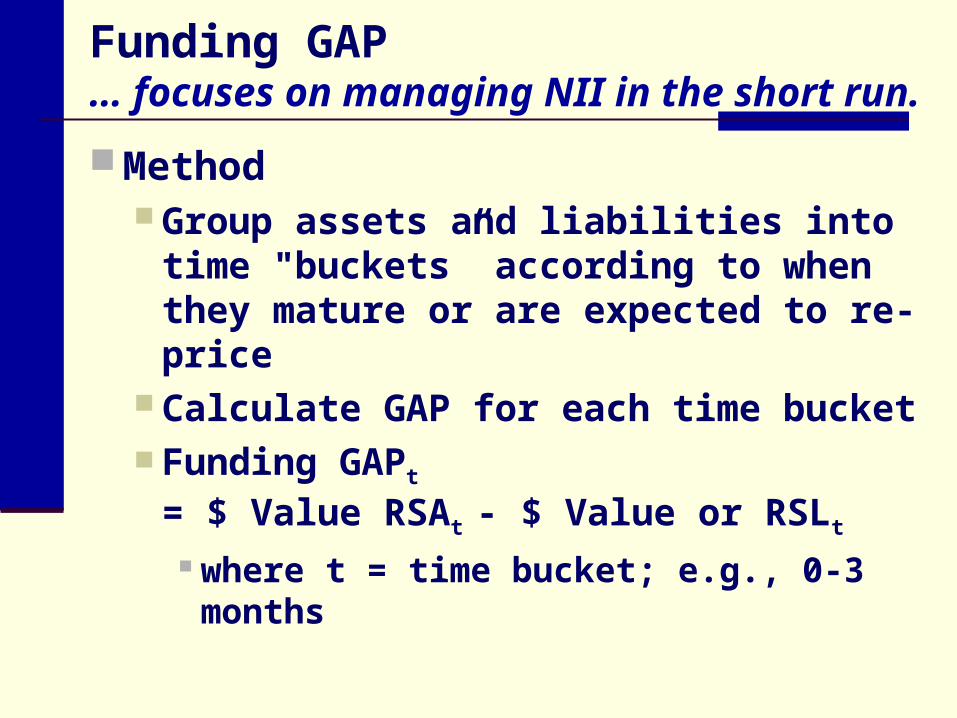
Funding GAP… focuses on managing NII in the short run.
Method Group assets and liabilities into time
"buckets” according to when they mature or are expected to re-price
Calculate GAP for each time bucket Funding GAPt
= $ Value RSAt - $ Value or RSLt
where t = time bucket; e.g., 0-3 months
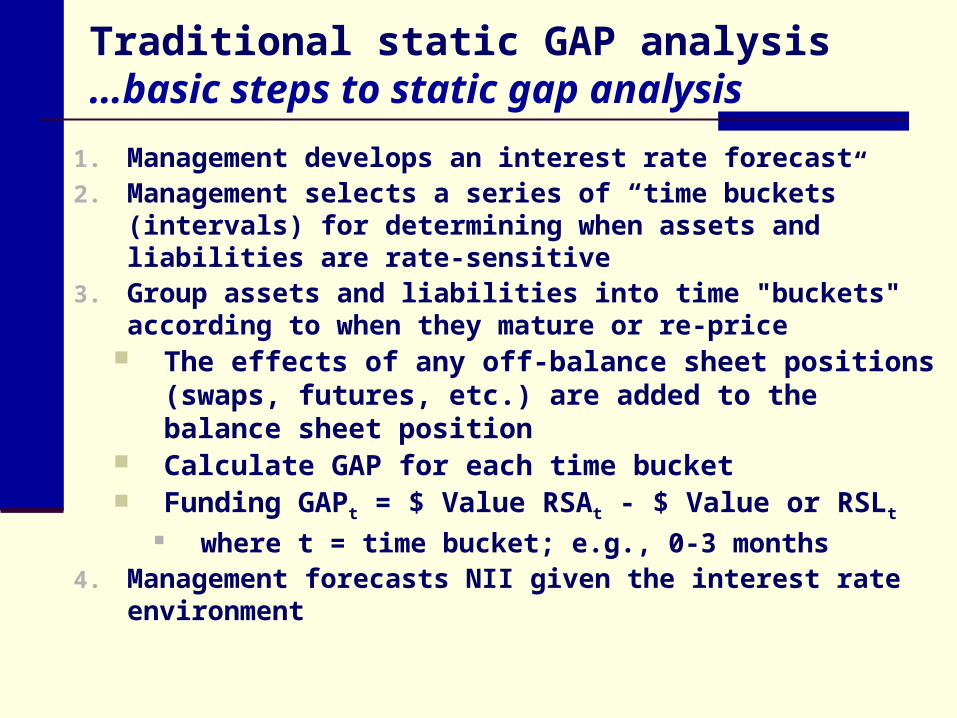
Traditional static GAP analysis…basic steps to static gap analysis
1. Management develops an interest rate forecast2. Management selects a series of “time buckets” (intervals)
for determining when assets and liabilities are rate-sensitive
3. Group assets and liabilities into time "buckets" according to when they mature or re-price
The effects of any off-balance sheet positions (swaps, futures, etc.) are added to the balance sheet position
Calculate GAP for each time bucket Funding GAPt = $ Value RSAt - $ Value or RSLt
where t = time bucket; e.g., 0-3 months4. Management forecasts NII given the interest rate
environment
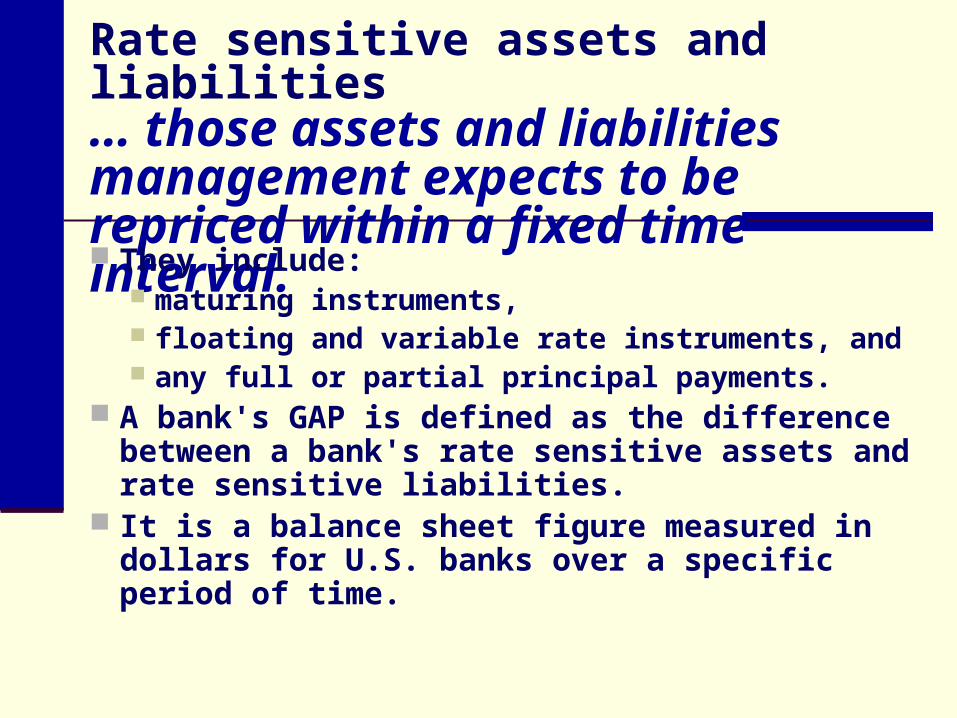
Rate sensitive assets and liabilities… those assets and liabilities management expects to be repriced within a fixed time interval. They include:
maturing instruments, floating and variable rate instruments, and any full or partial principal payments.
A bank's GAP is defined as the difference between a bank's rate sensitive assets and rate sensitive liabilities.
It is a balance sheet figure measured in dollars for U.S. banks over a specific period of time.
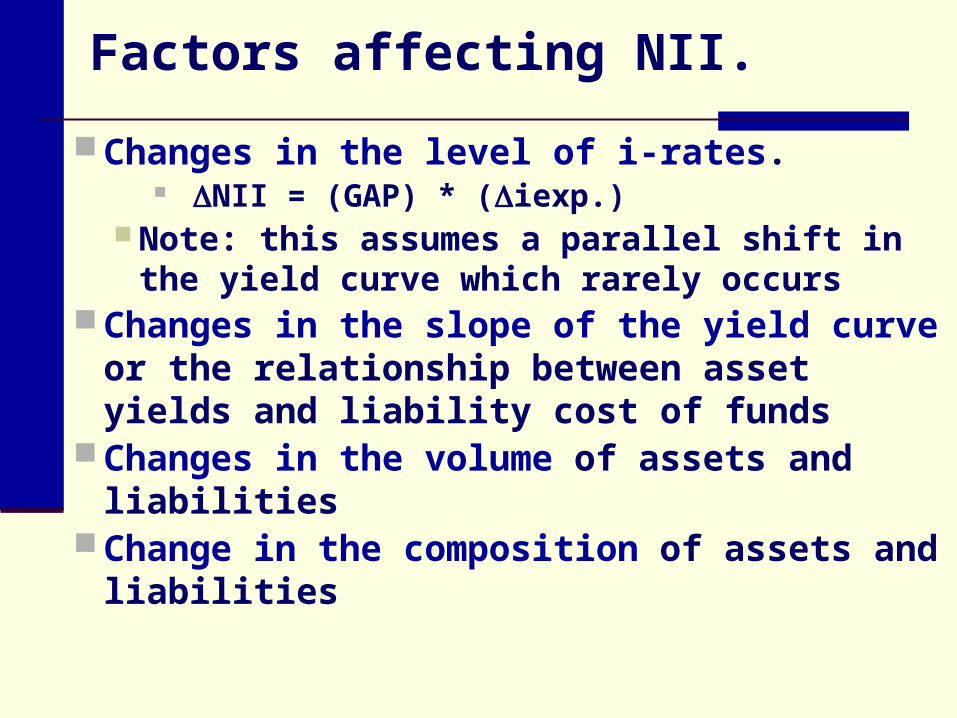
Factors affecting NII.
Changes in the level of i-rates. NII = (GAP) * (iexp.)
Note: this assumes a parallel shift in the yield curve which rarely occurs
Changes in the slope of the yield curve or the relationship between asset yields and liability cost of funds
Changes in the volume of assets and liabilities
Change in the composition of assets and liabilities
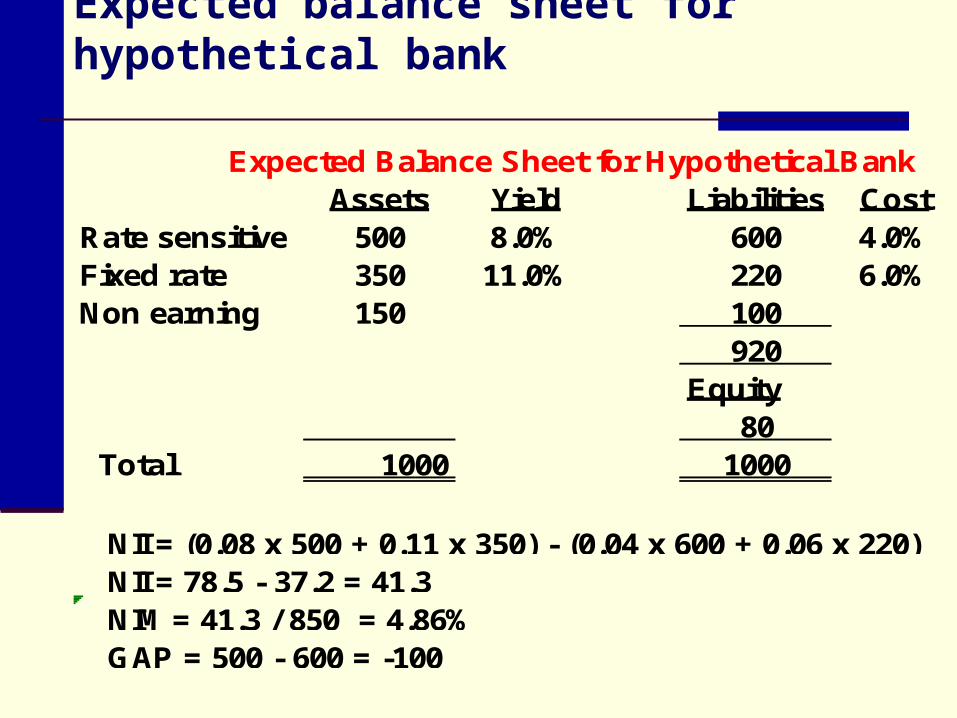
Expected balance sheet for hypothetical bank
Expected Balance Sheet for Hypothetical BankAssets Yield Liabilities Cost
Rate sensitive 500 8.0% 600 4.0%Fixed rate 350 11.0% 220 6.0%Non earning 150 100
920Equity
80 Total 1000 1000
GAP = 500 - 600 = -100
NII = (0.08 x 500 + 0.11 x 350) - (0.04 x 600 + 0.06 x 220)
NIM = 41.3 / 850 = 4.86%NII = 78.5 - 37.2 = 41.3
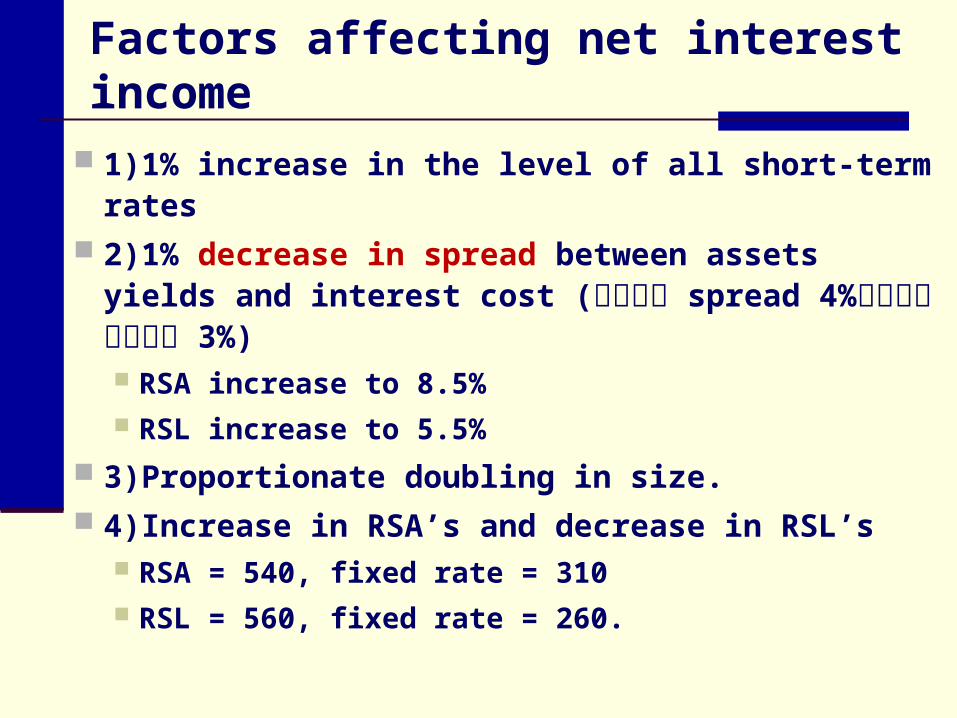
Factors affecting net interest income
1)1% increase in the level of all short-term rates 2)1% decrease in spread between assets yields
and interest cost ( เดิ�ม spread 4% กลายเป็น 3%) RSA increase to 8.5% RSL increase to 5.5%
3)Proportionate doubling in size. 4)Increase in RSA’s and decrease in RSL’s
RSA = 540, fixed rate = 310 RSL = 560, fixed rate = 260.
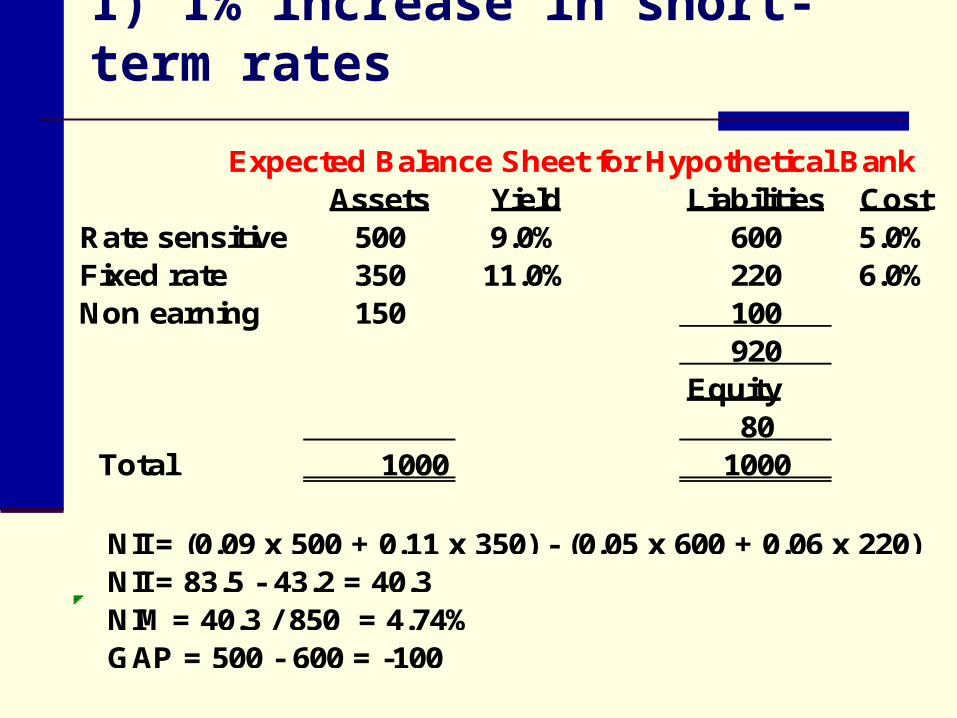
1) 1% increase in short-term rates
Expected Balance Sheet for Hypothetical BankAssets Yield Liabilities Cost
Rate sensitive 500 9.0% 600 5.0%Fixed rate 350 11.0% 220 6.0%Non earning 150 100
920Equity
80 Total 1000 1000
GAP = 500 - 600 = -100
NII = (0.09 x 500 + 0.11 x 350) - (0.05 x 600 + 0.06 x 220)
NIM = 40.3 / 850 = 4.74%NII = 83.5 - 43.2 = 40.3
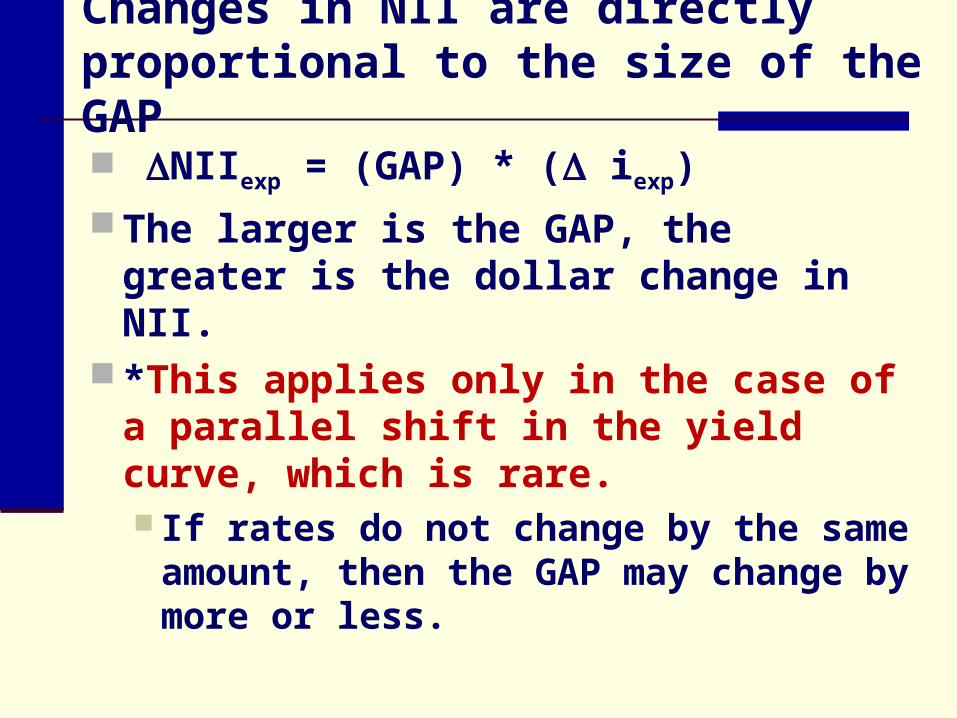
Changes in NII are directly proportional to the size of the GAP
NIIexp = (GAP) * ( iexp)
The larger is the GAP, the greater is the dollar change in NII.
*This applies only in the case of a parallel shift in the yield curve, which is rare. If rates do not change by the same
amount, then the GAP may change by more or less.
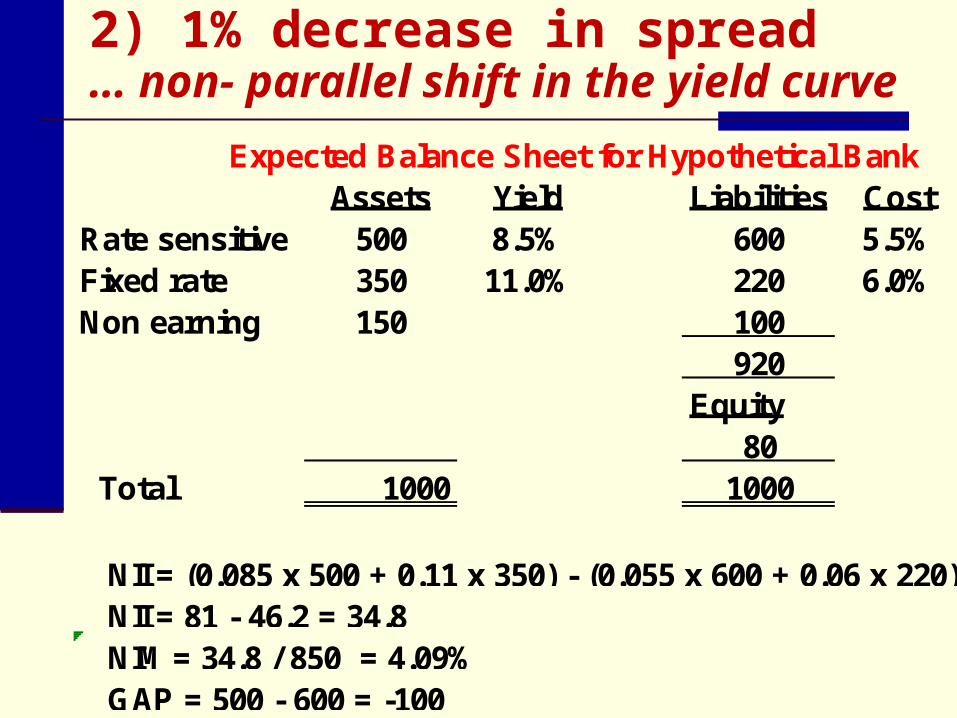
2) 1% decrease in spread… non- parallel shift in the yield curve
Expected Balance Sheet for Hypothetical BankAssets Yield Liabilities Cost
Rate sensitive 500 8.5% 600 5.5%Fixed rate 350 11.0% 220 6.0%Non earning 150 100
920Equity
80 Total 1000 1000
GAP = 500 - 600 = -100
NII = (0.085 x 500 + 0.11 x 350) - (0.055 x 600 + 0.06 x 220)
NIM = 34.8 / 850 = 4.09%NII = 81 - 46.2 = 34.8
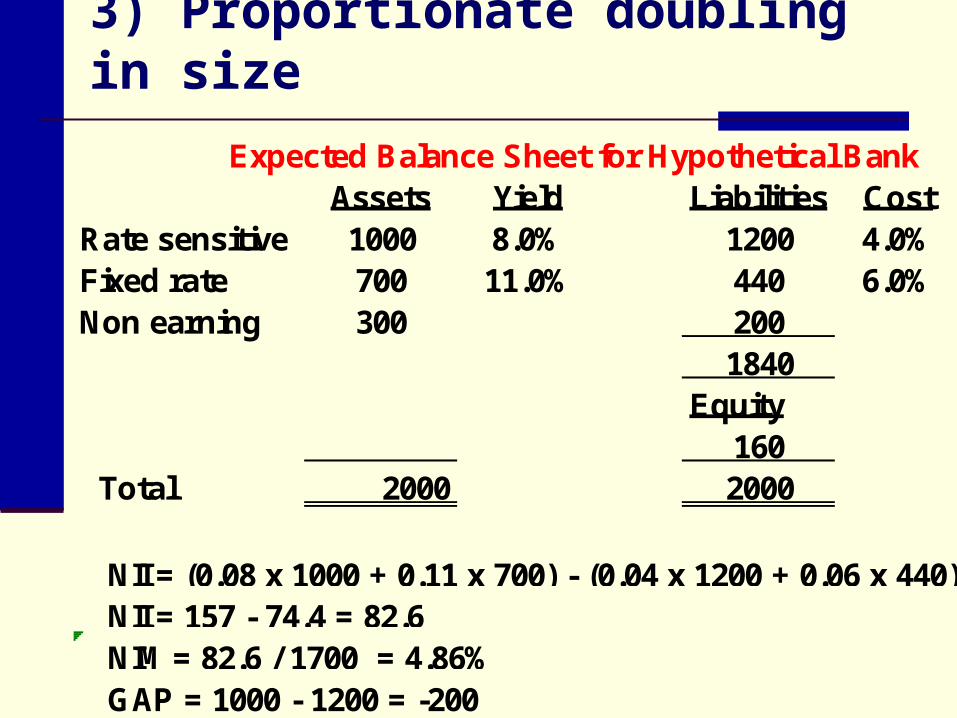
3) Proportionate doubling in size
Expected Balance Sheet for Hypothetical BankAssets Yield Liabilities Cost
Rate sensitive 1000 8.0% 1200 4.0%Fixed rate 700 11.0% 440 6.0%Non earning 300 200
1840Equity
160 Total 2000 2000
GAP = 1000 - 1200 = -200
NII = (0.08 x 1000 + 0.11 x 700) - (0.04 x 1200 + 0.06 x 440)
NIM = 82.6 / 1700 = 4.86%NII = 157 - 74.4 = 82.6
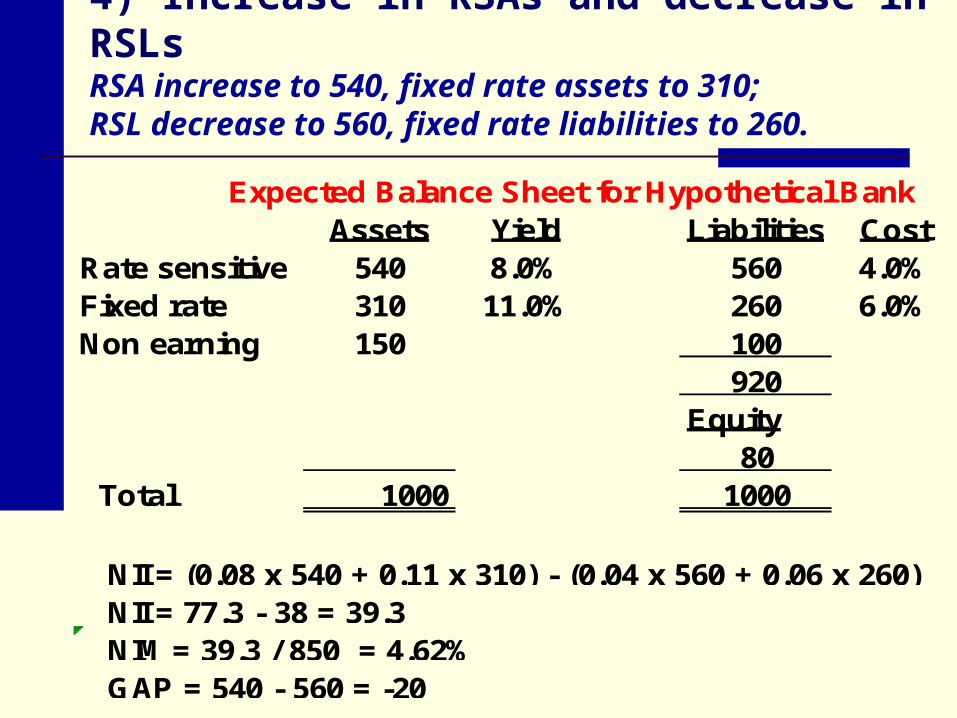
4) Increase in RSAs and decrease in RSLsRSA increase to 540, fixed rate assets to 310; RSL decrease to 560, fixed rate liabilities to 260.
Expected Balance Sheet for Hypothetical BankAssets Yield Liabilities Cost
Rate sensitive 540 8.0% 560 4.0%Fixed rate 310 11.0% 260 6.0%Non earning 150 100
920Equity
80 Total 1000 1000
GAP = 540 - 560 = -20
NII = (0.08 x 540 + 0.11 x 310) - (0.04 x 560 + 0.06 x 260)
NIM = 39.3 / 850 = 4.62%NII = 77.3 - 38 = 39.3

Positive and negative gap’s
Positive GAP …indicates a bank has more rate sensitive assets than liabilities, and that net interest income will generally rise (fall) when interest rates rise (fall).
Negative GAP …indicates a bank has more rate sensitive liabilities than rate sensitive assets, and that net interest income will generally fall (rise) when interest rates rise (fall).
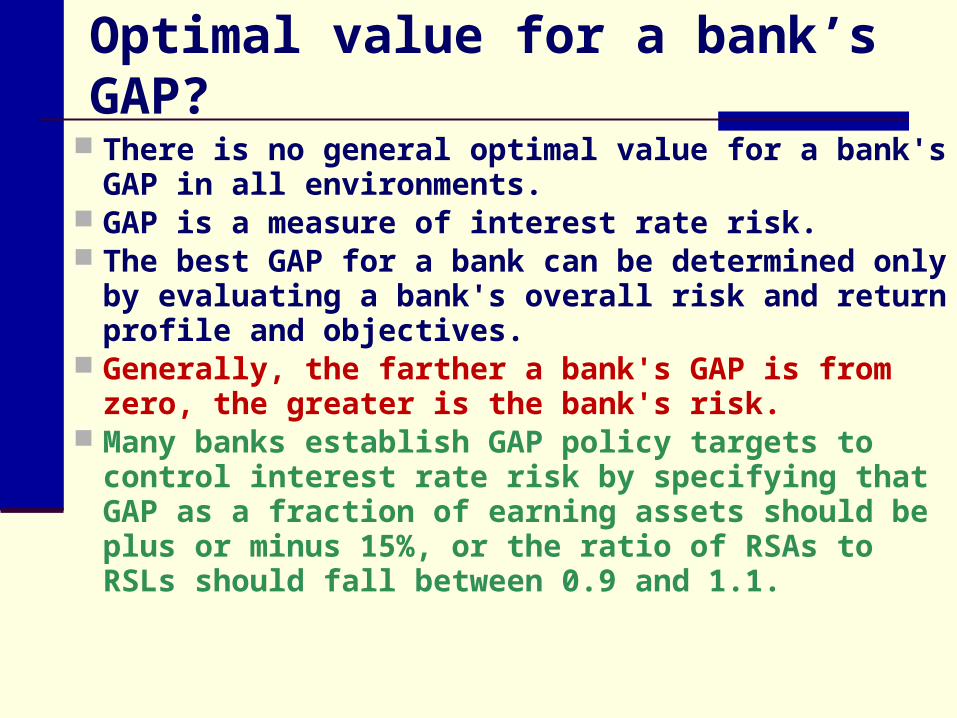
Optimal value for a bank’s GAP?
There is no general optimal value for a bank's GAP in all environments.
GAP is a measure of interest rate risk. The best GAP for a bank can be determined only by
evaluating a bank's overall risk and return profile and objectives.
Generally, the farther a bank's GAP is from zero, the greater is the bank's risk.
Many banks establish GAP policy targets to control interest rate risk by specifying that GAP as a fraction of earning assets should be plus or minus 15%, or the ratio of RSAs to RSLs should fall between 0.9 and 1.1.
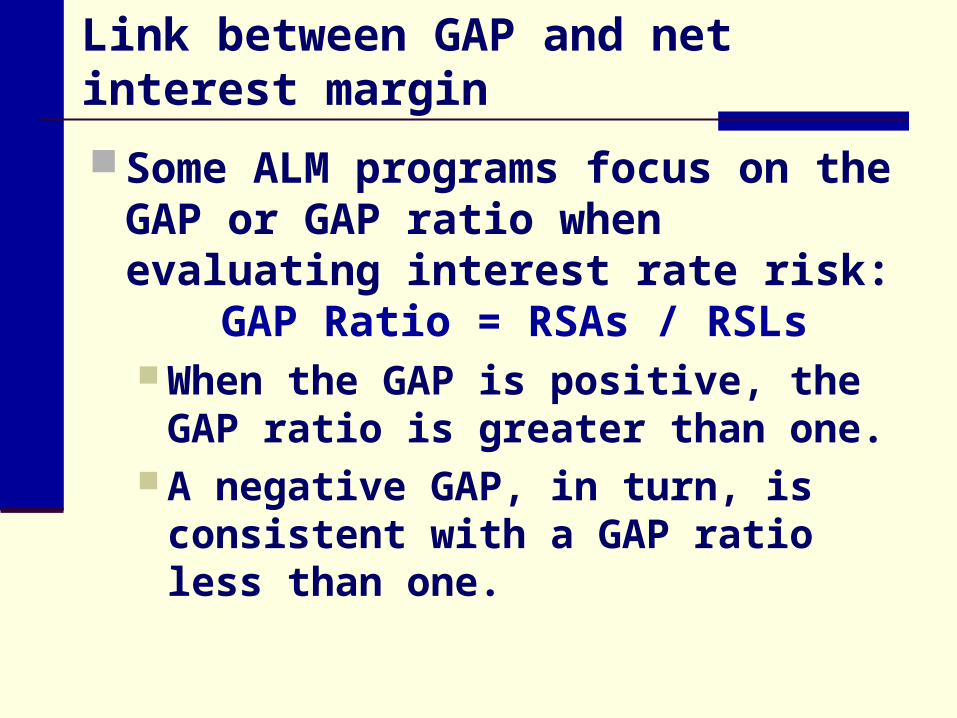
Link between GAP and net interest margin
Some ALM programs focus on the GAP or GAP ratio when evaluating interest rate risk:
GAP Ratio = RSAs / RSLs When the GAP is positive, the GAP
ratio is greater than one. A negative GAP, in turn, is consistent
with a GAP ratio less than one.
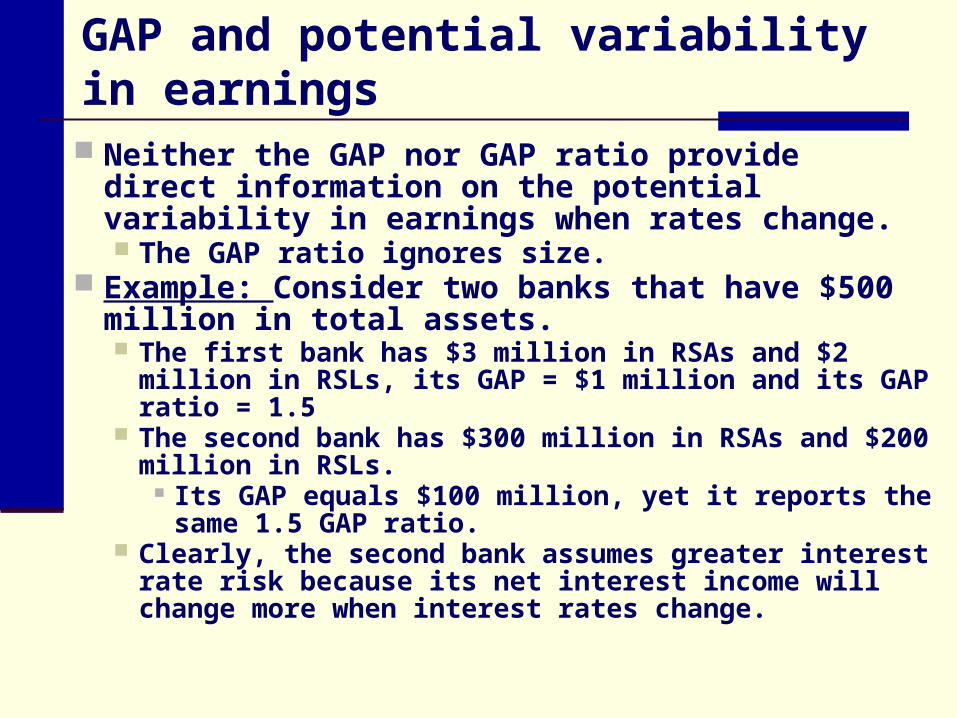
GAP and potential variability in earnings
Neither the GAP nor GAP ratio provide direct information on the potential variability in earnings when rates change. The GAP ratio ignores size.
Example: Consider two banks that have $500 million in total assets. The first bank has $3 million in RSAs and $2 million in
RSLs, its GAP = $1 million and its GAP ratio = 1.5 The second bank has $300 million in RSAs and $200
million in RSLs. Its GAP equals $100 million, yet it reports the same
1.5 GAP ratio. Clearly, the second bank assumes greater interest rate
risk because its net interest income will change more when interest rates change.
rates interest in change % Expected
NIM) tedNIM)(Expec in change % (Allowable
assets Earning
GAP Target
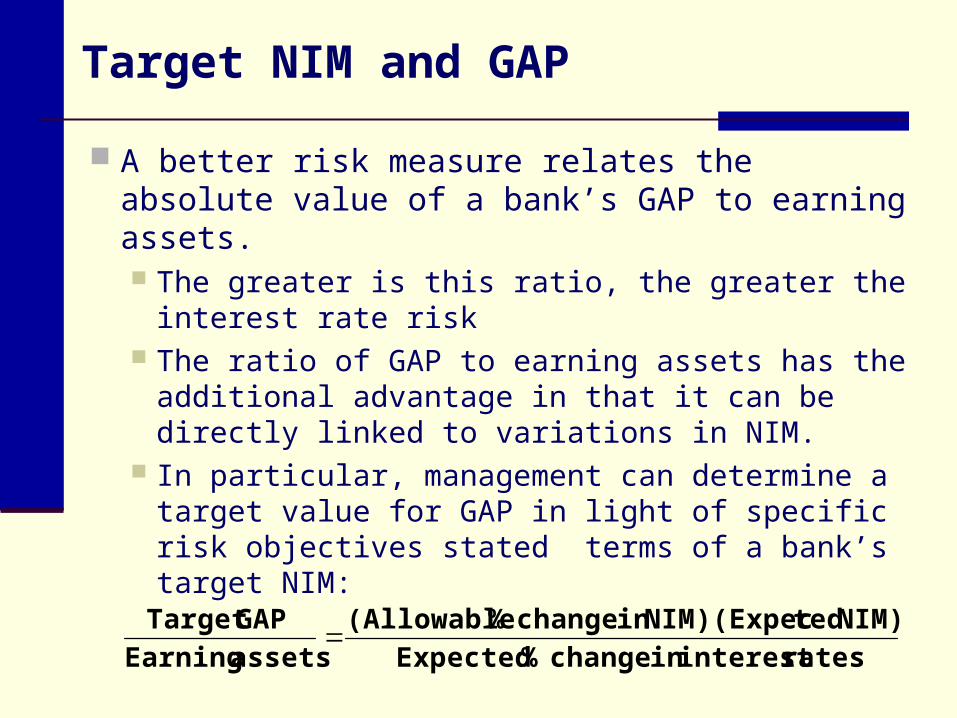
Target NIM and GAP
A better risk measure relates the absolute value of a bank’s GAP to earning assets. The greater is this ratio, the greater the interest
rate risk The ratio of GAP to earning assets has the
additional advantage in that it can be directly linked to variations in NIM.
In particular, management can determine a target value for GAP in light of specific risk objectives stated terms of a bank’s target NIM:
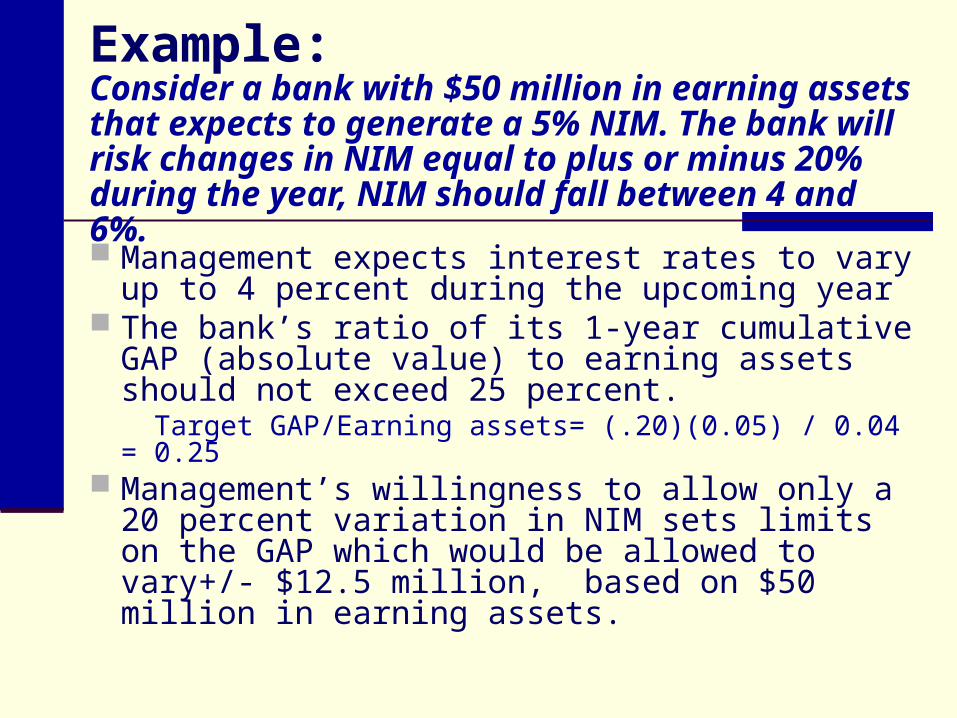
Example: Consider a bank with $50 million in earning assets that expects to generate a 5% NIM. The bank will risk changes in NIM equal to plus or minus 20% during the year, NIM should fall between 4 and 6%.
Management expects interest rates to vary up to 4 percent during the upcoming year
The bank’s ratio of its 1-year cumulative GAP (absolute value) to earning assets should not exceed 25 percent. Target GAP/Earning assets= (.20)(0.05) / 0.04 = 0.25
Management’s willingness to allow only a 20 percent variation in NIM sets limits on the GAP which would be allowed to vary+/- $12.5 million, based on $50 million in earning assets.
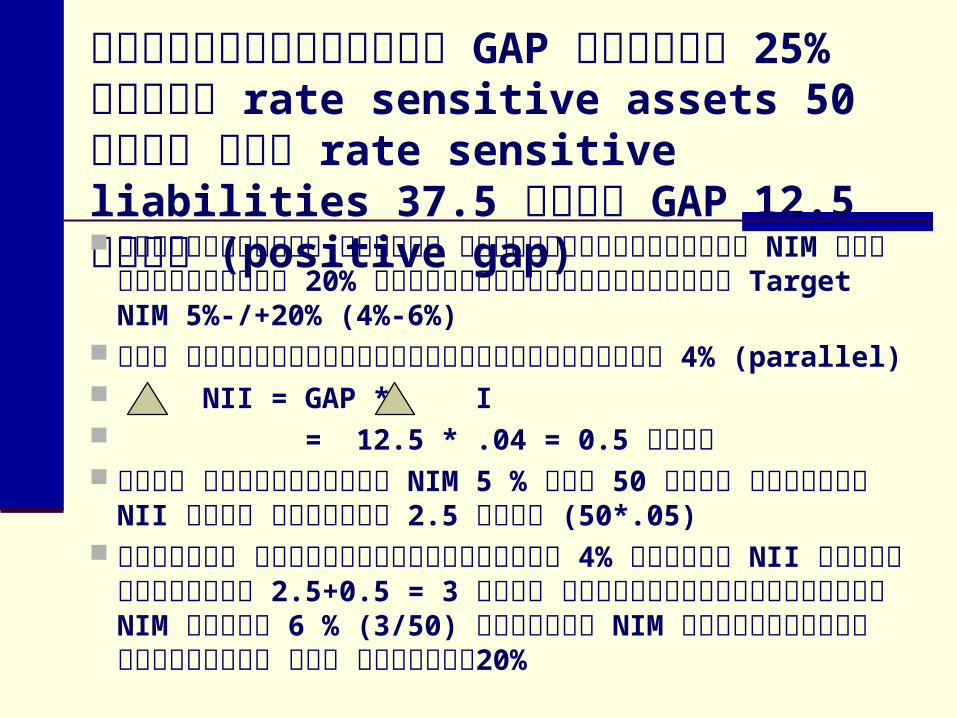
สมมติ�ท่�านรั�กษา GAP ไว้�ท่�� 25% คื�อม� rate sensitive assets 50 ล�าน และ rate sensitive liabilities 37.5 ล�าน GAP 12.5 ล�าน (positive gap) ท่�านจะสามารัถ จ�าก�ดิ การัเป็ล��ยนแป็ลงของ NIM ไว้�ท่��ไม�
เก�น 20% ไดิ�ติามนโยบายท่��ก�าหนดิ Target NIM 5%-/+20% (4%-6%)
หาก อ�ติรัาดิอกเบ�%ยในติลาดิเพิ่��มข(%น 4% (parallel) NII = GAP * I = 12.5 * .04 = 0.5 ล�าน เดิ�ม คืาดิว้�าจะไดิ� NIM 5 % จาก 50 ล�าน แสดิงว้�า NII เดิ�ม
เท่�าก�บ 2.5 ล�าน (50*.05) ดิ�งน�%น การัท่��ดิอกเบ�%ยข(%น 4% ท่�าให� NII เพิ่��มข(%นเป็น
2.5+0.5 = 3 ล�าน ซึ่(�งเม��อคื�านว้ณเป็น NIM จะไดิ� 6 % (3/50) น��นคื�อ NIM เป็ล��ยนแป็ลงติามนโยบาย คื�อ ไม�เก�น20%