lot quality assurance sampling (lqas) an...
TRANSCRIPT
Lot Quality Assurance Sampling (LQAS)
An Overview
LQAS Conference, Sheraton Kampala Hotel 3rd July 2006

Explain: – Basic principles of Lot Quality Assurance Sampling (LQAS)
for carrying out baseline and monitoring surveys of community programs
– Some statistics behind the LQAS Methodology
Present some practical examples of LQAS application in the field
Purpose of the Presentation
A sampling method that:Can be used locally, at the level of a “supervision area,” to identify priority areas (e.g., county, sub-county) or indicators that are not reaching average coverage or an established benchmark
Can provide an accurate measure of coverage or health system quality at a more aggregate level (e.g., program catchment area or district or refugee camp)
Can be used for quality assurance using a ‘minimal sample’, ‘maximal security’ principle
What is LQAS?

Originally developed in the 1920s to control the quality of output in industrial production processesInvolves taking a small random sample of a manufactured batch (lot) and test the sampled items for qualityIf the number of defective items in the sample exceeds a pre-determined criteria (decision rule), then the lot is rejectedThe decision rule is based on the desired production standards and a statistically determined sample size‘n’ is chosen so that the manager has a high probability of accepting lots that meet the quality standards and rejecting lots that fail to meet those standards
LQAS is a simple, low cost random sampling methodology

Some Useful LQAS Definitions
Supervision area:A county or sub-counties in a given district where services are being delivered
Lot:A batch of items produced in given time by the production unit
Supervision Unit:The district were these services are delivered
Production unit:The machine or team that produced or assembled the lot
Coverage:% of clients who received a service in a defined period of time
Production standard:% of items that must “pass”before a lot is accepted
Standard LQAS theory UPHOLD ‘LQAS’ Adaptation

Gulu MCAswa Kilak
Nwoya
Omoro
What are the LQAS Principles?
Assume a program covers a whole district
Each county is then called a ‘supervision area’ and district a ‘supervision unit’
LQAS would chose a minimum of 19 items (e.g. households, schools, health units) from each ‘supervision area’ in order to assess an indicator

Gulu MCAswa Kilak
Nwoya
Omoro
What are the LQAS Principles?
Good
Below Averageor Desired Coverage

Good
Below Average or desired coverage
Identify the reasons for program problems
Develop targeted solutions
Maintain the program at the current level
Identify ‘best practices’ that can help others programs improve their performance
What can be done with the findings?

S.A. = 19
S.A. = 19
S.A. = 19S.A. = 19
S.A. = 19
District
A sample of 19 is taken from each supervision area in each district

A sample size of 19 provides an acceptable level of error for making management decisions; at least 92% of the time, it identifies whether a coverage benchmark has been reached or whether an SA is substantially below the average coverage of a program area
Samples larger than 19 have practically the same statistical precision as 19. They do not result in better information, and they cost more
Why use a Sample Size of 19?

Why use a Sample Size of 19?
Little is added to the precision of the measure by using a sample larger than 19, notwithstanding the level of coverage to be assessed
Sample sizes less than 19 however, see a rapid deterioration in the precision of the measure. This is particularly problematic when coverage benchmarks vary

Good for setting priorities within a Supervision AreaGood for setting priorities among supervision areas with large differences in coverageGood for deciding what are the higher performing supervision areas to learn fromGood for deciding what are the lower performing supervision areas in which to invest resourcesGood for identifying knowledge/practices that have high coverage from those of low coverage
What can a sample of 19 tell us?
Not good for calculating exact coverage in a supervision area (but can be used to calculate coverage for an entire program)
Not good for setting priorities among supervision areas with little difference in coverage
What a Sample of 19 Cannot tell us

Step 1. List Communities and Total Population
Step 2. Calculate the Cumulative Population
Step 3. Calculate the Sampling Interval
Step 4. Choose a Random Number
Step 5. Beginning with the random number, use the sampling interval to identify communities for the 19 sets of interviews
Identifying Households for Interview
Low sample size needs (n=19 in most cases)
Simple to apply yet has very specific conclusions
District level people can be trained to entirely ‘own’ this methodology
Provides high quality information at low & affordable cost
Fast – ‘supervision areas’ are able to conduct self-evaluation and obtain results immediately after the survey
Results are locally relevant and can be utilized in district level annual planning
and decision-making
Benefits of LQAS as a Sampling Method

Benefits of LQAS to Districts
Change of mindsets towards reliance on data for Evidence-Based planningDistricts have relied on LQAS data to identify priority target areas for implementation and to focus work plansDistricts can use LQAS to do own evaluations in different technical areas e.g., education, agricultureStrengthened partnership between districts and NGOs in provision of related services
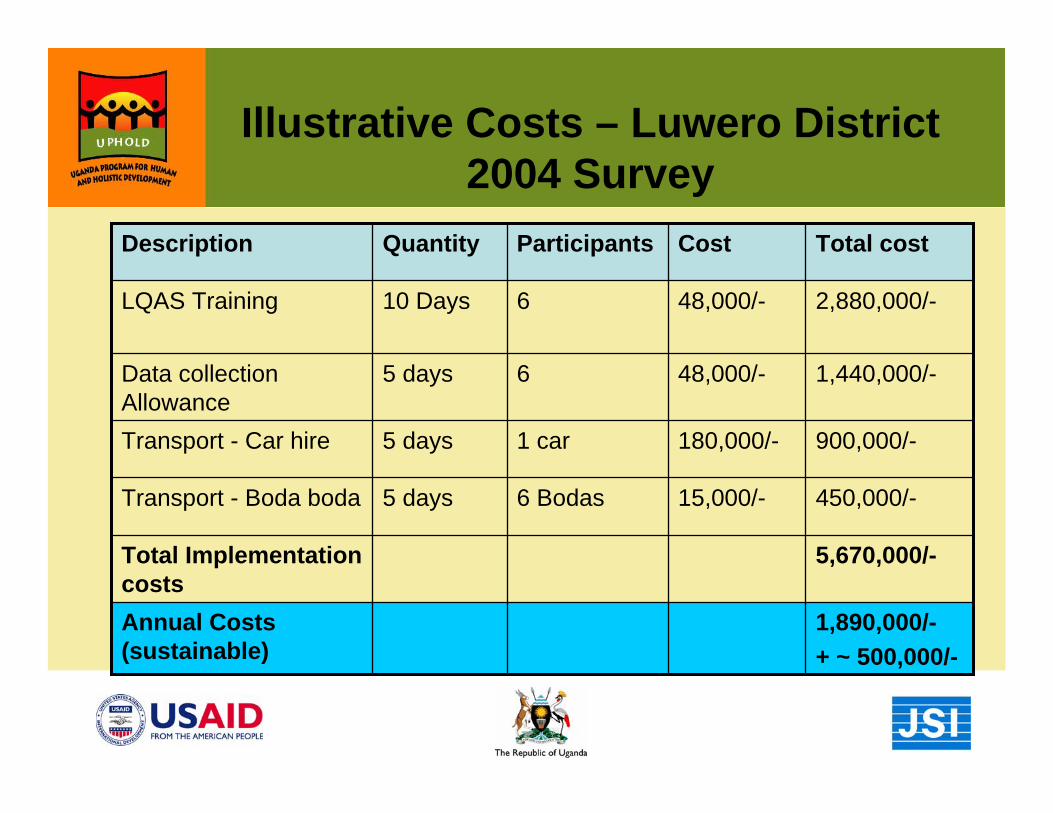
15,000/-
180,000/-
48,000/-
48,000/-
Cost
5 days
5 days
5 days
10 Days
Quantity
1,890,000/-+ ~ 500,000/-
Annual Costs (sustainable)
5,670,000/-Total Implementation costs
450,000/-6 BodasTransport - Boda boda
900,000/-1 carTransport - Car hire
1,440,000/-6Data collection Allowance
2,880,000/-6LQAS Training
Total costParticipantsDescription
Illustrative Costs – Luwero District 2004 Survey

Comparative Cost Analyses for Using LQAS and Cluster Sampling (USD)
$21.83$1.87$4.06$7.39Cost per Observation
6,5487451,5852,947Total cost
2,561146762796Food & Accom.
816179403403Materials
673420420420Transport
2,498--1,328Salary
Cluster Sample Cost
Recurrent Marginal Cost for next use
Minus Opport. Cost = Marginal Cost
Total Essential Costs
Item
NEPAL EXAMPLE
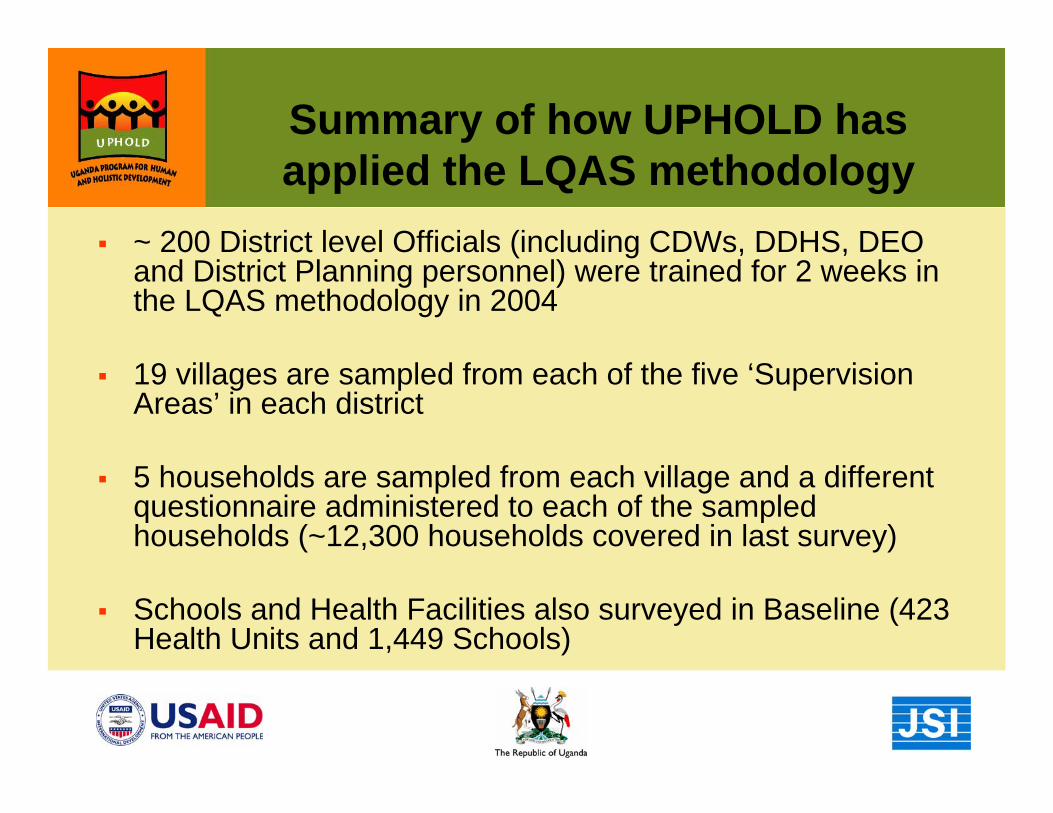
~ 200 District level Officials (including CDWs, DDHS, DEO and District Planning personnel) were trained for 2 weeks in the LQAS methodology in 2004
19 villages are sampled from each of the five ‘Supervision Areas’ in each district
5 households are sampled from each village and a different questionnaire administered to each of the sampled households (~12,300 households covered in last survey)
Schools and Health Facilities also surveyed in Baseline (423 Health Units and 1,449 Schools)
Summary of how UPHOLD has applied the LQAS methodology

BASELINE Yr. 1 Yr. 2 Yr. 3 Yr. 4
10% 30% 50% 70% 80%
Program Costs from Baseline until Year 4 of the ProjectImprovement
After the Baseline achievements are compared with Annual Targets
EXAMPLE
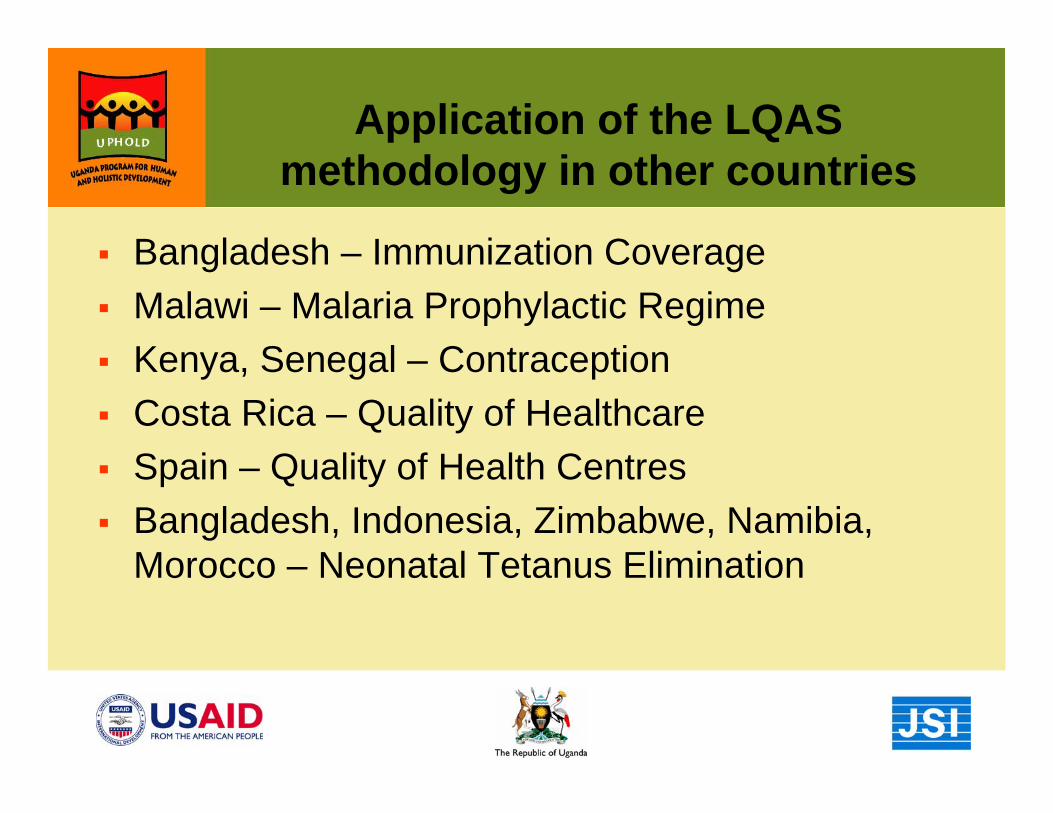
Bangladesh – Immunization CoverageMalawi – Malaria Prophylactic RegimeKenya, Senegal – ContraceptionCosta Rica – Quality of HealthcareSpain – Quality of Health CentresBangladesh, Indonesia, Zimbabwe, Namibia, Morocco – Neonatal Tetanus Elimination
Application of the LQAS methodology in other countries