logging, testing and monitoring geothermal wells · presented at “sdg short course iii on...
TRANSCRIPT

Presented at “SDG Short Course III on Geothermal Reservoir Characterization: Well Logging, Well Testing and Chemical Analysis”, organized by UNU-GTP and LaGeo, in Santa Tecla, El Salvador, September 16 - 22, 2018.
1
LaGeo S.A. de C.V. GEOTHERMAL TRAINING PROGRAMME
LOGGING, TESTING AND MONITORING GEOTHERMAL WELLS
Gudni Axelsson1 and Benedikt Steingrímsson2
1,2Iceland GeoSurvey (ÍSOR) 1University of Iceland
Reykjavík ICELAND [email protected]
ABSTRACT Wells or boreholes are essential components in both geothermal research and utilization as they enable a drastic increase in geothermal energy production beyond natural out-flow as well as providing access deep into the systems, not otherwise possible. Wells also play a vital role in all geothermal reservoir physics (also called reservoir engineering) research, which would be particularly ineffective without the access into geothermal systems provided by wells. During drilling the main reservoir physics research is performed through logging of different parameters as functions of depth, with temperature and pressure being of particular importance. At well completion the most important reservoir physics research is step-rate well-testing, either through injection or production, which enables the first estimates of well and reservoir properties. Reservoir physics research is also conducted in association with well stimulation at the end of drilling. Repeated temperature logging aimed at estimating undisturbed reservoir temperature and pressure is the key research performed during well warm-up. Monitoring of mass and energy output along with logging down-hole pressure transients is the most important reservoir physics research conducted during output testing of geothermal wells along with pressure recovery logging after wells are shut in and interference monitoring. Much of the same reservoir physics research is also conducted in reinjection wells during drilling and following completion. All of the above provides vital information for reservoir assessments of the geothermal resource in question, but the most important data for that purpose actually comes from monitoring of energy production and the consequent response of the geothermal system during long-term (several years) utilization. The reservoir physics data collected during these phases also plays an essential role in the calibration of various reservoir models.
1. INTRODUCTION Wells or boreholes are vital components in both geothermal research and utilization, since they provide essential access for both energy extraction and information collection, as already mentioned. The break-through of increased geothermal utilization and improved understanding of geothermal systems during last century coincided in fact with geothermal wells becoming the main instruments of geothermal devel-opment. Wells enable a drastic increase in geothermal energy production, compared to natural out-flow, and provide access deep into the systems, not otherwise possible. The key to the successful drilling of any type of geothermal well is correct siting and design of the well based on a clear definition and understanding of the drilling target aimed for, founded on all information available at any given time. This is best achieved through a comprehensive and up-to-date conceptual model incorporating, and

Axelsson and Steingrímsson 2 Logging, testing and monitoring
unifying, the essential physical features of a geothermal system. Geothermal drilling targets and well siting are discussed in a separate lecture at this short course (Axelsson and Franzson, 2012). The current lecture can be considered a sequel to that lecture. Geothermal wells play a variable role during both development of a geothermal resource and during their utilization. The main roles are either as temperature gradient, exploration, appraisal, production, step-out, make-up, reinjection or monitoring wells. Wells also play an essential role in all geothermal reservoir physics research. Such research would be particularly ineffective without the access into geothermal systems wells provide. Geothermal reservoir physics, commonly also called geothermal reservoir engineering, is the scientific discipline that deals with mass and energy transfer in geothermal systems and geothermal wells. It attempts to understand and quantify this flow along with accompanying changes in reservoir conditions, in particular those caused by exploitation. During the exploration stage of a geothermal resource research focuses on analysis of surface exploration data; mainly geological, geophysical and geochemical data (Axelsson and Franzson, 2012). This emphasis changes to reservoir physics research during development and utilization. The purpose of geothermal reservoir physics is, in fact, twofold: To obtain information on the nature, reservoir properties and physical conditions in a geothermal system and to use this information to predict the response of reservoirs and wells to exploitation. Based on the latter the energy production capacity of a geothermal resource can be assessed. Response predictions also aid in the different aspect of the management of geothermal resources during utilization (Axelsson, 2008). Geothermal reservoir physics emerged as a separate scientific discipline in the 1970s even though some isolated studies of the physics of geothermal systems had been conducted before that in countries like Iceland, New Zealand and the USA (Grant et al., 1982). Geothermal reservoir engineering, as well as geothermal technology in general, draws heavily from the theory of ground water flow and petroleum reservoir engineering, the former having emerged in the 1930’s. However, geothermal reservoirs are in general considerably more complex than ground-water systems or petroleum reservoirs. The different aspects of geothermal reservoir physics are e.g. discussed by Grant et al. (1982), Bödvarsson and Witherspoon (1989) and Grant and Bixley (2011). Geothermal wells can be classified as one of three principal types:
(a) Liquid-phase low-temperature wells, which produce liquid water at well-head (pressure may be higher than atmospheric, however).
(b) Two-phase high-temperature wells where the flow from the feed-zone(s) is liquid or two-phase and the wells produce either a two-phase mixture or dry-steam.
(c) Dry-steam high-temperature wells where the flow from the feed-zone(s) to the well-head is steam-dominated.
In the liquid-phase and dry-steam wells the inflow is single phase liquid water or steam, respectively, while two-phase wells can be furthermore classified as either liquid or two-phase inflow wells. In multi feed-zone two-phase wells one feed-zone can even be single-phase while another one is two-phase. This paper reviews the main reservoir physics research conducted through geothermal wells, in particular logging, well-testing and monitoring. It starts out by discussing logging of wells during drilling and the research conducted at the end of drilling, during well completion. After that it reviews logging and research conducted during the warm-up phase following drilling and during output testing. Subsequently the paper discusses briefly the monitoring of geothermal reservoirs during utilization. The paper is concluded by general conclusions and recommendations. The reader is also referred to a paper by Steingrímsson and Gudmundsson (2006) dealing with geothermal well research during and after drilling. 2. RESERVOIR PHYSICS RESEARCH DURING DRILLING 2.1 During drilling
Logging, testing and monitoring 3 Axelsson and Steingrímsson
The principal research conducted during drilling of geothermal wells is achieved through logging of the wells, often called wireline logging. This involves measuring various contrasting, partly unrelated, parameters for different purposes as a function of depth. Some of these are drilling technology related, others for logging geological parameters and still others for reservoir physics purposes. The following are the main logging methods applied during geothermal well drilling:
(A) Caliper and cement bond logging aimed at measuring variations in well diameter and assessing the integrity of casing cementing. The former is, in particular, used to measure wash-out inter-vals, either in soft formations or at major feed-zones. The latter method is used to evaluate how well casings are bonded to cement injected into the annulus between the casings and the rock formations outside the wells, in particular. These types of logs are discussed in more detail by Steingrímsson (2011a). In addition imaging of casings and other parts of wells by video cameras is increasingly being used, in particular at relatively shallow levels (down to several hundred metres), to study casing damages, formations and sometimes feed-zones (examples will be pre-sented at this short course).
(B) Geophysical logging aimed at estimating different physical properties of the rock formations intersected by the well. This type of logging also supplements drill cutting analysis, in particular for depth intervals where drill cuttings aren’t available, e.g. due to total circulation loss. Such logs include various types of resistivity logs, neutron-neutron logs aimed at estimating water content (dependent on porosity), gamma-gamma logs aimed at estimating rocks density, sonic logs aimed at estimating seismic wave velocity and natural gamma ray logs, which can be used to distinguish certain types of formations. These types of logs are discussed in more detail by Steingrímsson (2011b).
(C) Fracture imaging is increasingly being used to study specific fractures and fracture distribution in wells. The method most often applied is televiewer logging, which produces an acoustic “picture” of the walls of a well, where fractures can be easily mapped and their strike and dip determined. These provide an extremely valuable addition to other logging, and circulation loss analysis, aimed at understanding feed-zones in wells. Steingrímsson (2011b) also discusses fracture imaging. Figure 1 shows a clear example of a televiewer image of a feed-zone in a geothermal well in Iceland.
(D) Temperature and pressure logging can be viewed as the main reservoir physics logging performed during drilling. These will be discussed in more detail below. In addition spinner logging is often applied to estimate fluid flow in wellbores as well as inflow or outflow through feed-zones.
It may be mentioned in addition that geothermal logging is discussed in depth in an old treatise by Stefánsson and Steingrímsson (1980) as well as by Grant and Bixley (2011). During the drilling phase of a well temperature and pressure logging has a few different research purposes; firstly to evaluate well conditions regarding the drilling operation itself, secondly to locate feed-zones (inflow or outflow zones) and thirdly to estimate reservoir temperature and pressure. During drilling temperature and pressure are, however, greatly disturbed and it’s difficult to estimate reservoir temperature and pressure accurately. Temperature is e.g. always lowered by drilling fluid circulation as well as being often affected by inflow or outflow through feed-zones or internal flow between feed-zones (Figure 2). Undisturbed temperature is sometimes approximated by measuring temperature warm-up during short breaks (sometimes overnight) in the drilling operation, either planned or unplanned. Then the temperature recovery is measured as a function of time at a specific depth (often well bottom) and particular methods, such as the Horner method, used to assess the undisturbed temperature. The application of temperature and pressure logging will be discussed further below.

Axelsson and Steingrímsson 4 Logging, testing and monitoring
FIGURE 1: An example of a televiewer image of a highly productive, open feed-zone in a geothermal well in Iceland striking NW-SE and dipping 7° from the vertical (Steingrímsson, 2011b)
The instruments used for logging geothermal wells will not be discussed in this paper, but it may be mentioned that most such tools come, or have been adapted, from the petroleum industry. Many such tools have temperature limitations so that high-temperature wells need to be in cooled down conditions (i.e. during drilling) when used, in particular the geophysical logging tools and televiewers. High-temperature tools, such as for logging temperature and pressure, were previously mechanical ones, which could only be used for logging at discrete depths. Now memory tools with continuous recording are mostly used for this purpose. Tools tolerating higher temperature than conventional geothermal logging tools are being developed, however (see e.g. Massiot et al., 2010). 2.2 At completion At well completion reservoir physics research kicks in at full force, with the main purpose being to assess the result of the drilling operation. If the outcome is deemed satisfactory the drilling operation is stopped, otherwise drilling may be continued to greater depth or a program of well stimulation may be initiated (see later). The main phases of conventional completion program for a geothermal production well are as follows:
(1) Temperature and pressure logging, sometimes accompanied by spinner logging, to evaluated location and relative importance of feed-zones as well as temperature conditions prior to later phases of the completion test (due to temperature limitations of instruments used).
(2) Geophysical logging and fracture imaging of the production part of the well. (3) Step-rate well-testing; through injection in high-temperature wells or production in low-
temperature wells. Pressure (and sometimes temperature) transients measured down-hole. (4) Temperature and pressure logging is normally performed after, sometimes even during step-rate
testing. Spinner logging can be beneficial to assess feed-zones.

Logging, testing and monitoring 5 Axelsson and Steingrímsson
FIGURE 2: A sketch showing typical temperature profiles measured during drilling, the first with one
main circulation loss at depth (A), the second with a shallow and deep circulation loss (B) and the third with shallow inflow (because of higher pressure in the loss-zone outside the well), down-flow
and deep outflow (Grant et al., 1982) The purpose of the step-rate well-testing, which is the main reservoir physics research conducted at the end of drilling a well, is to obtain a first estimate of the possible production capacity of a well and to estimate its production characteristics. In the case of high-temperature wells this estimate is only indirect since it’s not performed at high-temperature, production conditions. Step-rate well-testing usually lasts from several hours to a few days. The following are the parameters usually estimated on basis of step-rate test data:
(a) Injectivity index, defined as II = ∆q/∆p, with ∆q the change in flow-rate and ∆p the change in down-hole pressure, usually based on measured values at the end of each step. In the case of low-temperature wells tested through production step testing a comparable index is defined, termed productivity index (PI). A productivity index is also estimated during production testing of high-temperature wells. This will be discussed later in the paper.
(b) Formation transissivity or permeability-thickness defined as T = kh/μ (or khρ/ν) and kh, respec-tively, with k the formation permeability, h the reservoir thickness, μ and ν the dynamic and kinematic viscosity of the fluid, respectively, and ρ the fluid density.
(c) Formation storage coefficient defined as S = sh (or shg), with s the storativity of the geothermal reservoir involved, h its thickness again and g the acceleration of gravity. The storativity (with units kg/(m3Pa)) describes the storage capacity per unit reservoir volume and depends on rock and fluid compressibility, free surface mobility or phase change activity (two-phase storativity).
(d) Skin factor of the well, which describes an additional pressure drop next to a well due to so-called wellbore damage, often caused by clogging of formation pore-space by drilling mud. A negative skin factor, however, reflects a well with stimulated near-well permeability.
(e) Wellbore storage capacity, which simply depends on wellbore volume and the well-fluid com-pressibility.
The injectivity index (as well as the productivity index) is a simple relationship, approximately reflecting the capacity of a well, which is useful for determining whether a well is sufficiently open to be a successful producer and for comparison with other wells. It neglects however transient changes and turbulence pressure drop at high flow-rates. For liquid phase low-temperature wells a more accurate productivity relationship can usually be put forward relating mass flow-rate (q) and well pressure (p):

Axelsson and Steingrímsson 6 Logging, testing and monitoring
2
0 )( Cqqtbpp (1)
The pressure can either be measured as down-hole pressure, depth to water-level if pumping from the well is required or well-head pressure if flow from the well is artesian. The term p0 represents the initial well pressure before production starts, b(t)q transient changes in well pressure reflecting transient changes in reservoir pressure and Cq2 turbulent and frictional pressure changes in the feed-zones next to the well, where flow-velocities are at a maximum, and in the well itself. The term b(t) depends on the properties of the reservoir in question, such as permeability and storativity (items (b) and (c) above). The injectivity index is, therefore, in fact an approximation of this term. To be exact the term will also include interference (due to production and/or reinjection) from other nearby wells. Figure 3 shows examples of productivity curves (often also called deliverability or output curves) for three liquid-phase low-temperature geothermal wells with vastly variable production characteristics, based on real Icelandic low-temperature examples.
FIGURE 3: Examples of productivity curves (i.e. Equation 1) for liquid-phase low-temperature
geothermal wells with varying characteristics. Based on real Icelandic examples (see Axelsson and Gunnlaugsson, 2000).
The permeability-thickness (item (b)) and storage coefficient (item (c)) are estimated through an analysis of pressure transients measured during completion well-tests (called pressure transient analysis), which is a more accurate analysis than involved in the simple estimation of an injectivity index. The corresponding analysis methods most often applied in the geothermal industry have been inherited from groundwater science (they have also been adopted by petroleum reservoir engineering). These classical methods will not be discussed in detail here but instead the reader is referred to the works by Bödvarsson and Witherspoon (1989) and Grant and Bixley (2011). The foundation of the methods is the well-known Theis model, a sketch of which is presented in Figure 4, along with sketches of a few variants of the basic model. The Theis model comprises a model of a very extensive horizontal, permeable layer of constant thickness, confined at the top and bottom, with two-dimensional, horizontal flow towards a producing well extending through the layer.

Logging, testing and monitoring 7 Axelsson and Steingrímsson
Well-test data are analysed on basis of the Theis model, and its variants, by fitting the pressure response of the model to observed pressure response data. Consequently the parameters of the model provide an estimate of the parameters of the reservoir being tested. Historically this fitting has been done by using semi-logarithmic plots or the type-curve method. The former method is still used as it is quite simple and effective, in spite of simplifying assumptions; Figure 5 shows the calculated responses of the Theis model and its variants in Figure 4, on a semi-logarithmic plot. The type-curve method has been replaced by more modern, computerized fitting, which today is often applied through an inverse approach, automatically yielding best fitting reservoir parameter estimates. Figure 6 shows one of the first examples of the results of computerized fitting of step-rate injection data, from a well drilled into the Krafla volcanic geothermal system in Iceland. It may be mentioned that today combined fitting of the pressure transients and their derivative (derivative analysis) is increasingly being used.
FIGURE 4: A sketch of the basic Theis-model (top) used to analyse pressure transient well-test data
along with several variants of the basic model (Bödvarsson and Whiterspoon, 1989)

Axelsson and Steingrímsson 8 Logging, testing and monitoring
FIGURE 5: Responses of the models in Figure 4 plotted on a semi-logarithmic plot (linear pressure change vs. logarithmic time) demonstrating the linear behaviour, which is the basis of the semi-
logarithmic analysis method (Bödvarsson and Whiterspoon, 1989)
FIGURE 6: An early example of the results of computerized simulation of step-rate injection test data by a Theis-model response (Bödvarsson et al., 1984). Data from a high-temperature production well
in the Krafla volcanic geothermal system in N-Iceland. It may be mentioned that Rutagarama (2012) presents a good treatise on the role of well-testing in geothermal resource assessment while Sarmiento (2011) discusses completion testing in more detail than done here, based on examples from high-temperature geothermal fields in the Philippines. It should also be stressed that the analysis method for geothermal well-test data introduced briefly above is based on particular, simplifying assumptions, which are not always applicable. This applies e.g. to the assumption of two-dimensional flow, while three-dimensional flow may be important in many geothermal situations. Therefore, the results of geothermal well-test analyses should be viewed with the model applied in mind. In other words the results are actually model-dependent.

Logging, testing and monitoring 9 Axelsson and Steingrímsson
2.3 During stimulation Stimulation operations are frequently part of the completion programs of geothermal wells, as already mentioned. This will only be touched upon briefly here but the reader is referred to the lecture by Thórhallsson (2012), and other related lectures, at this short course, as well as the paper by Axelsson and Thórhallsson (2009) on stimulation of geothermal wells drilled in the basaltic environment of Iceland. The purpose of stimulation operations is to enhance the output of wells either by improving near-well permeability that has been reduced by the drilling operation itself or to open up hydrological connections to permeable zones not intersected by the well. The methods most commonly used involve applying high-pressure water injection, sometimes through open-hole packers, or intermittent cold water injection with the purpose of thermal shocking. Chemical stimulation (mostly applying acid) methods are also used. Experimental procedures, such as using deflagration to stimulate wells and propellants to maintain stimulation achieved, have also been tested. Stimulation operations commonly last a few days while in some instances stimulation operations have been conducted for some months. The stimulation operations often result in well productivity being improved by a factor of 2–3. Emphasis is placed on careful reservoir monitoring during stimulation operations. Seismic monitoring has e.g. provided valuable information in some few cases. Further research and “state of the art” technology are needed to better understand stimulation processes, however, and to improve the outcome of geothermal stimulation operations. The results of stimulation operations are usually assessed through repeated step-rate well-tests and by comparing injectivity (or productivity) indices estimated before, during and after stimulation operations. Changes in skin factor can also be used to evaluate the outcome of such operations. 3. RESERVOIR PHYSICS RESEARCH DURING WARM-UP AND TESTING 3.1 During warm-up After the drilling of a geothermal well is completed a well is usually allowed to recover in temperature (heat up) from the cooling caused by drilling fluid circulation and cold water injection. How long depends on local conditions and the development project being followed, but this usually takes a few months. The principal reservoir engineering research conducted during this period is repeated temperature and pressure logging. The temperature data thus collected is used to estimate the undisturbed system temperature, often called formation temperature, as wells usually don’t recover completely during the recovery period. Different methods can be used for this estimation, but the method most often applied is the so-called Horner method (Grant and Bixley, 2011). An example of the results of its application is presented in Figure 7. The pressure data collected are used to estimate the reservoir pressure with the intersection of several warm-up pressure profiles defining the so-called pivot point. If a single feed-zone dominates a well the pivot point defines the reservoir pressure at the feed-zone depth. If two, or more, feed-zones exist in a well the pivot point defines average conditions instead. Figure 8 shows examples of two warm-up temperature logging series from the Olkaria Domes geothermal field in Kenya, along with the estimated formation temperature conditions for both wells. In these examples 5 – 6 warm-up temperature logs were measured for a period of up to two months. This is close to being ideal and in many other cases neither such a long warm-up period nor this number of logs is achieved.

Axelsson and Steingrímsson 10 Logging, testing and monitoring
FIGURE 7: Example of the use of the Horner method to estimate undisturbed formation temperature
from heating-up data (temperature recovery data) collected at a certain depth following drilling completion (Grant and Bixley, 2011)
FIGURE 8: Two examples of repeated temperature logs measured in two wells in the Olkaria Domes geothermal field in Kenya, OW-911A and OW-912, with the purpose of estimating the undisturbed
temperature (formation temperature) around the wells (Mwarania, 2010). Also shown are the estimated formation temperature profiles for each well along with boiling point curves for estimated
formation pressure conditions.

Logging, testing and monitoring 11 Axelsson and Steingrímsson
3.2 During output testing After a well has been allowed to warm up sufficiently it’s ripe for output testing. In the case of high-temperature wells this usually involves spontaneous discharge through boiling at depth in the wellbore, which creates the pressure drop necessary to drive the flow of geothermal fluid from the reservoir, through the well, and to the surface (discharge testing). In the case of lower temperature wells either sufficient overpressure in the reservoir, which creates free-flow (artesian) from wells, or pumping, is required for output testing. In many cases high temperature wells need to be discharge stimulated through a variety of methods before discharge can be sustained. Such methods are e.g. discussed by Sarmiento (2011). Measuring the well discharge of single-phase (liquid water or dry steam) wells is relatively straight-forward whereas measuring the discharge (both mass- and energy-flow) of a two-phase well is much more complex. This involves measuring, or estimating, two out of four key parameters; liquid-flow (qw), steam-flow (qs), total flow (qtotal) or enthalpy of the flow (ht). Once any two have been determined the other parameters can be estimated based on the following equations:
totals qqX (2)
swtotal qqq (3)
wst hXXhh )1( (4)
Here X is the mass-fraction of steam and hs and hw enthalpy of water and steam, respectively, at sepa-ration conditions on surface. The following are the main methods used to estimate the output of two-phase wells at surface (see also Grant and Bixley, 2011):
(1) Liquid and steam phases are separated (in a separator) and each phase measured separately. Probably the most accurate method but requires the most complex instrumentation.
(2) This method applies to wells with liquid inflow and known feed-zone temperature. Liquid flow measured after separation and enthalpy of flow estimated on basis of feed-zone temperature.
(3) This method also applies to wells with liquid inflow and known feed-zone temperature. Total flow estimated by Russel James method and enthalpy of flow on basis feed-zone temperature. The Russel James method is an empirical method, relating total flow and flowing enthalpy, based on measuring the critical lip-pressure at lip of a pipe discharging the two-phase mixture (James, 1970; Grant et al., 1982).
(4) A combination of using the Russel James method on the total flow and consequently measuring the liquid flow-rate after separation.
(5) Using two different chemical tracers to measure the flow-rate of each of the phases in a pipeline (Hirtz et al., 2001). This method is increasingly being used with success, doesn’t require dis-ruption of power production.
Figure 9 shows an example of discharge test data, again from the Olkaria Domes field in Kenya. It shows a typical behaviour resulting from the well heating up, actually continuing from the warm-up period after drilling, i.e. enthalpy increases and water flow decreases as the test progresses. In this case the test lasted about a month, but ideally discharge tests should last until an approximate equilibrium is reached, which often may take several months. In some cases equilibrium is not attained. The behaviour of discharging wells is, however, quite variable, depending on the nature of the geothermal reservoir involved and well properties, as e.g. discussed by Bödvarsson and Witherspoon (1989) and Grant and Bixley (2011).

Axelsson and Steingrímsson 12 Logging, testing and monitoring
FIGURE 9: Discharge test data from well OW-915A in the Olkaria Domes field in Kenya (Mwarania,
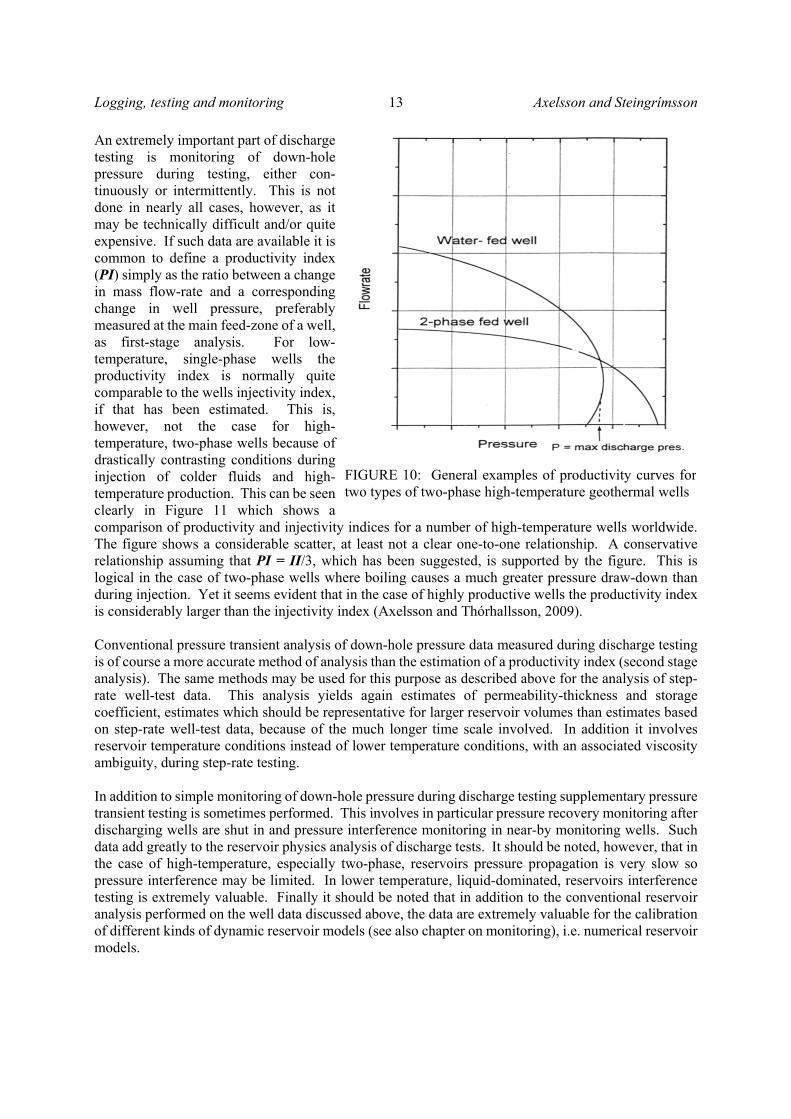
2010). The productivity of geothermal wells is often presented through a simple relationship between mass flow-rate or production (measured as mentioned above) and the corresponding pressure change, either in down-hole or well-head pressure, as a first-order approximation, as already discussed (see discussion on injectivity/productivity above). This relationship is often termed production characteristics or well deliverability (output curve). In general the productivity of geothermal wells is a complex function of well-bore parameters (diameter, friction factors, feed-zone depth, skin factor, etc.), feed-zone temperature and enthalpy, feed-zone pressure, reservoir permeability and storativity, well-head pressure or depth to water level during production and temperature conditions around the well. For two-phase high-temperature wells a simple relationship as given by Equation 1 can’t be set up between flow-rate and well-head pressure. Figure 10 shows examples of productivity curves for two types of two-phase high-temperature geothermal wells with vastly variable production characteristics. It exemplifies a clear distinction between wells with single phase feed-zone inflow, which show typical bell-shaped curves like liquid-phase wells (Figure 3), and wells with two-phase inflow, which show little variation in output with changes in well-head pressure. The possible reasons for the characteristics of the latter wells have been discussed by Stefánsson and Steingrímsson (1980) as well as Bödvarsson and Witherspoon (1989). When analysing data from flowing two-phase wells researchers need to resort to so-called wellbore simulators, i.e. computer software which numerically solves the relevant physical equations to simulate flow-, pressure- and energy conditions in the wells in question. These include mass conservation, pressure changes due to acceleration, friction and gravitation as well as energy conservation. The HOLA wellbore simulator is a good example of such software (Björnsson and Bödvarsson, 1987).
Logging, testing and monitoring 13 Axelsson and Steingrímsson
An extremely important part of discharge testing is monitoring of down-hole pressure during testing, either con-tinuously or intermittently. This is not done in nearly all cases, however, as it may be technically difficult and/or quite expensive. If such data are available it is common to define a productivity index (PI) simply as the ratio between a change in mass flow-rate and a corresponding change in well pressure, preferably measured at the main feed-zone of a well, as first-stage analysis. For low-temperature, single-phase wells the productivity index is normally quite comparable to the wells injectivity index, if that has been estimated. This is, however, not the case for high-temperature, two-phase wells because of drastically contrasting conditions during injection of colder fluids and high-temperature production. This can be seen clearly in Figure 11 which shows a comparison of productivity and injectivity indices for a number of high-temperature wells worldwide. The figure shows a considerable scatter, at least not a clear one-to-one relationship. A conservative relationship assuming that PI = II/3, which has been suggested, is supported by the figure. This is logical in the case of two-phase wells where boiling causes a much greater pressure draw-down than during injection. Yet it seems evident that in the case of highly productive wells the productivity index is considerably larger than the injectivity index (Axelsson and Thórhallsson, 2009). Conventional pressure transient analysis of down-hole pressure data measured during discharge testing is of course a more accurate method of analysis than the estimation of a productivity index (second stage analysis). The same methods may be used for this purpose as described above for the analysis of step-rate well-test data. This analysis yields again estimates of permeability-thickness and storage coefficient, estimates which should be representative for larger reservoir volumes than estimates based on step-rate well-test data, because of the much longer time scale involved. In addition it involves reservoir temperature conditions instead of lower temperature conditions, with an associated viscosity ambiguity, during step-rate testing. In addition to simple monitoring of down-hole pressure during discharge testing supplementary pressure transient testing is sometimes performed. This involves in particular pressure recovery monitoring after discharging wells are shut in and pressure interference monitoring in near-by monitoring wells. Such data add greatly to the reservoir physics analysis of discharge tests. It should be noted, however, that in the case of high-temperature, especially two-phase, reservoirs pressure propagation is very slow so pressure interference may be limited. In lower temperature, liquid-dominated, reservoirs interference testing is extremely valuable. Finally it should be noted that in addition to the conventional reservoir analysis performed on the well data discussed above, the data are extremely valuable for the calibration of different kinds of dynamic reservoir models (see also chapter on monitoring), i.e. numerical reservoir models.
FIGURE 10: General examples of productivity curves for two types of two-phase high-temperature geothermal wells

Axelsson and Steingrímsson 14 Logging, testing and monitoring
FIGURE 11: The relationship between productivity and injectivity indices for several high-temperature geothermal wells worldwide (Rutagarama, 2012). The red line represents PI = II while
the blue line represents PI = II/3. 3.3 For Reinjection wells In the case of reinjection wells, either drilled specifically as such or other types of wells converted into reinjection wells, much of the same reservoir physics research is conducted as described above. The main difference is that reinjection wells don’t need to be discharge tested so a step-rate injection test suffices. After well completion injection testing needs to be continued for a long period, usually several months. During this long-term injection testing tracer test are often conducted to study the connection between the designated reinjection well and near-by production wells, with the danger of cooling of the production wells in mind. A more detailed discussion of reinjection well research is beyond the present paper and for more information the reader is referred to another paper presented at this short course (Axelsson, 2012). It may be specifically mentioned, however, that the injectivity of reinjection wells sometimes continues to increase during long-term injection, most likely due to thermal stimulation. 4. MONITORING Management of geothermal resources relies on adequate knowledge on a geothermal system and the most important data on a geothermal system’s nature and properties are obtained through monitoring of its response to long-term utilization (Axelsson, 2008). Careful monitoring of a geothermal reservoir during exploitation is, therefore, an indispensable part of any successful management program. If the understanding of a geothermal system is adequate, monitoring will enable changes in the reservoir to be seen in advance. Timely warning is thus obtained of undesirable changes such as decreasing generating capacity due to declining reservoir pressure or steam-flow, insufficient injection capacity or possible operational problems such as scaling in wells and surface equipment or corrosion. The importance of a

Logging, testing and monitoring 15 Axelsson and Steingrímsson
proper monitoring program for any geothermal reservoir being utilised can thus never be over-emphasised. In addition utilization and monitoring can be viewed as really long-term reservoir testing, i.e. a continuation of the production testing discussed above. Monitoring the physical changes in a geothermal reservoir during exploitation is in principle simple and involves measuring the (1) mass and heat transport, (2) pressure, and (3) energy content (temperature in most situations). This is complicated in practise, however (Axelsson and Gunnlaugsson, 2000). Measurements must be made at high-temperatures and pressures and reservoir access for measurements is generally limited to a few wells, and the relevant parameters can’t be measured directly throughout the remaining reservoir volume. The parameters that need to be monitored to quantify a reservoirs response to production may, of course, differ somewhat, as well as methods and monitoring frequency, from one geothermal system to another (Axelsson and Gunnlaugsson, 2000). Monitoring may also be either direct or indirect, depending on the observation technique adopted. Below is a list of directly observable basic aspects that should be included in conventional geothermal monitoring programs, most of which can be viewed as reservoir physics parameters:
(1) Mass discharge histories of production wells (pumping for low-temperature wells). (2) Temperature or enthalpy (if two-phase) of fluid produced. (3) Water level or wellhead pressure (reflecting reservoir pressure) of production wells. (4) Chemical content of water (and steam) produced. (5) Injection rate histories of injection wells. (6) Temperature of injected water. (7) Wellhead pressure (water level) for injection wells. (8) Reservoir pressure (water level) in observation wells. (9) Reservoir temperature through temperature logs in observation wells. (10) Well status through diameter monitoring (caliper logs), injectivity tests and other methods.
Monitoring programs have to be specifically designed for each geothermal reservoir, because of their individual characteristics and the distinct differences inherent in the metering methodology adopted. Monitoring programs may also have to be revised as time progresses, and more experience is gained, e.g. monitoring frequency of different parameters. The practical limits to manual monitoring frequency are increasingly being offset by computerised monitoring, which actually presents no upper limit to monitoring frequency, except for that set by the available memory-space in the computer system used. Data transmission through phone networks is also increasingly being used. Figures 12–14 show examples of different kinds of direct monitoring data. Indirect monitoring involves monitoring the changes occurring at depth in geothermal systems through various surface observations, i.e. geophysical surveying. This will not be discussed in any detail here, but more information can be found in Axelsson (2008) and Axelsson and Gunnlaugsson (2000). The indirect monitoring method having the greatest applicability at present seems to be combined surface elevation and gravity monitoring. Through repetitions of such surveying the mass balance of geothermal systems being utilized can be evaluated, i.e. the relevance of natural recharge and effect of reinjection. Micro-seismic monitoring can also be of great value in advancing the understanding of geothermal systems.

Axelsson and Steingrímsson 16 Logging, testing and monitoring
FIGURE 12: Production and water-level history of the Laugaland low-temperature geothermal system south of Akureyri in N-Iceland from 1976 to 2007 (Axelsson et al., 2011), presented as an example of long-term monitoring data from a low-temperature field. The broken line indicates estimated water-
level. Wells LJ-5, LJ-8 and LN-12 are inside the field while well GG-1 is 2 km from the fields centre.
FIGURE 13: The production and pressure response history of the Palinpinion-1 geothermal field in the Philippines (Aqui et al.,2005), presented as an example of long-term monitoring data from a high-
temperature field It should be mentioned that such monitoring data are essential for calibration of models of geothermal systems used to assess their production capacity and for long-term management purposes. A discussion of this is beyond the purpose of this paper, but the reader is referred to the writings of Grant and Bixley (2011), Pruess (2002) and Axelsson et al. (2005).

Logging, testing and monitoring 17 Axelsson and Steingrímsson
FIGURE 14: Enthalpy monitoring data from two sub-fields of the Krafla geothermal field in N-Iceland of quite contrasting behaviour (Mortensen et al., 2009). The top part of the figure shows indications of increased boiling due to limited recharge while the bottom part shows the opposite
behaviour. 5. CONCLUSIONS AND RECOMMENDATIONS This paper reviews the main reservoir physics (reservoir engineering) research conducted through geo-thermal wells, in particular logging, well-testing and monitoring. It emphasises temperature and pres-sure logging during drilling, completion, warm-up and discharge testing as essential in estimating accu-rately reservoir physical conditions as well as for appraising well feed-zones. Down-hole pressure tran-sient monitoring during step-rate well-testing, discharge testing and pressure recovery is, furthermore, indispensable for the evaluation of critical reservoir properties such as permeability and storativity, through pressure transient analysis. In addition the paper emphasises the crucial role of physical monitoring of the energy output (mass discharge and enthalpy) and the reservoir response (pressure and temperature changes) during long-term (years – decades) utilization. These reservoir physics and monitoring data are essential for calibration of models of geothermal systems used to assess their production capacity and for long-term management purposes.

Axelsson and Steingrímsson 18 Logging, testing and monitoring
Injectivity indices of geothermal wells estimated on the basis of step-rate well-test data and productivity indices estimated from down-hole pressure data collected during discharge testing provide important first stage estimates of well productivity. It should be kept in mind that these parameters, which are assumed constant, are only approximate as well productivity is usually a slowly varying function of time. In addition injectivity indices, which are usually the first estimates of the capacity of wells, available at the end of drilling, are not accurate estimates of the productivity indices for the corresponding wells. Comparison of the two parameters for numerous geothermal wells worldwide indicates that the productivity index of a well may be expected to be lower than its injectivity index, even as low as one-third. Yet there are cases where the productivity index is considerably greater than the injectivity index, especially for highly productive wells. The exception is liquid-phase, low-temperature wells where a one-to-one relationship usually exists between injectivity and productivity.
ACKNOWLEDGEMENTS The authors would like to acknowledge numerous colleagues in Iceland and other parts of the world who have contributed to the development of the reservoir physics methods discussed, during the last 2 – 3 decades. They are too many to name, but we’d in particular like to mention the late Valgardur Stefánsson.
REFERENCES Aqui, A.R., Aragones, J.S., and Amistoso, A.E., 2005: Optimization of Palinpinon-1 production field based on exergy analysis – The Southern Negros geothermal field, Philippines. Proceedings World Geothermal Congress 2005, Antalya, Turkey, 7 pp. Axelsson, G., 2012: Role and management of geothermal reinjection. Proceedings of the “Short Course on Geothermal Development and Geothermal Wells”, organized by UNU-GTP and LaGeo, Santa Tecla, El Salvador, 21 pp. Axelsson, G., 2011: Using long case histories to study hydrothermal renewability and sustainable utilization. Geothermal Resources Council Transactions, 35, 1393-1400. Axelsson, G., 2008: Management of geothermal resources. Proceedings of the “Workshop for Decision Makers on the Direct Heating Use of Geothermal Resources in Asia”, organized by UNU-GTP, TBLRREM and TBGMED, Tianjin, China, 15 pp. Axelsson, G., and Franzson, H., 2012: Geothermal drilling targets and well siting. Proceedings of the “Short Course on Geothermal Development and Geothermal Wells”, organized by UNU-GTP and LaGeo, Santa Tecla, El Salvador, 16 pp. Axelsson, G., and Thórhallsson, S., 2009: Review of well stimulation operations in Iceland. Geothermal Resources Council Transactions, 33, 11 pp. Axelsson, G., and Gunnlaugsson, E. (convenors), 2000: Long-term monitoring of high- and low-enthalpy fields under exploitation. International Geothermal Association, World Geothermal Congress 2000 Short Course, Kokonoe, Kyushu District, Japan, 226 pp. Axelsson, G., Gunnlaugsson, E., Jónasson, Th., and Ólafsson, M., 2010: Low-temperature geothermal utilization in Iceland – Decades of experience. Geothermics, 39, 329-338.

Logging, testing and monitoring 19 Axelsson and Steingrímsson
Axelsson G., Björnsson, G., and Quijano, J., 2005: Reliability of lumped parameter modelling of pressure changes in geothermal reservoirs. Proceedings World Geothermal Congress 2005, Antalya, Turkey, 8 pp. Björnsson, G., and Bödvarsson, G.S., 1987: A multi-feedzone wellbore simulator. Geothermal Resources Council Transactions, 11, 503–507. Bödvarsson, G.S., and Witherspoon, P., 1989: Geothermal reservoir engineering. Part I. Geothermal Science and Technology, 2, 1-68. Bödvarsson, G.S., Benson, S.M., Sigurdsson, Ó., Stefánsson, V., and Elíasson, E.T., 1984: The Krafla geothermal field – 1. Analysis of well test data. Water Resour. Res., 20, 1515-1530. Grant, M.A., and Bixley, P.F., 2011: Geothermal reservoir engineering – Second edition. Academic Press, Burlington, USA, 359 pp. Grant, M.A., Donaldson, I.G., and Bixley, P.F., 1982: Geothermal Reservoir Engineering. Academic Press, New York, 369 pp. Hirtz, P.N., Kunzman, R.J., Broaddus, M.L., and Barbitta, J.A., 2001: Developments in tracer flow testing for geothermal production engineering. Geothermics, 30, 727-745. James, R., 1970: Factors controlling borehole performance. Geothermics, 2, 1502-1515. Massiot, C., Ásmundsson, R., and Pezard, P.A., 2010: Achievements and ongoing progress of the European HiTI Project: High temperature instruments for supercritical geothermal reservoir characterization and exploitation. Proceedings World Geothermal Congress 2010, Bali, Indonesia, 6 pp. Mortensen, A.K., Gudmundsson, Á., Steingrímsson, B., Sigmundsson, F., Axelsson, G., Ármannsson, H., Björnsson, H., Ágústsson, K., Saemundsson, K., Ólafsson, M., Karlsdóttir, R., Halldórsdóttir, S., and Hauksson, T., 2009: The Krafla geothermal system. A review of geothermal research and revision of the conceptual model (in Icelandic). Icelandic GeoSurvey, report ÍSOR-2009/057, 208 pp. Mwarania, F.M., 2010: A reservoir assessment of the southeast part of Olkaria Domes geothermal field, Kenya. Report 22 in: Geothermal Training in Iceland 2010. United Nations University Geothermal Training Programme, Iceland, 419-440. Pruess K., 2002. Mathematical modelling of fluid flow and heat transfer in geothermal systems. An introduction in five lectures. United Nations University Geothermal Training Programme, Iceland, 84 pp. Rutagarama, U., 2012: Role of well testing in geothermal resource assessment. MSc thesis, University of Iceland and United Nations University Geothermal Training Programme, Reykjavik, Iceland, in press. Sarmiento, Z.F., 2011: Application of well testing in assessing geothermal resources. Proceedings of the “Short Course on Geothermal Drilling, Resource Development and Power Plants”, organized by UNU-GTP and LaGeo, Santa Tecla, El Salvador, 13 pp. Stefánsson, V., and Steingrímsson, B., 1980: Geothermal Logging I – An introduction to techniques and interpretation. National Energy Authority of Iceland (Orkustofnun), report OS-89917/JHD-09, 117 pp.

Axelsson and Steingrímsson 20 Logging, testing and monitoring
Steingrímsson, B., 2011a: Geothermal well logging: Cement bond and caliper logs. Proceedings of the “Short Course on Geothermal Drilling, Resource Development and Power Plants”, organized by UNU-GTP and LaGeo, Santa Tecla, El Salvador, 9 pp. Steingrímsson, B., 2011b: Geothermal well logging: Geological wireline logs and fracture imaging. Proceedings of the “Short Course on Geothermal Drilling, Resource Development and Power Plants”, organized by UNU-GTP and LaGeo, Santa Tecla, El Salvador, 11 pp. Steingrímsson, B., and Gudmundsson, Á., 2006: Geothermal borehole investigations during and after drilling. Proceedings of the “Workshop for Decision Makers on Geothermal Projects in Central America”, organized by UNU-GTP and LaGeo, San Salvador, El Salvador, 10 pp. Thórhallsson, S., 2012: Cleaning and stimulation of geothermal wells. Proceedings of the “Short Course on Geothermal Development and Geothermal Wells”, organized by UNU-GTP and LaGeo, Santa Tecla, El Salvador, 1 pp.