on digital data acquisitidn and processing in geothermal ... · pdf fileon digital data...
TRANSCRIPT

ON DIGITAL DATA ACQUISITIDN AND PROCESSING
IN GEOTHERMAL WELL LOGGING
Noland S . Maceda * UNU Geothermal Training Programme
National Energy Authority
Grensasvegur 9, 108 Reykjavik
Iceland
• Permanent address:
Philippine National 011 Company
Energy Development Co rporation,
Geothermal Division,
Merrltt Road,
Fort Bonlfacio. Metro Manila,
Philippines
2
ABSTRACT
A study Is made on the application and adaptation of
digl tal computers
well-logging. as
to
a
the
means
conventional analog method of
for da ta acquisition, and
ultimately of processing the same data. The present system
of digital well-logging in Iceland Is presented In which a
custom-bu1lt hardware is adapted into the logging truck for
data collection, and processing is done on a central
computer in the office via a reformatter for system
compatibility. The essential ractors and requirements based
on that system together wl th the necessary hardware are
taken into account since they too are essential to any
system taken into consideration for application. An
experiment Is done with an HP - S5 computer as the central
device in a simulated temperature measurement for data
acquisition, processing and plotting. The mechanics are
explained with reference to the hardware, software, speed
limitations, and memory capacity. The procedure for other
measurements is also discussed. The alternative use of an
HP-a? desktop computer and integrated data
units is also presented.
acquisition

3
TABLE OF CONTENTS
Page
ABSTRACT ...•....•..•.•........•......•..•..........•....••. 2
INTRODUCTION
1.1Scopeofwork ••.....•.••.............•............... 8
1.2Welllogglng .......... ... ............................ 9
1. 3 Logging equipment: Analog system..................... 10
1.~ Digital data acquisition, registration, and
processing system .................................... 13
2 PRESENT SYSTEM OF DATA COLLECTION AND PROCESSING IN ICELAND
2.1 Operation ............................. . ............. .
2.2 Resolution ................. , ......... , ... , .......... .
2.3 Data processing ..................................... .
2.4 Drawbacks and future plans
3 REQUIREMENTS FOR \.
3.1 IntroductIon
A DATA LOGGER
15
1 8
20
23
25
3.2 Types of measurement ................................. 25
3.3 Calibration of the results ...... .......... ........... 26
3.4 Log resolution 27
3.4.1 Measurement resolution ..... .................... 21
3.4.2 Depth resolution............................... 30
3.5 E-log amplifier...................................... 31
3.6 Ratemeter and time constants ......•......... ... ...... 31
4 NECESSARY CONTROL UNITS AND SIGNAL INTERFACES
4.1 Depth control
4.1 .1 Depth encoder
34
34
4.1.2 Depth counter .................................. 31
l.i.2 E-log amplifier.... .. ................................ 110
4.3 Ratemeter ............................................ 42
5 THE HP - 85 AS A DATA LOGGER
5.1 Introduction
5.2 Input/Output interface .............................. .
45
45
4
5.3 Interface standards and function of the int erface .... 45
5.3.1 Mechanical and electrical compatibility........ 46
5.3.2 Data compatibility. ............ .... .... .. ...... 46
5.3.3 Timing compatIbIlIty........................... 48
5.3.4 Peripheral device addressing. .................. 48
5.4 The HP - IS (IEEE - 488 - 1978) interface standard •.•.....• 50
5.4.1 General system description ... ..... . ... ......... 50
5.4.2 Basic system operatIon .................. ....... 53
5.5 HP-85 and peripherals for simulated data collection
and registration .................................... .
5.5.1 HP - 8S desktop computer ........................ .
5.5.2 110 ROM and 82931 A HP-IB interface ............ .
5.5.3 HP 82901M flexible disc drive unit
5.5.lj HP 5316A universal counter ................... . .
5.6 Software ......... . .................................. .
5.1 Results ............................................. .
5.8 Time analysis ....................................... .
5.9 Other measurements .................................. .
54
54
54
56
56
57
57
57
65
5.9.1 Caliper measurements ... ... ............. ........ 65
5.9.2 Nuclear logs................................ ... 68
5.9.3 E- log, Sonic log, etc. ......................... 70
5.10 Data processing ......... . ....... ... ................. 70
6 USE OF HP-87 COMPUTER AND INTEGRATED DATA ACQUISITION UNITS
6.1 Introduction ............ ........... .. ....... ......... 11
6.2 Model HP-B1 desktop computer ......................... 11
6.3 Data acquisition units ... ........... ...... ........ ... 12
7 CONCLUSIONS ...........•....•..•.......................... 74
ACKNOWLEDGMENTS •....•..•.••.........•......•...........•... 77
REFERENCES ....•............•.....•...........•..••......... 78
LIST OF FIGURES
F! g. 1 Block diagram of a conventional well-logging
equipment (from Keys and MacCary. , 971) ••••••••.•••
Fig. 2 Dresser Atlas\ standard computerized loggIng system
5
1 1
"D" hardware configuration •.... .... •. . ... ...•..•... 14
Fig. 3 Block diagram of the digital data collection system
In Iceland ..•.•....•..•.•....•.••.•.••.•.........•. , 7
Fig. 4 A 12 - blt analog to digital conve rter •• • .••... . ... .. 19
Fig. 5 Flow dIagram for a simple digital data processing
in Iceland ...................•.......•.••.•..•.•... 21
Fig. 6 A neutron-neutron log recorded in dIgital and analog
form .•. ••••••••••••••••..••.•.• .......•..•.. • .•.... 22
Fi g. 7 Block diagram of the digital well-loggIng sys t em
under construction in Iceland ...••..•.... ....• •. •.. 2~
Fig. 8 Conversion of physical temperature into digital
signal............................................. 29
Fig. 9 An equivalent RC circuit which determines the time
constant parameter in a ratemeter ............ ...... 33
Fig. 10 The output response of an RC c ircuit. ......... . .... 33
Fig. 11 A diagram of an opto-coupled depth encoder and
counter ............... •. ••. •.••.•... ............... 35
Fig. 12 A typical opto-emitter and detector on a single
package •..•....••...........•..•..•.••........•.••. 35
Fig. 13 Decoder logic circuit for up/down counting. ........ 36

6
Fig. 14 Relative positioning of two opto-detectors for a
90 0 phase difference in their outputs....... .... ... 36
Fig. 15 Pulse timing diagram for up/down countingi
a) count up. b) count down ..••.. ..•.......•••.. .... 38
Fig. 16 An up/down counter with display
capabilIty (from Elektor, 1981)
presetting
Fig. 17 An E-log amplifier using type AD-521 I . C.
39
instrumentation amplifier .. ... ..•. .. •. .. .........•. 41
Fig. 18 a) controls for a conventional ratemeter, and
b) for a necessary ratemeter in dIgital recording 43
Fig. 19 Schematic diagram of the ratemeter used in the
Icelandic digital recording system
Fig. 20 Functional diagram of an interface showing its role
between a conputer and a peripheral device
Fig. 21 The concept of \handshaking\ - the timing mechanism
of computers and peripheral devices for a succesful
transfer of data
Fig. 22 System configuration of the HP-IB otherwise known
44
47
49
as IEEE - 488 bus.... ... ............................. 51
Fig. 23 Equipment set-up for the simulated data collection
for temperature logging............................ 55
Fig. 24 Flow chart for raw data collection and processing
into its corresponding temperature ....•..•..•• 58
Fig. 25 Plotting flow chart for the processed temperature
data ....•..•.••.•..•....•....•. . ....••.••.......... 59
Fig. 26 The actual program used for data collecting and
processing, and for plotting the stored data....... 60

Fig. 27 CRT display on runnning the data collectIon and
processIng program . .. ... ... .. ..... ...•.•..••.....•. 61
Fig. 28 Examples of the plotted temperature data durIng
simulation....................................... .. 62
Fig. 29 An actual call per log calIbratIon showing the un
linearIty In pen deflection with a linearly increas-
ing arm opening. (from Orkustornun well - log fIle) 66
Fig. 30 An ill ustratio n showing the different slopes for
each frequency and diameter range. Note: frequency
values Indicated are not actual values and are used
7
for illustration purposes only. ...•.. .....•..••.•.. 67
Fig. 31 A flow chart for collecting and processing a caliper
log into a linearized stored data .................. 69
Fig . 32 Comparison of memory spaces between HP-85 and
HP - 87XM •••••••••••••••••••••••••••••••••••••••••••• 73
LIST OF TABLES
Logging parameters and the time lapse between
measurement intervals •• .. •.••.. . .•.. .... .. . .....••.•.... 17
2 The HP - IB (IEEE - ~aa) interface bus lines description .... 52
8
INTRODUCTION .
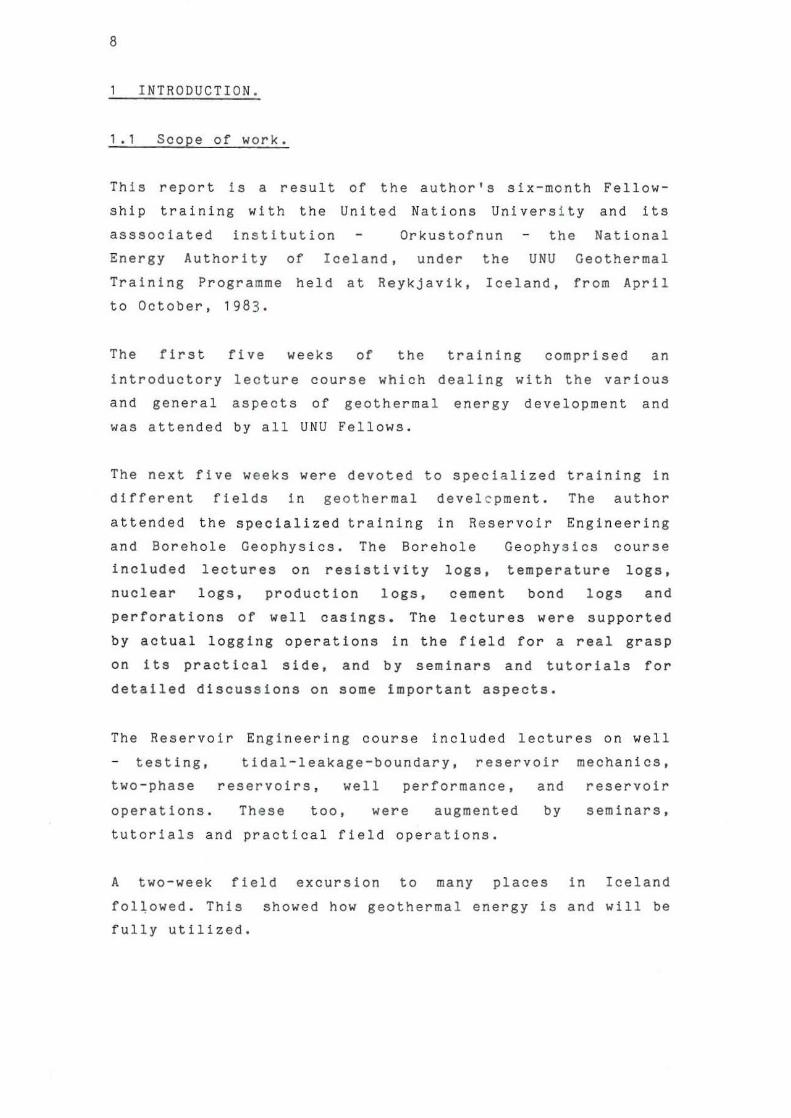
1.1 Scope of work.
This report Is a result of the author's six-month Fellow
ship training with the United Nations Univers i ty and its
asssociated institution Orkustofnun the National
Energy Authority of Iceland. under the UNU Geothermal
Training Programme held at Reykjavik. Iceland, from April
to October, 1983.
The first five weeks of the training comprised an
introductory lecture course which dealing with the various
and general aspects of geothermal energy development and
was attended by all UNU Fellows.
The next five weeks were devoted to specialized training in
different fields 1n geothermal devel c pment. The author
attended the specialized training in Res ervoir Engineering
and Borehole Geophysics. The Borehole Geophysics course
includ ed lectures on resisti vi ty
nuclear logs, production logs.
perforations of well casings. The
logs. temperature logs,
cement bond logs and
lectures were supported
by actual logging operations in the field for a real grasp
on its practical side. and by seminars and tutorials for
detailed discussions on some important aspects.
The ReservOir Engineering course included lectures on well
testing.
two - phase
tida!-leakage-boundary, reservoir mechanics,
rese rvoirs . well performance, and reservoir
operations. These too. were augmented by seminars.
tutorials and practical field operations.
A two-week field excursion to many places in Iceland
fol~owed. This showed how geothermal energy is and will be
fully utilized.

9
Few weeks were used in part by exposure to and "hands-on"
the practical aspects of well-logging, and the remaining
weeks, In working the project which Is described In this
report.
This project dealt with the applicability of computer
technology. particularly microcomputers and
peripherals, as a system for data collecting
processing to well - logging, deriving experienc e
present system used In Iceland.
necessary
and data
from the
The theory behind and the experiment done in this project
particularly with the HP-S5 was conceived by Hordur
Halldorsson of the Orkustofnun Electronics La boratory in
1981 although it has never been applied In practice. This
training will be particularly important for the author, as
he will be involved in computerising geot hermal well
logging data for PNOC in the Philippines in the near
future. At present all well log data in the Philippines is
treated by hand.
1.2 Well logging
In borehole geophysics, a log is defined as record of
sequential data which includes all techniques of lowering
sensing devices in a boreho1e and recording some physical
parameters that may be interpreted in terms of the
characteristics of the rocks, the fluids contained in the
rocks, and the construction of the well (Keys and McCary,
1971).
either
signal
The sequential data are
up or down the well at
is sent to the surface
obtained by moving a probe
a constant speed and the
and recorded. The conven-
tiona1 method of collecting these data is using an analog
system through which the signal is processed and fed to a
chart recorder which plots the data directly on the chart.
1 0
Much technological progress has been made since the first
electric log was run in 1927 In France. Many useful logs
have been developed along with log interpretation, chart
books, equations, and techniques such as cross - plotting,
F overlays, etc. Most are designed to provid e well site
evaluation of the well and the reservoir. The l ogs however,
require proper interpretation by the log analyst and
obtaining a fairly accurate log analysts depends on his
experience, skill, and intuition. As many factors are
involved, the analyst Is therefore prone to making mistakes
and the tedious hand calculations needed are very time
consuming.
It Is said that one of the "pitfalls" In log analysis is
inaccurate log data (Elliot, 1983). A study made by a
major company (Neinast and Knox, 1973) indicated that more
than fifty percent of all well logs are erroneo us.
Developments in microprocessor technology, however, have
led to advances that make it feasible to harness computer
power for data collecting and data processing of well
logs. Therefore the reduction, if not the entire elimina
tion of erroneous logs may be looked forward to.
1.3 Logging equipment: Analos system.
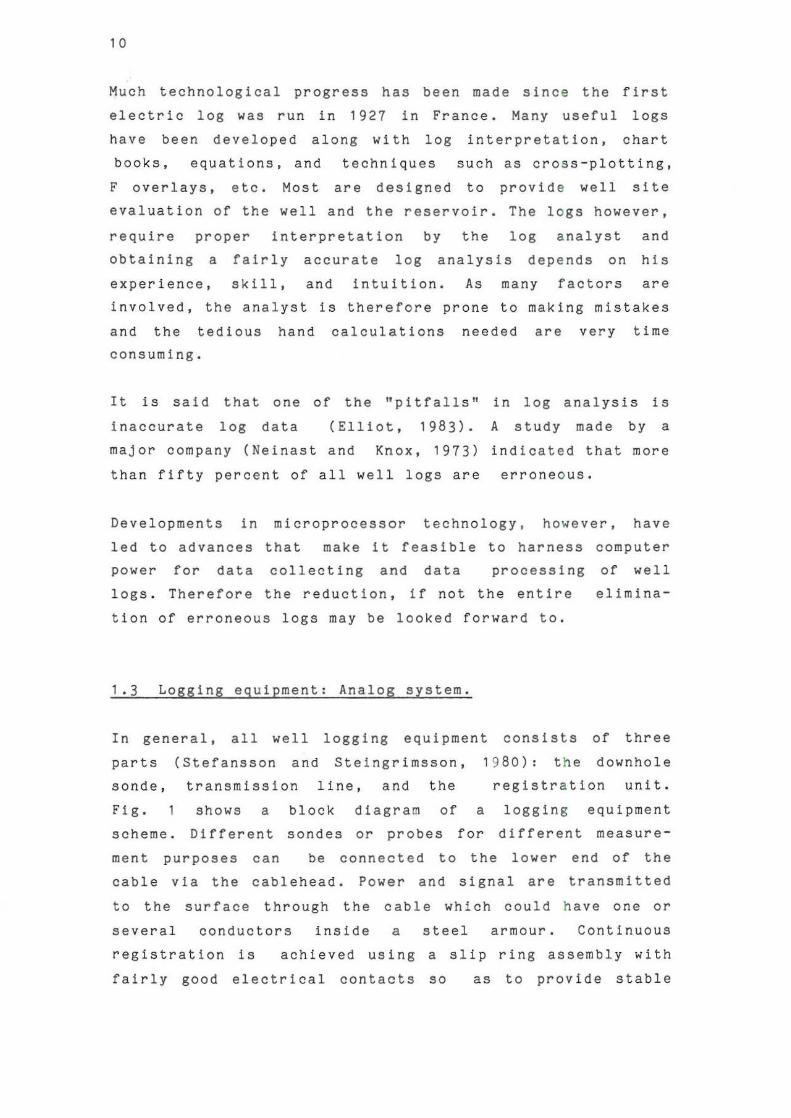
In general, all well logging equipment consists of three
parts (Stefansson and Steingrimsson, 19 80): the downhole
sonde, transmission line, and the registration unit.
Fig. shows a block diagram of a logging eqUipment
scheme. Different sondes or probes for different measure
ment purposes can be co nnected to the lower end of the
cable via the cablehead. Power and signal are transmitted
to the surface through the cable which could ha ve one or
several conductors inside a steel armour. Continuous
registration is ach i eved using a slip ring assembly with
fairly good electrical contacts 50 as to provide stable
~JHO-HS.-9000-NSM L.:L..J 83.09.I052-GSJ
1..0001000
SPEED u.oo O,:.tClI()N
I
' .0 "OWE" SOVIIICE
RECORDER
CONOlTIQ"'NO
ZI"O -oSITIONINO
SE'<$ITrv'TY
n M( CONST .... T
UC.
1 1
---, I I I I I I I I I I I I I I I I I I · I I I L _ _ _ __ _ ..L ___ __ _ ___ _ J
LOGGING CONTROLS
i , , ! ~ 0
~
l ~ 0 • " • ~ • • • Fig.1
0,

12
power for the sonde and feed an undlstorted signal to the
registration unit while the cable drum is rotating and
feeding/retrievIng the line with respect to the sonde.
A cable measuring sheave measures the line outside the
cable drum. A depth indicator Is mechanically connected to
a depth encoder which could be preset to any indicated
value desired. The recorder Is also mechanically coupled to
the depthometer In order to drive the chart In synchronism
with the line being fed. A vertical scale control provides
vertical resolution control of the log by varying the chart
drive speed.
A motor or a hydraulic draworks power the rotation of the
drum wherein the logging speed, as well as the direction
can be controlled.
Different probes require different surface signal
processors and different power requirements. Different
surface modules. however. are easily adapted to the system
by the use of the NIMS (Nuclear Instrument Module System),
an international trade standard using a 19" bin and the
NIMS modules plugged into the bin which itself has an
integrated power supply, and also provides interconnection
between the modules, as well as the logging cable.
Most probes transform
before feeding it into
a signal
the line.
to frequency variations
This is necessary since
the line has considerable length which could cause some
problems in the transmission of the signal to the surface.
By converting the measuring signal to a frequency modulate~
signal. noise, cable resistance and capacitance, and other
factors that could affect the measured parameter are
reduced considerably. At the surface, surface modules
convert frequency signals into DC (direct current) voltages
for the recorder which consequently drive the recorder
pens.

1.4 Digital data aCquisition. registration, an d
processing system.
13
In the previously described logging scheme. the data is In
analog form which is recorded directly on an analog
recorder. With the present technology, however, it is
f ~ aslble and desirable to register the data digitally on
mag netic tapes or any other form of digital data storage ,
in order to have these data access! bIe for computer
manipulation; e.g . correction, before it is plotted in any
desired scale. The registration would involve digitizing
the logging signal at some specified intervals along with
the depth relative to the signal. It Is the ability of a
computer to process huge amounts of data such as these.
that makes this an advantageous system. Such a system
exists in Iceland and is briefly taken up in this report
as a reference example to show the need for a more
efficient system.
A more advantageous system involves immediate processing of
the logging~ data at the wellsite. This requires a
phYSically small computer yet with sufficient capability,
to be mounted on the truck. The computer could process the
data and record or plot it at the wellsite. The computer
ized logging system configuration of Dresser Atlas (1980)
is shown in Fig. 2.

~JHO-HSP-9000-NSM L....t:J 83.09.1053- GSJ
CRT
SIGNAL RECOVERY
LINE CONTROL
I--
SIGNAL SIMULATOR
, TO _OGGING TOOL
YC:) DIGITAL TAPE UNITS
r- OD COMPUTER
DISC DIGITAL PLOTTERS
CONSOLE
Fig. 2 DRESSER ATLAS' STANDARD COMPUTERIZED LOGGING SYSTEM"D" HARDWARE CONFIGURATION
t

15
2 PRESENT SYSTEM OF DATA COLLECTION AND PROCES S ING
IN ICELAND
2.1 Operation
Most of the data in this chapter are from the UNU lecture
of Hordur Halldorsson on data registration, 1983.
Orkustofnun, the National Energy Authority of Iceland, has
built and is employIng a system for digital data collecting
which is run In parallel with the conventional analog
method. The main idea behind the system is to sample or
read measurement signals between fixed distance intervals
and record this on a tape in digital form.
The system was built with a digItal tape
Date l Systems, Inc. model LPS 16 as a base
built to satisfy the following condItions:
recorder from
unit. It was
1) It should be possible to record general information on
the tape, e.g. information on type of log, date, etc. ; the
purpose of which is to put a label on the information
contained in the tape.
2) The system should be able to receive
at any time during the execution of
calibration signals
the log. This is
necessary for the final processing of the data registered.
3) It should be possible to select sampling intervals from
20 to 80 cm to allow flexibility due to different para
meters being measured.
4) The logger should have at least four analog inputs. This
is the largest number of parameters registered by the
present Icelandic system.

1 6
5) It should have sufficient recording rate for different
logging speeds and sampling intervals. Table shows the
time lapse between intervals for maximum logging speeds of
d1fferent logging parameters with sampling intervals of 20
and 40 cm.
6) Depth and data should be visible on a display during
logging to insure proper operation and checking.
Fig. 3 shows the block diagram of the data collection
system which operates In the following principle: The
signal coming from the logging line Is sent either to a
voltage amplifier or an
(1). The ratemeter has
especially constructed ratemeter
the same funct Ion as the conven -
tional one. The signal from the probe which Is In the form
of frequency variations Is transformed into DC voltages
with certain time constants. The main difference is that
this ratemeter has a higher maximum output voltage. i.e.
5 volts for the different full scale frequency setting.
When the downhole probe in use does not send information by
frequency variation but in voltage form. e.g . E-log. an
amplifier (2) is used instead of the ratemeter.
The depth control (3) is also a custom-built part of the
system which has the function of giving signa l s at every
10 cm of depth interval during logging, plus a signal for
telling the direction of the logging. This depth control is
an opto-coupled, i.e. light interrupted Signal which is in
parallel with the mechanical depthometer in the truck.
The keyboard (~) consists of switches for entering label
data on the tape. Also. in order to select the measurement
intervals and the number of channels to be recorded I a
function selector (5) is provided on the panel. A multi
plexer (6) can read up to sixteen channnels of analog
Signal, one at a time and feed the multiplexed Signal to
the analog-to-digital (AID) converter (7). The AID
converter digitizes the analog signal from the input. The
digital signal consists of combinations of logical high and

17
TABLE 1 - Logging parameters and t lme lapse between measurement interval.
LOGGING
PARAMETER
MAX LOGGING SPEED MINIMUM INTERVAL, TIME LAPSE BETWEEN,
(meters/m!n.)
temperature
callper
gamma-gamma
neutron-neutron
and nat. gamma
E-log
sonic
r,T=lJ HD-HStI-9000 . NSM L...CJ 83 .0 9. 10!54. Sy.J.
40
20
15
15
35
15
( cm. ) INTERVAL (ml111sec):
40 600
20 600
40 1600
40 1600
40 680
40 1600
B lock dioorom for digital doto collection system in Iceland
I. 6. 7
RATEMETE MUX 16/1 AID CON y. MODULE
2
L- E-LOG . A MP.
PROBE 8 9 .
•• SIGNAL CONTROL DIGITAL
DEPT H ELECTRONIC TAPE
CO NTROL DIRECTION RECORDER
4 . KEY
10. BOARD
4- DISPLAY
• FUNCTION SELECTOR
Fig.3

1 8
low signals which is recorded on the tape through the
control electronics (8) and can be monito r ed in the
display 1n the form of hexadecimal figures.
The management of the flow of signals ls performed by the
control electronics (8). This controls the interval of
registration of the measurement signal and depth signal
w1 th that coming from the depth control. The measurement
signals are regIstered for every interval selected. while
the depth information ls recorded at every s ixty-fourth
interval and for every change of logging direction. The
control electronics also control the sequence in multl
plexlng multi - input signals, read the digital signal into
the tape, control the measurements of sampling intervals
with the function selector, and send the data to the
display.
2.2 Resolution
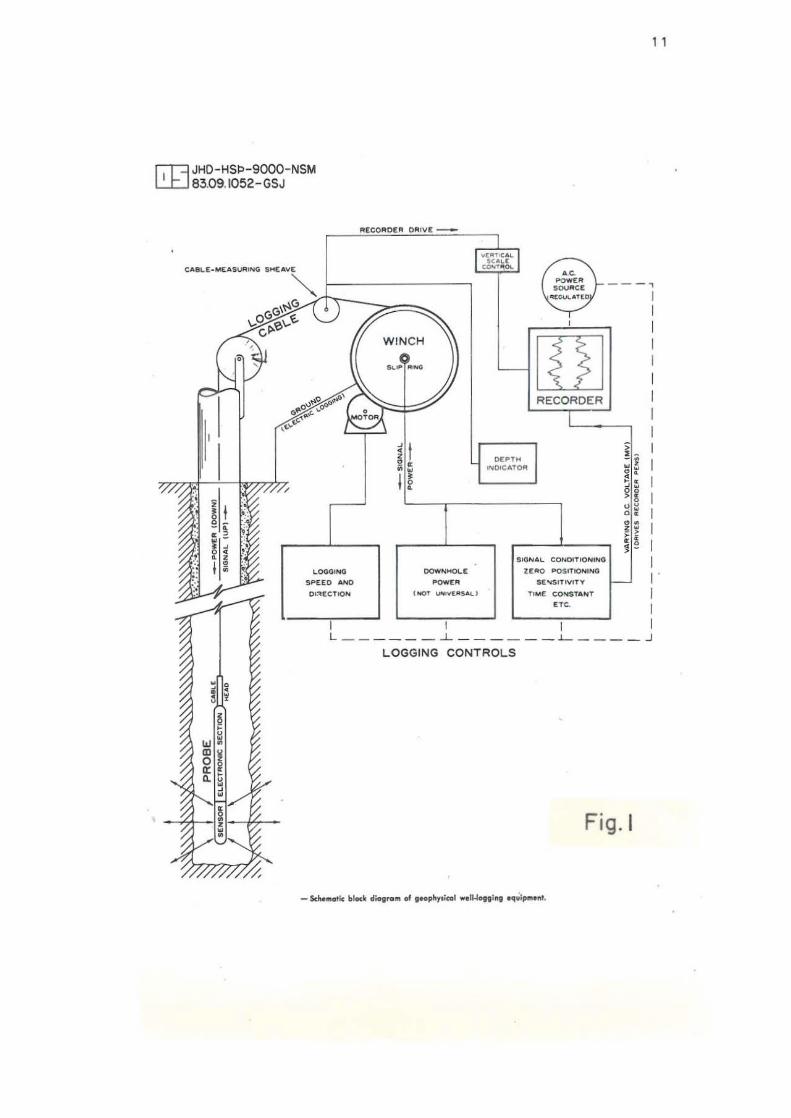
The analog to digital converter used has 12 outputs of
either a logical high (1) or a low (0) signa l. The AID
converter is represented by that in Fig . 4. Each output
(AO to All) could have only one of two condition s: either a
logical '1' or '0'; 1.e . 5 volts or 0 volt.
Each output is called a bit (from the words binary digit),
the whole output being composed of 12 bits. Th is is also
equivalent to three hexadecimal digits. If the output is
taken as a binary counter that count up to twelve digits
in binary. the max i mum count that would be attained. in
base ten would be:
X max • 212 • 4096
Thus there would be 4096 different possible combinations of
O's and 1 's 1n the twelve-bit output. This can be regarded
as the resolution of measurement 1n the whole system. An
1 9
rn JHD'HS~'9000 , NSM . 83.09 . 1056 . Sy ." ,
Schemat ic r ep resentation of 0 12-bit analog digital converter
'" :::: ". INPU T ANALOG .. = ..
TO "
== DIGITAL ..
12 - BIT CON-
.. INPUT .. -o TO!5 VO LTS VERTtR OUTPUT
. " = E AC H OUTPUT 10 OR !5 VOl TS ONLY: .. " = IO GIC"O" OR"I" ,.
Fig.4
20
input of zero to five volts in the analog to digital
converter gives up to ~096 different values in binary which
are recorded on the tape.
The depth counter has a 15-bit resolution plus one direc
tion bit. Data signals for the depth are stored as a 16 bit
word.
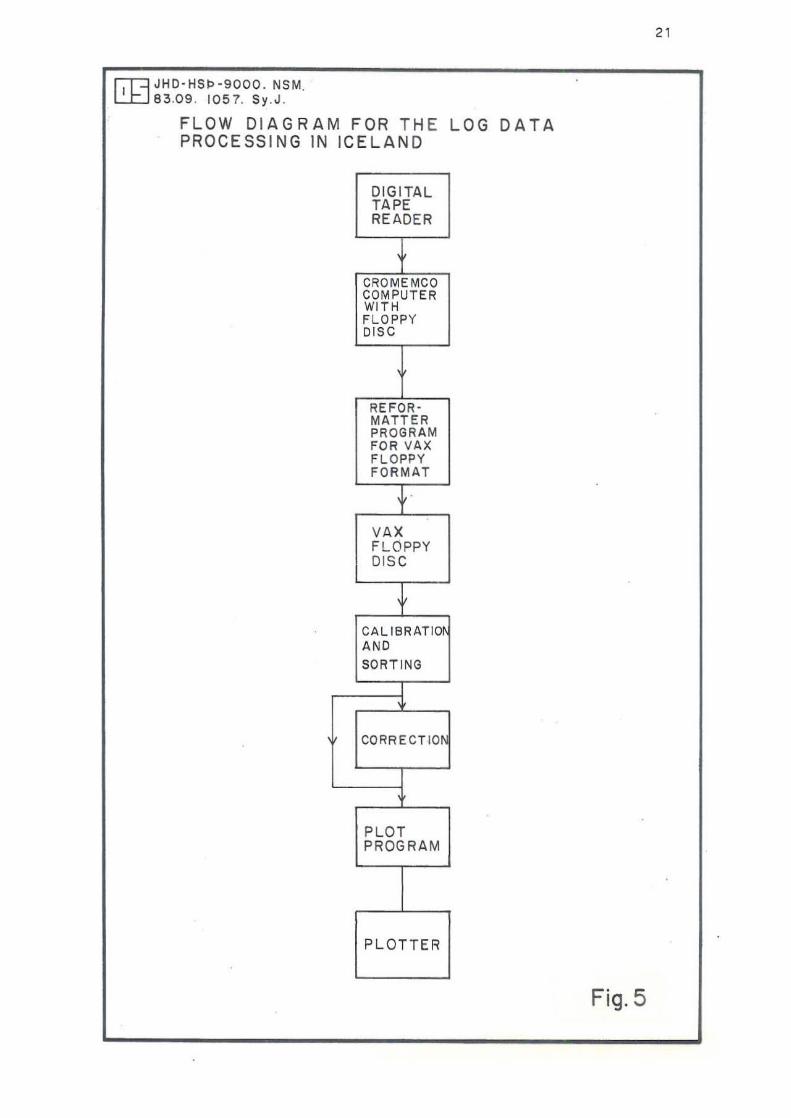
2.3 Data Processing.
The data recorded on the tape is processed at the central
orfIce In Reykjavik. Fig. 5 shows a simple flow diagram
for the processing of the collected data. The data is read
by a digital tape reader similar to the recorder on the
truck. and the data transferred to a floppy disc via a
Cromemco developmental computer, which also reformats,
using a reformatter software. the data into a floppy disc
format used by the VAX central computer. The file in the
VAX floppy disc can now be manipulated at will. It is
calibrated against
recorded at the
some
start
correct the
calibration coefficients that were
of the log. It is furthermore
data with other logging data on possible to
file, e.g. neutron - neutron log correction from caliper log
due to the effect of hole size on neutron - neutron measure
me nts.
The data can . then be plotted using a Tektronix plotter
i nt e rfaced to the computer with the appropria t e plotting
;Jrogr am. The plotted data can now be seen as absolute
values of the parameter being measured. This can be a
very great help to the analyst compared with the usually
tedious job of interpreting data from an uncorrected log
from conventional logging. Also the logs can be presented
on any scale desired.
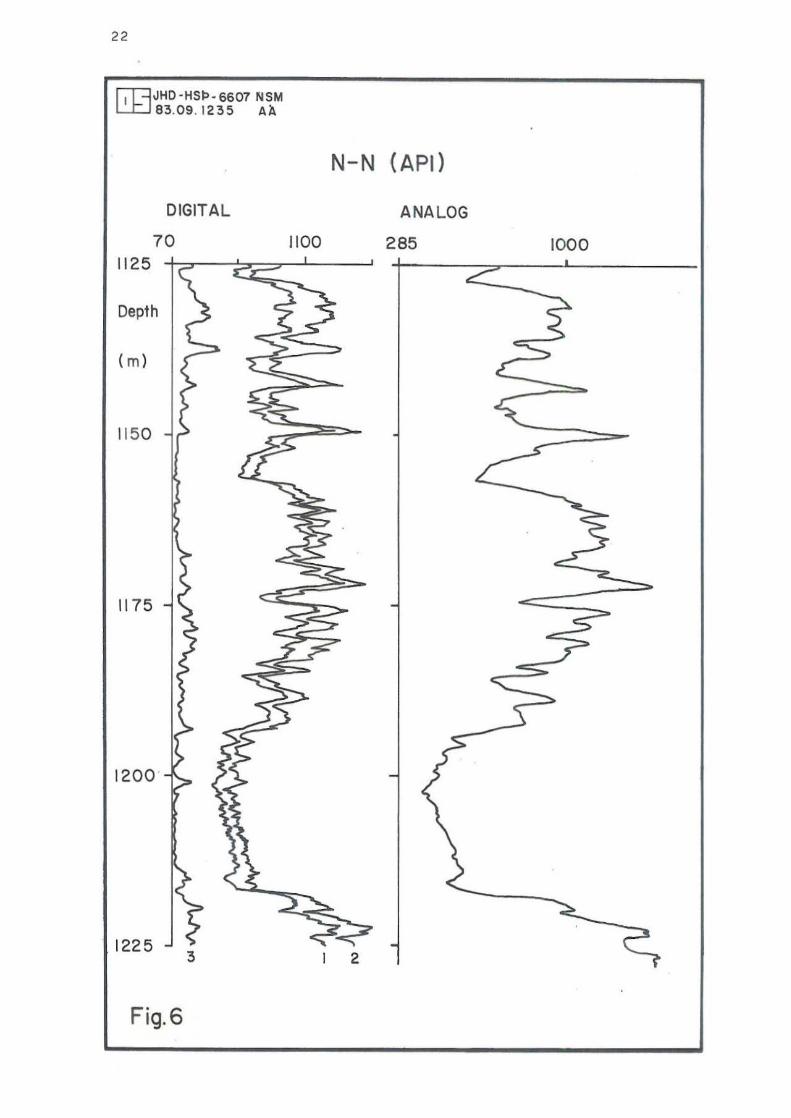
An example of a neutron-neutron log recorded both In
digital and analog form is shown in Fig 6. The analog
curve is taken out directly from the analog recorder on the
truck. The digital log has three curves - labeled 1, 2, and
~ JHD · HS~ ,9000 . NSM L..:.t:.Je3.09 . 1057. Sy.J.
FLOW DIAGRAM FOR THE LOG DATA PROCESS ING IN ICELAND
DIGITAL TAPE READER
CROME MC O COMPUTER WITH FLOPPY DISC
REFOR · MATTER PR OGR AM FOR VAX FL OPP Y FORMAT
t VAX FLOPPY DIS C
CALlBRATIO' AND
SORT ING
.. CDRRECTIO~
PLOT PROGRAM
PLOTTER
21
Fig.5
22
r;-r-=1JHD-HS~-66D7 NSM L:.tJ 83.09. 1235 AA
DIGITAL
70 1125
Depth
( m)
1150
1175
1200
1225 3
Fig.6
1100
N-N (API)
2
ANALOG
285 1000
23
3 In the figure.
digItal plotter
The digital log has been plotted out by a
from the data on the tap e which was
recorded simultaneously with the analog curve. Curve is
just a plot of the raw data from the digit a l tape. It can
be seen that it is very similar to to the curve from the
analog log except that they are not of the same horizontal
scale. Curve 2 shows the corrected neutron-neutron log.
Cor rection is necessary due to the effect of well size on
neutron logging. The curve, labelled 3 In the figure. Is
the correction obtained from call per loggIng data. An
addition of curves 1 and 3 gives the corrected log shown in
curve 2.
2.4 Drawbacks and Future Plans.
Although the system now used in Iceland has been proven to
be very succesful, it has some disadvantages which can be
overcome with the present technology. The drawbacks are: 1)
the data recorded are seen on the display as hexadecimal
numbers which cannot be understood easily so that the
analog system Is always run in parallel with it; 2) the
processing of data Is cumbersome as can be seen from the
length of the process involved; 3) recording of comments
is limited since only hexadecimal numbers can be entered
into it: and ~) the system is not user friendly; e.g. it
would only accept hexadecimal figures and there is no
interactive communicat ion between it and the user.
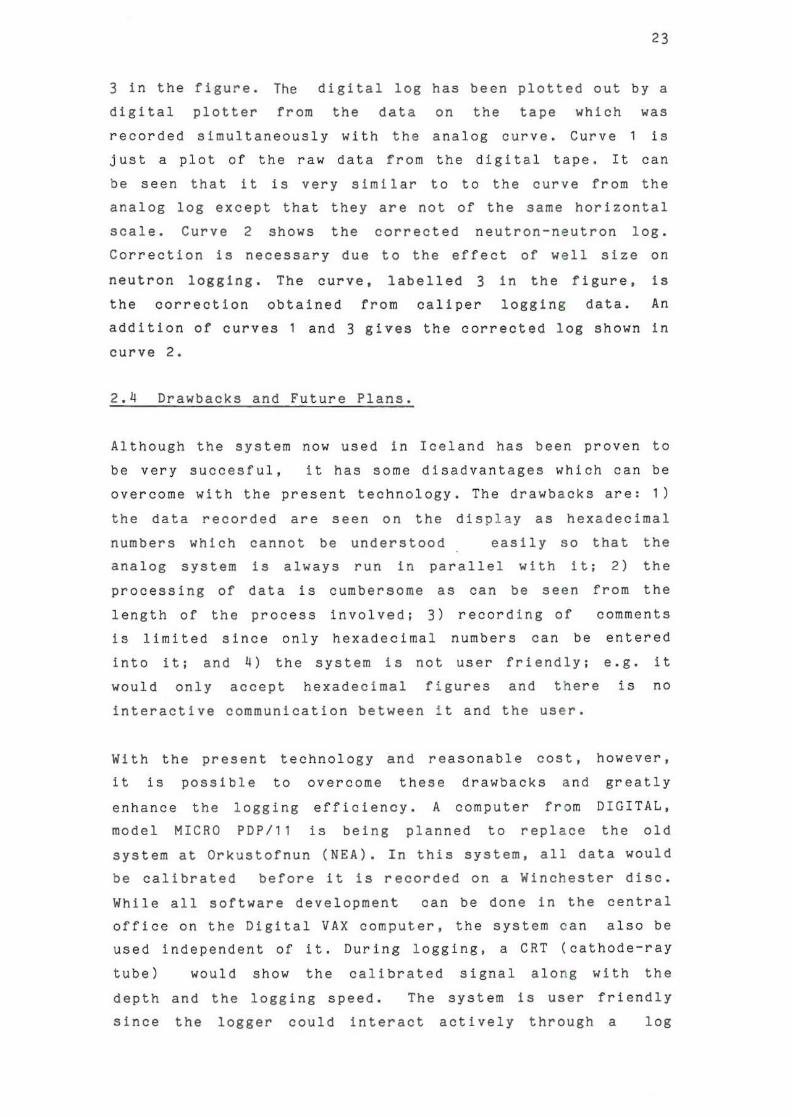
With the present technology and reasonable cost.
it is possible to overcome these drawbacks and
enhance the logging efficiency. A computer from
model MICRO PDP/11 is being planned to replace
however,
greatly
DIGITAL,
the old
system at Orkustofnun (NEA). In this system, all data would
be calibrated before it is recorded on a Winchester disc.
While all software development can be done in the central
office on the Digital VAX computer, the system can also be
used independent of it. During logg ing, a CRT (cathode-ray
tube) would show the calibrated signal along with the
depth and the logging speed. The system is user friendly
since the logger could interact actively through a log
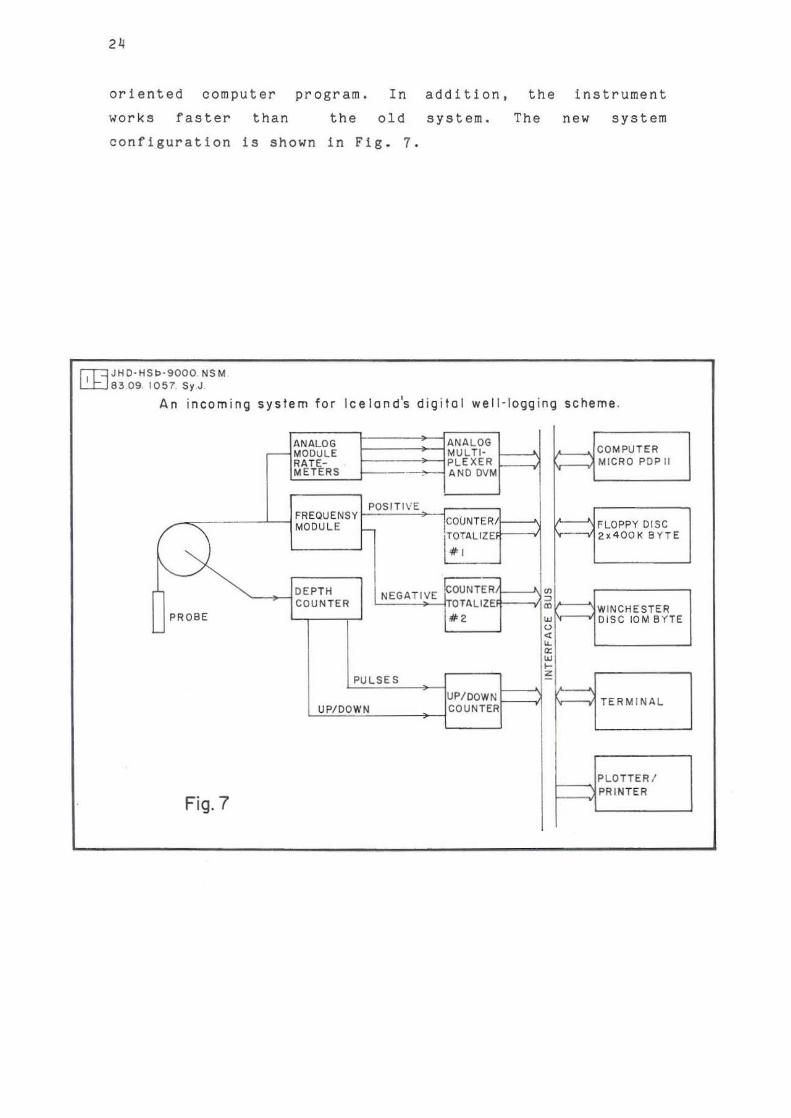
oriented computer program. In addition,
works faster than the old system.
configuration is shown in Fig. 7.
~JHO- HS b-9000. NSM LJ:J8309. 10 57 Sy J
the instrument
The new system
An incoming system for Iceland's digita l well-logging scheme.
ANALOG ANALOG COMPU TER - MODULE MUL Tl-
RATE- PLEXER MICRO POP 11 METERS A ND DVM
POSI T IVE FREQUENSY COUNTER
'\ MODUL E FLOPPY DISC TOTAL.IZE 2x 4 001( aY TE
-0 ", =-DE PTH NEG ATIVE iCOUNTER 00
~ COUN TER OTAUZE m WINCHESTER
PROBE '" ~ DISC IOM BYTE 0 < ~ ~ ~ ~
PU L.S E S ~
UP/DOWN TERM IN AL. UP/DOWN COUN TER
PLO TTER ! PRINTER
Fig. 7
25
3 REQUIREMENTS FOR A DATA LOGGER
3.1 Introduction
The d1g1tal logging equipment presently in effective use In
Iceland as discussed in the previous chapter can lead us
to a select10n and system design of a computer-based data
logging/acquisition unit that would be adaptable to the
conventional analog system.
3.2 Types of measurement
Most of the measurements done In well logging t ranslate the
signal into either one of two forms: voltage va riation, or
frequency variation. In the conventional system, both forms
are converted into analog (I.e. voltage) signal that drives
the recorder pens. In an E- log a constant current is used
to generate a potential difference between the 16" and 6~"
pOints on the probe. and the mud pit. This voltage is then
proportional to the reSistivity. In temperatu r e logging,
the temperature transducer is usually an element whose
resistance varies with temperature. In the downhole tool,
the resistance variation is converted into a frequency
variation via a voltage-controlled oscillator (vco). This
method of transmitting the measurement parameter makes the
signal independent of the resistance and capaCitance of
the logging line, which are not negligible considering the
length of the cable. The processed signal at the surface
is therefore a more accurate representation of the measured
downhole parameter. Caliper logs operate on the same
principle; 1.e. a resistance varies with the variation in
hole diameter which is also translated into frequency
variations. In nuclear logs rad i oactive pulses are counted
by a Geiger - Mueller tube or a scintillation counter if
gamma
neutron
radiation
detection.
is involved. He3
All are fed to
detector is used for
the line as pulses.
Sonic signals are more complex as these involve timing as
well as voltage amplitudes. The first arrival signal
(forerunner), however, is a vailable as an integrated
26
output from the surface processor and could be taken as a
voltage amplitude signal. The same is true for the travel
time of the transmitted and first arrival signal.
3.3 Calibration of the results
The measured data are usually not in the form of absolute
values. A reference value must be established to convert
them into a calibrated log. Calibration of the Gearhart
Owen temperature tool is done In the laboratory and does
not need frequent nor field calIbrations. The calibration
done by a two point method related to the linearity of the
response of the sensor. The relationshIp between tempera-
ture and frequency of the transmitted signal is
be
f • 36 ( T + 17.778 )
found to
where the frequency, f is In Hz. and the temperature T inoC
( from H. Halldorsson, UNU lecture 1983).
Therefore an oscillator frequency setting of 6~0 Hz would
indicate O°C and 5320 Hz would yield 130°C. The frequency
can be measured by a frequency counter. This has been done
and the result will be shown later in this report. With an
interface to the computer, the corresponding temperature
can be calculated and stored.
Calibration of other measurements are usually done in the
field and calibration signals act as correction constants.
For a caliper tool for instance, frequency variations do
not respond linearly throughout the whole range of the
caliper opening. Therefore, two pOints in each range
should be selected, the slope of each line so obtained is
calculated and used
the actual caliper
as a constant in the calculation of
opening. The computer should be fast
enough to detect the range, calculate the result and store
the linearized data.

27
Nuclear logs are usually calibrated in AP I (American
Petroleum Institute) units. Calibration Is usually done
before and after logging. An average value of the calibra
tion signals must be calculated by the computer which Is
used In the final processing of the data .
3.4 Log resolution
A log is typically presented in a graph of measured
parameter
both the
versus
degree
depth. The resolution therefore concerns
of measurement accuracy an d the depth
interval at which the measurements are done. For an analog
system, measurements are normally done continuously with
depth and the depth resolution depends on the speed of the
chart In the recorder. In a digital system, this is not
possible as is explained In the following text.
3 • 4 • 1 Measu r ement resolution
For the system in Iceland. the analog Signal is converted
into a digital signal of 12 - bit byte. The analog Signal is
set
of
to have 212
a variation of 0 - 5 volts. This gives an output
or 4096 bit combinations in digital form. This
means that for every combination. a corresponding voltage
change of
6V • 5
4096
6V • 0.00122 2 V
or 1 . 222 mV should be made to effect a change of one bit in
the output.
Taking a temperature measurement. as an example . the
resolution can be examined in the following: The G.O. probe
transmits its measurement signal to the surface in a

28
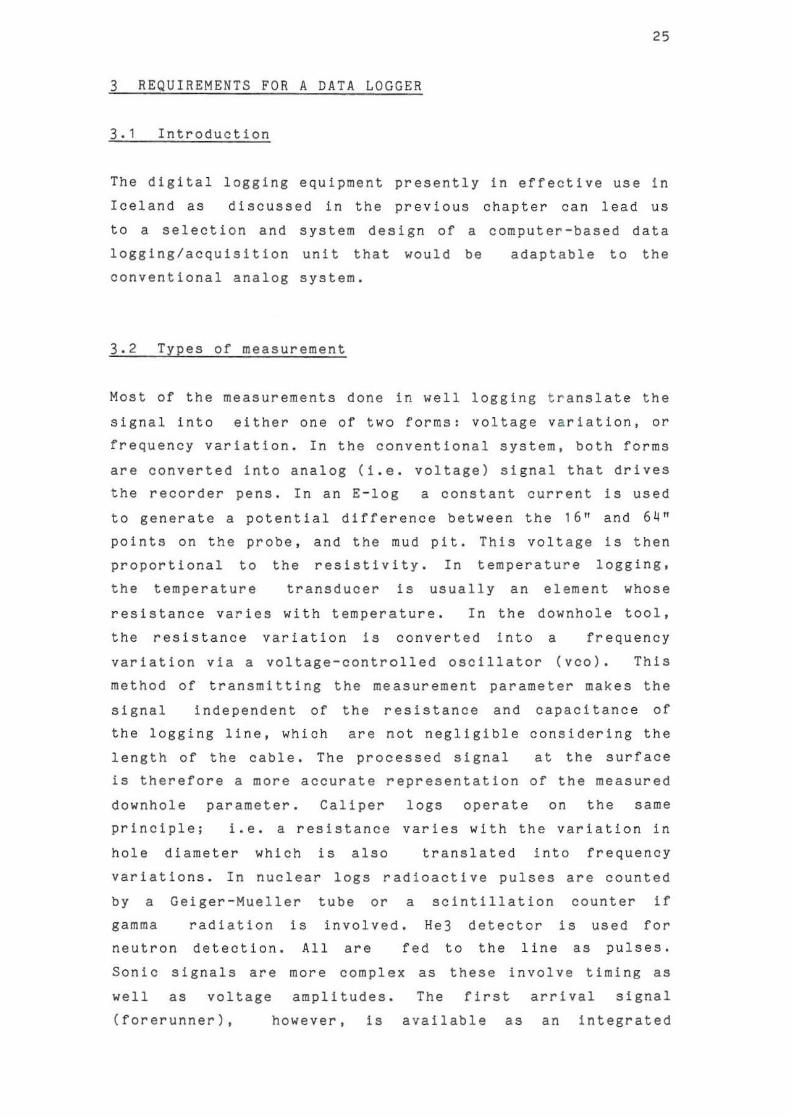
frequency modulated form, and converted at the surface,
with the proper full scale frequency selection, into 0 to 5
volt D.e. signal for the AID converte r . Fig. a shows the
signal conversion flo w diagram.
The relationshIp between the frequency transmitted f r om the
probe and the actual temperature is characteristic of the
probe and Is give n by:
r • 36 T + 640
where f - frequency In Hz
T - tempe r ature in °C
A temperature range of 0 to 130°C, would, from the above
relationship correspond to 640 and 5320 Hz respectively.
The full scale selector of the custom - built ratemeter Is
set to 8000 Hz; 1 . e. 5 volts output for an 8000 Hz input o n
the frequency to voltage converter.
As has been calculated prev i ously, 1.222 mV causes one bit
change. Translating this into t he corresponding frequency
change for a full scale of 8000 Hz;
8000 Hz . 1.222 mV tJ.f - -1.95Hz
5 V
This corresponds to a temperature change of;
AT • ( 640 + 1.95 ) - 640
36 • 0 . 054 'C
Therefore. th e registered digital data has a resolution of
0.054°C of temperature increment. This resolution is
unnecessarily good owing to the fact that the instrument
would be very tedious to calibrate with a better accuracy
than ±0 . 1°C. For a computer - based data logg i ng system,
measurement resolution would depend l a rgely on
peripheral devi c e that would measure the signa l and
the
the
feed
~JHD-HSP-9000-NSM L....LJ 83.09.1181-GSJ
PROBE UNE
RESISTIVITY TO FREQUENCY TEMP.
CONVERTER
640 10 8000 Hz
SURFACE MODULE
FREQUENCY TO VOLTAGE CON .... ERTER
• FULL SCALE SELECTOR AND TIME CONSTANTS
ANALOG TO DIGITAL CONVERTER
o 10 5 Volts O.C.
F
~ 1==
IZ BITS OUTPUT
TO DIGITAL TAPE
RECORDER
FLOW DIAGRAM IN THE CONVERSION OF TEMPERATURE INTO DIGITAL SIGNAL
Fig. 8
'" ~

30
it to the computer . In the temperature simulation done in
this project, an HP universal counter model 53,6A is used
which has a best case resolution of to.00012 Hz at 1 KHz
and an input of V rms for a gate time of second.
Increasing the gate time will decrease the least
significant digit displayed and hence the resolution. This
resolution ls far too great for this purpose a nd gate time
can be increased to achieve fast reading which is important
1n this case.
3.4.2 Depth resolution
A true continuous measurement Is not possible 1n a digital
logging system
continuous log.
although it
Measurements
can be
are
made to
taken at
of depth.
appear as a
some pre-
The smaller a function
the better
determined intervals as
the sampling interval,
depth. Therefore, it ls
is the resolution with
desirable to have as small a
sampling interval as possible. In this regard, the limit of
the data acquisition system is in the speed of the
measurement and its mass storage capacity. Therefore, a
compromise is obtained by optimizing the sampling interval
to approach the usefulness of a continuous log.
A sampling interval of for example 20 cm, i.e. measurement
is read every 20 cm of depth, would yield a total
registered number of 15,000 measurements for a single type
of log in a 3000 - m well. If three logging parameters were
run simultaneously, the total registered info rm ation on
the computer! s mass storage would be 60,000 if the informa
tion on depth is included. For a computer that uses eight
bytes of memory space for a number, e.g. HP-85, 60,000
numbers would use 480,000 bytes or approximately 467K
bytes of data storage space. In actual practice however,
the depth information is not necessarily registered often.
Although the use of several discs would solve the sto rag e
problem, this would create a general operati ng problem;
e.g. logging would be stopped to put a new diSC, etc.

31
Newer type of disc drives particularly the WInchester disc
drives could store up to 12 Megabytes of data and can
easily be employed when desired.
3.5 E - log amplIfIer
In electric logs. the probe Is just a passive device. I.e.
no active electrical components are involved. The signal
translated to the surface Is In analog form and the
amplitude Is very small. This requires the signal to be
multiplied by about twenty times. Moreover, the signal has
its ground reference to the mudpit and not to the logging
truck ground. This necessitates the amplifier to be
isolated from the truck. This can be realized by using
independent batteries In the amplifier.
In electric loggIng, a converter sends the cur r ent to the
probe by continuous reversal; 1.e. alternating current to
eliminate the effect of polarization. The converter also
synchronously receives the signal from the probe . This
process creates a noise which is critical, due to the
small amplitude of the signal. An insulating instrumental
amplifier, which is suited to this purpose, is described in
the next chapter.
3.6 Ratemeter and time constants
A ratemeter is the surface instrument that receives the
frequency translated Signal coming from the downhole probe.
As its name implies, it counts the number of events per
unit time - given 1n counts per second. It 1s used to count
pulses from tools that translate their signal into pulse
frequency form, whether recurrent pulses such as those
from cal1per and temperature tools, or
nuclear tools. The pulses are counted
random pulses from
against a certain
time constant and converted to analog fo r m for the recorder.

32
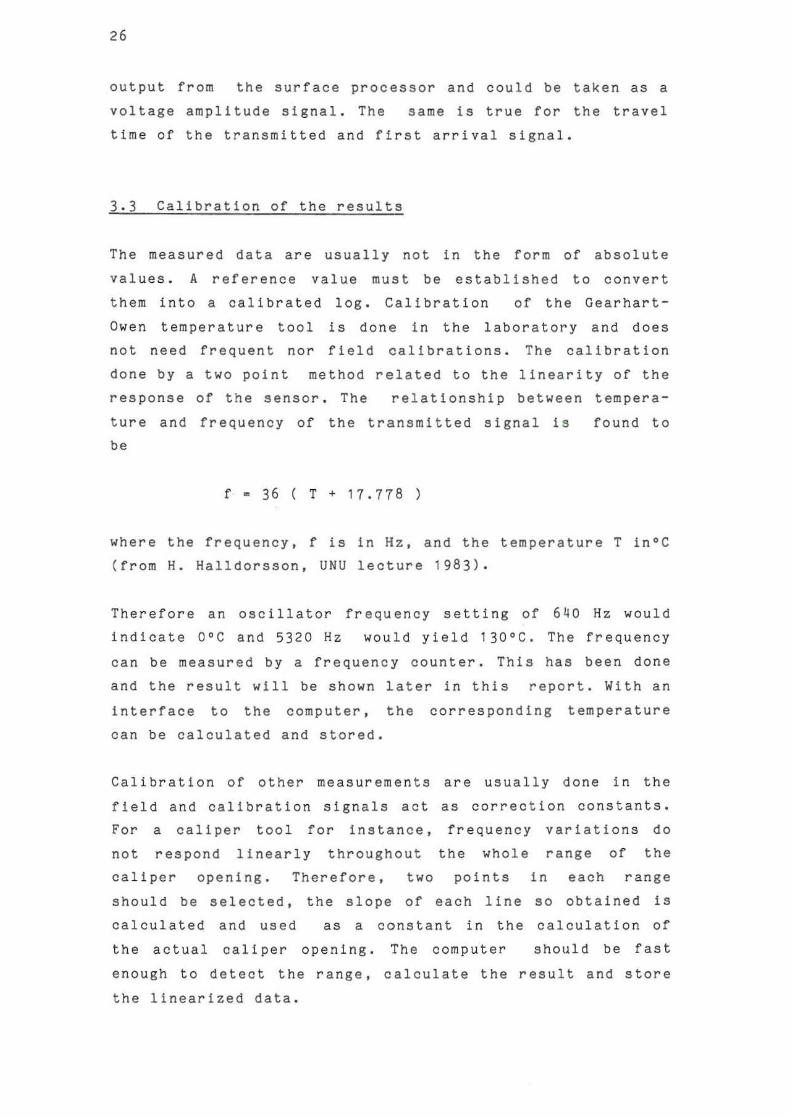
A single time constant Is defined as the output response
time needed to reach 63.2 % of the ultimate input value
provided that the input is a step function, I.e. if the
signal goes from zero up to its maximum value instan
taneously. The time constant parameter can be illustrated
by a simple R- C circuit as shown in Fig. 9.
The voltage output of this circuit Is an exponential
response and Is given by:
t
Vout - Vin ( 1 - e RC)
where t Is the time in seconds, R Is the resistance In
ohms, and C is the capacitance in farads. The product of R
and C gives what Is known as the RC time constant of the
circuit.
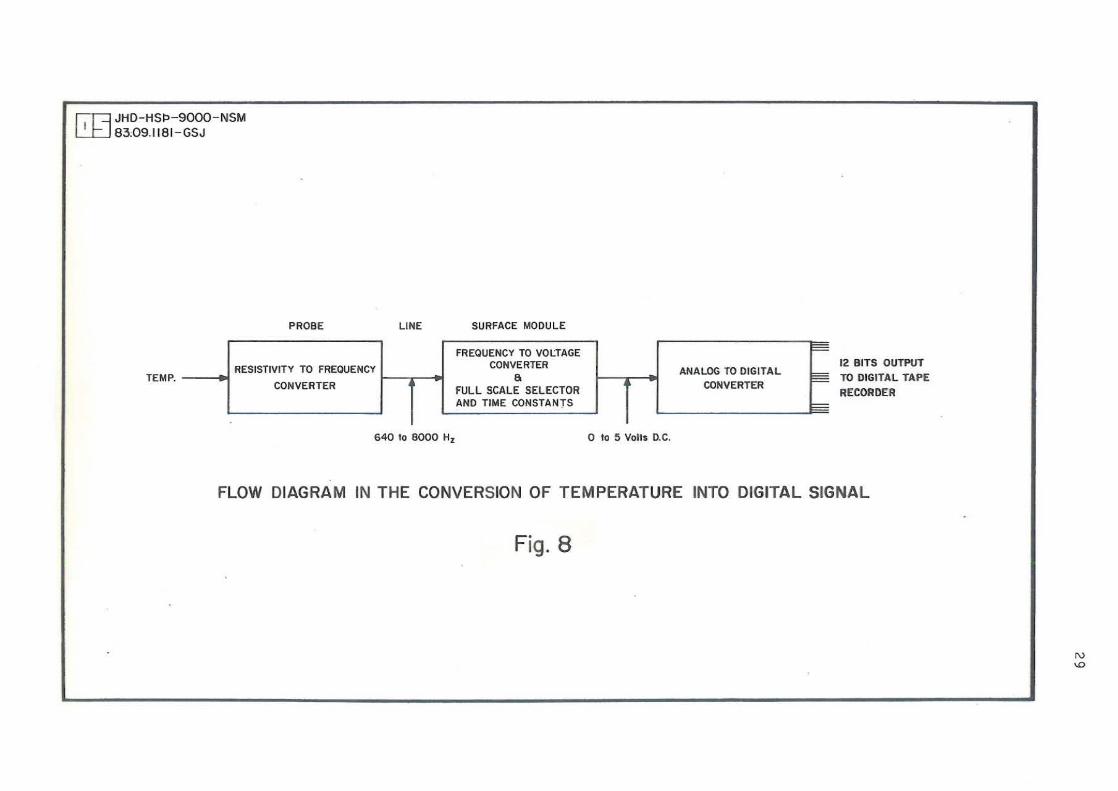
If the time t • R . C, then
Vout - Vin ( 1 - e- 1 ) - 0 .632 Vin
This means that in one RC the voltage output reached 63.2 % of the st ep function input. After f ive time co nstants. i.e.
5RC the output reaches 99. 3 ~ of the total change in the
input. Fig. 10 shows the exponential response curve of the
circuit.
The necessary ratemeter for a digital logging system is
described in the next chapter.
r.r-:::I JHO- HSt:>-9000- NSM L.!...tJ 83.09.1182-GSJ
GIJ JHD-HSI:>-900D-NSM 83.09.1177-GSJ
R
0 WNN , I
Vin
rc
0
A simple R- C circuit
Fig.9
v (V""-'k)
v" /
V B
0.632
ill '" '" '" • ~ '" • ~
~ • N ~ ~ " 1 j r i
0 RC 'RC 3RC .RC 5RC
Exponential response curve
Fig. IQ
33
0
Voul
0
,

34
4 NECESSARY CONTROL UNITS AND SIGNAL INTERFACES
4.1 Depth control
The data in the data logger storage should be depth
correlated. This Is of prime importance or else any data
collected would be meaningless. Therefore, a depth encoder
Is incorporated into the system. It sends pulses for
fixed depth intervals. Moreover. the depth encoder should
be able to tell the logging directIon; i.e. up or down. The
pulses would be counted up or down, depending on the
logging direction, by a cQunter/totallzer. The output of
the counter Is interfaced to the computer as a depth
Signal.
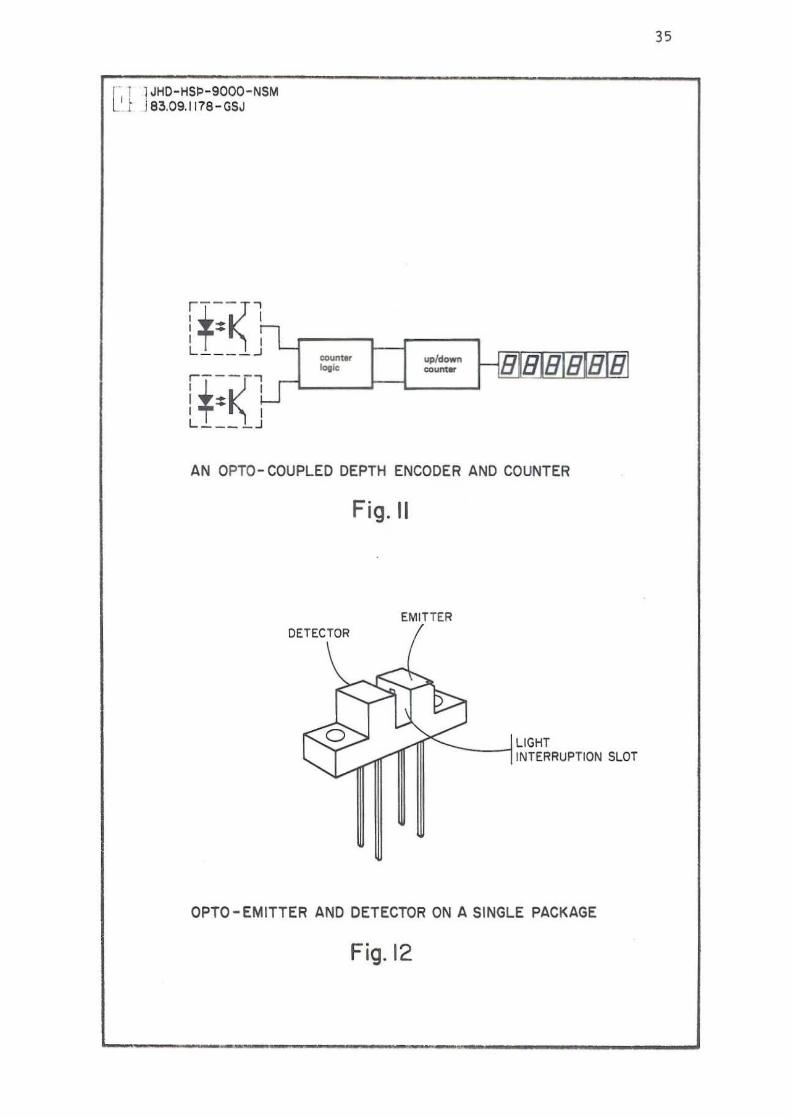
4.1. 1 Depth encoder
An applicable depth encoder and counter are shown
schematl cally in Fig. 11. The major part of the encoder Is
an optoelectronic device. Infrared light is emitted by an
infrared emitter and is detected by a photosensitive
semiconductor. Interruption of the light path between the
infrared emitter and detector causes a signal pulse on the
detecto r. The detector and emitter are usually housed in a
single package with a slot in the light path between the
detector and the emitter as shown in Fig. 12. A code wheel
which passes through the slot i nterrupts the light path.
The code wheel could be of any material but a transparent
film with opaque codes imprinted on it is preferable.
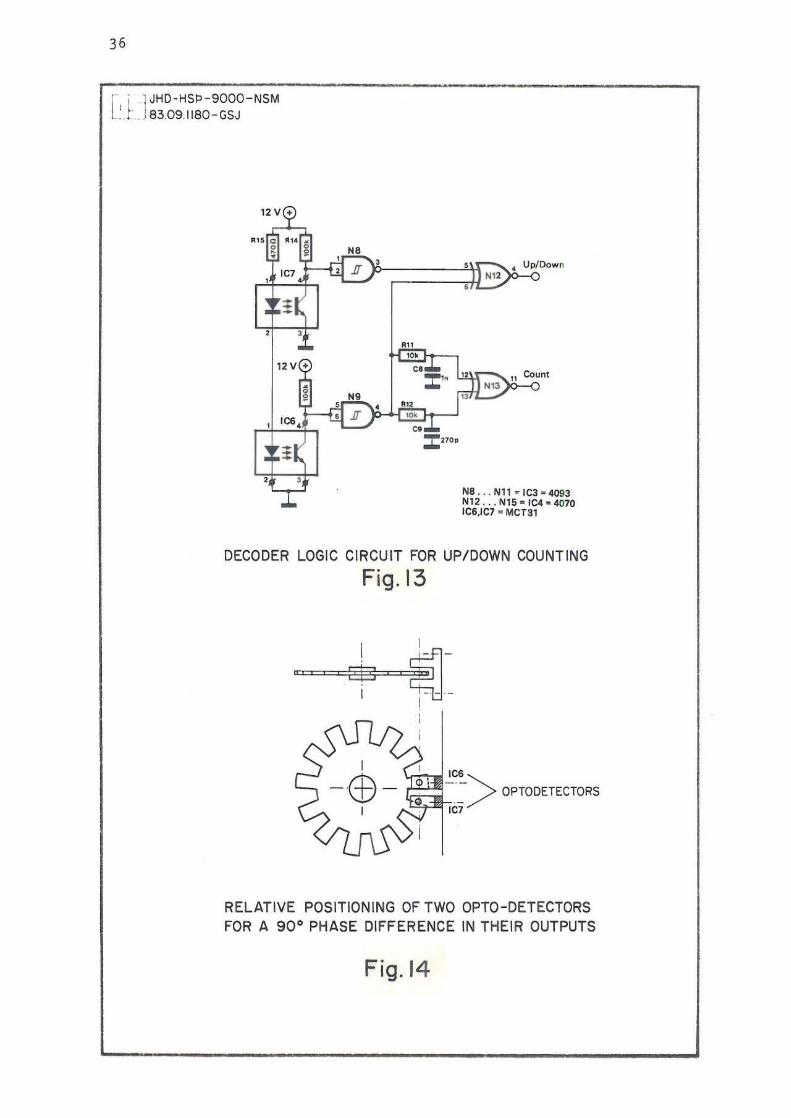
Up/down counting 15 accomplished by us i ng two opto -
detectors. Their detection priorities determine the way of
counti ng; i.e. count up or count down. Information from the
two opto-detectors is decoded by a logic circuit illus
trated in Fig. 13. Its output will be an up/down (logic
high/low) Signal, and the count pulses. The two opto -
devices are mounted with respect to each other,
output from them (buffered by NB and N9)
so that the
shall be
90 -electrical degrees out of phase with each other. This is
l', J 1 JHD-HS~-9DOO-NSM i e~.09.117e-GSJ
~"'" ... up/down ~"'"
AN OPTO- COUPLED DEPTH ENCODER AND COUNTER
DETECTOR
Fig. 11
EMITTER
LIGHT ~--I'NTERRUPT'ON SLOT
OPTO - EMITTER AND DETECTOR ON A SINGLE PACKAGE
Fig. 12
35
36
[ 'J' 1 JHD - HSO-9000-NSM _. 83.09.1180 - GSJ
• Up/Down "12
11 Count
""
NB . .. Nl1 ~ [Cl - 4093 N12 . .. N15 · 1C4 . 4070 IC6,1C7 • MeTal
DECODER LOGIC CIRCUIT FOR UP/DOWN CCUNTING
Fig. 13
b ~l I
'C6 -.-: > QPTODETECTORS IC7
RELATIVE POSITIONING OF TWO OPTO-DETECTORS FOR A 90· PHASE DIFFERENCE IN THEIR OUTPUTS
Fig.14
37
Illustrated in Fig. 111. This means that wh e n one is fully
covered, the other is in dar k-ta-light trans ition. The
pulse flow chart is shown In Fig. 15. with a as count up
and b as count down.
The count pulse Is delayed slightly from the up/down pulse
as can be seen from the timing diagram in Fig. 15-a, by way
of an RC (resistor/capacitor) network. This Is necessary
for the up/down condition to be established before the
count pulse Is counted; 1.e. added or subtra c ted . Fig.
, 5 - b shows the waveform when the code wheel turns in the
opposite direction. The counter pulses do not c o incide with
the positive up/down pulse which is opposite to that in
Fig. 15-a when the wheel turns in the other direction.
The code wheel Is mechanically linked to the logging line
measuring sheave, in the same one which drives the paper
chart of the analog recorder during logging.
1I.1.2 Depth counter
A requirement for a logging counter is a preset facility;
i.e. the possibility of programming any number that would
serve as an initial value for counting. This is very
convenient especially if the probe is already deep in the
well when the power to the counter is turned on or in case
of power breakdown. This could be synchronized with the
mechanical depthometer.
The circuit in Fig. 16 ls suitable for this purpose.
Presetting capability is obtained through the use of diodes
01 to 024, and thumbwheel sw! tches connected to OTl to DT6.
Counting and decoding is done by the IC (Integrated
Circuit) type MK 503989N.

38
[ li JHO-HSP-9000-NSM
'r-- 83.09.1179-GSJ
1~'~ output N8
output N9
outpu1 N12
output N13...;"r-U-',..-"r-.r-, .........
a) COUNT UP
output N8
outpul: Nt
OI.Itpul NU
output N13""',r-,,......,r-,'r-''''-''''-''I"""
b) COUNT DOWN
PULSE TIMING DIAGRAM FOR UP/DOWN COUNTING
Fig. 15

~JHD-HSP-90DO-NSM L'l:J 83.09.1176- GSJ
O··":~;E. 0 • bed. ,
, • • • I • I
~ 7 W\lm~ t docod. ,
6; I mul, ;" I ••
6 d igil lltCh
39
LED display
BBBBBB ,,~. '~,
. . . Nl .. Ne ClO. $ • , , ,
"o<d , " ,
, .. ,
~ " "
o<iJ ~ '-"
• •
1 .. 111 ,
,." .. d;g;t ."obe ~
'T ~
I~ ,...t+' . ..
~, . " .. <:oyn, ... ~ "" l:6en
~
'Cl MK 50398
01 .. . 024 -lN4148 Nl ... N7 - IC2 · ULN 2003
Fig. 16

40
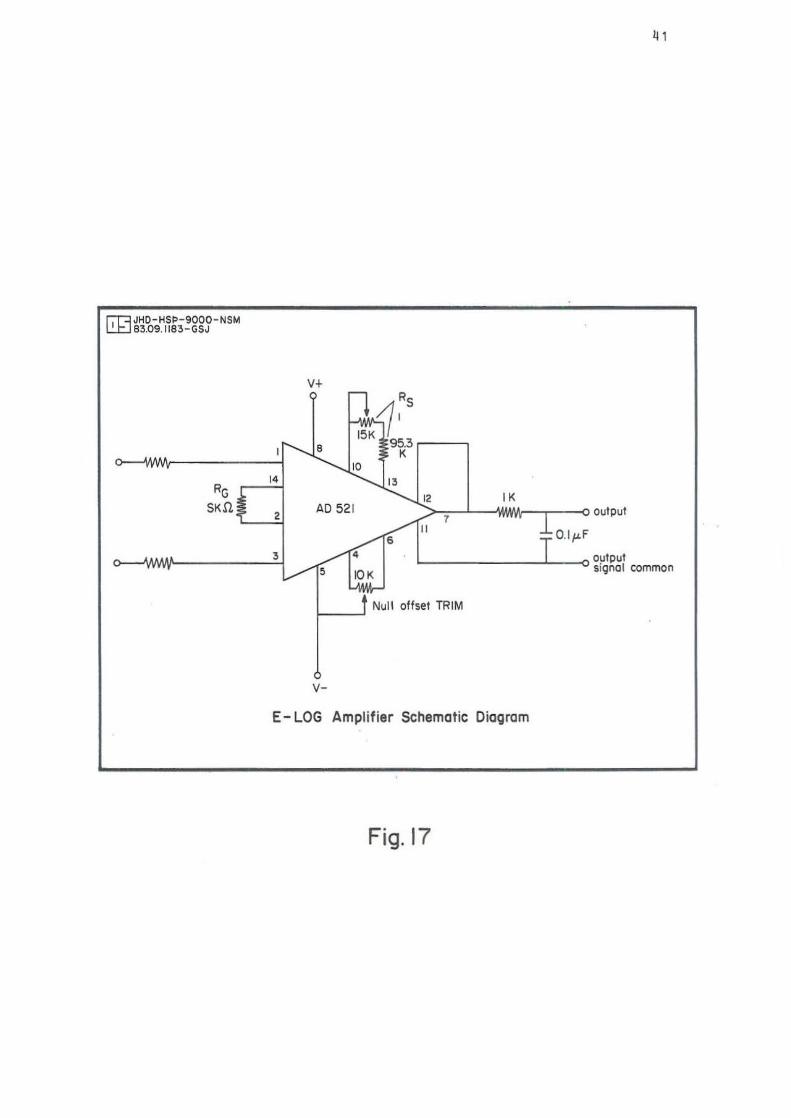
4.2 E-Log amplifier
An E- log amplifier that meets the needs stated is the one
shown in Fig. 17 . Its active device is mainly the AD 521
le (Integrated Circuit) manufactured by Analog Devices Co .
It is an instrumentation ampl i fier with differential
inputs and an accurately
relationship.
programmmable input/output gain
An instrumentation amplifier Is a preciSion differential
gain device optimized for operation 1n a real world
environment, and is intended to be used whenever
acquisition of a useful signal is difficult (Data - Acquisi
tion Databook, 1982).
The complete amp l ifier shown 1n Fig. 1 7 has a voltage gain
of 20, 1.e. output vo l tage Is equal to 20 times the input.
This amplifier is characterized by high input impedance,
balanced differential inputs, low bias currents and high
common-mode rejection ratio (CMMR) . The gain is determined
by resistors Rs and Rg where gain, A is
Rs A •
Rg
Referring to the figure, when Ra is trimmed to have a
value: Rs ~ 100 K ohms and Rg - 5 K ohms the amplification
is
A 100 K
5 K • 20
A resistor of 1 K ohms and a capacitor of 0.1 microfarad in
the output circuit introduces a very small time constant
just to smooth out the output signal. The time constant Te
is !
41
[Q;jJHO-HSP-9000 - NSM 83.09.1183-GSJ
v+ r RS
f-'oilt1 ' 15K 95.3
,'-....8 K
~'O RG
14 "-... 13
'-......12 IK SKU AD 521 > output , 'H
~II 7 :: ~O.l I'F 3 /~. output
/, IOK signal common
Null offset TRIM
v-
E - LOG Amplifier Schematic Dioc;Jrom
Fig. 17
42
TC - R • C
whe r e R I s the resista n ce of t he resistor In ohms, C Is the
c a pacitan ce of the capacitor in farads, and t h e time
constant re Is In seconds.
The time constant of the circuit is therefore
TC = 1x10³ 0110 - 6 • • x 0.1 milliseconds
In the E- log, the mudpit and the ground for the NIM modules
are not the same. This necessitates that the amplIfIer be
isolated and have its own power supply which can be readily
supplied by batteries.
4.3 Ratemeter
The ratemeter n eeded for digital logging I s simila r to the
conventio nal one but with a few exceptions. As with the
conventional ratemeter, it should change the frequency into
some full scale value, time constants must be selectable.
and an input and output for calibration must be provIded.
Di ffe r ent probes have diffe r ent f r equency responses and
ranges so that a frequency range selection is required.
Also. the pulses could either be positive or negative
depending on the tool and should be selectable on the
ratemeter. A suppression and gain control is unnecessary as
their main function is calibrating the record on the paper
chart in the conve ntional system. A ratemeter that
satisfied the above requirements has been built in Iceland
and is presently in use fo r their digital data acquisition
system. Fig. la summarizes the necessary controls for a
ratemeter for both the conventional and digital logging.
The ratemeter designed and built at Orkustofnun (NEA) is
shown in Fi g. 19 and it is suitable fo r any digital data
acquisition system needing a raterneter.

~JHD-HSP-9000-NSM ru 83.0S.I\85-GSJ
POS./NEG. FULL SCALE I---' SELECT SELECT
A. CONVENTIONAL
POS./NEG. FULL SCALE I---' SELECT SELECT
..e. DIGITAL
I---'
I---'
TIME SUPRESSION GAIN CONSTANT --., I---> ----0 RECORDER SELECT CONTROL CONTROL
TIME DIGITAL CONSTANT SELECT RECORDER
COMPARISON OF NECESSARY CONTROLS IN A) CONVENTIONAL B) FOR DIGITAL RATEMETERS
Fig.IS

44
hI I .~ }
1~ 1\'· 0 •
g z
i ~ z ... • 0 ~ >-
~ VI :::>
'" • 0:
~ > f--
ij 0
~ .;~ ~ ~ • 4D~\ ~
~
;:" I~~~ it
~ ~ .. L-
~ , § ; \ 0 ~I<~J ~ I
> . - • • I i ~~ r • > >
r hi • +-~ J ~ .~ :=; - I-~
b~ T ~ : , ~ I ~L§ ~ .J" ~ . . -·
. ~" ~lL ~ '" ql'-i ., .. ~ ...
"'" aw I-- ~,
19 ~ ~ • ..Q ~~. ~l'r a • ~ • .. . (Dd fD/j
" 0 ~YIS)I,t; LI", ::
. , "'"
0
'" 'd ~ .... q7j st\· ~ ~Jj~~
I I ,~ ." ~ I •• ~~ r LJ :~LIU~~ •• .,
• 5 ~
• _. ~- . N , • S - . e < .
N • • • : ~'h t ~ . N
",.", 'fil & , I> , or ;'f;, ~ .... . :il~ '" 0)
6, ~ ;t§:.iif: . -~~~~ ~~ 0>
QeB ~§ .~ !>l, ~ ~~ I.L
3S9::1~~
¥ ~' , ~
45
5 THE HP-85 AS A DATA LOGGER
5.1 Introduction
An HP - 8S has been tried as a base unit f or a data
collecting system , Some peripherals are interfaced to the
computer to make it a complete data logg er. A simulated
temperature log has been performed In the laboratory. The
hardware and the software used In the operation of the
system will be discussed.
5.2 Input/Output interface
The Hewlett-Packard HP-85 In its original f orm, is a
microcomputer which could just accept data from one
peripheral dev ice j I.e. a human being. A peripheral device
is an external device, communicating with the comp uter.
When a human as a peripheral device acts as the source he
uses the keyboard as a means of input of the data into the
computer. The computer acknowledges to the human being the
condition of the input data through the cathode ray tube.
When commun i cat i on wi th other per i pheral dev ices is
deSired, some way other than the keyboard which is only
effective for human beings must be used. An input/output
interface is needed to communicate with the peripheral
devices. The peripheral devices could be a disc drive, a
printer, a voltmeter, a frequency counter, a plotter, etc.
The interface is the hardware link that is needed to allow
eff i c ient communi cat ion of the computer wi th per i pheral
devices.
5.3 Interface standards and function of the interface
Interfacing computers to other devices has been greatly
simplified by the use of interface standards. The hardware
problem of hooking up devices in order to have a communica
tion between them has been simplified. Communication is
46
performed by softwa r e. There are several I/O interface
standards in use in the computer industry. For this
purpose, only the HP - IB , an interface bus d eveloped by
Hewlett - Packard and adopted by the IEEE (Institu t e of
Electrical and Electronics Enginee r s, Inc.) as the IEEE
1188-1978 interface standard w111 be disc ussed. This
standard ls also called the GPIS for General Purpose
I nstrument Bus.
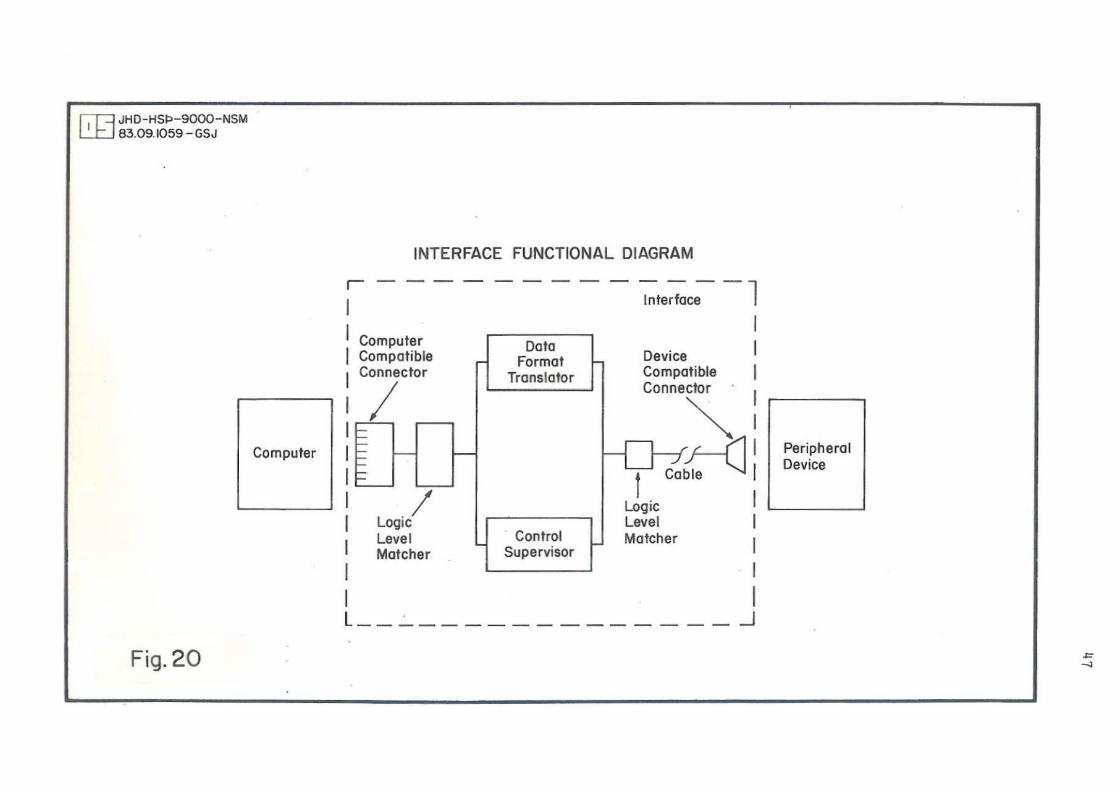
The function of the interface ls to provide compatibility
1n four major areas (HP-8S I/O Programming Guide. 1980b)
1. Mechanical compatibility
2. Electrical compatibilit y
3 . Data compatibility
4. Timing compat i bilIty
Fig. 20 sho ws the interface functional diagram a nd its role
betwee n the computer and the peripheral device .
5.3.1 Mechanical and electrical compat i bility
Mechanical compatibility is achieved through standard plugs
and connecto r s which provide the mechanical link between
the computer and the per i pheral device. Electrical
compatibility mea ns that the interface must change the
vol tage and current levels used by the computer to those
used by the peripheral device. The i nterface causes the
level changes to be the same for both computer and
peripheral d e vice.
5.3 . 2 Data compatibility
Another requirement of the interface is that the data sent
by one device must be understandable to the other. Since
different devices use different forms of codes. a fo r m of
~JHD-HSP-9000-NSM LJ::J 83.09.1059 - GSJ
Fig. 20
Computer
INTERFACE FUNCTIONAL DIAGRAM
r ------------l 1 Interface
1 Computer Data 1 Compatible Format Device 1 Connector Translator Compatible
1/ Connector
~ 1 1 I carl~ 1 I 1 / Logic
1 LogIc Level
I Level Control Matcher Matcher Supervisor
1 I L __ ~ _____ ___ _____ .J
Peripheral Device
~ ..,

48
trans l ation is
the computer
programming.
supplied by the i nterface 1 ts e lf although
can perform this function through
5 . 3.3 Timing compatibility
Computers and peripheral devices have different range of
operating speeds so that an orderly mechanism is required
for the succeSful transfer of data. This timing mechanism
Is referred to as "handshake". Fig. 21 illustrates the
general concept of handshaklng. The process could be
summarized as follows:
1. The receiver signals that it Is ready for a data item,
then waits for a signal from the sender telli ng that the
data Is available.
2. The receiver outputs an item of data and signals the
receiver when the data Is available.
3. When this data-available signal is recognized, the
receiver inputs the data and signals that it is busy with
this input operation.
4. The sender waits until the receiver is ready before it
makes a n ew item of data available. When the receiver is
ready, the process repeats.
5.3.4 Peripheral device addressing
With the possibility of connecting several peripheral
devices to a computer, it is necessary to specify with
which device it should communicate.
peripheral devices occurs one at
Communication with the
a time. Th e selection
process is called addressing. This uses a device selector
code and then this code is addressed in the I/O statements
of the computer program.

~JHD-HS~-9000-NSM ~ B3.09.I058-GSJ
III am ready for dotall
"The data is valid now "
Sender + Receiver Handshake Lines
I\.
Data Lines "-./
CONCEPT OF HANDSHAKING-TIMING MECHANISM OF COMPUTERS AND PERIPHERAL DEVICES
Fig.21
~
'"
50
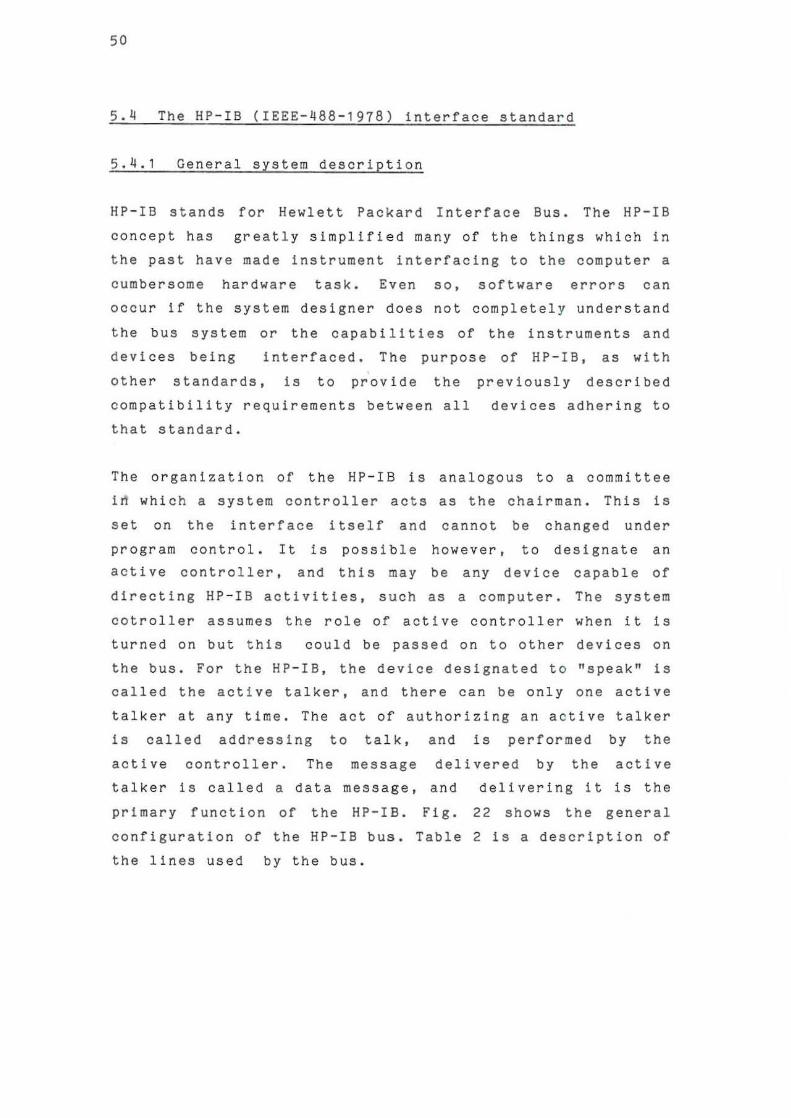
5.4 The HP-IS (IEEE - 488 - 1978) interface standard
5.4.1 General system descrIption
HP - IS stands for Hewlett Packard Interface Bus. The HP-IB
concept has greatly simplified many of the things which in
the past have made instrument interfacing to the computer a
cumbersome hardware task. Even so, software errors can
occur if the system designer does not completely understand
the bus system or the capabilities of the instruments and
devices being interfaced. The purpose of HP - IB, as with
other standards, Is to prov i de the previously described
compatibility requirements between all devices adhering to
that standard.
The organization of the HP - I8 is analogous to a cornm! ttee
id which a system controller acts as the chairman . This is
set on the interface itself and cannot be changed under
program control. It is possible however, to designate an
active controller, and this may be any device capable of
directing HP - IB activities, such as a computer. The system
cotroller assumes the role of active controller when it is
turned on but this could be passed on to other devices on
the bus. For the HP-lB. the device designated t o "speak" is
called the act i ve talker, and there can be only one active
talker at any time. The act of authorizing an a c tive talker
is called addressing to talk, and is performed by the
active controller. The message delivered by the active
talker is called a data message, and
primary function of the HP-lB. Fig.
delivering it is the
22 shows the general
configuration of the HP-IB bus. Table 2 is a description of
the lines used by the bus.
r;T=J JHD-HSIJ-9000- NSM L'.1::J 8 3.09.1056 - GSJ
~
:;= 4-
~ ::::
Doto bus
I V
I 1==
Device A
Able to tolk.l islen
and control (e.o., calculator)
Device B
Able to tolk and
listen (e.g., digital multimeter)
Doto-byte General transfer Interface ~
0 control monogement c ,
0 c
I' '"l
v "\
V l-
Device C Device 0 Only oble Only oble to to listen to" {e.g., signal (e.g_, counter)
generator)
GENERAL CONFIGURATION OF THE HP- IB BUS
DAV NRFO NOAC
IFe ~ Control ATN
~~~ EOI
Fig. 22 '"

52
Table 2 - The HP-IS (IEEE - 488) I n terface Bus Lines Description.
DESIGNATION
DIO, - DI08
ATN
DAV
EOI
HC
NDAC
NRFD
REN
SRQ
THE HP - IS (IEEE - 488) SUS LINES
DESCRIPTION
DATA INPUT/OUTPUT: Eight data trans f er lines; also called the data bus.
ATTENTION: Issued only by the controller, to gain the attention of t h e bus devices before beginning a handshake sequence and to denote address or control information on the data bus.
DATA VALID: Issued by a talker to no t ify the listeners that the data has been placed on the DID lines
END OR IDENTITY: Issued by a talker t o notify the listeners that the data byte current l y on the 010 lines Is the last one. The controller issues is together with ATN t o initiate a para l lel poll sequence.
INTERFACE CLEAR: Issued only by the controller to bring all active bus devices to a known state.
NOT DATA ACCEPTED: Issued by a listener while fetching data from the 010 lines.
NOT READY FOR DATA: Issued by all listeners and released by each listener as it becomes ready to accept data.
REMOTE ENABLE: Grounded to the main control over the system.
SERVICE REQUEST: Issued by any device needing service from the controller.
53
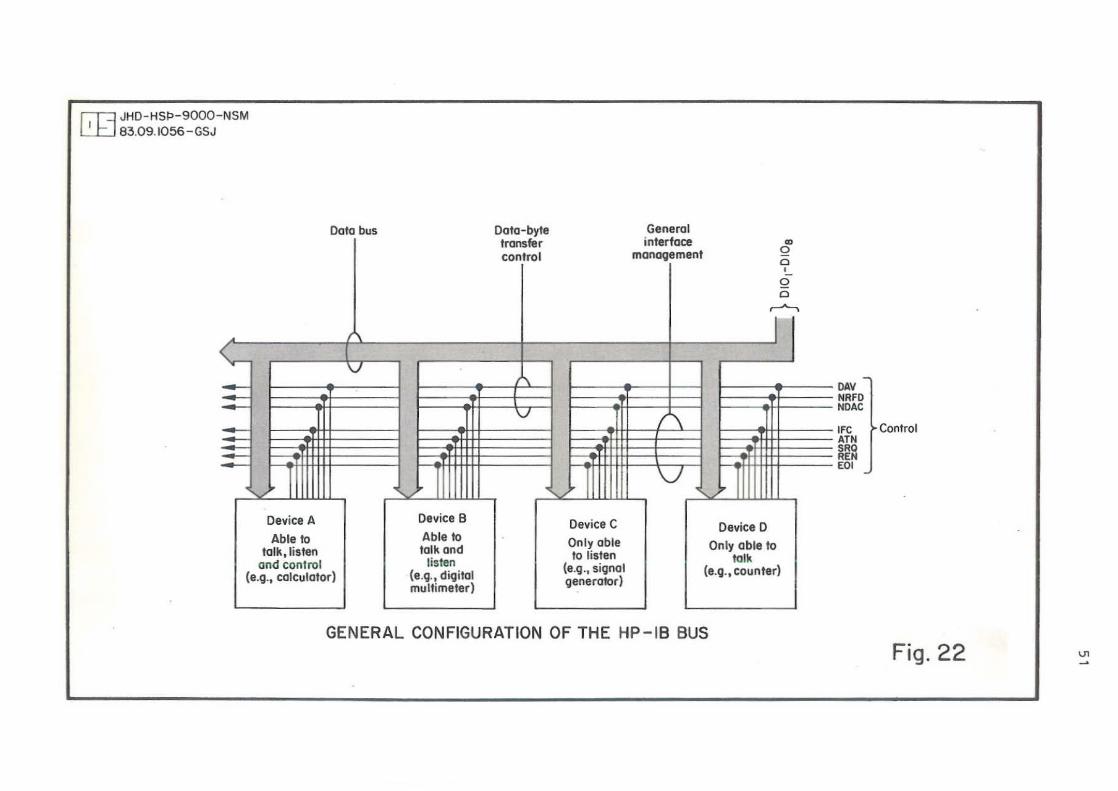
5.4.2 Basic system operation
Message bytes are carried on the eight 010 signal lines In
a bi t-parallel,
bldlrectlonally.
byte - serial
Three 11 nes
form,
DAV,
asynchronously and
NRFD. and NOAC
manage the transfer of data on the eight signal lines from
a talker or the controller to one or more listener devices.
The DAV (Data Valid) lIne indicates the availability and
validity of information on the signal lInes. The NRFD (Not
Ready for Data) lIne signals whether a device is ready to
receive data. NDAC (Not Data Accepted) indicates that a
device Is rece i ving data.
ATN (Attention), one of the five control lInes, Is central
to the operation of the interface. It specifies how data
on the eight signal lines are to be interpreted and which
devices must respond. When the controller sets the ATN line
true, the specific response of devices on the bus is
elicited by sending talker or listener addresses from the
controller down the eight data lines. While the ATN line is
held true. all devices must listen to the addresses. When
the controller sets the ATN line false, only the devices
that were specifically addressed receive or transmit data.
Only one talker can transfer data at a time.
Data transfer rate of the bus is up to 1 Mbytes per second.
This fast transfer is due to the bit-parallel mode of
information communication. However. a maximum of 15
devices can be supported. This limitation is due to the
electrical specifications for the line driver and receiver
circuits. Also, the total cable length connecting a l l the
instruments on one bus should not exceed 20 meters.
Voltage levels on the various lines do not change instan
taneously but require a certain amount of time proportional
to the 1engh of the cable. This limit insures that the bus
will operate properly at its rated maximum speed.
54
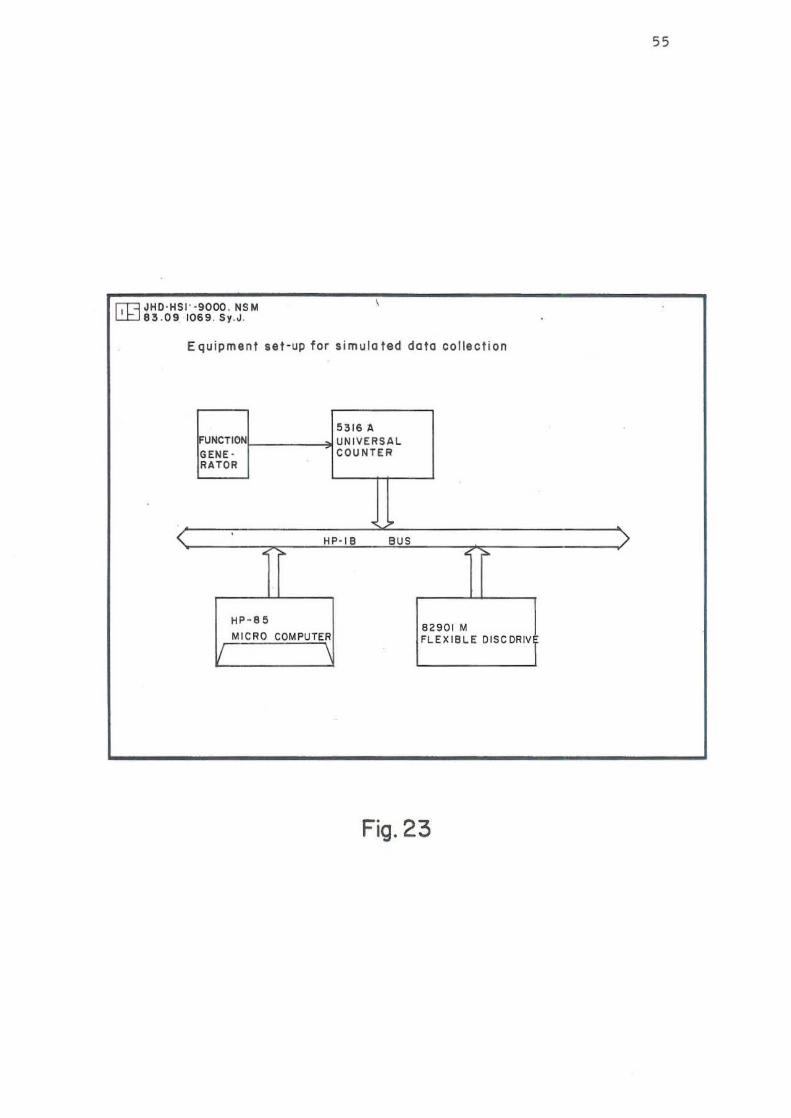
5.5 HP-8S and peripherals for simulated data collection
and registration
The equipment set-up for the system Is illustr ated in Fig .
23. A description of each piece of equipment In the system
follows.
5. 5 . 1 HP - S5 desktop computer
The HP-85 desktop computer has a read/write memory of 16K
bytes built into it (HP - Technical Data. 1980a). It Is
expandable to 32K bytes with an expansion module that can
be plugged In at a provided port. The computer is program
mable In BASIC language. A tape cartridge is included with
a capacity of 210K bytes for data storage or 195K bytes
for program storage . A built-in thermal printer Is provided
with a paper wIdth of 108 mm. Each character set printed
Is composed of 5 by 7 dot matrix and 32 chraracters per
line. Graphics resolution is 2.63 dots per mm. The visual
display is CRT with a size of 127 mm (diagonal ) .
5.5.2 I/O ROM and 82937A HP-IB interface
If the HP-S5 is to act as a system controller. the HP - IB
Interface Module 82937A and the I/O ROM (Read Only Memory)
must be fitted into their appropriate slots (HP - technical
data. 1980c). The I/O ROM is plugged int o one of six
spaces in the ROM drawer, which in turn fits into one of
the four slots in the back of the computer. The 82937 A
HP - IB module plugs into one of the slots.
The BASIC language is
commands through the
program statements or
augmented with straightforward I/O
I/O ROM. Any liD system requires
subprograms called I/O dri vers to
pass data and commands among instruments. This capacity is
provided by the I/O ROM so that only simple BASIC commands
are to be used by the programmer.
r;T=l JHO-HSI "-9000 . NSM ~83 . 09 1069. 5., ." .
Equipment set-up for simulated dota collection
531611. UNCTION UN IVERSAL
GENE · COUNTER RATOR
< HP-1 B BUS
HP - e 5 82901 M
MICRO COMPUTER FLEXIBLE DISCDRIV
Fig. 23
55
)
56
The HP 82937A is the HP-IS hardware and software interface
that permIts bidirectional. asynchronous communication of
up to 111 compatible instruments. It uses an interface
processor to provide efficient management of the interface
bus protocol. It can achieve data transfer rates of up to
25K bytes per second which Is the absolute maximum.
5.5.3 HP 82901M flexible disc drive unit
Due to higher speed and more storage capacity than the tape
cartrIdge. a disc drive model 82901M Is employed for data
storage. The tape cartridge however Is convenient for
storing the programs to be executed. HP 82901M Is a 5- 1/4 '1 flexible disc dual drive which supplies up to S40K bytes of
fast random access storage . Each disc provides 210K bytes
of formatted storage.
5.5.4 HP 5316A universal counter
The Hewlett-Packard Uni versal Counter Model 5316 measures
Signals over a range of DC to 100 MHz. It measures
frequency, period, time interval average. time interval
holdoff, ratio (A/B). and the pulse totalization fu n ction
with manual or external gating. It is externally pro gram
mable via the Hewlett Packard Interface 8us (HP -I B). It is
this feature that makes it possible and useful as a
measurement tool for the data collecting system. For the
following simulated run, it is applied as a frequency
counter. It could give a data output rate via the HP - la of
7 readings per second maximum for the shortest gate time.
The above mentioned counter is a laboratory type counter
with a very high degree of accuracy so that it is used for
calibration purposes at Orkustofnun. A less accurate
counter with the same interface bus would be sufficient for
logging purposes. The above counter would be too expensive
57
for purposes other than laboratory work such as calibra
tion. It was so used just because of its availability at
the Orkustofnun Electronics Lab oratory.
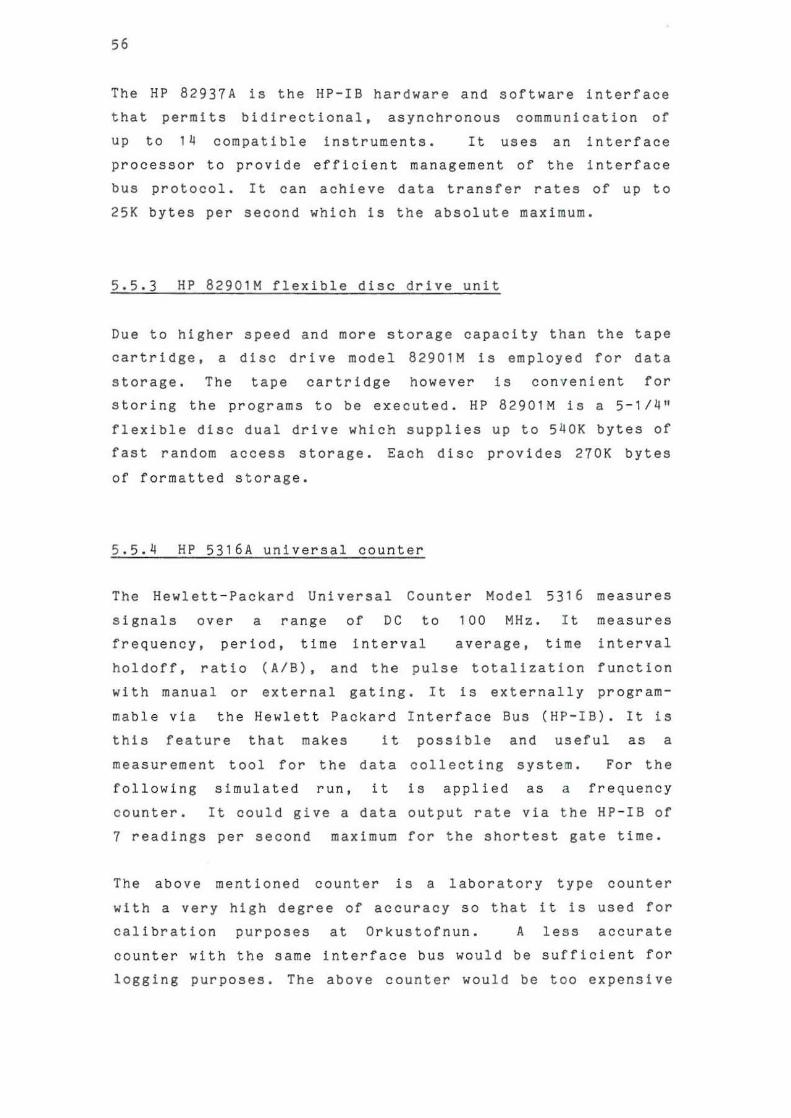
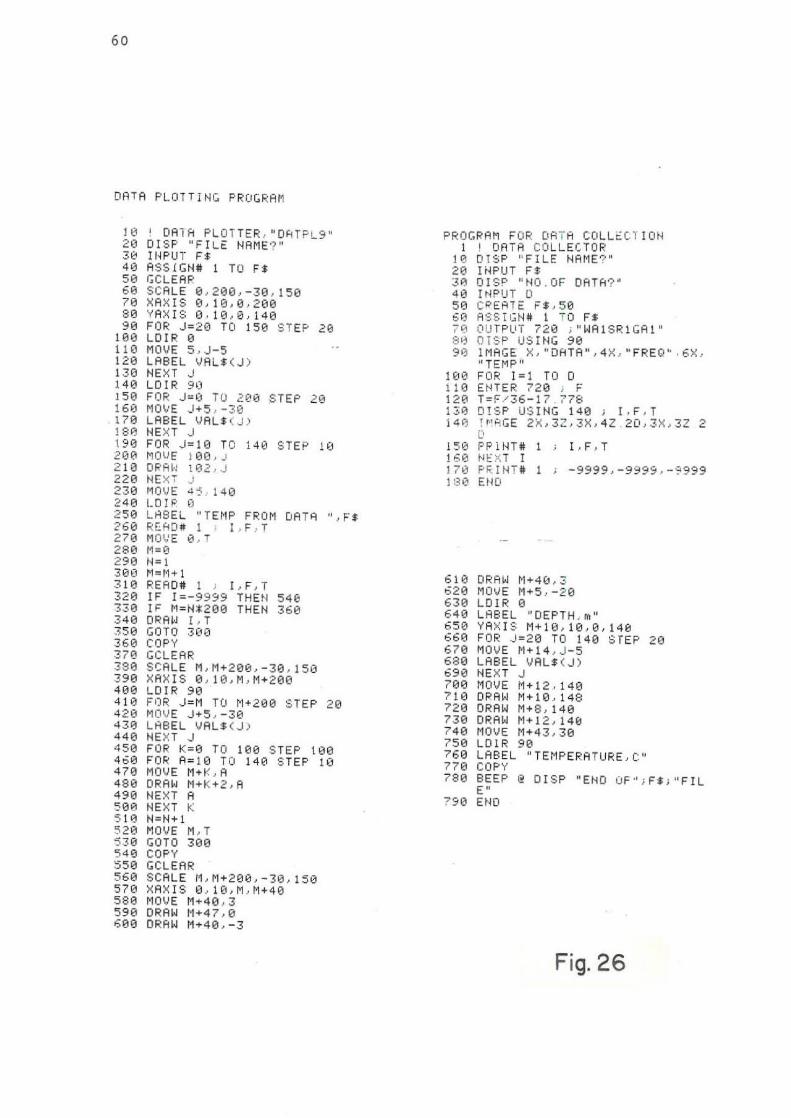
5.6 Software
Computer programming Is In the enhanced BASIC language of
HP. Two prog r ams were made: one for data collecting and
one for plotting the collected data. The programs were not
well refined due to time constraints on the preparation of
this report but they serve their purpose well.
Shown on Fig. 24 Is the flow chart for data collection and
Flg.26 Is the computer program itself. Fig. 25 shows the
plotting flow cha r t and also In Fig.26 the actual program.
The flow charts explain how the programs operate.
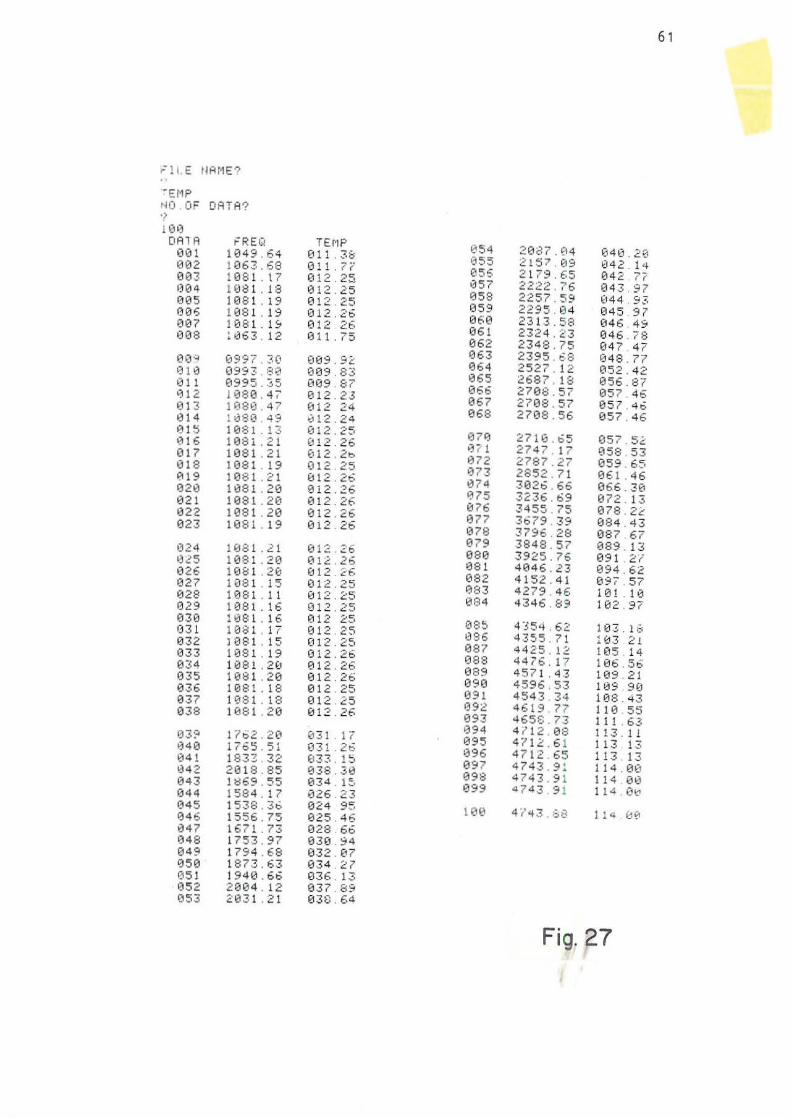
5.7 Results
On running the data collection program, the display on the
eRT looks like that on Fig. 27 . Two examples of plotted
data are shown in Fig. 28.
5.8 Time analysis
USing the HP-85's internal timer, it has been possible to
scrutinize the speed limitations of the system. Timer
commands of the computer were inserted at appropria te
points in the program to determ i ne how long a time it would
take to execute certain statements 1n t he pr ogram. Wi th
this method, the following observations were made :
1) It takes an average of 40 milliseconds for the computer
(which acts as the controller) to set up the counter into
its frequency mode.
58
r;T"=1JHD ·HSP·9000 . NSM. l.CJ::J 83.09. 1070. Sy.J.
Temperature data collection flowchart
START
1 INPUT FILE NAME IN PUT NO OF DATA.D INI T IALIZ E COUNT ER, I ~O
1 SET-UP CO UN TER TO READ FREQ MEASUREMENT
CREATE DATA FILE ON MASS STOR AGE , I. E.DISC
-'" READ DATA FROM COUNTER I.E .FREQUE NC
1 CALCULATE TE MP. T
T~ ;6 - 17.778
t INC REMENT COUNTER I~I+I
STORE I,T,! ON DATA FILE
NO YiAIT FOR IS - DEPTH I ~ D SIGNAL
YES
STORE T=1.99999 (ENDOF FI LE MARKE,
1 ( END ) Fig. 24
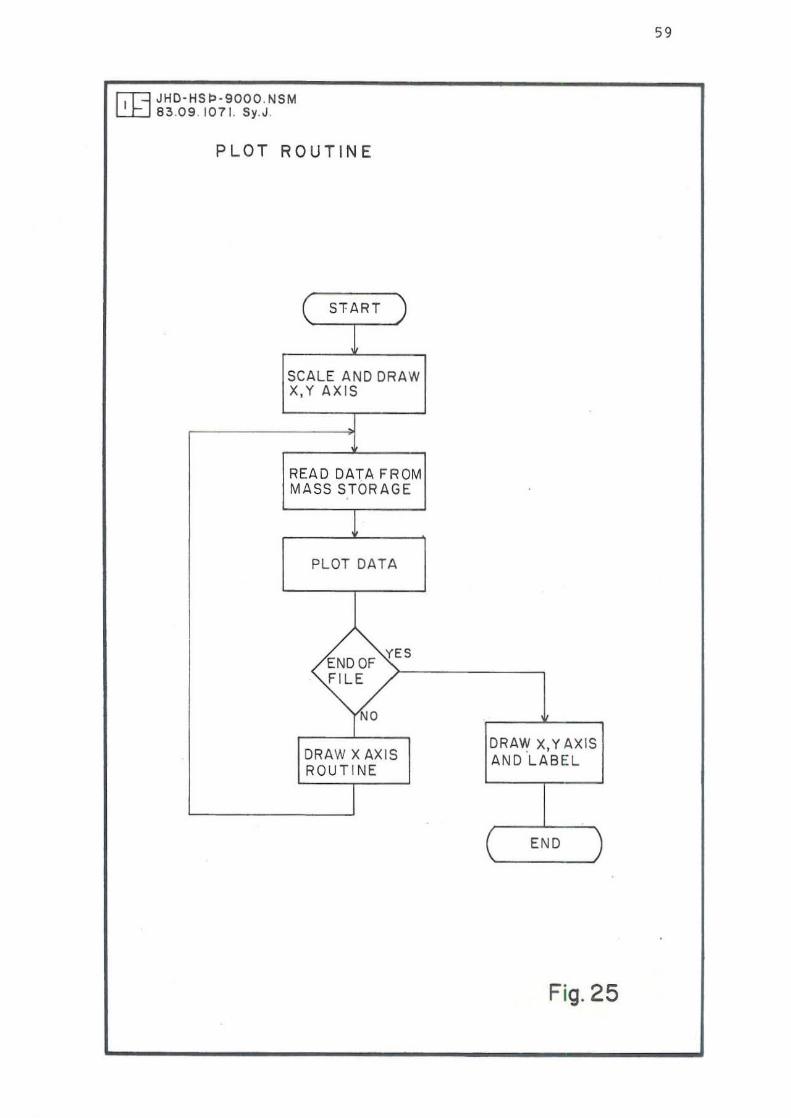
r;n JHO'HS p·9000 .NSM L.:J:::..J 83.09 . 1071. Sy.J.
PLOT ROUTINE
Sl'ART )
SCALE AND DRAW X,Y AXIS
READ DATA FROM MASS STORAGE
PLOT DATA
ENO OF YES
FILE
NO
DRAW X AXIS ROUTI NE
59
DRAW X, Y AXIS AND LABEL
END 1
Fig. 25
60
DATA PLOTTING PROGRAM
l a ! OA T ~ PL O T TER , ~DATP L9" 28 DISP "FILE NAME ? " 30 I I~PUT 1="$ 413 A$SIGN# 1 TO F$ 50 GCLEAR 68 SC ALE 0 , 200 , - 30 , ISO 78 XAXIS ft , 10 , 0 , 200 a8 YA XIS 0.10 , 8 , 148 90 FOR J =20 TO 150 STEP 20
HH:1 LOIR El l I e MO VE 5 , J-S 120 LABEL VAL$ ( J ) 1313 NE XT J 140 LOIR 9(1 158 FOR J= 8 TO 2e e SI EP 20 168 MO vE J -+S , -30 170 LABEL VAL$ (J) 18'3 NE XT J 190 FOR J =10 TO 140 STE P 10 20'?! MO\! E j ee , J 2 18 OR Al<! 102 , J 2 28 NEXT J 238 MOVE 4 '5 1413 2 48 L DIF: 11 258 L~8 EL " TEMP FROM DA TA ", F$ 260 RE80~ 1 I , F , T 2 78 MOV E I) , T 2 8121 11 : 9 2 98 NZl 30B ~1=r1+ 1 3 10 READ# 1 ; 1 , F , 1 328 IF J=-9999 THE N 546 338 I F M=N*2e e THEN 360 340 DRAW I , T 3513 GOTa 3 (11) 360 COP Y 3713 GCLEAR 388 SCALE M, M+200 , -30 , 158 398 XRXIS e , 18 .M , M+20e 40e LDIR 98 418 F8R J=M TO M+208 STEP 28 428 MOVE J+5 , -30 43~ L~BEL VALS ( J ) 449 NE XT J 450 F O ~ K=0 TO lee STEP t0e 460 FO~ A=10 TO 140 STEP 10 4713 MOVE M+ K, A 48e DRAw f>1+ K+2 ,A 490 NE XT A 58121 NE XT K SIB N::N+l 5 213 MOVE M, T '5 38 GOTD 380 '5413 COp y 559 GCLEAR 560 SCRLE M, M+2ee , -30 , 150 570 XAXIS l,) , lfl,M , 11+4fl 589 MOVE M+4e , 3 599 DRAW "1+47 , 0 6913 DRAW N+49 , -3
PR OGRAM FOR DATA COL L~ C 1 ION 1 ! DATA CO LLE CTOR
le DtSP "F I LE NAME ? " 2 13 INPUT F$ 3~ OI SP "NO . OF DATA?" 40 I NPUT 0 se CREA TE Fs ,se 60 ASS I GN. 1 TO FS 70 OUTPUT 720 i ~WAISR1GAl · 8~ OI SP US I NG 90 913 I MAGE X," DRTA" , 4 X , · FRE Q~ · 6 X ,
" TE'~P " 1013 FOR 1=1 TO 0 1 10 ENTER 720 F 120 T= F/ 36-17 . ? 78 13~ D!S P US ING 14e ; LF , T 14 ~ ! ~qGE 2X, 3 Z,3X, 42 20 , J X, 3Z 2
c· 15 0 PP1NT. I , F , T 16('1 NExT I 1713 P~IHT * - 9999 , -9999,-~999 18 1; END
619 DRAW ~1+40 .3 6 20 MOV E M+5 , -29 6 30 LOIR €I 649 LABEL UDEPTH , m" 6Se YA XIS M+10,10,e,140 661) FOR J~2e TO 14e SrEP 20 670 MO VE M+14 . J -S 6a e LABEL VALS ( J ) 69 13 NE XT J 7ee MOVE M+12.140 7 10 DRAW M+10,148 720 ORAW M+8 , 140 730 DRAW M+12,14B 740 MOVE M+43 . 38 750 LDIR 90 760 LABEL ~TEMPERATURE.C~ 770 COp y 780 BEEP @ OI SP MEND O F " ; F $ ; ~ FIL
E" ? 9 0 END
Fig. 26
61
~· ll. E tlAt1E"
~Et1P
1'10. OF DATA'? ., leo
OR1 A FRE Q TErlP €I!:i4 21387 . 13 4 040 . 20 €l et 11349 . 64 011 . 3& ·355 2 157 . 9. 842 14 092 10 6 3 .68 011 .77 0~'5 2179 .6 5 a42 n 0 e:? 11381 .17 01 2 . 25. 0" 2222 .76 043 97 1.304 1013 1 · 18 012 . 2~ 958 2257. 59 €144 . 9.3 (105 10 8 1 · 19 a12 25 1359 2295 . 04 045 . 97 0005 1'2.181 · 19 012 . 26 13 60 2313 .58 946 4 5-007 1081. " 012 26 961 2324 . 23 8'6 . i8 .88 1\363 · 12 011 .7 5 862 2348 . ? 5 047 . 7 863 2395 . 68 048 . ?7 .00 13997 . :?:« 09 • . 9;2 864 2~27. 12 052 . 42 0993 . 813 009 8-'
2687. 856 81O . ,
865 18 .87 01 1 099~ · .~5 e09 87 066 2'788. 57 057 . 46 012 113813 .4 i . ,2 . 23 067 27138 . 57 .57 4 • 813 1088 . 47 012 24 868 2708 . 56 057 . 46 .,. 11:380 . 49 61 2 . 24 015 1081 .13 01 2 .25 .7 • 2716 . 65 057 5. 1316 10 8 1 .2 1 (l12 . 26 0371 2747 . 17 1358 53 017 11381 .21 012 . 20 872 2787 .27 859 . 6~ 818 1138 1 · 19 012 25 .73 28 52 .71 9" . 46 et19 11381 .2 1 .,2 . 26 074 38215 . 66 1366 . 30 .2. It18! . 2. 812 .26 t(1175 3236 . 69 072 . 13 821 Hi81 .2. e12 . 26 .76 3455 . 75 078 . 2i: 922 HI81 . 29 .,2 . 2' .71 3ti79 . 39 084 . 43 1323 11381 · 19 912 . 2' .78 3796.28 087 67
.79 3848.57 089 . 13 1324 11381 .21 (l12 . 26 08. 3925 .76 891 . 2' / 0" 1081 . 28 8!.2 . 26 981 4046 . 23 £194 . 62 026 1£18 1 . 2. .,2 . 26 e82 4152. 41 £19, . 57 .27 HI8 1 · 15 012 . 25 083 4279 . 46 181 . 18 . 28 108 1 · 1 1 812 . 25 08' 43 46 . 89 102 . 97 1329 1081 · 1 E. 012 . .25 03. 1081.
" 1312 25 e8; 4354 . 62 1133 . 18 1331 1881 · 17 012 . 25 1386 4355 . 71 ~~3 21 1332' 18 81 . 15 812 . 25 887 4425 . 12 1 (15 . 14 033 1881. 19 012 . 26 888 4476 . 17 1136 . S6 0:<4 11381 . 2. 012 . 215 889 4571 . 43 ,.9 . 21 13 35 108 1 . 2. .,2 . 26 • 9. 4596 . 53 109 90 03. 188! · I. 812 25 1391 4543 . 34 188 .43 037 11381 . 18 012 . 25 1)92' 4619 . 71 11. '" 1338 1081 . 2. 012 . 2f. .93 46SB . 73 1 1 1 . 63
894 4 / 12 . 0$ 1 13 . 1 1 03:? 1762 . 20 031 . 17 .oo 4 712 . 6 1 113 13 ,HO 1765 . 5 1 1331 . 2ti 8" 4712 . 65 113 . 13 041 1837:. 32 833 . 15 1397 4743 . 9 1 114 .86 9 42 28 18 . ., 938 . 313 .9. 4743 . 9 1 114 •• 843 11:169 . :55 034 . " 899 4 743 9 . 114 . 0\:1 e44 1584 . 17 02. . 23 845 1538 . 36 1324 95 , .. 4 "1 43 . :;8 11· Lj~ 1346 1556.75 1325 . 46 8 47 1671 .73 .28 6. . 48 1753 . 9 7 £130 . :::;4 049 1794 . 68 032 . e7 .0. 1873.63 034 . 2(' e51 1940 . 6';; 036 . 13 13:52 20134 . 12 037 . 8S 053 2831 . 21 133>:: . 64
Fig. 27

62
2.
4.
80
, .. 12.
t 4 13
16@
100
2213
2 48
280
328
340
330
428
46"
!.80
+ ' t
I ,
I "
t ! t i
, , , ,
20
80
1 ••
1 213
1813
It>
Fig, 28
63
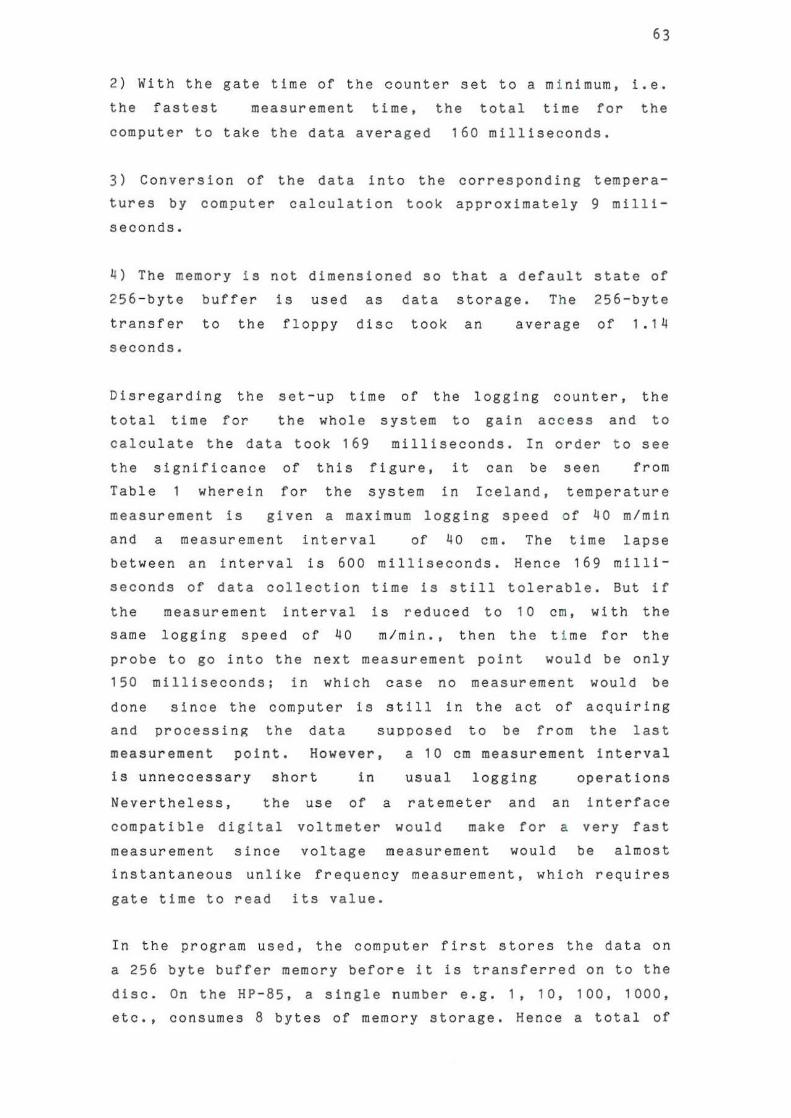
2) With the gate time of the counter set to a mi nimum, I.e.
the fastest measurement time, the total time for the
computer to take the data averaged 160 milliseconds.
3) Conversion of the data into the corresponding tempera
tures by computer calculation took approximately 9 milli
seconds.
4) The memory Is not dimensioned so that a default state of
256 - byte buffer Is used as data storage. The 256-byte
transfer to the floppy disc took an average of 1.14
seconds.
Disregarding the set-up time of the logging counter. the
total time for the whole system to gain access and to
calculate the data took 169 milliseconds. In order to see
the significance of this figure, it can be seen from
Table wherein for the system In Iceland, temperature
measurement is given a maximum logging speed of 40 m/min
and a measurement interval of 40 cm. The time lapse
between an interval is 600 milliseconds. Hence 169 milli
seconds of data collection time is still tolerable. But if
the measurement interval is reduced to 10 cm, with the
same logging speed of 40 m/min., then the t i me for the
probe to go into the next measurement point would be only
150 milliseconds; in which case no measurement would be
done since the computer is still in the act of acquiring
and processing the data supposed to be from the last
measurement point. However, a la cm measurement interval
is unneccessary short in usual logging operations
Nevertheless, the use of a ratemeter and an interface
compatible dig i tal
measurement since
voltmeter
voltage
would make
measurement
for a
would
very fast
be almost
instantaneous unlike frequency measurement, which requires
gate time to read its value.
In the program used, the computer first stores the data on
a 256 byte buffer memory before it is transferred on to the
disc. On the HP-aS. a single number e.g . 1, 10. lOO, 1000.
etc., consumes a bytes of memory storage. Hence a total of
64
32 data numbers would fill the buffer. The act of transfer
into the disc drive interrupts the whole system including
the measurement fu n ction since only one thing at a time
could be done by the computer notwithstanding communication
through the interface bus itself. The transfer of the 256
byte data into the disc took an average of 1.1 it seconds.
With reference again to the temperature l ogging just
recently mentioned. the time (for a 40 cm interval) it
takes fo r the probe to go from one measuring pOint to the
next Is 600 milliseconds. If the above program were to be
used, then there would be a pOint whenever the buffer
memory Is filled. that no measurement can be taken In
because of the 1 • 1 4 second transfer time.
It is however possible to dimension the computer's memory
i n such a way so as to fully utilize its fu:p capacity
before the data is transferred to the disc drive. The HP-85
has a full RAM (random-access - memory) of 32K by t es which is
equal to 32,768 bytes (since l K byte· 10211 b ytes). Parts
of these are used by the ROMs (read - only - memory) for the
BASIC interpreter, I/O, etc., and a part is used by the
program itself. In this particular case, the ROMs and the
data collection program used a total of 3,386 bytes of RAM.
Therefore, 29,382 bytes of the memory are still free for
use for data storage.
By utilizing the memory's full available capacity, logging
can be done without measurement skip, up to a certain depth
d epending on the number of parameter s measured and stored.
Logging can be stopped or slowed down to enable the data to
be transferred to the disc, without losing measurements at
that paint.
65
5.9 Other measurements
The same set-up can be used for measuring other parameters
employing frequency variations as the method of information
transmission. Differences will just lie on the software for
the data registration and plotting. Following are examples
of how such other measurements would be done us i ng the same
system set-up.
5 • 9 • 1 Callper measurement
For a callper tool, In which the frequency Is not linear
for all ranges In arm opening, a program must be prepared
in such a way that it will correct the gathered data with
respect to the actual arm opening. An actual callper log
calibratIon is shown In Fig. 29. As can be seen, the pen
deflection is not lInear for an equal callper ar m opening.
This Is illustrated in Fig. 30.
Looking at each diameter range as a linear function of that
frequency
it can be
given by:
range, say 02 to D3 as a function of F2 to F3,
shown that any diameter of that range will be
(f-f2) (D3-D2) o • + 02
(0-f2)
where: 0 • diameter between D2 and 03 range, f • measured
frequency
In general, for any frequency and diameter range; the
diameter is calculated as:
D • ~( _f __ - _f_n~-_I~)~(~D~n~-~D~n~-~I~) - + 0
(fn - f n - l)
where tn is the frequency at a diameter On and f is the
measured frequency.
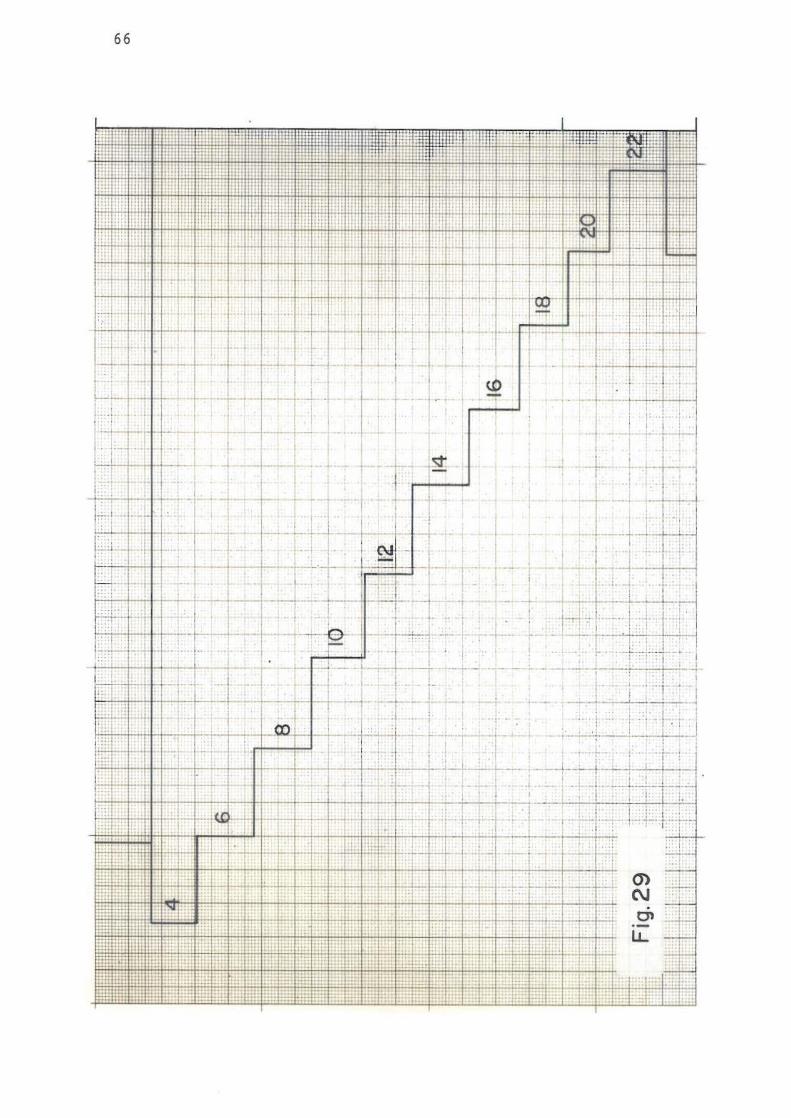
66
_, I: r i ,
;;++1-+4:1,#4-"
lJclilil"
4, ~#' I'~ ;, i I i
.-.-. : '~I':
I :, I I ,. 1,1, '! -i
1-- • r" ,-'-I I ", 1
", +"'-1 -I": i
1 r I - I '-_'
"
,! , 1
-+-+-,,+,1·" r I' I, -t-t-- ~ •.
I, " , cc; 1"'-:-
1 ... 1 " ,.. ,
", + I .. , I I'
I
, . t·
~ ,. 41 ..
, L I
I' I
I· .. t· .- .
I I
'-
I' I,
: ..
. I' 1

~ JHD-HSP - 9000 - NSM t..:LJ 83.09.1202-G5J
N
r . >-u z '" " 0
'" '" ...
1200
1100
1000
900
800
700
600
500
400
300
200
100
2 4 6 8 10 12 14 16 18 20 22 0
ACTUAL DIAMETER, inches
FREQUENCY RESPONSE ON LINEARLY INCREASING CALlPER OPENING
Fig.30
67
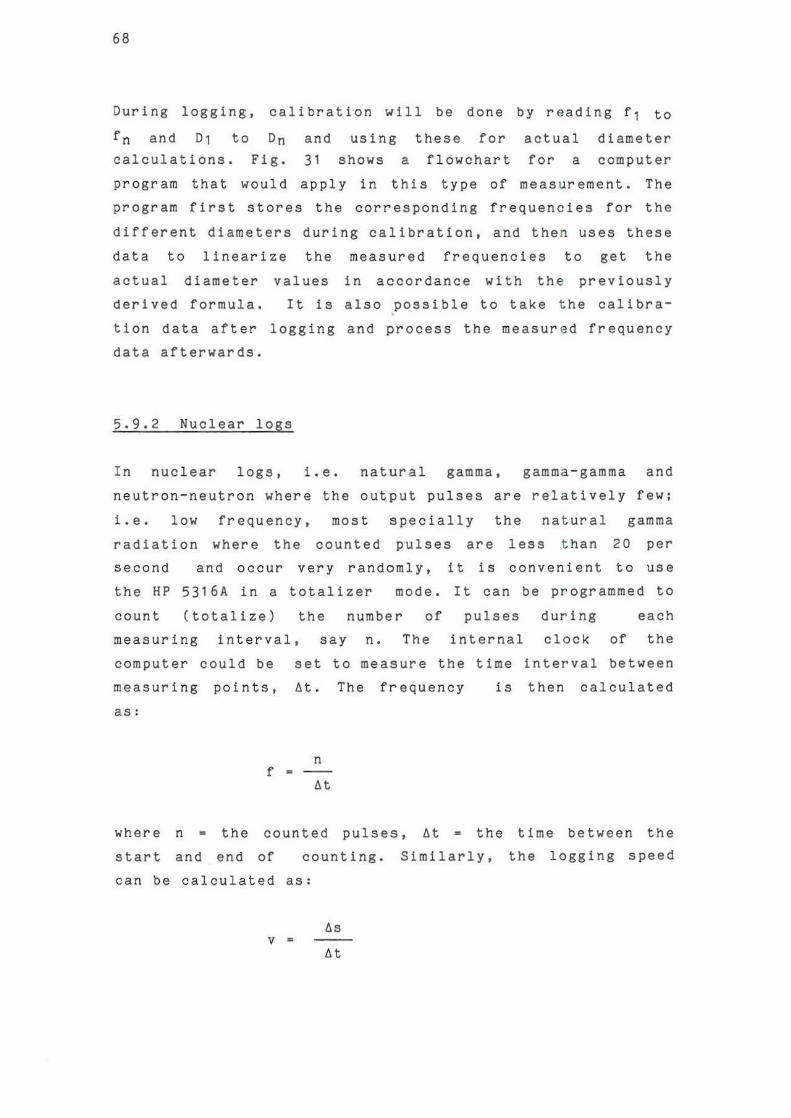
68
During loggIng, calibration will be done by reading f, to
fn and 01 to On and using these for actual diameter
calculations. rig. 31 shows a flowchart for a computer
program that would apply in this type of measurement. The
program first stores the corresponding frequencies for the
different diameters during calibration, and the n uses these
data to 11nearize the measured frequencies to get the
actual diameter values In accordance with th e previously
derived formula. It is also possible to take t he callbra-
tian data after logging and process the measured frequency
data afterwards.
5.9.2 Nuclear logs
In nuclear logs, 1. e. natural gamma, gamma-gamma and
neutron - neutron where the output pulses are relatively few;
i.e. low frequency, most specially the na t ural gamma
radiation where the counted pulses are less t han 20 per
second and occur very randomly, it is convenient to use
the HP 5316A in a totalizer mode. It can be programmed to
count (totalize) the number of pulses during each
measuring interval, say n. The internal clock of the
computer could be set to measure the time interval between
measuring points, 6t. The frequency is then calculated
as:
n f •
where n the counted pulses, .6.t the time between the
start and end of counting. Similarly, the logging speed
can be calculated as:
v • 60
<It
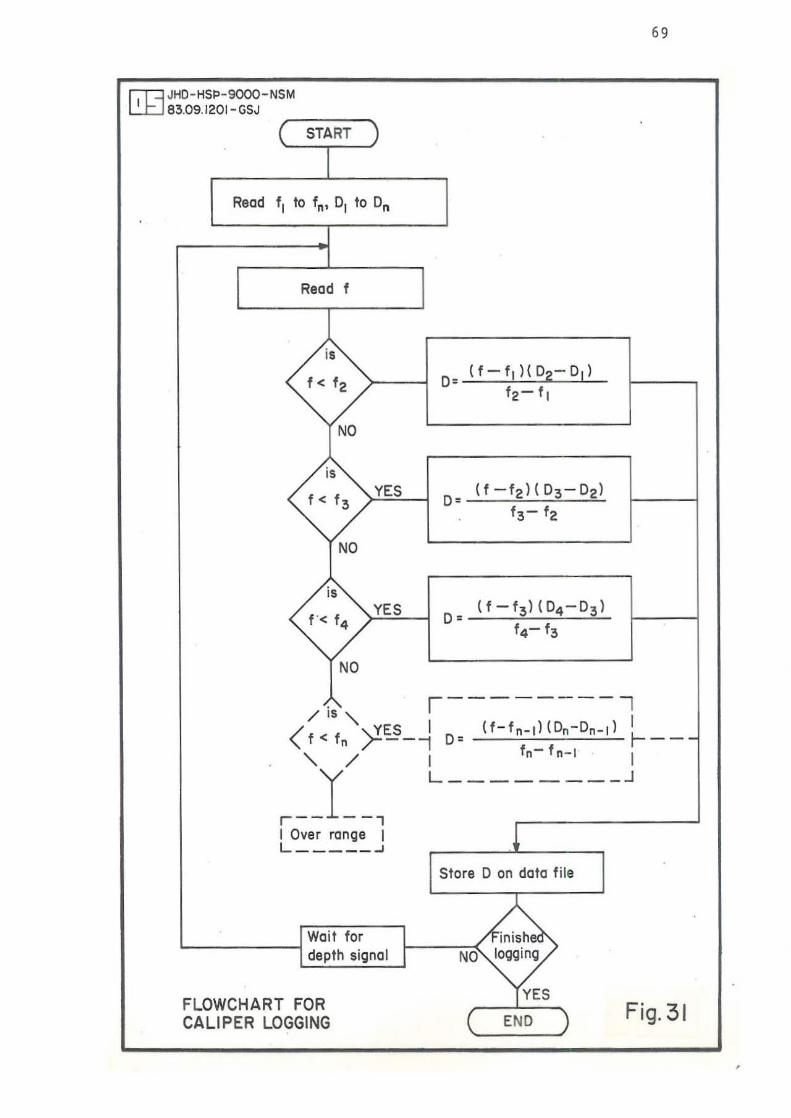
69
[Q;j JHD-HSP-9000-NSM 83.09.1201-GSJ
( START
Read I, 10 In. 0 , 10 On
Read I
is
1< 12 O' (I - I, )( OZ- 0 , )
12- I,
NO
is
1 < 13 YES
O' (I - 12) (03- 02)
13- 12
NO
is
1'< 14 YES
O' (1-13)(04 -03 )
14- 13
NO
/i~" 1---------, < I < I ~ES_ I 0 - (1-ln_I)(On-On_l) I n "'1 - 1----"1/ L ___ ~-~~ __ J
r-- --, lOver range I ! L _____ ..J
Slore ° on dolo file
Wait for inishe deplh $i~nal NO logging
FLOWCHART FOR YES
CAll PER LOGGING ( END ") Fig.31
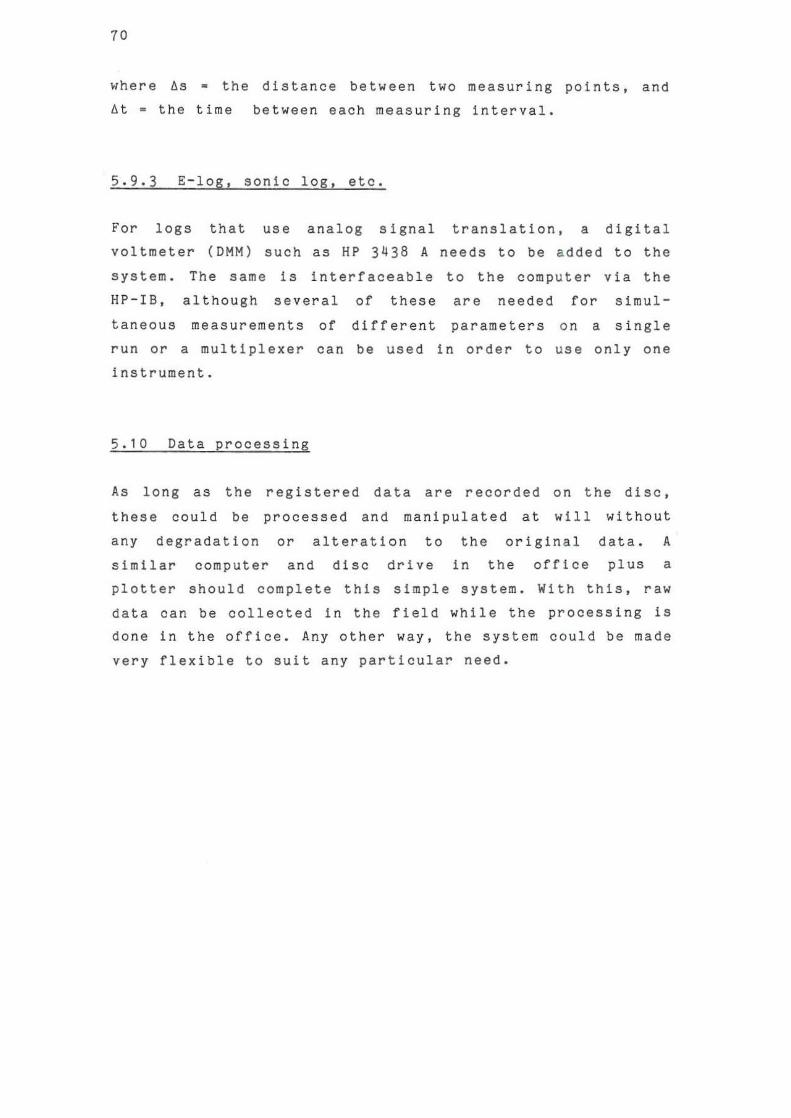
70
where fls '" the distance between two measuring points. and
dt • the time between each measuring interval.
5.9.3 E-los, sonic los, etc.
For logs that use analog
voltmeter (OHM) such as HP
sIgnal translation. a digital
3438 A needs to be added to the
system.
HP - IB,
The same Is interfaceable to the computer via the
although several of these are needed for simul-
taneous measurements of different parameters on a single
run or a multiplexer can be used In order to use only one
instrument.
5.10 Data processIng
As long as the registered data are recorded on the disc.
these could be processed and manipulated at will without
any degradation or alteration to the original data. A
similar computer and disc drive in the office plus a
plotter should complete this simple system. With this, raw
data can be collected in the field while the processing is
done in the office. Any other way, the system could be made
very flexible to suit any particular need.

71
6 USE OF HP-87 COMPUTER AND INTEGRATED DATA ACQUISITION
UNITS
6.1 Introduction
The avaIlabilIty
section at the
of an HP-87 computer a t the
Division
author's
In the PNOC - EDC. Geothermal
Philippines prompted the author
applIcabIlIty of this computer
HP-S5 used previously.
to do a brief study on the
as a substitut e for the
Measurement. test. and control instruments have recently
been available as modular units capable of being integrated
into a single mainframe which In turn can be interfaced to
a computer that acts as the controller. This Is ultimately
more practical than having several discrete instruments do
the job.
6.2 Model HP-a7 computer
HP - 81 Is one of the Series 80 personal computers manufac
tured by Hewlett-Packard Co. HP - S5 and HP-87 have the same
built - in operating system and both use the similar HP's
enhanced BASIC. The main physical difference is that the
HP - 87 does not have an internal printer and a tape
cartridge for mass storage. Also the 87's CRT is 10 inches
diagonal which is twice as big as that of the HP - 85. The
HP - 87 would need an external mass storage unit to be
useful. Perhaps the most interesting difference is in their
memory capacities which is a big factor especially for data
acquisition. The HP-85 has a random - access-memory (RAM)
with an expanded maximum of 32K bytes whereas a n HP-a7 has
a built - in user memory of 128K bytes and can be expanded up
to 640K bytes. This memory has 20 times the maximum
capacity of HP-85. With this advantage, it would be
possible to log continuously without stopping whic h is
necessary when the computer's internal memory i s used up,
since enough memory space is available. The data would not
be transferred to a non-volatile storage media. such as a

72
flexIble disc, until the end of the logging operation. A
comparison of memory spaces between an HP-S5 and an HP - 87
Is shown In Fig. 32.
6.3 Data acquIsIt I on units
These are un! ts
capabilities of
which combine on a
several discrete
single mainframe the
instruments. These
capabilities range from testing, measuring and controlling
certain physical parameters. By plugg I ng - In the appropriate
modules. the un! t can be custom conflgured to suIt any
particular requirement of the above capabilities. Its
versatIlIty and flexIbIlIty makes it widely used In varied
areas, from industrial automation to laboratory research
and development. Its measurement capabilities, however,
make it desirable for well-logging application.
With the availability of these mainframes. it appears mo r e
practical to use a data acquisition unit and specify the
modules needed than to use several instruments (e.g.
digi tal voltmeters. frequency counters I etc.) to perfo r m
the same function.
Several models are available from Hewlett-Packard Co. but a
suitable selection for measurements in well - logging is HP's
Multiprogrammer model 69112A. This model has a built-in
HP - IS bus which means that it could be interfaced and
controlled by a bus compatible computer.
Card modules that suit well-logging purposes are available
for the Multiprogrammer 6942A. These include a counter
timer with an up - down counting facility that would do the
depth measurement. getting its information from the depth
control such as that described in Chapter 3 of this report.
A frequency counter or totalizer card is also available for
frequency or pulse counting measurements, as well as analog
to digital cards which would handle the analog logging
signals and convert them into digital information for the
computer. All of which are controllable by the computer via
73
the HP-IS bus. The 69112 A Multiprogrammer mainframe could
handle up to 16 of these cards, whioh is enough for
well-logging purposes.
With the addition of software for the computer, which would
direct the operation of the system, this sc heme should
make up a complete digital logging system.
~JHO·HS~-9000-NSM W83.09.1184-GSJ I
0
System ROM
,4K System ROM
'" SCtfm RAM (BA C pr09f1llTl$, !);lIOry pro<;lrCIm" system stock,)
48K 161< PIuq·;n RAM
641<-256 2561,oAddrenn
· l r,~"''':l'~.1 • • • pfuQ:in ROM!
M~m«y mop forHP.e5 ComPII'~r.
0\ .,.!om ROM \ .
241< Printer ~=S~ ... 1 p~~~~1 321< t.~ecu'a~ -1-
Addrt .. able by dil'kt or uleroded QCcess.
(BirlCtry program o~, 80M I ,ystem stocks, e1o:.) I
64K-2~ 256IJt)AddTeSWS 64K
T HP-S5 Memory L imit
Elltl1Cled Mtmal")'
AddrHsabl. by urended access only. Bankl z..zO(Hp·87XM)
(BASIC prCIgram toJ\tnl, (Each bank i. 321<) v<rroobfes, .Ie.) ~
6721< '------__ -' HP-S7XM Memory limit (Indudet32l<lysttm ROM)
M~mOr)' mop for HP- 8' KM Compul~r.
COMPARISON OF MEMORY SPACES BETWEEN HP-B5 AND HP-87XM
Fig.32
74
7 CONCLUSIONS
The versatIlIty of computers for a great variety of
applications does not exclude the acquisition and process
ing of well-logging data. Recent advances In technology
that have led to
high capabIlity
micro-miniaturization of computers with
make it more attractive for use in the
field such as In well logging.
The conventional method of well-logging Is In analog form
In which processing and manipulation of the data Is fairly
tedious if not impossible. Digital data has the big
advantage of being processed using the computer. Manipula
tion, correctIon, etc. is eas I ly done. This wou l d otherwise
be a cumbersome task using the analog data s i nce such a
huge amount of data would be manipulated manual l y.
The present system in Iceland can be regarded as an early
generation in the application of computer technology to
data
the
collecting and data processing in well - logging. All
eqUipment mounted on the logging truck was hardware
developed and built just to collect and record the data on
a tape. The information collected is but raw data which
needs to be processed by the computer at t he central
office. Much information and experience however, has been
gained on this system which can serve as a guide for a
better design of a new and more advanced system.
Any digital system that is considered to be adapted to the
conventional system needs some common hardware to make it
work. The most important of these is the depth control.
Since measurements in a digital system can not be made
continuous as In the analog system, the depth control gives
the triggerring Signal to tell the computer when to do the
measurement. Interfacing of this device to the computer can
be achieved either by building hardware or through an
integrated data acquisition unit, by specifying the
manufacturer's pre-assembled specific card. If a ratemeter
is used, a special one should also be made for this purpose
since the conventional ratemeters are designed for the

75
analog recorder on the logging unit. Moreover, an amplifier
is required for an E- log due to 1 ts low signal level and
the need for isolation.
The experiment done with the HP - SS computer simulated the
conditions of actual temperature logging. Its applicability
along with its limitatIons has been discovered In the
described experiment. A comp r omise can be made from it if
it were to be used In actual practice. such as stoppIng at
a certain depth during logging when all of its memory space
is filled up. The experiment in general showed a system
desIgn for a computer based data logging and processing
scheme. It gave a clear idea on the necessary factors that
need be considered In order to design a practical and
cost - effective working system.
The practicality of using data acquisition units which are
actually several instruments integrated int o a single
mainframe has been described. This simplifies and cuts
cost in the over-all set-up compared to us i ng several
measuring instruments and interracing them to the computer.
The integrated data acquisition unit provides the interface
between the modular instruments and the computer.
An analysis of the HP-87's capability, parti c ularly its
memory capacity based on the manufacturer's technical data.
showed it to have an advantage over the HP - SS in terms of
data storage.
Designing a digital data acquisition system for a well
logging unit includes the factor of system compatibility
with the office equipment available or needed. The
collected data which is stored in some form of non-volatile
media. e.g. flexible disc. should be capabl e of being
furthermore processed in the office by using the office
central computer or by having a computer similar to that in
the logging unit working independently or being tied in
with the central computer.

76
Perhaps a more ambitious but not remote scheme is to
transmit the data to the office on real-time, 1.e. while
logging is actually done, by using modems (modulators/
demodulators) and radio transmitters for data carrier and
have the data processed directly by the central compute r .

ACKNOWLEDGMENTS
The author hereby wishes
everyone who I directly or
77
to express his gratItude to
indirectly made this endeavor
possible. In particular, my sincere thanks to Dr. Valgardur
Stefansson, fOr his encouragement and support In this
undertakIng and for the review and criticism of the
manuscript and to Mr. Hordur Halldorsson for his super
vision and guidance all-throughout the execut i on of this
project.
The author is greatly indebted to Dr. Halldor Armannsson
for devoting a time in the scrutiny and corrections in the
usage of the English language In the manuscript.
Sincere thanks are due to Dr. Ingvar Sirgir Frldlelfsson,
who, being the Project Co-ordinator of the UNU Geothermal
Training Programme, managed our entire activity during the
course of training and made the final editing of this
report. Special thanks to Sigurjon Asbjornsson who
attended to most of the practical aspects during our stay
in Iceland and helped in the computer-organization of this
report.
Many thanks to the Orkustofnun Drawing Office for the nice
execution of the figures; to Steinar Thor Gudlaugsson and
Helga Tulinius for the orientation in the word processor of
the computer which was used in the compilation of this
report; and to all the lecturers of the UNU Geothermal
Training Programme. Special thanks to Einar H. Haraldsson
for his helpful comments and suggestions. F i nally, the
author is grateful to the United Nations University for the
Fellowship grant and to the PNOC- Energy Development
Corporation - his employer, for giving him the oppurtunity
to participate 1n the training programme.
78
REFERENCES
Conaly, Ed. 1982: "Buses, which tie boards to data. control
and power lines form the backbone of computer systems.";
Computer standards: designer's reference . ElectronIc
Design, December 23. 1982. Hayden Publishing Co.,
Rochelle Park, N.J. pp . 117-138.
Data - Acquisition Databook. 1982: Volume
circuits. Analog Devices, Inc.
Integrated
Dresser Atlas. 1980: Compensated densilog. Dresser
Industries, Inc .• Houston, Texas.
Eaton, John T., Davidson, Andrew W. and Frolik, William R. t
1982: "Extended memory and modularlty are added to the
series 80 computer family"; Hewlett -P ackard journal ,
December, 1982. Hewlett - Packard Co., USA. pp. 3-1.
Elektor Publishers, Ltd., 1981: "Revolution cou nt er";
Elektor, Septembe r 1981. Elektor Publishers Ltd.,
Canterbury, England. pp. 9-07 to 9- 11.
Elliot, Harry W.,Jr., 1983:"Some p i tfalls in log analysis";
The log analyst, November - December 1983. Society of
Professional Well Log Analysts, Houston, Texas. pp.10 - 2~
Flanagan, Dale N. ,1982: "Hewlett-Packard' .s HP - 87";
Interface age, August 1982. pp. 94 - 96.
Frost, Elton Jr. and Fertl, WaIter H., 1980: "A computer
ized wellsite log analysis system - part t" ; The log
analyst. November-December, 1980. Society of Profes
sional Well Log Analysts, Houston, Texas. pp. 10 -22.

Halldorsson, Hordur, 1983: UNU lecture notes on data
registration. UNU Geothermal Training Programme,
Reykjavik, Iceland.
Hewlett-Packard Co .• 1980a: HP-85A desktop computer
specifications. Technical data, January 1980. Hewlett
Packard Co •• USA.
Hewlett-Packard Co., 1980b: HP - S5 I/O programming guide,
February 1981. Hew!ett-Packard Co., USA.
Hewlett - Packard Co .• 19800: HP-S5 I/O ROM and HP - I8
interface. Technical data. June 1980. Hewlett-Packard
Co •• USA.
79
Hewlett - Packard Co., 1980d: HP-S5 Owner's manual and
programming guide, July 1980. Hewlett - Packard Co., USA.
Hewlett - Packard Co., 1981: OperatIng manual, 5316A 100 MHz
universal counter. 1981. Hewlett - Packard Co .• USA.
Hewlett - Packard Co., 1983a: Electronic instruments and
systems catalogue, 1983. Hewlett - Packard Co., USA.
Hewlett-Packard Co., 1983b: Optoelectronics designer's
catalog; Components and subsystems, 1983. Hewlett
Packard Co., USA.
Jaeger, Richard C., 1983: "Tutorial: analog data acquisi
tion technology, Part lj - System deSign, analysis, and
performance." IEEE Micro, February 1983. Institute
of Electronics and Electrical Engineers, Inc. New York,
N.Y. pp. 52-61.
Keys, W. S. and MacCary, L.M., 1971: Techniques of water
resources investigations. Washington, United States
Geological Survey. Book 2, 126 p.
80
Laengrich. Norbert. 1981: "Instrument intelligence
determines 488 bus speed"; Electronic design, Oct . 15.
1981. Hayden Publishing Co.,Ine" Rochelle Park, N.J.
pp. 181-186.
National Energy Authority, : Orkustofnun well-log files .
National Energy Authority, Reykjavik, Iceland.
Ogata, Katshuhlko. 1970: Modern control engineering.
Sec. 6-3. first - order systems. Prentice Hall,Inc .•
Englewood Cliff, N.J.
Stefansson. V. and Steingrimsson B., 1981: Geothermal
logging'; An introduction to techniques and
interpretation. Seco nd edition. Report OS80017/JHD09.
NatIonal Energy Authority, Geothermal Division,
Reykjavik. Iceland.