multi-source remote sensing data analysis for geothermal
TRANSCRIPT

Proceedings The 5th Indonesia International Geothermal Convention & Exhibition (IIGCE) 2017
2 - 4 August 2017, Cendrawasih Hall - Jakarta Convention Center, Indonesia
page 1
Multi-source remote sensing data analysis for geothermal targeting on Flores island
Christoph Hecker1, Robert Hewson1, Agung Setianto2, Asep Saepuloh3, Freek D. van der Meer1 1 University of Twente, Faculty ITC, The Netherlands
2 Universitas Gadja Madah, Yogyakarta, Indonesia 3 Institut Teknologi Bandung, Bandung, Indonesia
[email protected]; [email protected]; [email protected]; [email protected]; [email protected]
Keywords: Flores Island, remote sensing, satellite data, ASTER, SRTM, thermal infrared, lineament-related structure, geothermal
ABSTRACT
Flores Island of Indonesia (Nusa Tenggara Timur) has potential for geothermal energy that is still, for the most part, in its
development and exploration phase. There is considerable interest to determine the optimal geothermal exploration techniques
and the key area(s) for further investigations on Flores Island. This study summarizes past studies on Flores Island, and the
methodology and results of this study’s’ multi-spectral satellite remote sensing and geospatial techniques used to map geothermal
terrain including its fumaroles. In particular, Advanced Spaceborne Thermal Emission and Reflection Radiometer (ASTER) day
and night time imagery and Shuttle Radar Topography Mission (SRTM) products were examined to test their suitability for
geothermal exploration. However spatial resolution issues as well as vegetation and cloud cover limited the results from day time
ASTER image interpretation. The night-time ASTER thermal showed it’s potential to identify thermal anomalies associated with
volcanic activity on Flores Island however its coarse image pixel size of 90 meters again limited its application. It was found that
the SRTM Digital Elevation Model (DEM) as various processed and filtered products, provided a useful geospatial data set to
interpret for lineaments that potentially related to the structural features, in part associated with geothermal activity. These
preliminary interpreted structural lineament-related structure results were used to recommend areas within the central region of
Flores Island to undertake more detailed geothermal investigations at higher spatial resolution using airborne thermal imaging
and LiDAR-based DEM techniques.
1 Introduction
The volcanic terrain of Flores Island within the Lesser
Sunda Islands of eastern Indonesia is an area highly
prospective for geothermal energy. It is located
approximately 1500 km east of Jakarta. Interest in its
potential has been raised during the collaborative Dutch –
Indonesian GEOCAP Project and highlighted during
workshop case studies demonstrating remote sensing and
geophysical exploration techniques. There are several
active geothermal energy fields within its 14250 km2 area
however its development is at an earlier stage than other
geothermal energy prospects elsewhere in Indonesia such
as within Java. Consequently, there is a need to determine
the optimal geothermal exploration techniques and key
area(s) of interest on Flores Island. This study aims to test
optical and thermal multi-spectral remote sensing, and
topographic modelling techniques to assist the exploration
of geothermal activity on Flores Island. In particular, this
study summarises the remote sensing and geospatial
interpretation of the imagery derived from the Advanced
Spaceborne Thermal Emission and Reflection Radiometer
(ASTER) multi-spectral satellite and Shuttle Radar
Topography Mission (SRTM). As part of this study, it is
also an objective to recommend areas within Flores Island
for more detailed geothermal investigations.
The geothermal prospectivity of Flores Island can be
divided into three main areas: the Western, the Central (or
Bajawa) and the Eastern zones (Figure 1a). These are
affected by the various structural tectonic and volcanic
features of these regions. Muraoka et al. (2002) describes
the large scale subducting and colliding forces from the
Australian-Indian, Eurasian and New Guinea plates
generating these structural features of Flores Island. In
particular, these forces influence the faulting and folding of
the Central or Bajawa Zone which in turn also affects the
presence of its geothermal fields (Muraoka et al., 2002).
Muraoka et al. (2002) highlights and maps these N-S fault
lines and the NE-SW to E-W fold axes apparent within the
Bajawa Zone (Plate 1, Muraoka et al., 2002). Such faulting
and folding also influences the topography, including the
volcanic landforms apparent in the Digital Elevation Model
(DEM) information derived from the SRTM
(https://reverb.echo.nasa.gov/) (Figure 1b). In addition,
geothermal and hydrothermal activity can alter the
mineralogy of the surrounding host rocks in which the
vents or fumaroles release hot chemically enriched fluids.
This activity can produce the accumulation of alteration
minerals such as various clay, sulphate, opaline-silica and
carbonate rich minerals. Characterisation of hydrothermal
alteration minerals using shortwave infrared (SWIR)
spectroscopy on well drill cores from central Flores Island
has previously shown the presence of argillic alteration
minerals such as kaolinite, dickite, and halloysite (Aswin
and Nanlohy, 2002). This study investigated the feasibility
of mapping such alteration indicator minerals using day
time ASTER SWIR and thermal infrared (TIR) imagery on
Flores Island. Subtle thermal anomalies have also been
previously identified using night time ASTER by Urai et
al., (2002) in the central Flores Ngada District. Night time
ASTER thermal data was examined in this study for signs
of temperature anomalies above the surrounding
background, suggestive of such surface fumaroles.
Elevation data from the SRTM was also used in this study
and interpreted for lineaments and fault lines that could be
possibly associated with geothermal fumaroles. It was
suggested by Muraoka et al. (2002) that geothermal activity
is produced by buried north-south dyke-like magmatic
bodies heating fluids that are vented along N-S fractures or

Proceedings The 5th Indonesia International Geothermal Convention & Exhibition (IIGCE) 2017
2 - 4 August 2017, Cendrawasih Hall - Jakarta Convention Center, Indonesia
page 2
Figure 1:a) Geothermal Prospectivity Map and three significant areas, Western zone(red dashed line), Central (Bajawa) zone
(green dashed line) and Eastern zone (white dashed line), supplied by the Indonesian Geological Agency, Bandung; b) SRTM
30m DEM with topogr
faults. Various image processed products from the Digital
Elevation Model SRTM data were generated in this study
to assist the interpretation of lineaments, including
artificially illuminated / shaded relief and slope aspect
imagery. Processing and filtering of the Flores Island
SRTM DEM by Fourier Filter Transformation (FFT) was
also undertaken to assist this interpretation.
The results in this study are presented to show the potential
argillic geothermal mineral signatures available in the
limited areas exposed to ASTER remote sensing. More
significantly, the topographic modelled and filtered DEM
products were interpreted for lineaments within the three
geothermal Flores Island zones, (Figure 1a) and
incorporated into recommendations for future detailed
investigations
2 Methodology
2.1 Discriminating geothermal indicator minerals using
spectroscopy
The results of fundamental research into mineral
spectroscopy (Lyon & Burns, 1963; Adams & Filice, 1967;
Hunt & Ashley, 1979; Vincent & Thomson, 1972; Vincent
et al., 1975) laid the basis for later geological remote
sensing and prompted the launch of such multi-spectral
satellite sensors as NASA’s Landsat TM in the late 1980s’
and ASTER in 1999 by Japan’s METI and NASA. The
relationship of the spectral bands of Landsat TM, ASTER,
HyMap and the more recent WV-3 sensors to common
material spectral signatures is shown in Figure 2. The freely
available ASTER imagery has the advantage of additional
thermal bands, while the new DigitalGlobe commercial
WV-3 sensor has higher spatial VNIR-SWIR resolution.
ASTER measures six bands within the SWIR wavelength
region including the clay / AlOH absorption feature centred
at 2.2 um (Figure 3). ASTER bands 5, 6 and 7 have
potential to qualitatively reveal changes in the AlOH/clay
Figure 2:Reflectance spectrum of common surface
materials and various remote sensing sensors measuring at
these wavelengths
Figure 3: Spectra of AlOH clay/white mica and their
ASTER resampled equivalent. Example band parameters as
listed, estimate AlOH clay content and composition
composition from changes in the absorption feature
wavelength shift (Figure 3). Abundance and compositional
indices for minerals and/or mineral groups with absorption
features such as AlOH in Figure 3, can be devised as shown
using such band ratios and relative band depth arithmetic
Proceedings The 5th Indonesia International Geothermal Convention & Exhibition (IIGCE) 2017
2 - 4 August 2017, Cendrawasih Hall - Jakarta Convention Center, Indonesia
page 3
(Crowley et al., 1989). Table 1 summarises some of the key
geothermal minerals described by Brady et al. (2006) and
Littlefield & Calvin (2014). Each potential indicator
mineral is listed with potentially diagnostic band ratio /
relative band depth algorithms, as calculated from spectral
data from the described wavelength regions (Table 1).
Table 1: Key geothermal minerals and their representation
with ASTER band parameters derived from the listed
wavelength regions
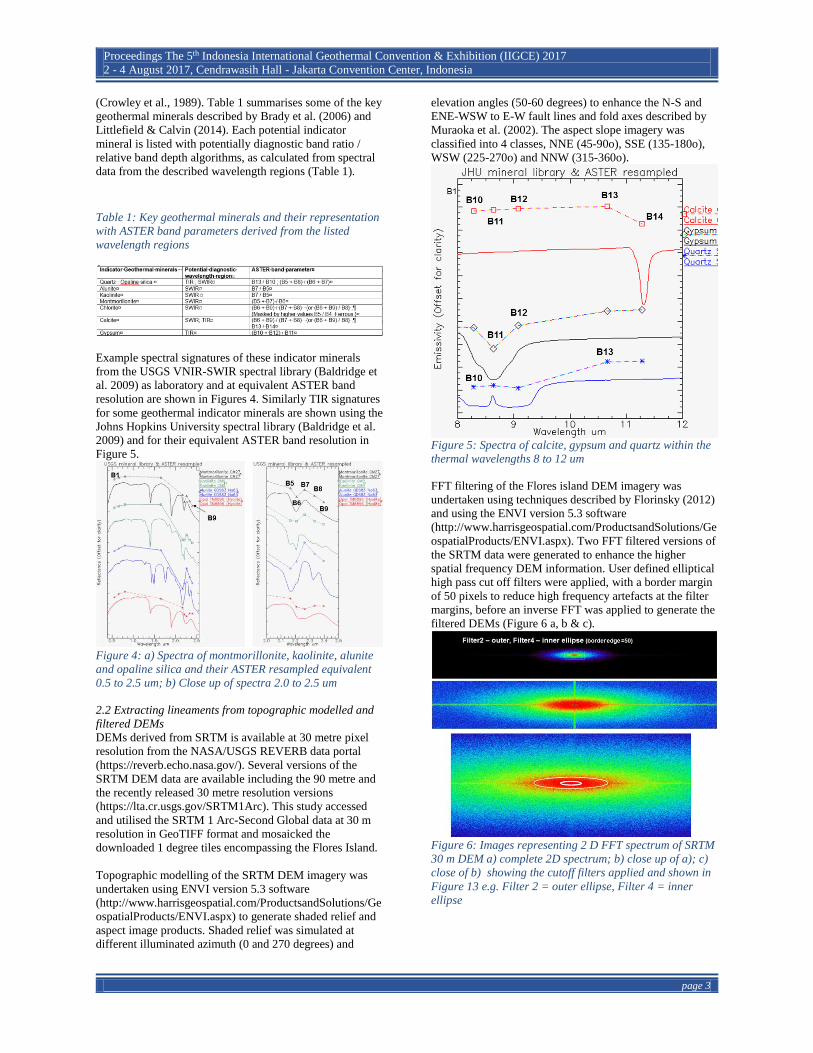
Example spectral signatures of these indicator minerals
from the USGS VNIR-SWIR spectral library (Baldridge et
al. 2009) as laboratory and at equivalent ASTER band
resolution are shown in Figures 4. Similarly TIR signatures
for some geothermal indicator minerals are shown using the
Johns Hopkins University spectral library (Baldridge et al.
2009) and for their equivalent ASTER band resolution in
Figure 5.
Figure 4: a) Spectra of montmorillonite, kaolinite, alunite
and opaline silica and their ASTER resampled equivalent
0.5 to 2.5 um; b) Close up of spectra 2.0 to 2.5 um
2.2 Extracting lineaments from topographic modelled and
filtered DEMs
DEMs derived from SRTM is available at 30 metre pixel
resolution from the NASA/USGS REVERB data portal
(https://reverb.echo.nasa.gov/). Several versions of the
SRTM DEM data are available including the 90 metre and
the recently released 30 metre resolution versions
(https://lta.cr.usgs.gov/SRTM1Arc). This study accessed
and utilised the SRTM 1 Arc-Second Global data at 30 m
resolution in GeoTIFF format and mosaicked the
downloaded 1 degree tiles encompassing the Flores Island.
Topographic modelling of the SRTM DEM imagery was
undertaken using ENVI version 5.3 software
(http://www.harrisgeospatial.com/ProductsandSolutions/Ge
ospatialProducts/ENVI.aspx) to generate shaded relief and
aspect image products. Shaded relief was simulated at
different illuminated azimuth (0 and 270 degrees) and
elevation angles (50-60 degrees) to enhance the N-S and
ENE-WSW to E-W fault lines and fold axes described by
Muraoka et al. (2002). The aspect slope imagery was
classified into 4 classes, NNE (45-90o), SSE (135-180o),
WSW (225-270o) and NNW (315-360o).
Figure 5: Spectra of calcite, gypsum and quartz within the
thermal wavelengths 8 to 12 um
FFT filtering of the Flores island DEM imagery was
undertaken using techniques described by Florinsky (2012)
and using the ENVI version 5.3 software
(http://www.harrisgeospatial.com/ProductsandSolutions/Ge
ospatialProducts/ENVI.aspx). Two FFT filtered versions of
the SRTM data were generated to enhance the higher
spatial frequency DEM information. User defined elliptical
high pass cut off filters were applied, with a border margin
of 50 pixels to reduce high frequency artefacts at the filter
margins, before an inverse FFT was applied to generate the
filtered DEMs (Figure 6 a, b & c).
Figure 6: Images representing 2 D FFT spectrum of SRTM
30 m DEM a) complete 2D spectrum; b) close up of a); c)
close of b) showing the cutoff filters applied and shown in
Figure 13 e.g. Filter 2 = outer ellipse, Filter 4 = inner
ellipse

Proceedings The 5th Indonesia International Geothermal Convention & Exhibition (IIGCE) 2017
2 - 4 August 2017, Cendrawasih Hall - Jakarta Convention Center, Indonesia
page 4
Figure 7: a) SRTM 30m DEM with topographic shading from easterly illumination; b) ASTER false colour (RGB : Bands 3,2,1).
Sites of major volcanos with bare exposures are listed
These FFT filtered products were generated in an attempt
to separate large scale volcanic topography (e.g. cones)
from the more subtle and higher spatial frequency ridges
and land forms, potentially related to fracture lineaments.
ERDAS ERMapper software
(http://www.hexagongeospatial.com/products) was also
used for the final display and lineament interpretation of
the above DEM products for each of Western, Central and
Eastern Flores Island geothermal zones ( 1a).
3 Results
3.1 ASTER map products and spectral signatures in
exposed Flores Island sites
The densely vegetated and often cloud covered
mountainous terrain in Flores Island proved a challenging
area to use ASTER imagery (Figure 7a and b). The False
colour RGB composite of ASTER bands 3, 2 and 1
highlights the chlorophyll vegetation in areas of bright red
in this multiple ASTER scene mosaic that covers Flores
Island (Figure 7b). Several sites (Figure 7a and b) were
examined in this preliminary study as part of the Advanced
Geothermal Exploration Workshop, Bandung, 2016.
Mt Inerie in Central Flores is a prominent volcanic
landform with some large exposed bare rock surfaces on its
slopes. The ASTER VNIR False colour and Normalised
Difference Vegetation Index (NDVI) imagery showed no
or reduced green vegetation on Mt Ineries’ slopes,
particularly on its northern and northeastern flanks (Figure
8a and b). Kaolinite and AlOH clay is detected by the
ASTER band products in its northern slopes (Figure 8c).
The south eastern flanks are affected by thick cloud cover.
However, problems with cloud artefacts are apparent in the
southern slopes (Figure 8c). A preliminary examination of
the ASTER VNIR-SWIR surface reflectance spectra within
Figure 8: Inerie volcano and associated ASTER products:
a) ASTER false colour (RGB : Bands 3,2,1); b) NDVI (low
vegetation: blue; high : red); c) Kaolinite content (blue :
low; red : high). Circled area shows clay
Ineries’ exposed slopes reveal argillic / clay and possibly
MgOH/carbonate signatures.
The Wawamudha volcano, also in central Flores, contained
another limited exposed area of bare rock ground to apply
ASTER’s remote sensing. This area also revealed possibly
argillic altered clay spectral signatures (alunite?) although
further validation ground/field truthing is required.
3.2 Mapping thermal anomalies using ASTER surface
kinetic temperature products
The volcanic activity at Palau Sangeang (Figures 7 a & b,
9), just offshore the north western coast of Flores Island,
offers the opportunity to test the mineral mapping and

Proceedings The 5th Indonesia International Geothermal Convention & Exhibition (IIGCE) 2017
2 - 4 August 2017, Cendrawasih Hall - Jakarta Convention Center, Indonesia
page 5
thermal anomaly mapping capabilities of ASTER imagery.
The issue of cloud and vegetation cover also proved a
difficulty here but two scene acquisitions (2004-11-04 and
2006-09-07) were merged to reduce at least the effects of
the clouds (Figure 9). The two options of image merging
were interpreted for AlOH / clay content with mixed
results. The ASTER scene acquired on 2006-09-07, and to
a lesser extent the 2004-11-04 acquisition, revealed clay
anomalies particularly in the central part of the island
(Figure 10). The surface kinetic temperature products
generated from these two day-time ASTER acquisitions
revealed variable temperature anomalies, with a noticeable
anomaly of 53o C at the summit of the volcanic dome for
the 2006-09-07 scene (Figure 11).
Figure 9: False colour imagery of Palau Sangeang
Figure 10: ASTER AlOH content interpretation of Palau
Sangeang. Black dashed circle area highlights exposed
potential clay altered areas (green to red). Note cloud
shadow artefacts producing false anomalies south west of
ASTER scene 18369 (right).
Figure 11: Day time ASTER surface kinetic temperature
product of Palau Sangeang. Black dashed circle area
highlights bare exposed area described in Figure 16
Surface kinetic temperature products from night time
ASTER acquisitions over Palau Sangeang were accessed
from seven dates between 2003-05-12 to 2014-08-21 and
shown as an overlay to shaded DEM relief in Figure 12.
These generally highlighted the cooling effect of the
elevated volcanic summit at night however anomalously
higher temperatures were observed from 2014-06-02 to
2014-08-21. In particular a river of hot lava appears
apparent running down its flanks on the 2014-07-20 and
2014-08-21. However night time ASTER thermal imagery
accessed and examined over the rest of Flores Island failed
to identify isolated anomalies, potentially associated with
geothermal fumaroles. There were less night time than the
day time acquisitions available which may handicap their
recognition, depending on the geothermal activity duration.
However the night time ASTER temperature data over the
Mt Inerie area did reveal a similar subtle thermal anomaly,
as described by Urai et al., (2002) (Urai et al.,’s Figure 8).
Urai et al., (2002) found a rise in the ASTER brightness
temperature anomaly approximately 6 km east of Mt Inerie,
in the Nage geothermal area. As with Urai et al. (2002)’s
study, a subtle anomaly of only a few degrees above
background temperature was observed. It should be noted
that any thermal anomaly would be an averaged estimate
over the measured 90 metre ASTER TIR pixels.
Figure 12: Chronological sequence of night time ASTER
surface kinetic temperature imagery of Palau Sangeang
draped over SRTM 30m DEM. Blue : low temperature; red
high. Note high temperatures associated with lava flows
from 2014-06-02 to 2014-08-21.
3.3 Lineament interpretation from SRTM DEM products
Examples of the products generated from the SRTM DEM
for structural interpretation are shown in Figure 13 for an
area in the Central Zone. The high quality SRTM DEM at
30 metre pixel resolution is apparent from the elevation
display and shaded relief product in the central geothermal
zone (Figures 13 a & b). The FFT filtered DEM products
derived from the high pass cutoff filters 4 (moderate
frequency pass filter) and 2 (high pass frequency filter)
shown in Figure 6, are indicated for this same area in
Figures 13 c and d, respectively. The north – south
topographic features are generally more apparent in the
moderate high pass frequency product (Figure 13 c) with
only the more subtle finer features shown in the higher pass
filtered product (Figure 13 d). Figures 14 a to d show an
example from the Flores Bajawa area, include the locations
of the established geothermal fields, lineament
interpretation from the area. The lineaments shown are a

Proceedings The 5th Indonesia International Geothermal Convention & Exhibition (IIGCE) 2017
2 - 4 August 2017, Cendrawasih Hall - Jakarta Convention Center, Indonesia
page 6
compilation of the interpretation from the various DEM
map products described in Section 2.2 and 3.2.
Figure 13: Example imagery of Central Flores SRTM 30 m
imagery. a) Pseudo coloured DEM draped over sun shaded
imagery; b) Sun shaded imagery (azimuth : 90 degrees,
elevation 55 degrees; c) FFT 2-D filtered at moderate pass
spatial frequency (Filter4); d) FFT 2-D
Figure 14: a) Central zone of Flores Island, supplied by the
Indonesian Geological Agency, Bandung; b) Shaded DEM
with lineament interpretations; c) Aspect modelled from
DEM with lineament interpretations; d) FFT 2-D filtered at
moderate high pass spatial frequency (Filter4) with
lineament interpretations. Geothermal fields shown as
green squares
4 Conclusion and recommendation
Vegetation and cloud cover on Flores Island together with
ASTER’s coarse 30 metre SWIR pixel resolution combine
to limit the application of day time ASTER VNIR-SWIR
remote sensing for the mapping geothermal indicator
minerals. Spectral signatures from small exposures within
volcanic terrain do suggest the presence of argillic minerals
however ground truthing and spectroscopy of field samples
is required. If future field sampling and spectrometer
measurements prove successful in identifying geochemical
indicator minerals then field or laboratory proximal sensing
could be useful as a routine and efficient technique for
ground based geological and geothermal prospect mapping.
The application of ASTER night-time thermal imagery also
provided limited results for geothermal anomalies mainly
because of the coarse spatial resolution of the ASTER TIR
instrument (e.g. 90 metre pixels). Averaging temperature
anomalies from geothermal fumaroles of a few metres in
dimension, from a 90 x 90 metre pixel sampling area will
limit the chances of their discovery. It is anticipated
however that a higher spatial resolution thermal sensor or
camera, capable of measuring radiance or surface
temperature of within smaller pixel dimensions could prove
more successful at detecting active geothermal fumaroles.
Figure 15: Shaded SRTM DEM within the Central Bajawa
Zone of Flores Island, showing recommended detailed
study areas A (blue box) and B (green box) for further high
spatial resolution Lidar DEM and thermal imaging. Red
X : Nage geothermal area (Urai et al., 2002)
The lineament interpretation from the SRTM DEM
products are likely to include geomorphological features
that may or may not be related to fault lines or fractures
associated with geothermal activity. The trends of these
lineaments however appear generally consistent with the
NNW and NE trends of fault structures and fold axes
described by Muraoka et al. (2002). The lineaments
interpreted for the Central or Bajawa Zone (Figure 14 b, c
& d) show a relatively high density and pass through the

Proceedings The 5th Indonesia International Geothermal Convention & Exhibition (IIGCE) 2017
2 - 4 August 2017, Cendrawasih Hall - Jakarta Convention Center, Indonesia
page 7
currently recognized geothermal fields as marked. This area
is also in the vicinity of the Nage geothermal area east of
Mt Inerie, previously identified by thermal imagery (Urai et
al., 2002). This suggests that this is an area worthy of
further investigations for more detailed structural studies
and thermal observations. The shaded relief DEM product
also reveals the presence of minor cones in a north-south
alignment north of Mt Inerie, as shown in Figure 14 b, and
at a finer scale in Figure 15. Two areas are recommended to
undertake more detailed LiDAR DEM and thermal camera
observations, areas A (25 km2) and B (24 km2) as marked
in Figure 15. Higher resolution LiDAR deployed in a
ground return mode, should facilitate more detailed
structural features such as fractures and fault lines. Also
airborne thermal camera with a higher spatial resolution
also offers the potential to detect the hydrothermal
emissions from fumaroles of limited dimensions.
5 Acknowledgements
This study was financially supported by the Geothermal
Capacity Development Programme Indonesia-Netherlands
(GEOCAP). The ASTER L2 data products were retrieved
from the online Data Pool, courtesy of the NASA Land
Processes Distributed Active Archive Center (LP DAAC),
USGS/Earth Resources Observation and Science (EROS)
Center, Sioux Falls, South Dakota,
https://lpdaac.usgs.gov/data_access/data_pool. The authors
would also like to thank the Indonesian Geological Agency,
Bandung for supplying a hardcopy map of the geothermal
potential areas of Nusa Tenggara Timur.
6 References
Adams J.B. and Filice, A.L., (1967). “Spectral reflectance
0.4 to 2.0 microns of silicate rock powders”, Journal of
Geophysical Research, 72, pp. 5705–5715.
Aswin, D and Nanlohy, (2002), “Characteristic of
hydrothermal alteration minerals on MT-1 and MT-2 wells,
Mataloko, central Flores, East Nusatenggara, Indonesia by
using short-wave infrared reflectance spectroscopy”,
Bulletin of Geol. Surv. Japan, vol. 53, pp. 323-328.
Baldridge, A. M., S.J. Hook, C.I. Grove and G. Rivera,
2009. “The ASTER Spectral Library Version 2.0,” Remote
Sensing of Environment, vol 113, pp. 711-715.
Crowley, J.K., Brickley, D.W. and Rowan, L.C. (1989),
“Airborne imaging spectrometer data of the Ruby
Mountains, Montana: mineral discrimination using relative
absorption band-depth images”, Remote Sensing of
Environment, 29, pp. 121–134.
Florinsky, I.V. (2012), “Digital Terrain Analysis in soil
science and geology”, Elservier, Amsterdam, First Ed.,
2012, ISBN 978-0-12-385036-2
Hunt, G.R. and Ashley, R.P. (1979), “Spectra of altered
rocks in the visible and near infrared”, Economic Geology,
v. 74, pp. 1613–1629.
Kratt, C., Calvin, W., and Coolbaugh, M., (2006),
“Geothermal exploration with Hymap hyperspectral data at
Brady–Desert Peak, Nevada”, Remote Sensing Environ.,
Vol. 104, pp. 313-324.
Littlefield, E.F. and Calvin, W.M., (2014), “Geothermal
exploration using imaging spectrometer data over Fish
Lake Valley, Nevada”, Remote Sensing Environ., Vol. 140,
pp. 509-518.
Lyon, R.J.P., and Burns, E.A. (1963), “Analysis of rocks
and minerals by reflected infrared radiation”, Economic
Geology, 58, pp274–284.
Muraoka, H., Nasution, A., Urai, M., Takahashi, M.,
Takashima, I., Simanjuntak, J., Sundhoro, H., Aswin, D.,
Nanlohy, F, Sitorus, K., Takahashi, H., and Koseki, T.,
(2002), “Tectonic, volcanic and stratigraphic geology of the
Bajawa geothermal field, central Flores, Indonesia,”
Bulletin of Geol. Surv. Japan, vol. 53, pp.109-138.
Urai, M., Muraoka, H., and Nasution, A., (2002), “Satellite
remote sensing data and their interpretations for geothermal
application: A case study on the Ngada District, central
Flores, Indonesia.”, Bulletin of Geol. Surv. Japan, vol. 53,
pp. 99-108.
Vincent, R.K. and Thomson, F. (1972), “Spectral
compositional imaging of silicate rocks,” Journal of
Geophysical Research, 77, 14, pp2465–2472.
Vincent, R.K, Rowan, L.C., Gillespie, R.E. and Knapp, C.,
(1975), “Thermal-infrared spectra and chemical analyses of
twenty-six igneous rock samples”, Remote Sensing of
Environment, 4: 199-209. International Geoscience and
Remote Sensing Symposium (IGARSS), 9–13 July. 3p.