lloyd's: the specialist insurance market/media/files/news-and-insight/news-and... · glenn...
TRANSCRIPT

© Lloyd’s 1
< Picture to go here >
© Lloyd’s 1
Lloyd’s : The world’s specialist insurance market Meet The Market – San Francisco
Glenn Dorr, Northeast Director, Lloyd’s

© Lloyd’s 2 © Lloyd’s 2
2
2
1. What is Lloyd’s?
2. What makes us unique?
3. Lloyd’s in the US

© Lloyd’s 3
What is Lloyd’s?

© Lloyd’s 4 © Lloyd’s 4
The best known, least
understood brand in
insurance

© Lloyd’s 5
Lloyd’s key characteristics Lloyd’s is a market,
not a company
We have a long
history of helping clients
manage risk
taking, dating
back to 1688
The Lloyd’s
market insures
complex and
specialist risks
London based
international
business
Lloyd’s expertise is based on 327
years of experience and a Performance
Management Directorate that oversees
responsible risk taking
Regulated by the
Prudential
Regulatory
Authority (PRA) and
the Financial
Conduct Authority
(FCA)
Products are
distributed
through
brokers and
coverholders
Lloyd’s key characteristics

© Lloyd’s 6
The Lloyd’s market: 58 managing agents manage 96 syndicates
A marketplace of
independent
businesses
Combined
experience and
expertise deliver
risk transfer
solutions globally

© Lloyd’s 7
96
syndicates of specialist
underwriting
expertise
3872
327 years of
underwriting
experience
200 countries and
territories for over…
219 brokers
bringing business
from…
coverholders offering a local route
to Lloyd’s
Footprint of the business
© Lloyd’s 8
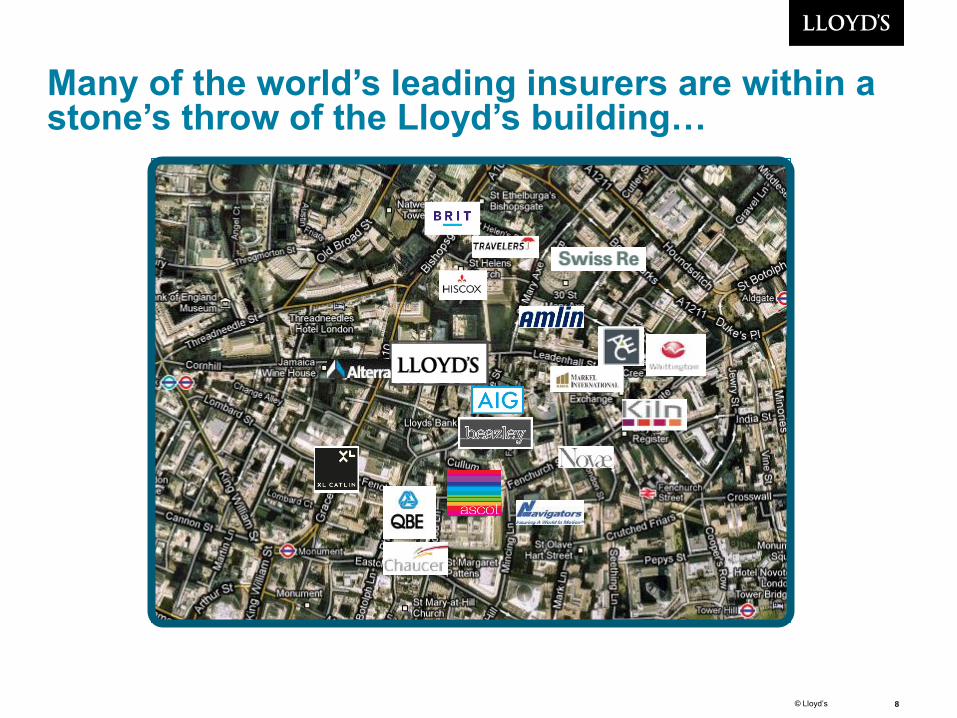
Many of the world’s leading insurers are within a stone’s throw of the Lloyd’s building…

© Lloyd’s 9
… as are many more brokers

© Lloyd’s 10
Lloyd’s + Overall London Company Market = Total 2014 income US$83.63bn
US$43.33bn
Source: IUA, London Company Market Statistics Report, October 2014
Exchange rate as at 31 December 2013 - £1 + $1.66
Overall London company market
US$40.29bn
US$43.33bn

© Lloyd’s 11
Lloyd’s syndicates backed by some of the best known names in global insurance
Lloyd’s syndicates - backed by some of the best known names in global insurance
Source: Lloyd’s Annual Report 2014
Worldwide insurance industry
24%
Bermudian insurance industry
13%
US insurance industry
22%
UK insurance industry and
other corporate
30%
Individual members
(limited liability)
9%
Individual members (unlimited liability)
2%

© Lloyd’s 12
Business streams at Lloyd’s
Business flow Capital flow
(Re)
Insured Retail
broker
Coverholder/
Wholesale
broker
Members
Corporate and
Non-corporate
Corporation
of Lloyd’s
58
Managing
agents
96
Syndicates
Lloyd’s
broker
Reinsurance broker

© Lloyd’s 13
Lloyd’s firsts
Motorcar Terrorism Aviation Commercial space flight
Lloyd's firsts

© Lloyd’s 14
…and an appetite for unusual risks requiring innovative solutions

© Lloyd’s
Lloyd’s Chain of Security
Lloyd’s unique capital structure, often referred to as the Chain of Security, provides excellent financial security to policyholders and capital efficiency to members.
Several
assets
First
link
Syndicate level assets
$70,417m • Members’ premium trust funds and other
assets held in trust at syndicate level.
• All premiums received are held in trust.
• Include international regulatory deposits and
trust funds.
Second
link
Members’ funds at
Lloyd’s
$24,498m
• Each member must provide sufficient capital
to support their underwriting.
• Amounts required are calculated through
syndicate individual capital assessment (ICA).
• Funds are held in trust for the benefit of
policyholders.
Mutual
assets
Third
link
Central assets
$5,237m
• Available to meet any valid claim that cannot
be met from a member’s resources in the
first two links.
• Include the Central Fund, funded by
members’ annual contributions and funds
issued by the Corporation of Lloyd’s
Source: Lloyd’s Annual Report 2014
© Lloyd’s 16
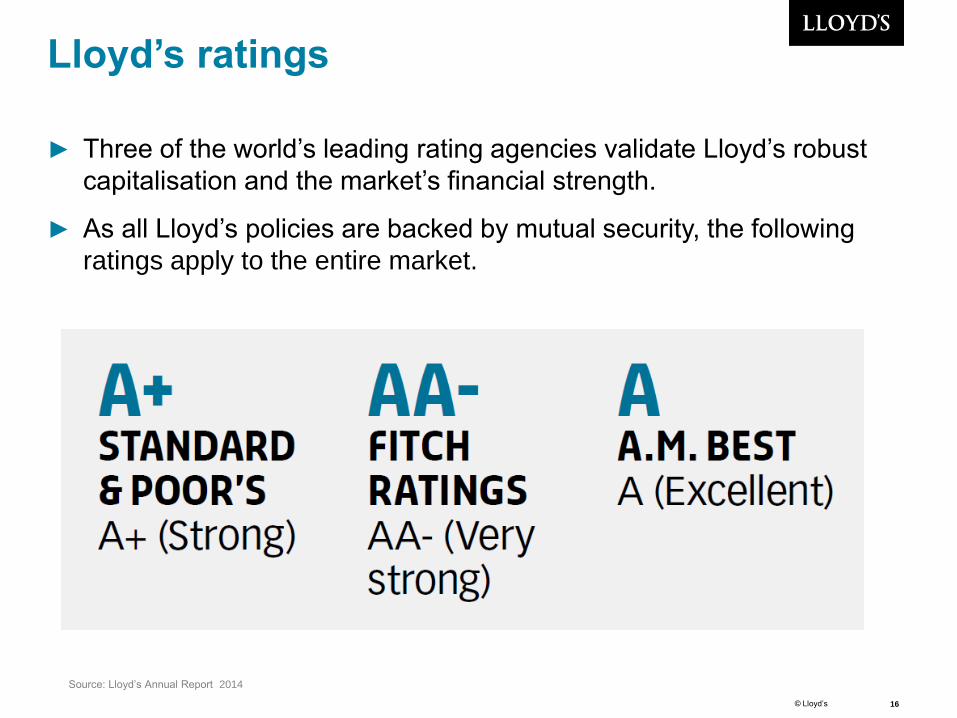
Lloyd’s ratings
► Three of the world’s leading rating agencies validate Lloyd’s robust
capitalisation and the market’s financial strength.
► As all Lloyd’s policies are backed by mutual security, the following
ratings apply to the entire market.
Source: Lloyd’s Annual Report 2014
© Lloyd’s 17
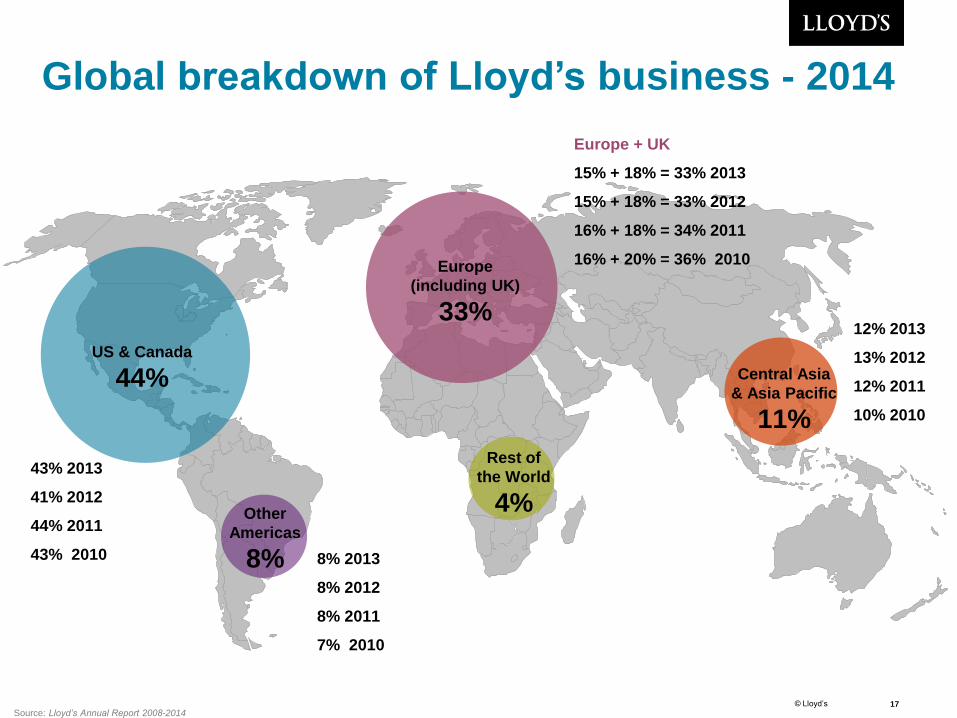
Europe
(including UK)
33%
Other
Americas
8%
Central Asia
& Asia Pacific
11%
Rest of
the World
4%
US & Canada
44%
43% 2013
41% 2012
44% 2011
43% 2010
12% 2013
13% 2012
12% 2011
10% 2010
8% 2013
8% 2012
8% 2011
7% 2010
Europe + UK
15% + 18% = 33% 2013
15% + 18% = 33% 2012
16% + 18% = 34% 2011
16% + 20% = 36% 2010
Source: Lloyd’s Annual Report 2008-2014
Global breakdown of Lloyd’s business - 2014

© Lloyd’s 18
18
18
Lloyd’s in the US

19
Lloyd’s in the US Regional structure
Locations
1) Atlanta, GA
2) Boston, MA
3) Chicago, IL
4) Frankfurt, KY
5) Los Angeles, CA
6) New York, NY
7) US Virgin Islands
Hank Watkins
President, NA
New York
Joseph Gunset
General Counsel, US
New York
Kiran Bhovan
Senior Manager
Comms, NA
London
Pat Talley
Central Regional
Director
Frankfort, KY/
Chicago
Rich Magrath
Western Regional
Director
Los Angeles
19
1
7
13
3 10
10
15
11 2
9
3
15
11
34
6
22
24 39
23
16
1 11
4
5
64 15 11
6
-
8
-
5
28
4
39
5 23
65
23 14
-
19
1
7
13
3 10
10
15
11 2
9
3
15
11
34
6
22
24 39
23
16
1 11
4
5
64 15 11
6
-
8
-
5
28
4
39
5 23
65
23 14
- Glenn Dorr
Northeast
Regional Director
Boston
Rodney Smith
Southeast Regional
Director
Atlanta
Hank Feuerzeig
General
Representative
US Virgin Islands 33 colleagues

© Lloyd’s 20
Breakdown of Lloyd’s 2014 total US business

21
Total US Market vs Lloyd’s - 2014 Premium by industry segment - 2014
Note: 1) The figures above for the market include only US based entities plus Lloyd’s figures
2) The above analysis does not include exempt business
3) Market RI growth due to National Indemnity results now include loss portfolio and quota share
agreements with affiliated GIECO companies, all effective 1/1/2014
Source: Market Intelligence based on: Lloyd’s US reporting system, RAA Reinsurance Underwriting report, SNL Financial, (April 2015)
US (Re)Insurance Market Lloyd’s
US$ 67.9bn 2013 vs 2014
+44%
US$ 521bn 2013 vs 2014
+4%
US$ 37.6bn 2013 vs 2014
+9%
US$ 5.3bn 2013 vs 2014
+3%
US$ 192m 2013 vs 2014
-10%
US$ 8.1bn 2013 vs 2014
+15%
Reinsurance Excess & Surplus lines Licenced

© Lloyd’s 22 Source: Market Intelligence based on SNL financial and Lloyd’s US reporting system (May 2014)
Property
Energy
Liability
Prop + Liab
2014 Lloyd’s Market Share of E&S Premium by State
30% 20% 22% 18% 26% 22% 25% 22% 13% 37%
Lloyd’s E&S – Top 10 states
Please Note: These figures do not include Reinsurance premiums
Premiums are in GSP (Gross Signed Premiums) as registered by the US reporting system in 2013
Lloyd’s share of the E&S market in TX, CA, FL, LA, NJ, MA, SC and GA ranges
from 20 – 37%. Catastrophe capacity provided by Lloyd’s fills a critical need in
these states.
2014 G
SP
( U
SD
m)

© Lloyd’s 23
794
831
894
1,032
1,190
1,204
1,486
1,763
4,678
8,166
Source: Market Intelligence based on: SNL Financials, (April 2015) and U.S Reporting System (April 2015)
Premiums are in US$ m and represent coverage on US exposures only
E&S - Lloyd’s vs Competitors - 2014
15%
-3%
8%
11%
-2%
4%
6%
20%
48%
-5%
2014 Loss
Ratio
49%
72%
59%
52%
49%
45%
44%
65%
43%
58%
% change
from 2013
Please Note: Loss ratios are on a calendar year basis for 2014

© Lloyd’s 24
A five year view of Lloyd’s performance
US$m 2010 2011 2012 2013 2014
Gross written
premiums
34,759
£22,425
37,339
£23,337
40,025
£25,173
39,959
£25,615
41,717
£25,283
Combined ratio 93.3% 106.8% 91.1% 86.8% 88.1%
Investment return 1,950
£1,258
1,528
£955
2,084
£1,311
1,309
£839
1,724
£1,045
Result before tax 3,446
£2,195
(800)
(£516)
4,517
£2,771
5,320
£3,205
4,931
£3,161
Return on capital
(pre-tax) %
12.1 (2.8) 14.8 16.2 14.7
Source: Lloyd’s Annual Report 2014

© Lloyd’s 25
Benefits of the Lloyd’s market
► Strong security
► Ability of syndicated market to assume very large risks
► Spread of expertise in subscription market
► Contract certainty (also diminishes brokers’ E&O risk)
► Willingness to consider risks that other markets will not
► Continuity of coverage
► Speed of decision making