life science competitiveness indicators, 2018 · the uk has one of the strongest and most...
TRANSCRIPT

Life Science Competitiveness Indicators
May 2018

Life Science Competitiveness Indicators 2
Ministerial foreword
I am pleased to introduce the fourth annual Life Science Competitiveness Indicators report. Since last year’s publication, the UK has generated approximately £70.3bn in annual turnover, with a total of 5,700 new jobs across the sector, and today, the UK has one of the strongest and most productive health and life sciences industries in the world. In 2017, we published the first Life Sciences Sector Deal building on the ambitious Life Sciences Industrial Strategy paper. The Deal committed nearly £500 million of Government investment into UK life sciences, backed by investment from 25 organisations across the sector, that will build on the sector’s strengths, help to secure thousands of jobs and ensure that new innovative medicines and technologies are created in the UK.
Now, as we move closer to exiting the European Union, Government remains focussed and committed to identifying new opportunities presented to maintain and strengthen this position.
This report includes a set of metrics which displays UK performance compared to a range of comparator countries. In 2017, the UK received the highest level of life science foreign direct investment projects in Europe, the highest in the past 7 years and only second to the United States. The UK also continues to attract significant private equity investment, with over €750m invested in 67 UK projects in 2016. I am pleased to say that the UK’s science base remains a key strength, punching well above its weight with 12% of total life sciences academic citations and 18% of the most-cited publications, the second highest share above China, Germany and Canada. The UK also remains a key location for clinical trials, remaining steady at a 3.1% share of patients recruited to global studies.
The sector continues to grow and Government has strong ambitions that more can be done. As part of the sector deal, we will increase investment in R&D to 2.4 per cent of GDP by 2027 and 3 per cent over the longer term – delivering an estimated increase of £80bn over the next 10 years. We have also set out plans for the Health Research Authority to speed up approvals for clinical trials.
Through these commitments, we are ensuring that the UK remains a top tier global hub and the home of clinical research and medical innovation. Our ambition remains for the UK to be the best place in the world to develop and launch innovative medicines, technologies and diagnostics, for the benefit of patients and boosting growth.
Lord Henley
Parliamentary Under Secretary of State of the Department for Business, Energy and Industrial Strategy
Lord O’Shaughnessy
Parliamentary Under Secretary of State of the Department of Health and Social Care

Life Science Competitiveness Indicators 3
Introduction
This Office for Life Sciences (OLS) report brings together a set of competitiveness indicators on the life science environment in the UK and presents how these compare internationally. This is the fourth report and is published on the same day as another annual OLS publication – Strength & Opportunity – which provides detailed analysis of the life science sector in the UK.
The 2018 publication seeks continuity with the 2017 publication through minimal changes, whilst aiming to set the data in context. Indicators have been reorganised into chapters aligned to the Life Sciences Industrial Strategy. A new summary aims to draw out year-on-year and longer term trends alongside international comparisons. The choice of comparator countries has been reviewed for each indicator, balancing consistency across similar indicators with continuity from previous years. Data availability restricts comparator country choice for some indicators.
The choice of indicators was informed by engagement with life science sector stakeholders. There were no amendments to the construction of most indicators, with the exception of:
• Total industry R&D spend has been presented alongside pharmaceutical industry R&D spend to set in context (chart 3).
• The two academic citations indicators have been reintroduced following the first refresh of the underlying source data since 2012 (charts 6A & 6B).
• The previous NICE ‘dashboard’ has been redesigned to focus on the key messages – speed and volume of NICE Technology Appraisals– and improve readability (chart 14).
• The uptake of new medicines indicators have been presented in a new style to improve readability (charts 15A & 15B).
The web links to public sources along with caveats, as appropriate, are provided for each indicator. The specific data used in this publication can be found in the accompanying spreadsheet. In the few instances where data is sourced commercially or obtained directly from the organisation holding it, the supplier is clearly credited but no web link is given.
OLS would like to thank all those who have contributed to these indicators, or supplied data for this publication.

Life Science Competitiveness Indicators 4
Table of contents
Reinforcing the UK Science Offer 7Chart 1: Government spend on health research and development 8
Chart 2: Non-industry spend on research and development 9
Chart 3: Pharmaceutical industry spend on research and development in the UK 10
Chart 4: Share of patients recruited to global studies (all trial phases) 11
Chart 5: Time from core package received to first patient enrolled in country (all trial phases) 12
Chart 6A: Share of life sciences academic citations 13
Chart 6B: Share of top 1% (most cited) life sciences academic citations 14
Growth and Infrastructure 15Chart 7A: Number of people employed in manufacture of basic pharmaceuticals and pharmaceutical products 16
Chart 7B: Number of people employed in manufacture of medical technology products 17
Chart 8: Gross Value Added for pharmaceutical manufacturing 18
Chart 9A: Global exports of pharmaceutical products 19
Chart 9B: Global exports of medical technology products 20
Chart 10A: Global imports of pharmaceutical products 21
Chart 10B: Global imports of medical technology products 22
Chart 11A: Life sciences foreign direct investment projects 23
Chart 11B: Life sciences foreign direct investment - capital expenditure 24
Chart 12A: Share of global life science Initial Public Offerings (IPOs) in 2017 25
Chart 12B: Amount raised in global life science Initial Public Offerings (IPOs) in 2017 (where known) 26
Chart 13A: Total private equity investment in biotech and healthcare 27
Chart 13B: Number of companies receiving private equity investment in biotech and healthcare 28
NHS collaboration 29Chart 14: Speed and volume of NICE Technology Appraisals 30
Chart 15A: Uptake of new medicines - NICE approved 31
Chart 15B: Uptake of new medicines - Non-NICE reviewed 32
Skills 33Chart 16: Percentage of graduates from tertiary education graduating from Natural Sciences, Mathematics and Statistics programmes, both sexes (%) 34
Regulation 35Chart 17: Instances where MHRA is in lead role in EU regulatory procedure 36

Life Science Competitiveness Indicators 5
Overview: Performance of UK Life Science Sector and Contribution to UK Economy
Chapter # Indicator Current value (year) Current rank amongst selected countries
Reinforcing the UK Science Offer
1 Government spend on health research and development $3.1bn (2015) 2nd of 13
2 Non-industry spend on research and development £3.6bn (2015/16) N/A
3 Pharmaceutical industry spend on research and development in the UK £4.1bn (2016) N/A
4 Share of patients recruited to global studies (all trial phases) 3.1% (2016) 4 of 10
5 Time from core package received to first patient enrolled in country (all trial phases) 202 days (2016) 7 of 10
6A Share of life sciences academic citations 12% (2014) 2 of 19
6B Share of most cited (top 1%) life sciences academic citations 18% (2014) 2 of 19
Growth & Infrastructure
7A Number of people employed in manufacture of basic pharmaceutical products and pharmaceutical preparations 40,500 (2016) 6 of 12
7B Number of people employed in manufacture of medical technology products 40,300 (2016) 4 of 12
8 Gross Value Added for pharmaceutical manufacturing €9.2bn (2015) 6 of 11
9A Global exports of pharmaceutical products $33.3bn (2016) 5 of 18
9B Global exports of medical technology products $3.8bn (2016) 12 of 18
10A Global imports of pharmaceutical products $33.4bn (2016) 4 of 18
10B Global imports of medical technology products $5.1bn (2016) 8 of 18
11A Life sciences foreign direct investment projects 60 (2017) 2 of 15
11B Life sciences foreign direct investment – capital expenditure £750m (2017) 4 of 15
12A Share of global life science Initial Public Offerings (IPOs) 1% (2017) 11 of 20
12B Initial Public Offerings (IPOs) in life sciences – amount raised (where known) £22m (2017) 16 of 20
13A Private equity investment – total investment €760m (2016) 3 of 12
13B Number of companies receiving private equity investment 67 (2016) 5 of 12

Life Science Competitiveness Indicators 6
Overview: Competitiveness of UK Life Science Environment Economy
Chapter # Indicator Current value (year) Current rank amongst selected countries
NHS collaboration
14 Speed and volume of NICE Technology Appraisals – time from Marketing Authorisation to first NICE output 6.0 months (2017/18) N/A
14 Speed and volume of NICE Technology Appraisals – time from Marketing Authorisation to final NICE guidance 10.2 months (2017/18) N/A
15A Uptake of new medicines – NICE approved (relative uptake compared against average comparator uptake 3 years after launch) 70% (2012 to 2016) N/A
15B Uptake of new medicines – non-NICE reviewed 56% (2012 to 2016) N/A
Skills 16 Percentage of graduates from tertiary education graduating from Natural Sciences, Mathematics and Statistics programmes, both sexes (%) 13% (2015) 1 of 14
Regulation 17 Instances where MHRA is in lead role in EU regulatory procedure (%) 25% (2016) N/A

Reinforcing the UK Science Offer

Life Science Competitiveness Indicators 8
Chart 1: Government spend on health research and development
20162015201420132012
Spend ($m)
USA UKGermany
JapanCanada
SpainFrance Italy
NetherlandsSweden
BelgiumIreland
0
500
1,000
1,500
2,000
2,500
3,000
3,500
4,000
29,000
31,000
33,000
Source: OECD Research & Development statisticshttp://stats.oecd.org/index.aspx?r=227797Notes: Government budget appropriations or outlays on R&D Health
• UK government spend on health R&D was $3.1bn in 2015, an increase of a fifth from 2012.
• The UK maintained its position as country with the second highest level of expenditure on health R&D behind the US.
• UK spend is more than double that of its competitors, with the exception of the USA.
• Expenditure in the USA remained at an order of magnitude of over 10 larger than expenditure in comparator countries.

Life Science Competitiveness Indicators 9
Chart 2: Non-industry spend on research and development
AMRC member charities
Medical Research Council
National Institute for Health Research
£1,594m45%
£1,037m29%
£928m26%
Sources: AMRC , MRC and NIHR annual reports 2016http://www.amrc.org.uk/publicationshttps://www.mrc.ac.uk/publications/browse/?keywords=annual+report&searchSectionID=4BC7DBBA-1972-4E8B-898B31A1B8A6EEB0https://www.nihr.ac.uk/about-us/documents/NIHR-Annual-Report-2015-16.pdfNote: Spend by health departments in Scotland, Wales and Northern Ireland not illustrated
• In 2015/16, AMRC charities contributed 45% of non-industry spend on R&D, with the MRC and NIHR contributed 26% and 29% respectively.
• Expenditure by AMRC member charities increased from £1,443m in 2015 to £1,594m in 2016.
• All types of non-industry R&D spend increased between 2012/13 and 2015/16, with:
– AMRC charities’ expenditure increasing by 23%
– MRC spend increasing by 21%
– NIHR spend increasing by 8%
• The relative contribution of each organisation has remained roughly constant since 2012/13.

Life Science Competitiveness Indicators 10
Chart 3: Pharmaceutical industry spend on research and development in the UK
Spend (£bn)
2016201520142013201220112010200920082007200620050
3,000
6,000
9,000
12,000
15,000
18,000
21,000
24,000
Total industry UK R&D spendPharma industry UK R&D spend
• Pharmaceutical industry UK spend on R&D in 2016 was £4.1bn.
• Pharmaceutical industry R&D spend represents a fifth of total industry R&D spend in the UK.
• Between 2005 and 2011, pharmaceutical industry UK R&D spend grew steadily to a peak of £4.9bn in 2011, followed by a decline to £3.8bn in 2014. Spend grew by 8% in 2015 and stabilised in 2016.
• Pharmaceuticals’ share of total industry R&D spend in the UK increased from 25% to 29% between 2005 and 2010. Pharmaceuticals’ share decreased from 29% to 19% between 2010 and 2016 as a decline in pharma spend (by 23%) coincided with a substantial increase in total industry spend. (by 17%).
Source: UK Business Expenditure on Research and Development (BERD) 2016 survey, Office for National Statistics (ONS)https://www.ons.gov.uk/economy/governmentpublicsectorandtaxes/researchanddevelopmentexpenditure/datasets/ukbusinessenterpriseresearchanddevelopmentNotes: Data is not available for medical technology industry spend

Life Science Competitiveness Indicators 11
Chart 4: Share of patients recruited to global studies (all trial phases)
20162015201420132012
Share of patientsrecruited globally (%)
USAGermany
Canada UKSpain
France ItalyAustralia
Netherlands
Switzerland0
1
2
3
4
5
6
25
30
35
40
45
• The UK’s share of patients recruited to global studies in 2016 was 3.1%, slightly falling from a peak of 4.2% in 2015.
• The UK ranks fourth, behind the USA, Germany and Canada. The USA consistently outstrips other comparator countries with a share of 32.3% in 2016.
• From the EUdraCT database, the UK’s share of EU study applications in 2017 remained broadly constant at 28%, compared with 29% in 2016.
• The number of UK clinical trials of investigational medicinal products increased from 978 in 2016 to 1000 in 2017. The number of first in human trials increased from 69 in 2016 to 104 in 2017.
• From the NIHR, the number of participants recruited to commercial contract studies increased from 20,500 in 2012/13 to 34,648 in 2015/16, through the support of the NIHR Clinical Research Network.
Sources: Clarivate Analytics; EudraCT database; Medicines Healthcare Products Regulatory Agency; National Institute for Health Research (NIHR)
Life Science Competitiveness Indicators 12
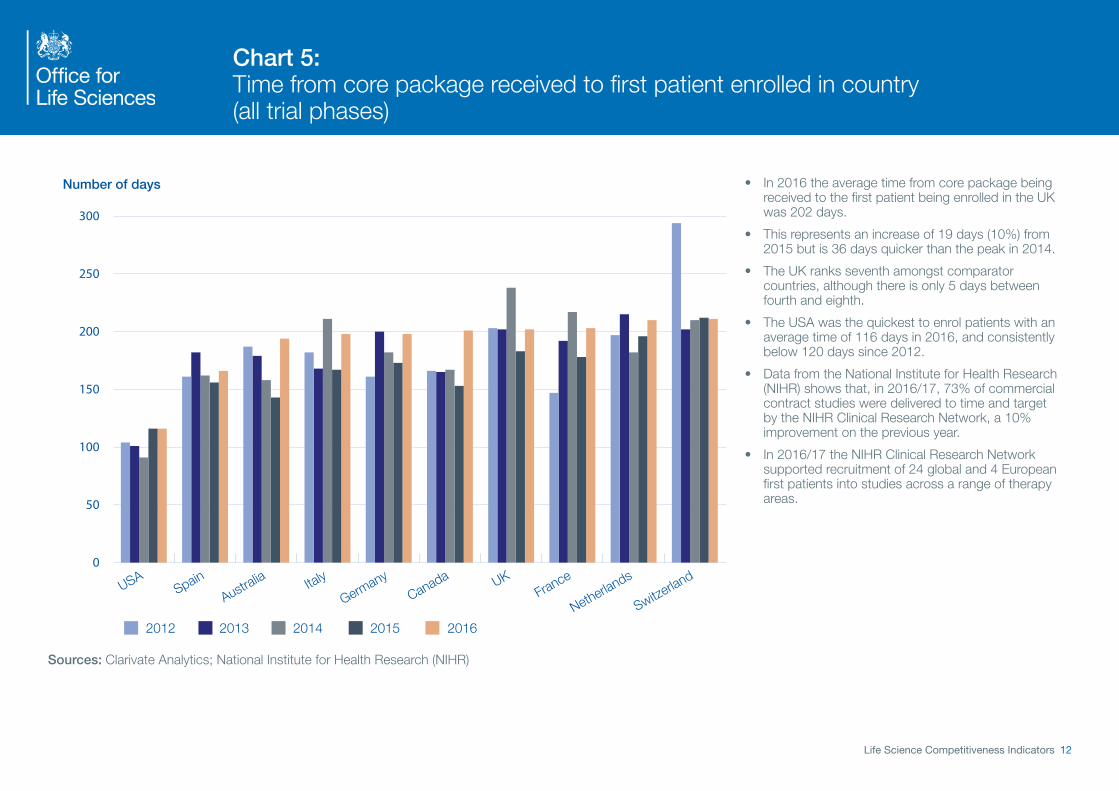
Chart 5: Time from core package received to first patient enrolled in country (all trial phases)
20162015201420132012
Number of days
USASpain
Australia Italy
GermanyCanada UK
France
Netherlands
Switzerland
0
50
100
150
200
250
300
• In 2016 the average time from core package being received to the first patient being enrolled in the UK was 202 days.
• This represents an increase of 19 days (10%) from 2015 but is 36 days quicker than the peak in 2014.
• The UK ranks seventh amongst comparator countries, although there is only 5 days between fourth and eighth.
• The USA was the quickest to enrol patients with an average time of 116 days in 2016, and consistently below 120 days since 2012.
• Data from the National Institute for Health Research (NIHR) shows that, in 2016/17, 73% of commercial contract studies were delivered to time and target by the NIHR Clinical Research Network, a 10% improvement on the previous year.
• In 2016/17 the NIHR Clinical Research Network supported recruitment of 24 global and 4 European first patients into studies across a range of therapy areas.
Sources: Clarivate Analytics; National Institute for Health Research (NIHR)

Life Science Competitiveness Indicators 13
Chart 6A: Share of life sciences academic citations
20142013201220112010
Share of citations (%)
USA UKChina
GermanyCanada Italy
France
NetherlandsSpain
Japan
Switzerland
Republic of Korea0
2
4
6
8
10
12
14
36
38
40
42
44
• In 2014, the UK’s share of life science academic citations was 12%, with it ranking second amongst comparator countries, behind the USA.
• The UK’s share remained constant at 12% from 2005 to 2014.
• Most countries’ share has remained steady from 2005 to 2014 with the exception of:
– USA, whose share declined from 48% to 39% but remains ranked first;
– China, whose share rose from 3% to 11% and now ranks third.
• Countries with a share smaller than 3% include: Brazil, Sweden, India, Belgium, Singapore, Ireland and Russia.
Source: International Comparative Performance of the UK Research Basehttps://www.gov.uk/government/publications/performance-of-the-uk-research-base-international-comparison-2013

Life Science Competitiveness Indicators 14
Chart 6B: Share of top 1% (most cited) life sciences academic citations
20142013201220112010
Share of citations (%)
USA UKGermany
ChinaCanada
France Italy
NetherlandsSpain
SwitzerlandSweden
Japan0
5
10
15
20
50
55
60
• Share of top 1% of academic citations is an indicator of the quality of research.
• In 2014, the UK’s share of the top 1% of life sciences academic citations was 18%, with it ranking second amongst comparator countries, behind the USA.
• The UK’s share increased from 15% to 20% between 2005 and 2012, followed by a decline to 18% in 2014.
• Most countries’ share has remained steady from 2005 to 2014 with the exception of:
– USA, whose share declined from 62% to 55% but remains ranked first;
– China, whose share rose from 2% to 10% and now ranks fourth, behind Germany.
• Countries with a share smaller than 4% are: Belgium, the Republic of Korea, Brazil, India, Singapore, Ireland and Russia.
Source: International Comparative Performance of the UK Research Basehttps://www.gov.uk/government/publications/performance-of-the-uk-research-base-international-comparison-2013

Growth and Infrastructure

Life Science Competitiveness Indicators 16
Chart 7A: Number of people employed in manufacture of basic pharmaceuticals and pharmaceutical products
GermanyFrance Italy
Switzerland
Spain UKBelgium
IrelandAustria
Sweden
NetherlandsFinland
Number employed
20162015201420132012
0
20,000
40,000
60,000
80,000
100,000
120,000
140,000• Employment in pharmaceutical manufacturing in the
UK was 40,000 people in 2016. This is an increase of 3,000 from 2014, following a drop of 13,000 since 2012.
• In 2016, the UK ranked fifth for pharmaceutical employment.
• Germany consistently had the highest employment among selected comparator countries throughout 2012 to 2016.
• Note there is limited data for France, UK, Ireland and Finland in specific years due to unavailability from Eurostat.
• OLS’s ‘Strength & Opportunity 2017’ publication provides a more complete and up-to-date picture of trends in UK life science employment.
Source : Eurostat - Data Explorer Annual Detailed Enterprise Statistics for Industryhttp://appsso.eurostat.ec.europa.eu/nui/show.do?dataset=sbs_na_ind_r2&lang=enNotes: Not all years are available for each country

Life Science Competitiveness Indicators 17
Chart 7B: Number of people employed in manufacture of medical technology products
20162015201420132012
Number employed
Germany ItalyFrance UK
Ireland
SwitzerlandSpain
NetherlandsAustria
SwedenBelgium
Finland0
15,000
30,000
45,000
60,000
75,000
180,000
195,000
210,000
Source: Eurostat - Data Explorer Annual Detailed Enterprise Statistics for Industryhttp://appsso.eurostat.ec.europa.eu/nui/show.do?dataset=sbs_na_ind_r2&lang=enNotes: Med Tech chart is compiled from figures for 266 (Manufacture of irradiation, electromedical and electrotherapeutic equipment) + 325 (Manufacture of medical and dental instruments and supplies)
• Employment in medical technology manufacturing in the UK was 40,000 people in 2016. Employment has remained steady since 2013, following a drop of 5,000 between 2012 and 2013.
• In 2016, the UK ranked fourth for med tech employment.
• Germany consistently had the highest employment among selected comparator countries throughout 2012 to 2016.
• These data are known to be underestimates as the categories do not capture the full breadth of medical technology. They are used to ensure like-for-like international comparisons.
• OLS’s ‘Strength & Opportunity 2017’ publication provides a more complete and up-to-date picture of UK life sciences trends.

Life Science Competitiveness Indicators 18
Chart 8: Gross Value Added for pharmaceutical manufacturing
Switzerland
GermanyFrance
Ireland Italy UKSpain
Belgium
NetherlandsAustri
aFinland
Gross Value Added (€m)
20162015201420132012
0
5,000
10,000
15,000
20,000
25,000
30,000
Source: Eurostat - Data Explorer National Accounts aggregates by industryhttp://appsso.eurostat.ec.europa.eu/nui/show.doNotes: Category used is “Manufacture of basic pharmaceuticals and pharmaceutical products”. Data is in chain linked volumes (2005)
• Gross Valued Added (GVA) measures the contribution to the economy of an industry. It is calculated as either outputs minus inputs, or revenue (turnover) minus costs.
• In the UK, the GVA for pharmaceutical manufacturing was broadly flat between 2014 and 2015 at £9.2bn.
• UK life sciences GVA represents 7.3% of UK total manufacturing GVA and 0.7% of the GVA for the UK economy as a whole.
• For the latest year of data available, UK GVA ranked sixth.
• Switzerland and Germany continue to be two European countries with the most productive pharmaceutical manufacturing sectors.
Life Science Competitiveness Indicators 19
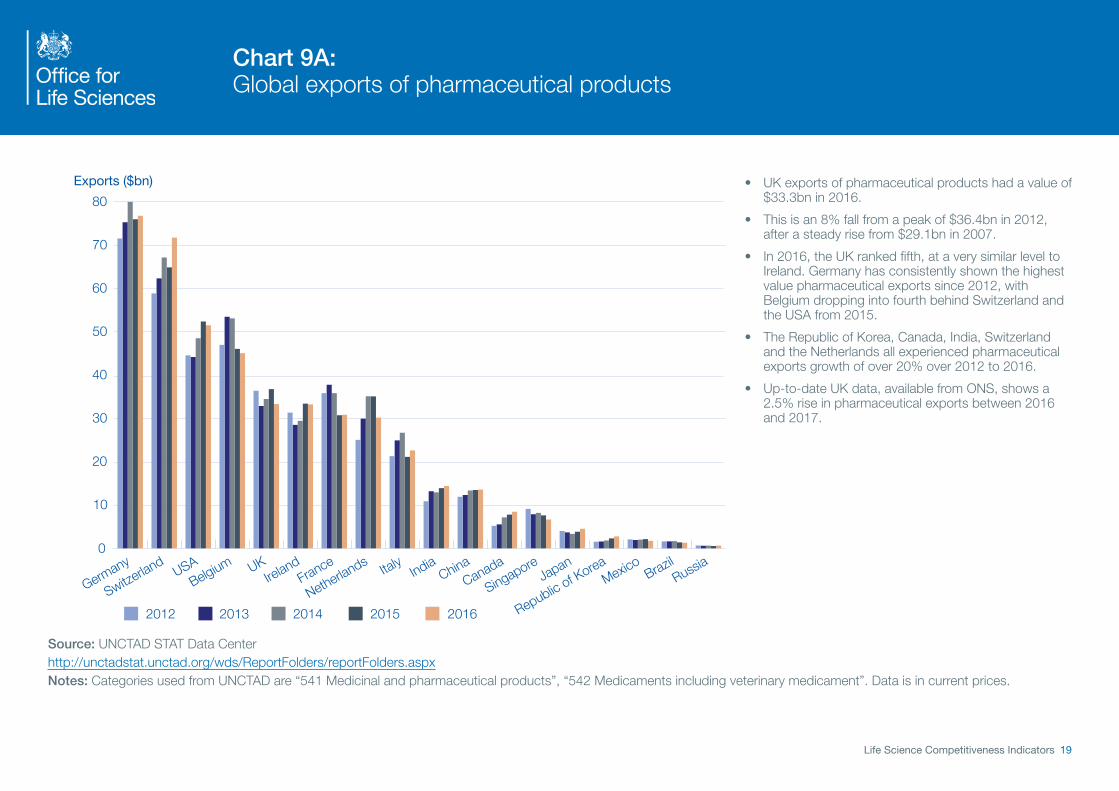
Chart 9A: Global exports of pharmaceutical products
20162015201420132012
Exports ($bn)
Germany
Switzerland USA
Belgium UKIreland
France
Netherlands Italy IndiaChina
Canada
SingaporeJapan
Republic of KoreaMexico
BrazilRussia
0
10
20
30
40
50
60
70
80• UK exports of pharmaceutical products had a value of
$33.3bn in 2016.
• This is an 8% fall from a peak of $36.4bn in 2012, after a steady rise from $29.1bn in 2007.
• In 2016, the UK ranked fifth, at a very similar level to Ireland. Germany has consistently shown the highest value pharmaceutical exports since 2012, with Belgium dropping into fourth behind Switzerland and the USA from 2015.
• The Republic of Korea, Canada, India, Switzerland and the Netherlands all experienced pharmaceutical exports growth of over 20% over 2012 to 2016.
• Up-to-date UK data, available from ONS, shows a 2.5% rise in pharmaceutical exports between 2016 and 2017.
Source: UNCTAD STAT Data Centerhttp://unctadstat.unctad.org/wds/ReportFolders/reportFolders.aspxNotes: Categories used from UNCTAD are “541 Medicinal and pharmaceutical products”, “542 Medicaments including veterinary medicament”. Data is in current prices.

Life Science Competitiveness Indicators 20
Chart 9B: Global exports of medical technology products
20162015201420132012
USA
Germany
NetherlandsChina
MexicoBelgium
JapanIreland
France
Singapore
Switzerland UK Italy
Republic of Korea
CanadaIndia
BrazilRussia
0
5
10
15
20
25
30
35
Exports ($bn) • UK exports of medical technology products had a value of $3.8bn in 2016.
• This is a slight fall (by 3%) from a peak of $4.4bn in 2014, after a steady rise from $3.5bn in 2007.
• In 2014, the UK ranked 12th out of the 18 comparative countries in value of medical technology exports. The UK had a similar level of exports to Singapore and Switzerland.
• Up-to-date UK data, available from ONS, shows a 7.4% rise in medical technology exports between 2016 and 2017.
Source: UNCTAD STAT Data Centerhttp://unctadstat.unctad.org/wds/ReportFolders/reportFolders.aspxNotes: Categories used from UNCTAD STAT are “774 Electro-diagnostic apparatus for medical science etc.” and “872 Instruments and appliances, n.e.s, for medical, etc.” Data is in current prices.

Life Science Competitiveness Indicators 21
Chart 10A: Global imports of pharmaceutical products
20162015201420132012
Imports ($bn)
USAGermany
Belgium UK
Switzerland
FranceJapan Italy
China
NetherlandsCanada
Russia BrazilIreland
Republic of KoreaMexico
India
Singapore0
20
40
60
80
100
• UK imports of pharmaceutical products had a value of $33.4bn in 2016, almost the same as UK exports at $33.3bn.
• UK pharmaceutical imports steadily increased from $20.9bn in 2007 to a peak of $34.7bn in 2014, and have since fallen slightly.
• In 2016, the UK had the fourth highest pharmaceutical imports, behind the USA, Germany and Belgium.
• The USA saw an increase of over $40bn in pharmaceutical imports between 2007 and 2016. China and Japan saw increases of $18bn and $16bn respectively during the same period, to over $20bn in 2016.
Source: UNCTAD STAT Data Centerhttp://unctadstat.unctad.org/wds/ReportFolders/reportFolders.aspx?sCS_ChosenLang=enNotes: Categories used are from UNCTAD “541 Medicinal and pharmaceutical products” “542 Medicaments including veterinary medicament”. Data is in current prices.
Life Science Competitiveness Indicators 22
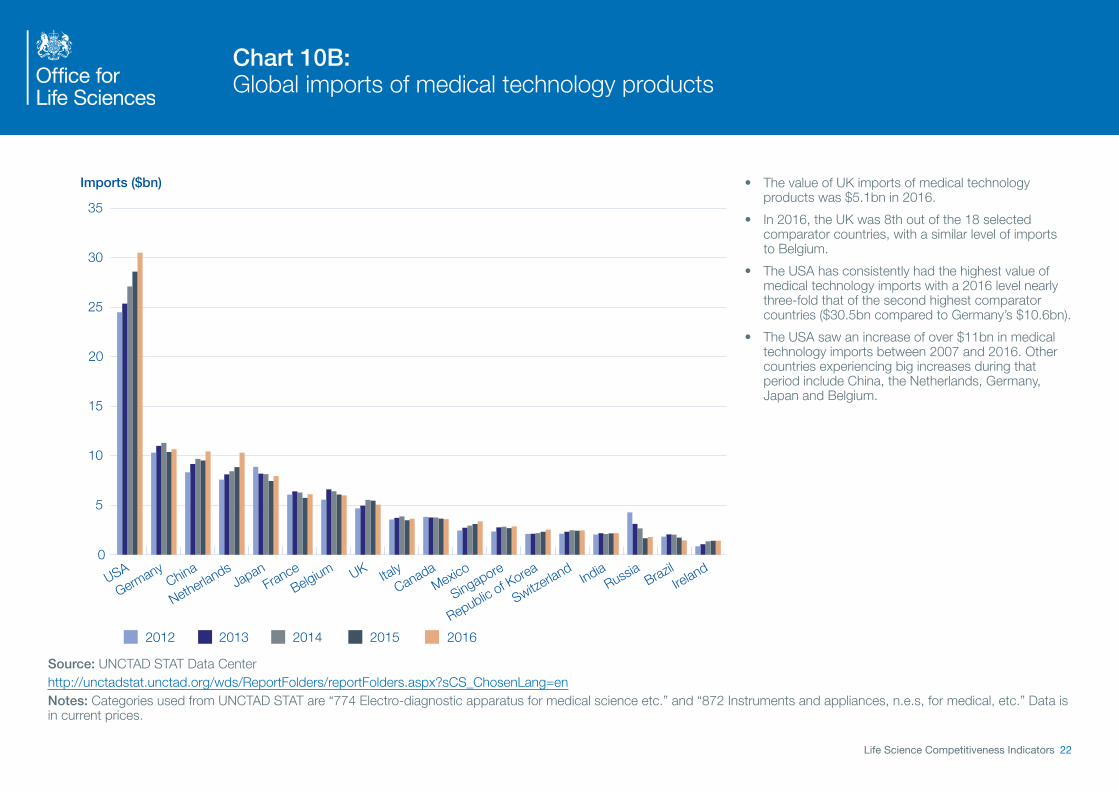
Chart 10B: Global imports of medical technology products
20162015201420132012
Imports ($bn)
USAGermany
China
NetherlandsJapan
FranceBelgium UK Italy
CanadaMexico
Singapore
Republic of Korea
Switzerland
IndiaRussia Brazil
Ireland0
5
10
15
20
25
30
35
• The value of UK imports of medical technology products was $5.1bn in 2016.
• In 2016, the UK was 8th out of the 18 selected comparator countries, with a similar level of imports to Belgium.
• The USA has consistently had the highest value of medical technology imports with a 2016 level nearly three-fold that of the second highest comparator countries ($30.5bn compared to Germany’s $10.6bn).
• The USA saw an increase of over $11bn in medical technology imports between 2007 and 2016. Other countries experiencing big increases during that period include China, the Netherlands, Germany, Japan and Belgium.
Source: UNCTAD STAT Data Centerhttp://unctadstat.unctad.org/wds/ReportFolders/reportFolders.aspx?sCS_ChosenLang=enNotes: Categories used from UNCTAD STAT are “774 Electro-diagnostic apparatus for medical science etc.” and “872 Instruments and appliances, n.e.s, for medical, etc.” Data is in current prices.

Life Science Competitiveness Indicators 23
Chart 11A: Life sciences foreign direct investment projects
Number of projects
20172016201520142013
0
20
40
60
80
100
120
140
160
USA UK China France Germany Ireland India Japan
• There were 60 life science foreign direct investment projects in the UK in 2017, the highest in the past 7 years and double the number in 2011.
• In 2017, the UK remained second for number of life sciences fDI projects, behind the USA.
• The US have consistently ranked first among selected comparator countries between 2013 and 2017, with 141 projects in 2017.
• Countries with fewer than 20 life sciences fDI projects include: Switzerland, Canada, Russia, Australia, the Republic of Korea, Italy and Sweden.
Source: fDi Markets, from The Financial Times Ltd.http://www.fdimarkets.com/explore/?p=sectorNotes: Numbers are for the year that projects were announced.

Life Science Competitiveness Indicators 24
Chart 11B: Life sciences foreign direct investment - capital expenditure
Spend in pounds (£m)
20172016201520142013
USA China Ireland UK India France Germany Japan Switzerland0
600
1,200
1,800
2,400
3,000
3,600
• The value of life sciences foreign direct investment capital expenditure in the UK was £747m in 2017, returning to 2015 levels following a dip to £296m in 2016.
• In 2017, the UK ranked fourth in value of fDI, behind the USA, China and Ireland.
• The USA life sciences foreign direct investment capital expenditure increased by 155% between 2013 to 2017, whilst during the same period China fDI expenditure decreased by 50%.
• Countries with fDI capital expenditure of less than £400m include: Australia, Russia, Italy, Canada, the Republic of Korea and Sweden.
Source: fDi Markets, from The Financial Times Ltd.http://www.fdimarkets.com/explore/?p=sectorNotes: Numbers are for the year that projects were announced.

Life Science Competitiveness Indicators 25
Chart 12A: Share of global life science Initial Public Offerings (IPOs) in 2017
China 37%USA 24%Sweden 13%Australia 6% Republic of Korea 4%India 4%France 3%Taiwan 1%Canada 1%Japan 1%UK 1%Other 9%
China37%
USA24%
Sweden13%
• In 2017, the UK had 2 life sciences Initial Public Offerings (IPOs) which equates to a 1% share.
• The UK’s share of global life science IPOs in 2016 was similar to Canada, Taiwan and Japan.
• China (including Hong Kong) had the largest global share of life science IPOs in 2017, with 37%.
• The UK’s share of global life science IPOs dropped in 2017 from 4% in 2016.
Source: S&P Capital IQhttp://www.spcapitaliq.com/Notes: Country is the country in which the IPO was launched, not the domicile of the IPO country. USA includes Over The Counter (OTC) and Pink Sheets stocks which are not traded on the stock exchanges.

Life Science Competitiveness Indicators 26
Chart 12B: Amount raised in global life science Initial Public Offerings (IPOs) in 2017 (where known)
Amount raised (£m)
USAChina
Switzerland
Sweden
Luxembourg & Brazil
Republic of KoreaIndia
FranceAustra
liaDenmark
CanadaNorway
ArgentinaJapan
Taiwan UKPakista
nTurkey
BangladeshPoland
0
100
200
300
400
500
1,000
1,500
2,000
2,500
3,000
• UK Initial Public Offerings (IPOs) in life sciences raised £22m in 2017. This compares to approx. £1.6bn raised in 2016, although it should be noted there is extreme volatility in these figures year-to-year.
• In 2017, the UK ranked 16th among 20 selected comparator countries.
• The USA raised the largest amount of IPOs in life sciences in 2017, with approximately £2,840m. USA figures include Over The Counter (OTC) and Pink Sheets stocks which are not traded on the stock exchanges.
• Data on amount raised is not available for nearly half of IPOs launched in China (37 of 76) so total amount for China will be an underestimate. Chinese figures include Hong Kong.
• The Swiss amount was raised from a single large listing.
Source: S&P Capital IQhttp://www.spcapitaliq.com/Notes: Country is the country in which the IPO was launched, not the domicile of the IPO country.

Life Science Competitiveness Indicators 27
Chart 13A: Total private equity investment in biotech and healthcare
Investment (€m)
0
500
1,000
1,500
2,000
2,500
20162015201420132012
AustriaBelgium
FinlandIreland
Switzerland
NetherlandsSweden
SpainGermanyUKItaly
France
• The amount of private equity investment in the UK in 2016 was €756m, remaining steady since 2013.
• In 2016, the UK ranked third behind France (€1.6bn) and Italy (€948m).
• Level of investment is volatile, with three countries ranking top in the past five years and year-on-year changes of up to over €1.0bn seen.
• Private equity is equity capital provided to enterprises not quoted on a stock market, originating from funds raised through private equity vehicles. It includes venture capital (seed, start-up and later stage venture), growth capital, replacement capital, rescue/turnaround and buyouts.
Source: European Private Activity Statistics 2016, Invest Europehttps://www.investeurope.eu/research/invest-europe-publications/#sNotes: Data is based on country of portfolio company. Data is in current prices.

Life Science Competitiveness Indicators 28
Chart 13B: Number of companies receiving private equity investment in biotech and healthcare
Number of companies
0
50
100
150
200
250
20162015201420132012
AustriaIreland
BelgiumItaly
Switzerland
Finland
NetherlandsUKSweden
SpainGermany
France
• The number of companies receiving private equity investment in the UK decreased from 80 in 2015 to 67 in 2016. This continues the decline from 111 companies in 2012.
• In 2016, the UK ranked joint fourth, behind France at 211, Germany at 139 and Spain at 68 (one more than the UK). France and Germany have consistently ranked top two.
• Private equity is equity capital provided to enterprises not quoted on a stock market, originating from funds raised through private equity vehicles. It includes venture capital (seed, start-up and later stage venture), growth capital, replacement capital, rescue/turnaround and buyouts.
Source: European Private Activity Statistics 2016, Invest Europehttps://www.investeurope.eu/research/invest-europe-publications/#sNotes: Data is based on country of portfolio company. Data is in current prices.

NHS collaboration
Life Science Competitiveness Indicators 30
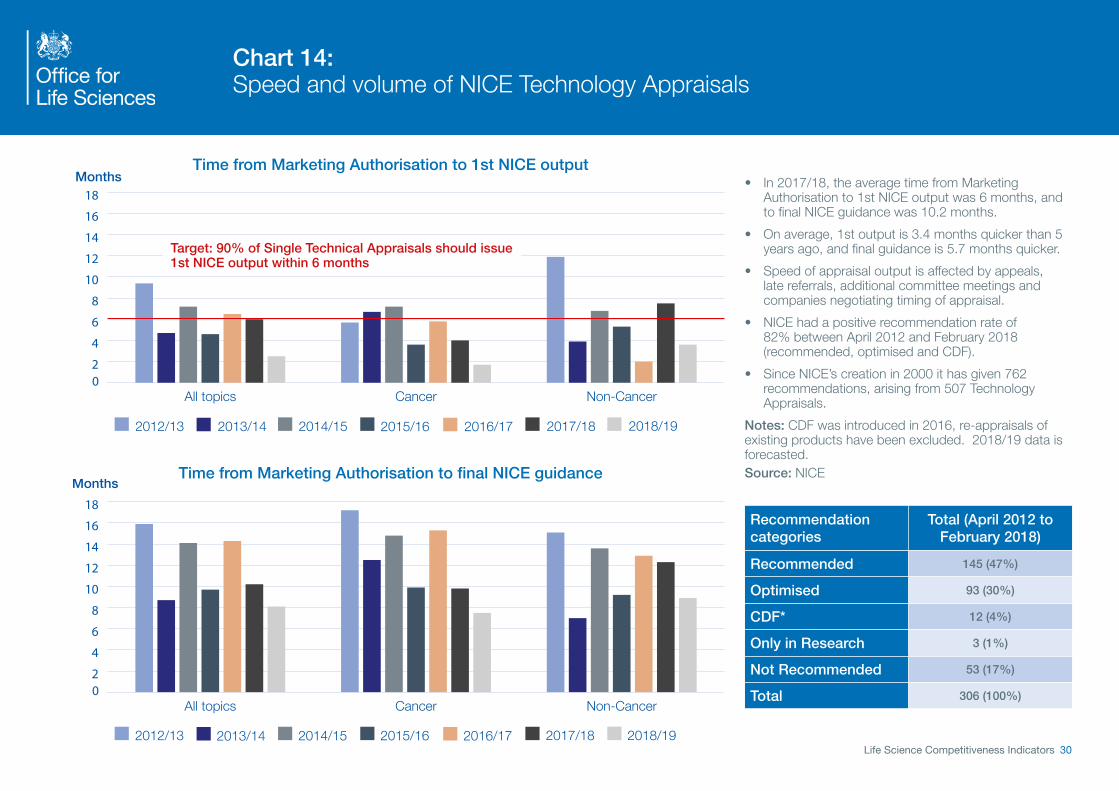
Chart 14: Speed and volume of NICE Technology Appraisals
Time from Marketing Authorisation to 1st NICE output
Months
02
4
6
8
10
12
14
16
18
2018/192017/182016/172015/162014/152013/142012/13
2018/192017/182016/172015/162014/152013/142012/13
Non-CancerCancerAll topics
Months
02
4
6
8
10
12
14
16
18
Non-CancerCancerAll topics
Time from Marketing Authorisation to final NICE guidanceMonths
02
4
6
8
10
12
14
16
18
2018/192017/182016/172015/162014/152013/142012/13
2018/192017/182016/172015/162014/152013/142012/13
Non-CancerCancerAll topics
Months
02
4
6
8
10
12
14
16
18
Non-CancerCancerAll topics
• In 2017/18, the average time from Marketing Authorisation to 1st NICE output was 6 months, and to final NICE guidance was 10.2 months.
• On average, 1st output is 3.4 months quicker than 5 years ago, and final guidance is 5.7 months quicker.
• Speed of appraisal output is affected by appeals, late referrals, additional committee meetings and companies negotiating timing of appraisal.
• NICE had a positive recommendation rate of 82% between April 2012 and February 2018 (recommended, optimised and CDF).
• Since NICE’s creation in 2000 it has given 762 recommendations, arising from 507 Technology Appraisals.
Notes: CDF was introduced in 2016, re-appraisals of existing products have been excluded. 2018/19 data is forecasted.Source: NICE
Recommendation categories
Total (April 2012 to February 2018)
Recommended 145 (47%)
Optimised 93 (30%)
CDF* 12 (4%)
Only in Research 3 (1%)
Not Recommended 53 (17%)
Total 306 (100%)
Target: 90% of Single Technical Appraisals should issue 1st NICE output within 6 months

Life Science Competitiveness Indicators 31
Chart 15A: Uptake of new medicines - NICE approved
Per capita uptake of medicines with a positive NICE recommendation against per capita uptake for 15 comparator countries
Years since launch
0%
10%
20%
30%
40%
50%
60%
70%
80%
90%
2012-162011-15
Year 5Year 4Year 3Year 2Year 1
Median • This indicator is a measure of relative uptake per capita for medicines first marketed between 2012 and 2016 and recommended by NICE, alongside the same analysis for medicines launched during 2011 to 2015.
• Median UK uptake of NICE-approved medicines in the first year after launch was at 21% of comparator countries. This rose to 78% by year 5. A value of 100% means UK per capita consumption is identical to the average uptake per capita for the comparison countries.
• There were 60 medicines included for 2012-16, compared to 52 for 2011-15. Medicines are included only if UK sales were above £1m at list price in 2017 and on sale for 12 months in at least 4 of the 15 comparators.
• The analysis adjusts for population size, but not for need (no. of cases), standard clinical practice or total medicine spend in each country, which is likely to affect uptake.
Positive RecommendationY1 Y2 Y3 Y4 Y5
2011-2015 20% 47% 70% 83% 80%
2012-2016 21% 47% 70% 79% 78%
Source: ABPI analysis of IQVIA dataNotes: Comparator countries: Australia, Austria, Belgium, Canada, Finland, France, Germany, Ireland, Italy, Japan, Netherlands, Spain, Switzerland, Sweden, USA

Life Science Competitiveness Indicators 32
Chart 15B: Uptake of new medicines - Non-NICE reviewed
Per capita uptake of medicines not reviewed by NICE against per capita uptake for 15 comparator countries
Years since launch
0%
20%
40%
60%
80%
100%
2012-162011-15
Year 5Year 4Year 3Year 2Year 1
Median • This indicator is a measure of relative uptake per capita for first marketed between 2012 and 2016 and recommended by NICE, alongside the same analysis for medicines launched during 2011 to 2015.
• Median UK uptake of non-NICE reviewed medicines in the first year after launch was at 22% of comparator countries. This rose to 103% by year 5. A value of 100% means UK per capita consumption is identical to the average uptake per capita for the comparison countries.
• There were 38 medicines included for 2012-16, compared to 33 for 2011-15. Medicines are included only if UK sales were above £1m at list price in 2017 and on sale for 12 months in at least 4 of the 15 comparators.
• The analysis adjusts for population size, but not for need (no. of cases), standard clinical practice or total medicine spend in each country, which is likely to affect uptake.
Non NICE reviewedY1 Y2 Y3 Y4 Y5
2011-2015 24% 45% 57% 79% 99%
2012-2016 22% 44% 56% 71% 90%
Source: ABPI analysis of IQVIA dataNotes: Comparator countries: Australia, Austria, Belgium, Canada, Finland, France, Germany, Ireland, Italy, Japan, Netherlands, Spain, Switzerland, Sweden, USA

Skills

Life Science Competitiveness Indicators 34
Chart 16: Percentage of graduates from tertiary education graduating from Natural Sciences, Mathematics and Statistics programmes, both sexes (%)
Percentage (%)
0
2
4
6
8
10
12
14
2015 2014 2013 2012 2011
Russia
NetherlandsBrazil
Belgium
Republic of KoreaSweden
SpainUSAIrelandItaly
Switzerland
FranceIndiaUK
• This indicator is a measure of upcoming talent and potential skills base for the life sciences. Tertiary education is an undergraduate degree or equivalent.
• The UK ranked first for the proportion of graduates from Natural Sciences, Mathematics and Statistics programmes.
• In 2015, 13.4% of graduates were from these programmes, roughly similar to the previous two years, following an increase of 4 percentage points between 2012 and 2013.
• No data was available for Germany. Countries with fewer than 4% include: Belgium, Brazil, Netherlands and Russia.
Source: UNESCO, Education themehttp://data.uis.unesco.org/index.aspx?queryid=163#

Regulation

Life Science Competitiveness Indicators 36
Chart 17: Instances where MHRA is in lead role in EU regulatory procedure
Percentage (%)
0
10
20
30
40
50
60
70
UK Decentralised Procedures - Reference Member State
Scientific Advice Co-ordinator
Centralised Procedures Rapporteur/Corapporteur
2017201620152014201320122011201020092008
• The MHRA is a leading regulator of choice for scientific advice and centralised procedures.
• The MHRA took a lead role in 25% of EU regulatory procedures in 2017.
• In 2017, the MHRA was:
– Rapporteur/Co-rapporteur in 9% of Centralised Procedures;
– Scientific Advice Co-ordinator in 19% of cases;
– Reference Member State in 42% of Decentralised Procedures involving the UK
• This corresponds to:
– 18 cases Centralised Procedures;
– 118 cases as Scientific Advice Co-ordinator;
– 165 UK Decentralised Procedure cases.
Source: Medicines and Healthcare Products Regulatory Agency

Contact BEIS Email: [email protected]: 020 7215 5000 Web: www.beis.gov.uk