life cycle assessment of biochar systems: estimating the ... · the biomass undergoes slow...
TRANSCRIPT
Life Cycle Assessment of BiocharSystems: Estimating the Energetic,Economic, and Climate ChangePotentialK E L L I G . R O B E R T S , * , † B R E N T A . G L O Y , ‡
S T E P H E N J O S E P H , § N O R M A N R . S C O T T , ⊥
A N D J O H A N N E S L E H M A N N †
College of Agriculture and Life Sciences, Cornell University,Ithaca, New York 14853, and School of Materials Science andEngineering, University of New South Wales, Sydney, NSW2251, Australia
Received July 27, 2009. Revised manuscript receivedOctober 30, 2009. Accepted November 17, 2009.
Biomass pyrolysis with biochar returned to soil is a possiblestrategy for climate change mitigation and reducing fossil fuelconsumption. Pyrolysis with biochar applied to soils resultsin four coproducts: long-term carbon (C) sequestration fromstable C in the biochar, renewable energy generation, biocharas a soil amendment, and biomass waste management. Lifecycle assessment was used to estimate the energy and climatechange impacts and the economics of biochar systems. Thefeedstocks analyzed represent agricultural residues (corn stover),yard waste, and switchgrass energy crops. The net energyof the system is greatest with switchgrass (4899 MJ t-1 dryfeedstock). The net greenhouse gas (GHG) emissions for bothstover and yard waste are negative, at -864 and -885 kgCO2 equivalent (CO2e) emissions reductions per tonne dryfeedstock, respectively. Of these total reductions, 62-66% arerealized from C sequestration in the biochar. The switchgrassbiochar-pyrolysis system can be a net GHG emitter (+36 kg CO2et-1 dry feedstock), depending on the accounting method forindirect land-use change impacts. The economic viability of thepyrolysis-biochar system is largely dependent on the costsof feedstock production, pyrolysis, and the value of C offsets.Biomass sources that have a need for waste management suchas yard waste have the highest potential for economicprofitability (+$69 t-1 dry feedstock when CO2e emissionreductions are valued at $80 t-1 CO2e). The transportationdistancefor feedstockcreatesasignificanthurdle to theeconomicprofitability of biochar-pyrolysis systems. Biochar may atpresent only deliver climate change mitigation benefits and befinancially viable as a distributed system using waste biomass.
IntroductionThere is an urgent need to develop strategies for mitigatingglobal climate change. Promising approaches to reducinganthropogenic greenhouse gas (GHG) emissions often in-
clude energy generation from climate neutral renewableresources. However, pyrolysis of biomass with biocharapplied to soil offers a direct method for sequestering C andgenerating bioenergy (1-3). Biochar is the stable, carbon-rich charcoal that results from pyrolysis of biomass materials.Used as a soil amendment, biochar can improve soil healthand fertility, soil structure, nutrient availability, and soil-waterretention capacity (4-8), and is also a mechanism for long-term C storage in soils. Because carbonizing biomassstabilizes the C that has been taken up by plants, sustainablyproduced biochar applied to soils may proactively sequesterC from the atmosphere, while also generating energy.
Pyrolysis is the thermal decomposition of organic materialin the absence of oxygen, and is also an initial stage in bothcombustion and gasification processes (9, 10). Both slow andfast pyrolysis of biomass result in three coproducts: char,gas, and tarry oils, where the relative amounts and charac-teristics of each are controlled by the pyrolysis processingconditions such as temperature, residence time, pressure,and feedstock type. Slow pyrolysis is generally carried out atlower temperatures and longer residence times than fastpyrolysis, and the typical product yield is 35% char, 35% gas,and 30% liquid (9). Pyrolysis with biochar applied to soiloffers potential solutions to the current climate and energyconcerns. However, to avoid unintended consequences of anew technology or mitigation strategy, it is necessary toconduct analyses of potential life-cycle impacts of biochar-pyrolysis systems, as it would be undesirable to have thesystem actually emit more GHG than sequestered or consumemore energy than is generated. Because of its “cradle-to-grave” approach and transparent methodology, life cycleassessment (LCA) is an appropriate tool for estimating theenergy and climate change impacts of pyrolysis-biocharsystems.
In this paper, we use LCA to estimate the full life-cycleenergy, GHG emissions balance, and economic feasibility ofbiochar. The biomass feedstock sources compared are cornstover, yard waste, and a switchgrass energy crop. This rangeof feedstock provides insight into the use of biomass “waste”resources compared to bioenergy crops and the resultingenergy and climate change impacts and economic costs ofeach scenario.
MethodologyGoal and Scope. The cumulative energy, climate changeimpacts, and economics of biochar production from cornstover, yard waste, and switchgrass feedstocks at a slow-pyrolysis facility in the United States are estimated usingprocess-based LCA in Microsoft Excel. The goal of the biocharenergy, greenhouse gases, and economic (BEGGE) LCA is toquantify the energy, greenhouse gas, and economic flowsassociated with biochar production for a range of feedstocks.The biochar system for the LCA has four coproducts: biomasswaste management, C sequestration, energy generation, andsoil amendment. The functional unit of the biochar-pyrolysissystem is the management of 1 tonne of dry biomass. Thereference flows for this system are the mass and C in thebiomass feedstock and the energy associated with biocharproduction.
System Boundaries. The industrial-scale biochar pro-duction system boundaries are illustrated in Figure 1a. Themethod of biomass production and collection is dependenton the feedstock (with more details provided in the individualprocess descriptions and in the online Supporting Informa-tion (SI)). Once the biomass is collected, it is transported tothe pyrolysis facility where it is reduced in size and dried.
* Corresponding author e-mail: [email protected].† Department of Crop and Soil Sciences, Cornell University.‡ Department of Applied Economics and Management, Cornell
University.§ University of New South Wales.⊥ Department of Biological and Environmental Engineering,
Cornell University.
Environ. Sci. Technol. 2010, 44, 827–833
10.1021/es902266r 2010 American Chemical Society VOL. 44, NO. 2, 2010 / ENVIRONMENTAL SCIENCE & TECHNOLOGY 9 827
Published on Web 12/23/2009
The biomass undergoes slow pyrolysis, which producesbiochar, syngas, and tarry oils. The syngas and oils arecombusted on-site for heat applications. The biochar istransported to a farm and applied to annual crop fields. Theproduction of equipment specific to pyrolysis and feedstockprocessing (the pyrolysis facility, feedstock pretreatmentequipment, farming equipment) is included, but the pro-duction of transportation vehicles is not included. Thegreenhouse gases, regulated emissions, and energy use intransportation (GREET) 1.8b (11) model for transportationfuel-cycles was used for compiling the upstream energy andair emissions for electricity generation, fossil fuel productionand combustion, transportation, and agricultural inputs. Theavoided processes incorporated into the analysis via systemexpansion are natural gas production and combustion,composting, and fertilizer production. Water consumptionis not included in the LCA. The processes within the LCA aredescribed in detail in the following section and the SI.
Crop Residues. Multiple studies have analyzed the energyand emissions related to ethanol production from corn stover(12-15). For this assessment, the energy and greenhousegas emissions are from the LCA of corn stover collectionconducted by Kim, Dale, and Jenkins (15) in Fulton County,IL (see the SI). Weather and field conditions can influencecorn stover harvest times (16, 17), thus both late and earlystover harvests are considered, with moisture contents (wetbasis) of 15% and 30% mcwb, respectively (18).
Bioenergy Crops. Switchgrass as a pyrolysis feedstock ismodeled in two ways (scenarios A and B) to compare theeffects of land-use change on climate change impacts. Whileboth switchgrass A and B use the energy and agriculturalinputs associated with switchgrass establishment and col-lection from the lifecycle emissions model (LEM) (19) (TableS1 of the SI), the GHG emissions data are from two differentmodels. The switchgrass A scenario uses LEM (19) for the
land-use, fertilizer, and cultivation-related emissions ofswitchgrass production, with a net GHG of +406.8 kg CO2et-1 dry switchgrass (see SI). The switchgrass B scenario usesthe results from a comprehensive worldwide agriculturalmodel for land-use change from Searchinger et al. (20). Boththe LEM and Searchinger et al. models account for the effectsof cropland diversion from annual crops to perennial grassenergy crops (direct land-use change) and land conversionto cropland to replace the crops lost to bioenergy crops(indirect land-use change). However, differences betweenthe models arise in the indirect land-use change accountingmethods. The net GHG emissions of scenario B are +886.0kg CO2e t-1 dry switchgrass (compared to +406.8 kg CO2e t-1
for switchgrass A). There is an obvious difference betweenthese two approaches to modeling land-use change emis-sions, and we have used both as a means of capturing therange of outcomes.
Yard Waste Collection. The yard waste is assumed to bediverted from an industrial-scale composting facility, andno environmental burdens are assigned to the productionof yard waste. The avoided compost process is included viathe system expansion approach and is described in the SI.
Slow Pyrolysis: Biochar and Syngas Production. A verylimited number of LCA studies have been conducted onpyrolysis facilities. Examples include a hazardous wastemanagement plant in The Netherlands (21), fast pyrolysisfor biofuel production (22), and a micropyrolysis-gas turbinesystem (23). However, detailed analyses of the energy andemissions associated with biochar production from slowpyrolysis have been performed where both biochar produc-tion from bioenergy crops and from crop residues result innet energy production and avoided GHG emissions (3, 24).The pyrolysis facility for this LCA is assumed to operate ina manner similar to industry prototypes under slow pyrolysisconditions as a continuous process with a biomass through-
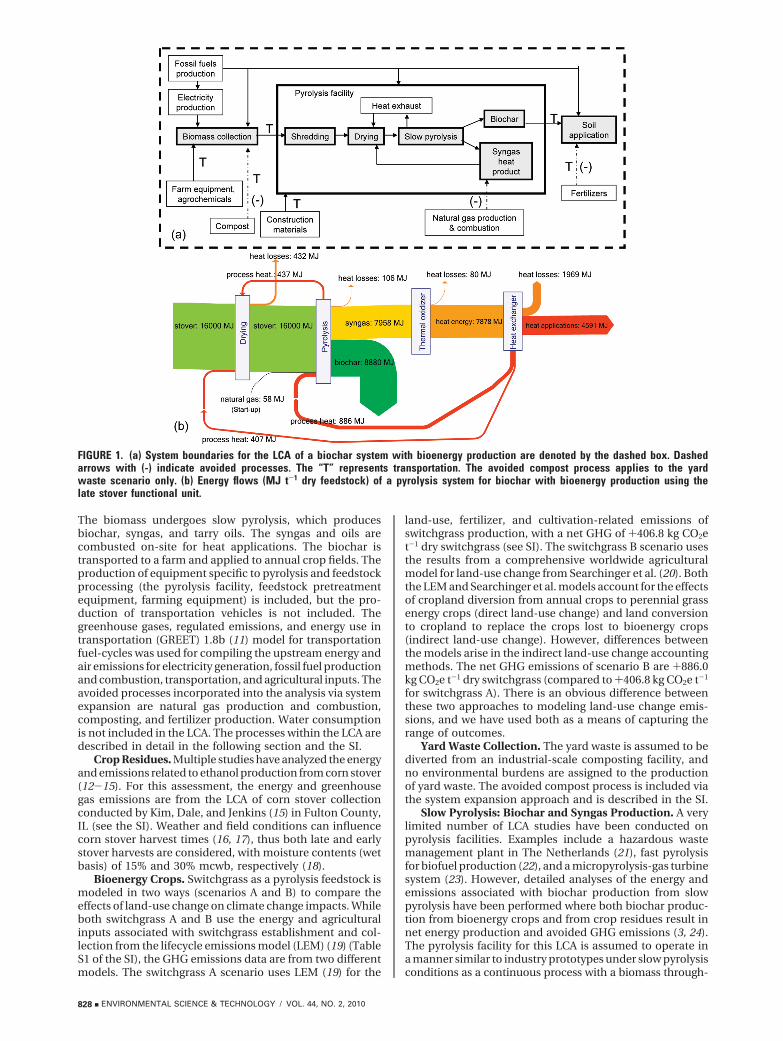
FIGURE 1. (a) System boundaries for the LCA of a biochar system with bioenergy production are denoted by the dashed box. Dashedarrows with (-) indicate avoided processes. The “T” represents transportation. The avoided compost process applies to the yardwaste scenario only. (b) Energy flows (MJ t-1 dry feedstock) of a pyrolysis system for biochar with bioenergy production using thelate stover functional unit.
828 9 ENVIRONMENTAL SCIENCE & TECHNOLOGY / VOL. 44, NO. 2, 2010
put of 10 dry t hr-1. A Sankey diagram of the energy flowsof the biomass pyrolysis process is shown in Figure 1b.Pyrolysis is an exothermic process, and only a small amountof natural gas is used for the initial start-up of the pyrolysiskiln burner which is estimated at 58 MJ t-1 feedstock (21).The feedstock is pyrolyzed at 450 °C, and the pyrolysis gasesflow into a thermal oxidizer which combusts the gases andoils at high temperature achieving clean combustion. A heatexchanger and air ducting system transfer the heat from thecombustion gases to heating applications on-site. Exhaustheat from the facility is used for drying the incoming biomass.As a significant portion of the feedstock energy is in thebiochar (∼50% assuming a lower heating value of 30 MJ kg-1
for charcoal (25)), the overall efficiency from feedstock toavailable heat is 37%. More information on the pyrolysisprocess can be found in the SI.
As reported in ref 25, the yields of biochar from slowpyrolysis at 0.1 MPa (atmospheric pressure) have been foundto range from 28.8 (birch wood) to 33.0 wt.% (spruce wood).The biochar yields, ash content of the biochar, and syngasenergy yields are listed in Table S2. All of the ash (mineralelements except N and S) in the feedstock is assumed toremain in the biochar, and the mass of the biochar productincludes the mass of the stable carbon, ash, and volatilematter.
Stable Carbon in Biochar. Of the C in the biochar, themajority is in a highly stable state and has a mean residencetime of 1000 years or longer at 10 °C mean annual temperature(1, 26-31). However, the stability of the biochar does varywith feedstock, processing, and environmental conditions.For this assessment we assume that the slow-pyrolysis processhas been optimized for high yields of stable C. With this inmind, we use a conservative estimate of 80% of the C in thebiochar as stable (28, 32). The remaining 20% of the C islabile and released into the atmosphere as biogenic CO2
within the first few years of applying it to the soil.Improved Fertilizer Use Efficiency. As part of the
application to the soil, the biochar not only sequesters C, butalso improves crop performance. Although increased cropyields with biochar additions are reported in many cases,the greatest and most consistent yields are found on highlydegraded soils (4-7). In the present analysis, the biochar isapplied to comparatively productive soils in the U.S. CornBelt, and therefore we do not consider crop yield increaseswith biochar. However, we do include improved fertilizeruse efficiency (33) which enhances crop performance andthus reduces the amount of commercial chemical fertilizersapplied. The difference of 7.2% between total N recovery insoils fertilized with biochar and the control (33) is used asthe baseline scenario for improved N, P, and K fertilizer useefficiency.
Soil N2O Emissions. In addition to the reduced need forchemical fertilizers, biochar reportedly reduces N2O soilemissions that result from N fertilizer application (34-37).For this analysis, the baseline scenario assumes that thebiochar processing is done under conditions such that soilN2O emissions from N fertilizer applications are reduced by50%.
Impact Assessment. The net energy of the functional unitincorporates all energy inputs to the system and energyproduced by the system. Energy produced by the systemincludes syngas energy and energy from avoided processessuch as fossil fuel production, fertilizer production, andcomposting. The 100 year global warming potential of CO2,CH4, and N2O (1, 25, and 298 CO2e, respectively) from theIPCC for 2007 (38) were used to calculate the climate changeimpacts of each process. The net climate change impact isthe sum of the “net GHG reductions” and the net GHGemissions. To be consistent with terminology, the “net GHGreductions” are the sum of the “CO2e sequestered” and the
“avoided CO2e emissions”. The C sequestration is a directresult of the stable C in the biochar, while the avoidedemissions are from the avoided processes such as fossil fuelproduction and combustion, soil N2O emissions, fertilizerproduction, and composting. The biogenic CO2 emissionsare accounted for in the C balance of each biomass-to-biocharsystem (illustrated in Figure S1 for late stover). It is importantto also note that improvements to the soil structure andfertility upon biochar application are not included in thisanalysis. These soil improvements could further reduce GHGemissions and energy consumption, while potentially addingvalue to the biochar product because of enhanced cropproductivity.
Economic Assessment. The primary costs of biocharproduction are the feedstock collection and pyrolysis, whilethe feedstock transport, biochar transport, and biocharapplication have small contributions to the total (see TableS5 for a summary of the costs and revenues for eachfeedstock). The revenues come from the biochar value, theenergy produced, and the tipping fee (in the case of the yardwaste). The value assigned to the biochar is based on threecomponents: (i) the P and K content of the biochar, (ii) theimproved fertilizer use efficiency, and (iii) the GHG emissionreduction. For valuing the GHG offsets, there are twoapproaches one can use: either to value only the stable C inthe biochar, or to value the total life-cycle GHG emissionreduction in the entire biochar system. For this analysis, weuse the life-cycle C emission reduction to calculate the GHGoffset, adding more value to the biochar because it incor-porates the emission offsets from avoided fossil fuels,fertilizers, reduced soil N2O emissions, etc. The SI providesresults on valuing the stable C in the biochar only. The othervariable in the GHG offsets is in the value assigned per t ofCO2e emission reduction. Low and high revenue scenariosare considered, where values of $20 and $80 t-1 CO2e areused, based on the IPCC recommendations (39). The syngasvalue per MJ is assumed equivalent to natural gas. All costsand revenues are described in more detail in the SI.
Results and DiscussionEnergy. For each feedstock assessed, the net energy of thesystem is positive, i.e., more energy is generated thanconsumed (Figure 2a). The net energy of 1 dry tonne of latestover, early stover, switchgrass, and yard waste is +4116,+3044,+4899, and+4043 MJ, respectively. The excess syngasheat energy produced per tonne of feedstock is+4859,+4002,+5787, and +3507 MJ for the late stover, early stover,switchgrass, and yard waste, respectively. Early stoverconsumes the most fossil fuels (-1007 MJ), while yard wasteactually yields a net+424 MJ of fossil fuels due to the avoidedcomposting process. The late stover functional unit consumesthe least amount of energy of all feedstocks. Drying, agro-chemicals, and field operations are the highest energyconsuming processes for stover and switchgrass. The role ofthe feedstock moisture content on the energy consumed indrying is evident, as the early stover clearly consumes moreenergy in drying than the late stover, and yard waste (45%mcwb) consumes the most energy for drying. The energyassociated with the feedstock production and collection ishighest for switchgrass, as shown by the agrochemicals (44%of the total) and field operations (27%). For energy generation,the heat energy produced has the highest contribution forall feedstocks, at 90-94% of the total energy generated.Avoided fossil fuel production is only a small fraction of thetotal, from 4-6% of the total energy generated. The con-tribution analysis also highlights the relatively small impactthat the biomass transport (2-3%) and the plant construction(2-4%) each have on the energy consumption. The “otherprocesses” category, aggregated in Figure 2a for clarity,includes the processes that contribute only a minor amount
VOL. 44, NO. 2, 2010 / ENVIRONMENTAL SCIENCE & TECHNOLOGY 9 829
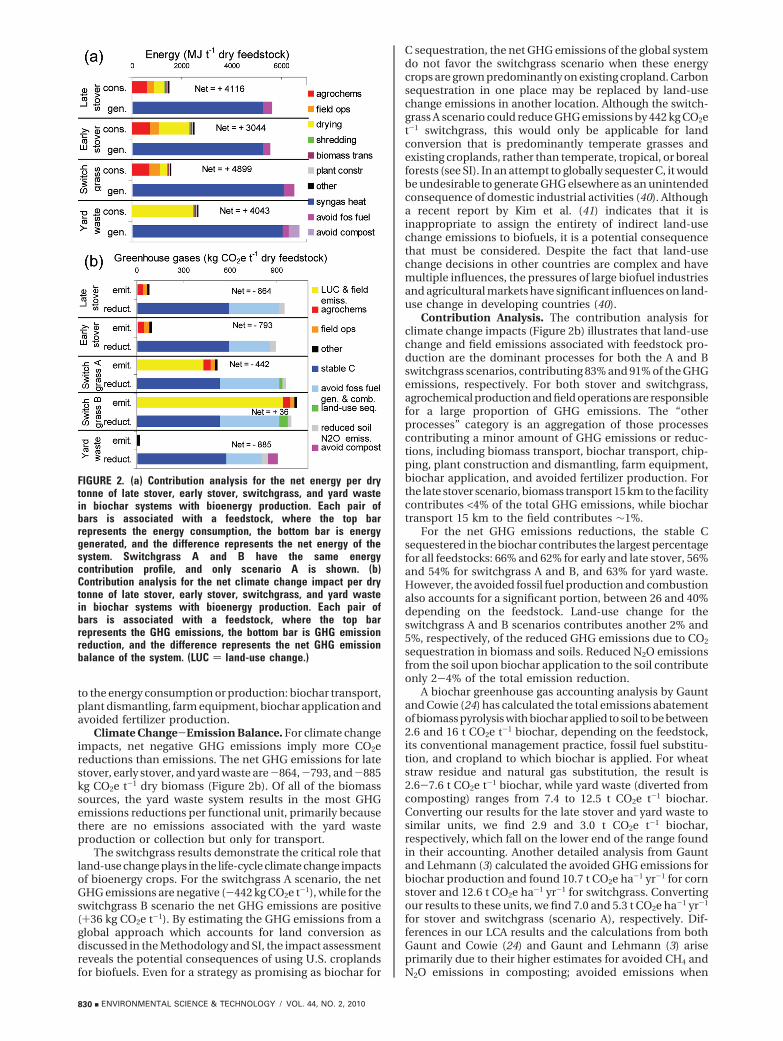
to the energy consumption or production: biochar transport,plant dismantling, farm equipment, biochar application andavoided fertilizer production.
Climate Change-Emission Balance. For climate changeimpacts, net negative GHG emissions imply more CO2ereductions than emissions. The net GHG emissions for latestover, early stover, and yard waste are-864,-793, and-885kg CO2e t-1 dry biomass (Figure 2b). Of all of the biomasssources, the yard waste system results in the most GHGemissions reductions per functional unit, primarily becausethere are no emissions associated with the yard wasteproduction or collection but only for transport.
The switchgrass results demonstrate the critical role thatland-use change plays in the life-cycle climate change impactsof bioenergy crops. For the switchgrass A scenario, the netGHG emissions are negative (-442 kg CO2e t-1), while for theswitchgrass B scenario the net GHG emissions are positive(+36 kg CO2e t-1). By estimating the GHG emissions from aglobal approach which accounts for land conversion asdiscussed in the Methodology and SI, the impact assessmentreveals the potential consequences of using U.S. croplandsfor biofuels. Even for a strategy as promising as biochar for
C sequestration, the net GHG emissions of the global systemdo not favor the switchgrass scenario when these energycrops are grown predominantly on existing cropland. Carbonsequestration in one place may be replaced by land-usechange emissions in another location. Although the switch-grass A scenario could reduce GHG emissions by 442 kg CO2et-1 switchgrass, this would only be applicable for landconversion that is predominantly temperate grasses andexisting croplands, rather than temperate, tropical, or borealforests (see SI). In an attempt to globally sequester C, it wouldbe undesirable to generate GHG elsewhere as an unintendedconsequence of domestic industrial activities (40). Althougha recent report by Kim et al. (41) indicates that it isinappropriate to assign the entirety of indirect land-usechange emissions to biofuels, it is a potential consequencethat must be considered. Despite the fact that land-usechange decisions in other countries are complex and havemultiple influences, the pressures of large biofuel industriesand agricultural markets have significant influences on land-use change in developing countries (40).
Contribution Analysis. The contribution analysis forclimate change impacts (Figure 2b) illustrates that land-usechange and field emissions associated with feedstock pro-duction are the dominant processes for both the A and Bswitchgrass scenarios, contributing 83% and 91% of the GHGemissions, respectively. For both stover and switchgrass,agrochemical production and field operations are responsiblefor a large proportion of GHG emissions. The “otherprocesses” category is an aggregation of those processescontributing a minor amount of GHG emissions or reduc-tions, including biomass transport, biochar transport, chip-ping, plant construction and dismantling, farm equipment,biochar application, and avoided fertilizer production. Forthe late stover scenario, biomass transport 15 km to the facilitycontributes <4% of the total GHG emissions, while biochartransport 15 km to the field contributes ∼1%.
For the net GHG emissions reductions, the stable Csequestered in the biochar contributes the largest percentagefor all feedstocks: 66% and 62% for early and late stover, 56%and 54% for switchgrass A and B, and 63% for yard waste.However, the avoided fossil fuel production and combustionalso accounts for a significant portion, between 26 and 40%depending on the feedstock. Land-use change for theswitchgrass A and B scenarios contributes another 2% and5%, respectively, of the reduced GHG emissions due to CO2
sequestration in biomass and soils. Reduced N2O emissionsfrom the soil upon biochar application to the soil contributeonly 2-4% of the total emission reduction.
A biochar greenhouse gas accounting analysis by Gauntand Cowie (24) has calculated the total emissions abatementof biomass pyrolysis with biochar applied to soil to be between2.6 and 16 t CO2e t-1 biochar, depending on the feedstock,its conventional management practice, fossil fuel substitu-tion, and cropland to which biochar is applied. For wheatstraw residue and natural gas substitution, the result is2.6-7.6 t CO2e t-1 biochar, while yard waste (diverted fromcomposting) ranges from 7.4 to 12.5 t CO2e t-1 biochar.Converting our results for the late stover and yard waste tosimilar units, we find 2.9 and 3.0 t CO2e t-1 biochar,respectively, which fall on the lower end of the range foundin their accounting. Another detailed analysis from Gauntand Lehmann (3) calculated the avoided GHG emissions forbiochar production and found 10.7 t CO2e ha-1 yr-1 for cornstover and 12.6 t CO2e ha-1 yr-1 for switchgrass. Convertingour results to these units, we find 7.0 and 5.3 t CO2e ha-1 yr-1
for stover and switchgrass (scenario A), respectively. Dif-ferences in our LCA results and the calculations from bothGaunt and Cowie (24) and Gaunt and Lehmann (3) ariseprimarily due to their higher estimates for avoided CH4 andN2O emissions in composting; avoided emissions when
FIGURE 2. (a) Contribution analysis for the net energy per drytonne of late stover, early stover, switchgrass, and yard wastein biochar systems with bioenergy production. Each pair ofbars is associated with a feedstock, where the top barrepresents the energy consumption, the bottom bar is energygenerated, and the difference represents the net energy of thesystem. Switchgrass A and B have the same energycontribution profile, and only scenario A is shown. (b)Contribution analysis for the net climate change impact per drytonne of late stover, early stover, switchgrass, and yard wastein biochar systems with bioenergy production. Each pair ofbars is associated with a feedstock, where the top barrepresents the GHG emissions, the bottom bar is GHG emissionreduction, and the difference represents the net GHG emissionbalance of the system. (LUC ) land-use change.)
830 9 ENVIRONMENTAL SCIENCE & TECHNOLOGY / VOL. 44, NO. 2, 2010
biochar is used as a soil amendment; as well as their notaccounting for emissions associated with other processes(harvesting the wheat straw, land-use change effects, ornutrient losses in residue removal). (See the SI for furtherdiscussion comparing energy yields.)
Alternative Biomass Uses. We can also compare thescenario of biochar-to-soil to that of biochar-as-fuel, assumingthe biochar is replacing coal combusted in an integratedgasification combined cycle (IGCC) plant. For the late stoverscenario, the avoided emissions for biochar productionfollowed by biochar combustion (assuming an energy contentof ∼30 MJ kg-1 biochar, i.e., 8880 MJ per functional unit) inreplacement of coal are -617 kg CO2e t-1 dry stover. Thiscomparison illustrates that 29% more GHG emissionsreductions are made when the biochar is applied to soil (-864kg CO2e t-1 dry stover) rather than used as a fuel.
If we compare biomass direct combustion to biomass-to-biochar-to-soil (where the avoided fossil fuels impacts arenot included for either scenario), the resulting net GHG forbiomass direct combustion is +74 kg CO2e t-1 stover and forbiomass-to-biochar-to-soil is -542 kg CO2e. This indicatesthat emission reductions are greater for a biochar systemthan for direct combustion. If natural gas is used as theavoided fossil fuel in both scenarios, the net GHG are -987and -864 kg CO2e t-1 dry stover for the biomass combustionand biomass-to-biochar-to-soil, respectively. When viewedin this light the net GHG look comparable. However, in thebiomass-to-biochar-to-soil, 589 kg of CO2 are actually removedfrom the atmosphere and sequestered in soil, whereas thebiomass combustion benefits from the avoidance of futurefossil fuel emissions only. This example highlights the needfor transparent system boundaries when comparing betweenbiomass management alternatives.
Large-Scale Emission Reductions. As a first approxima-tion to potential GHG reductions on a larger scale, we usethe late stover baseline model for biomass residues. On aglobal scale, using 50% of the 1.5 billion tonnes of currentlyunused crop residues annually (42), the net GHG reductionsare 0.65 Gt CO2e per year. (The amount of global unusedresidues is calculated as the difference between the availableresidues and the used portion, which are dependent on thecrop, region, harvest factor, and recovery rate.) With a goalof reducing global fossil fuel GHG emissions from the 2007level (31 Gt CO2e (43)) by 50% in 2050 (according to IPCCrecommendation to stabilize warming at 2.0-2.4 °C (39)),biochar would provide ∼4% of these emissions reductionswith 50% of crop residues alone. Or, for the U.S., assuming141.1 million tonnes of currently unused crop residues and124.7 million tonnes of currently unexploited forest residuesannually (44), the net GHG reductions are 230 Mt CO2e peryear. (The amount of unused crop residues in the U.S. iscalculated as 80% of the currently available residues (20%are currently used), and a 40% residue recovery potential.)If the U.S. were to adopt policies aiming to reduce fossil fuelGHG emissions by 50% of the 2007 level (5820 Mt CO2e (43))by 2050, 222.6 Mt CO2e from sustainable biochar productioncould contribute ∼8% of these annual emissions reductions.These estimates demonstrate that sustainable biochar pro-duction from unused biomass waste resources may play asignificant role in mitigating climate change on a global level.Future studies will seek to evaluate these larger scalescenarios.
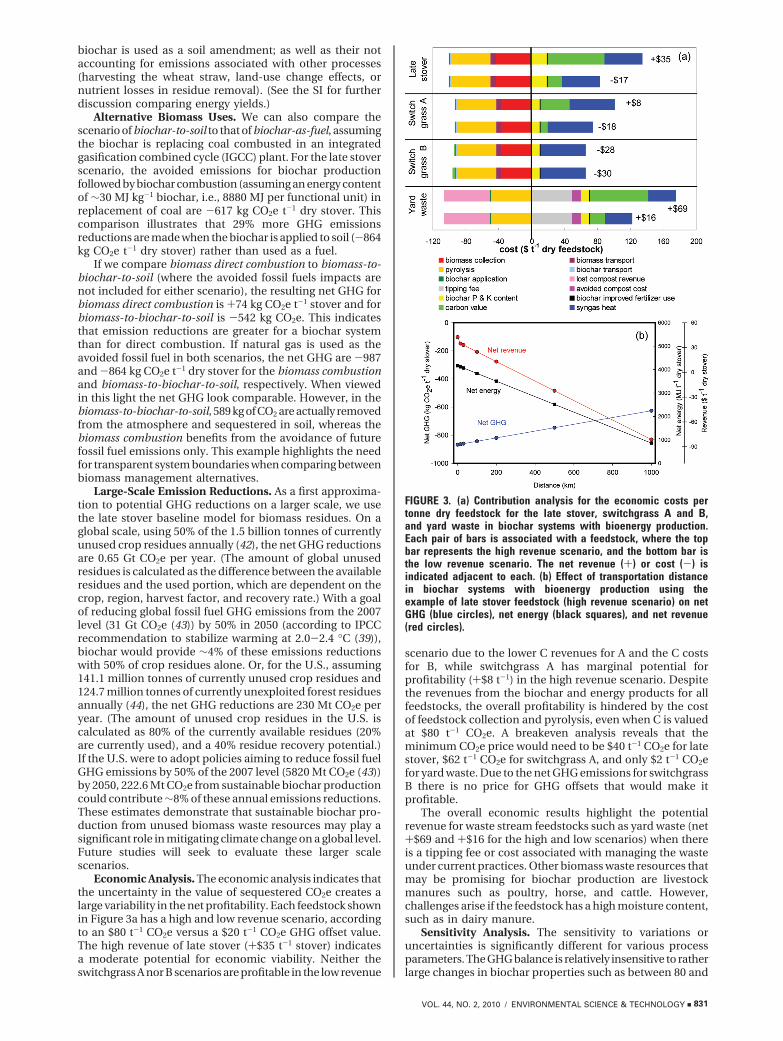
Economic Analysis. The economic analysis indicates thatthe uncertainty in the value of sequestered CO2e creates alarge variability in the net profitability. Each feedstock shownin Figure 3a has a high and low revenue scenario, accordingto an $80 t-1 CO2e versus a $20 t-1 CO2e GHG offset value.The high revenue of late stover (+$35 t-1 stover) indicatesa moderate potential for economic viability. Neither theswitchgrass A nor B scenarios are profitable in the low revenue
scenario due to the lower C revenues for A and the C costsfor B, while switchgrass A has marginal potential forprofitability (+$8 t-1) in the high revenue scenario. Despitethe revenues from the biochar and energy products for allfeedstocks, the overall profitability is hindered by the costof feedstock collection and pyrolysis, even when C is valuedat $80 t-1 CO2e. A breakeven analysis reveals that theminimum CO2e price would need to be $40 t-1 CO2e for latestover, $62 t-1 CO2e for switchgrass A, and only $2 t-1 CO2efor yard waste. Due to the net GHG emissions for switchgrassB there is no price for GHG offsets that would make itprofitable.
The overall economic results highlight the potentialrevenue for waste stream feedstocks such as yard waste (net+$69 and +$16 for the high and low scenarios) when thereis a tipping fee or cost associated with managing the wasteunder current practices. Other biomass waste resources thatmay be promising for biochar production are livestockmanures such as poultry, horse, and cattle. However,challenges arise if the feedstock has a high moisture content,such as in dairy manure.
Sensitivity Analysis. The sensitivity to variations oruncertainties is significantly different for various processparameters. The GHG balance is relatively insensitive to ratherlarge changes in biochar properties such as between 80 and
FIGURE 3. (a) Contribution analysis for the economic costs pertonne dry feedstock for the late stover, switchgrass A and B,and yard waste in biochar systems with bioenergy production.Each pair of bars is associated with a feedstock, where the topbar represents the high revenue scenario, and the bottom bar isthe low revenue scenario. The net revenue (+) or cost (-) isindicated adjacent to each. (b) Effect of transportation distancein biochar systems with bioenergy production using theexample of late stover feedstock (high revenue scenario) on netGHG (blue circles), net energy (black squares), and net revenue(red circles).
VOL. 44, NO. 2, 2010 / ENVIRONMENTAL SCIENCE & TECHNOLOGY 9 831
90% of stable C (9% change) and between 80 and 0% decreasein N2O emissions from soil (Table S8). The GHG balance ismore sensitive to feedstock collection (change from -12%to+2% depending on assumptions), in contrast to the energybalance (<3% change). The net energy is very sensitive to thesyngas energy yield; however, even a conservative estimateof 50% of the baseline results in a net positive energy balance,even though it is 63% less than the baseline. The GHG balanceis also sensitive to the avoided fossil fuel process (10 and24% increased for diesel and coal, respectively), while thenet energy changes only(6%. More details on the sensitivityanalysis can be found in the SI.
Transportation distance has significant effects on costs,whereas ramifications for GHG emissions are low (Figure3b). Even transporting the feedstock and biochar each 200km, the net CO2 emission reductions decrease by only 5%of the baseline (15 km). At 1000 km, the net GHG emissionreductions decrease by 28% to-626 kg CO2e. The net energyis more sensitive than the GHG emissions to the transportdistance. At 200 km the net energy decreases by 15%, andat 1000 km, the net energy decreases by 79% to 863 MJ. Costsare the most sensitive to transportation distance, where costsincrease by $0.80 t-1 for every 10 km. Therefore, biocharsystems are most economically viable as distributed systemswith low transportation requirements.
In summary, several biomass pyrolysis systems withbiochar returned to soil have potential for C sequestration,GHG emission reductions, renewable energy generation, andeconomic viability. Careful feedstock selection is required toavoid unintended consequences such as net GHG emissionsor consuming more energy than is generated, and also toensure economic and environmental sustainability through-out the process life cycle. Waste biomass streams such asyard waste have the greatest potential to be economicallyviable while still being net energy positive and reducing GHGemissions. Agricultural residues such as corn stover havehigh yields of energy generation and GHG reductions, andhave moderate potential to be profitable, depending on thevalue of C offsets and feedstock collection costs. If energycrops such as switchgrass are grown on land diverted fromannual crops, indirect land-use change impacts could meanthat more GHG are actually emitted than sequestered. Evenif switchgrass is grown on marginal lands, the economics forswitchgrass biochar are unfavorable. The primary barriersto the economic viability of pyrolysis-biochar systems arethe pyrolysis process and the feedstock production costs. Adiversified farm system with mixed feedstocks for biocharproduction may bring sustainability benefits that exceedthose of a single feedstock alone which should be evaluatedin future analyses. Valuing greenhouse gas offsets at aminimum of $40 t-1 CO2e (as calculated for the stoverscenario) and further development of pyrolysis-biocharsystems will encourage sustainable strategies for renewableenergy generation and climate change mitigation.
AcknowledgmentsWe acknowledge financial support for this work from theCornell Center for a Sustainable Future, NYSERDA, and USDAHatch grant. We also thank John Gaunt (GY Associates), JimFournier (Biochar Engineering Corporation), and MikeMcGolden (Coaltec) for their valuable feedback on thepyrolysis process. We are grateful to three anonymous refereesfor their constructive suggestions to the manuscript.
Supporting Information AvailableDetailed process data and descriptions used in the LCA andthe results of the sensitivity analysis. The inventory analysisis also available in spreadsheet format providing all of theinputs and outputs as matrices along with the result vector
for each feedstock system. This information is available freeof charge via the Internet at http://pubs.acs.org/.
Literature Cited(1) Lehmann, J. Bio-energy in the black. Front. Ecol. Environ. 2007,
5 (7), 381–387.(2) Lehmann, J. A handful of carbon. Nature 2007, 447 (7141), 143–
144.(3) Gaunt, J. L.; Lehmann, J. Energy balance and emissions
associated with biochar sequestration and pyrolysis bioenergyproduction. Environ. Sci. Technol. 2008, 42 (11), 4152–4158.
(4) Rondon, M.; Lehmann, J.; Ramirez, J.; Hurtado, M. Biologicalnitrogen fixation by common beans (Phaseolus vulgaris L.)increases with bio-char additions. Biol. Fertil. Soils 2007, 43,699–708.
(5) Kimetu, J.; Lehmann, J.; Ngoze, S.; Mugendi, D.; Kinyangi, J.;Riha, S.; Verchot, L.; Recha, J.; Pell, A. Reversibility of soilproductivity decline with organic matter of differing qualityalong a degradation gradient. Ecosystems 2008, 11 (5), 726–739.
(6) Lehmann, J.; Pereira da Silva, J.; Steiner, C.; Nehls, T.; Zech, W.;Glaser, B. Nutrient availability and leaching in an archaeologicalAnthrosol and a Ferralsol of the Central Amazon basin: fertilizer,manure and charcoal amendments. Plant Soil 2003, 249 (2),343–357.
(7) Steiner, C.; Teixeira, W.; Lehmann, J.; Nehls, T.; de Macedo, J.;Blum, W.; Zech, W. Long term effects of manure, charcoal andmineral fertilization on crop production and fertility on a highlyweathered Central Amazonian upland soil. Plant Soil 2007, 291(1), 275–290.
(8) Ayodele, A.; Oguntunde, P.; Joseph, A.; Dias, M. d. S. Numericalanalysis of the impact of charcoal production on soil hydrologicalbehavior, runoff response and erosion susceptibility. R. Bras.Ci. Solo 2009, 33, 137–145.
(9) Bridgwater, A. V.; Czernik, S.; Piskorz, J., The status of biomassfast pyrolysis. In Fast Pyrolysis of Biomass: A Handbook;Bridgwater, A. V., Ed.; CPL Press Liberty House: Newbury, UK,2008; Vol. 2, pp 1-22.
(10) Reed, T. B.; Jantzen, D., Introduction. In Encyclopedia of BiomassThermal Conversion: The Principles and Technology of Pyrolysis,Gasification and Combustion, 3rd ed.; Reed, T. B., Ed.; TheBiomass Energy Foundation Press, 2002.
(11) Wang, M. Greenhouse gases, regulated emissions, and energyuse in transportation (GREET) model, 1.8b; UChicago Argonne,LLC: Chicago, IL, 2008.
(12) Sheehan, J.; Aden, A.; Paustian, K.; Killian, K.; Brenner, J.; Walsh,M.; Nelson, R. Energy and environmental aspects of using cornstover for fuel ethanol. J. Ind. Ecol. 2003, 7 (3-4), 117–146.
(13) Spatari, S.; Zhang, Y.; MacLean, H. L. Life cycle assessment ofswitchgrass- and corn stover-derived ethanol-fueled automo-biles. Environ. Sci. Technol. 2005, 39 (24), 9750–9758.
(14) Wu, M.; Wang, M.; Huo, H. Fuel-cycle assessment of selectedbioethanol production pathways in the United States; Centerfor Transportation Research, Energy Systems Division, ArgonneNational Laboratory: Chicago, IL, 2006.
(15) Kim, S.; Dale, B.; Jenkins, R. Life cycle assessment of corn grainand corn stover in the United States. Int. J. Life Cycle Assess.2009, 14 (2), 160–174.
(16) Agriculture and Agri-Food Canada. Corn Stover: HarvestingTechniques; http://www.agr.gc.ca (January 20, 2009).
(17) Corn Stover for Bioethanol--Your New Cash Crop? DOE/GO-102001-1273; National Renewable Energy Laboratory: Golden,CO, 2001.
(18) Womac, A. R.; Igathinathane, C.; Sokhansanj, S.; Pordesimo,L. O. Field corn stover moisture relations determined by insituweight and grab sample techniques; ASAE/CSAE AnnualInternational Meeting, Ottawa, Ontario, Canada, 2004.
(19) Deluchi, M. A Lifecycle Emissions Model (LEM): LifecycleEmissions from Transportation Fuels, Motor Vehicles, Trans-portation Modes, Electricity Use, Heating and Cooking Fuels,and Materials; UCD-ITS-RR-03-17; University of CaliforniaDavis: Davis, CA, 2003.
(20) Searchinger, T.; Heimlich, R.; Houghton, R. A.; Dong, F.; Elobeid,A.; Fabiosa, J.; Tokgoz, S.; Hayes, D.; Yu, T.-H. Use of U.S.croplands for biofuels increases greenhouse gases throughemissions from land-use change. Science 2008, 319 (5867), 1238–1240.
(21) Saft, R. J. Life cycle assessment of a pyrolysis/gasification plantfor hazardous paint waste. Int. J. Life Cycle Assess. 2007, 12 (4),230–238.
(22) Manyele, S. V. Lifecycle assessment of biofuel production fromwood pyrolysis technology. Educ. Res. Rev. 2007, 2 (6), 141–150.
832 9 ENVIRONMENTAL SCIENCE & TECHNOLOGY / VOL. 44, NO. 2, 2010
(23) Maria, F. D.; Fantozzi, F. Life cycle assessment of waste to energymicro-pyrolysis system: Case study for an Italian town. Int. J.Energy Res. 2004, 28, 449–461.
(24) Gaunt, J.; Cowie, A., Biochar, greenhouse gas accounting andemissions trading. In Biochar for Environmental Management:Science and Technology; Lehmann, J., Joseph, S., Eds.; Earthscan:London, UK, 2009; pp 317-340.
(25) Antal, M. J.; Grønli, M. The art, science, and technology ofcharcoal production. Ind. Eng. Chem. Res. 2003, 42 (8), 1619–1640.
(26) Cheng, C.-H.; Lehmann, J.; Thies, J. E.; Burton, S. D. Stabilityof black carbon in soils across a climatic gradient. J. Geophys.Res. 2008, 113, G02027.
(27) Sombroek, W.; Ruivo, M. L.; Fearnside, P. M., Amazonian DarkEarths as carbon stores and sinks. In Amazonian Dark Earths:Origin, Properties, Management; Lehmann, J., Kern, D. C., Glaser,B., Woods, W. I., Eds.; Kluwer Academic Publishers: Dordrecht,Netherlands, 2003.
(28) Lehmann, J.; Czimczik, C.; Laird, D.; Sohi, S., Stability of biocharin soil. In Biochar for Environmental Management: Science andTechnology; Lehmann, J., Joseph, S., Eds.; Earthscan: London,UK, 2009; pp 183-206.
(29) Lehmann, J.; Skjemstad, J.; Sohi, S.; Carter, J.; Barson, M.; Falloon,P.; Coleman, K.; Woodbury, P.; Krull, E. Australian climate-carbon cycle feedback reduced by soil black carbon. Nat. Geosci.2008, 1 (12), 832–835.
(30) Kuzyakov, Y.; Subbotina, I.; Chen, H.; Bogomolova, I.; Xu, X.Black carbon decomposition and incorporation into soilmicrobial biomass estimated by 14C labeling. Soil Biol. Biochem.2009, 41 (2), 210–219.
(31) Liang, B.; Lehmann, J.; Solomon, D.; Sohi, S.; Thies, J. E.;Skjemstad, J. O.; Luizao, F. J.; Engelhard, M. H.; Neves, E. G.;Wirick, S. Stability of biomass-derived black carbon in soils.Geochim. Cosmochim. Acta 2008, 72 (24), 6069–6078.
(32) Baldock, J. A.; Smernik, R. J. Chemical composition andbioavailability of thermally altered Pinus resinosa (Red pine)wood. Org. Geochem. 2002, 33 (9), 1093–1109.
(33) Steiner, C.; Glaser, B.; Teixeira, W. G.; Lehmann, J.; Blum, W. E. H.;Zech, W. Nitrogen retention and plant uptake on a highlyweathered central Amazonian Ferralsol amended with compostand charcoal. J. Plant Nutr. Soil Sci. 2008, 171 (6), 893–899.
(34) Rondon, M. A.; Molina, D.; Hurtado, M.; Ramirez, J.; Lehmann,J.; Major, J.; Amezquita, E. Enhancing the productivity of cropsand grasses while reducing greenhouse gas emissions throughbio-char amendments to unfertile tropical soils. 18th WorldCongress of Soil Science, 9-15 July 2006, Philadelphia, PA, 2006.
(35) Yanai, Y.; Toyota, K.; Okazaki, M. Effects of charcoal additionon N2O emissions from soil resulting from rewetting air-driedsoil in short-term laboratory experiments. Soil Sci. Plant Nutr.2007, 53, 181–188.
(36) Spokas, K. A.; Koskinen, W. C.; Baker, J. M.; Reicosky, D. C.Impacts of woodchip biochar additions on greenhouse gasproduction and sorption/degradation of two herbicides in aMinnesota soil. Chemosphere 2009, 77 (4), 574–581.
(37) Singh, B. P.; Hatton, B.; Singh, B.; Cowie, A. L.; Kathuria, A.Influence of biochars on nitrous oxide emission and nitrogenleaching from two contrasting soils. J. Environ. Qual. 2010, 39.
(38) Forster, P.; Ramaswamy, V.; Artaxo, P.; Berntsen, T.; Betts, R.;Fahey, D. W.; Haywood, J.; Lean, J.; Lowe, D. C.; Myhre, G.;Nganga, J.; Prinn; R. Raga, G.; Schulz, M.; Dorland, R. V. 2007:Changes in atmospheric constituents and in radiative forcing.In Climate Change 2007: The Physical Science Basis. Contributionof Working Group I to the Fourth Assessment Report of theIntergovernmental Panel on Climate Change; Solomon, S., Qin,D., Manning, M., Chen, Z., Marquis, M., Averyt, K. B., Tignor,M., Miller, H. L., Eds.; Cambridge University Press: Cambridge,United Kingdom and New York, 2007.
(39) IPCC. Climate Change2007: Synthesis Report; Contribution ofWorking Groups I, II and III to the Fourth Assessment Report ofthe Intergovernmental Panel on Climate Change; Pachauri, R. K.,Reisinger, A., Eds.; IPCC: Geneva, Switzerland, 2007; p 104.
(40) Melillo, J. M.; Gurgel, A. C.; Kicklighter, D. W.; Reilly, J. M.; Cronin,T. W.; Felzer, B. S.; Paltsev, S.; Schlosser, C. A.; Sokolov, A. P.;Wang, X. Unintended environmental consequences of a globalbiofuels program; 168; MIT Joint Program on the Science andPolicy of Global Change, 2009.
(41) Kim, H.; Kim, S.; Dale, B. E. Biofuels, land use change, andgreenhouse gas emissions: Some unexplored variables. Environ.Sci. Technol. 2009, 43 (3), 961–967.
(42) Krausmann, F.; Erb, K.-H.; Gingrich, S.; Lauk, C.; Haberl, H.Global patterns of socioeconomic biomass flows in the year2000: A comprehensive assessment of supply, consumption andconstraints. Ecol. Econ. 2008, 65 (3), 471–487.
(43) Fossil-Fuel CO2 Emissions; Carbon Dioxide Information AnalysisCenter, Oak Ridge National Laboratory: Oak Ridge, TN, 2009;http://cdiac.ornl.gov/trends/emis/meth_reg.html.
(44) Perlack, R. D.; Wright, L. L.; Turhollow, A. F.; Graham, R. L.;Stokes, B. J.; Erback, D. C. Biomass as feedstock for a bioenergyand bioproducts industry: The technical feasibility of a billion-ton annual supply; U.S. Department of Energy and U.S.Department of Agriculture: Oak Ridge, TN, 2005.
ES902266R
VOL. 44, NO. 2, 2010 / ENVIRONMENTAL SCIENCE & TECHNOLOGY 9 833