“leverage (financial and operating) impact on … based research journal issn online (2304-7151)...
TRANSCRIPT
American Based Research Journal ISSN Online (2304-7151) Vol 1-3
“Leverage (Financial and Operating) Impact on profitability of oil and gas sector of SAARC Countries”
Qasim SaleemLahore Business School
PakistanDr. Ramiz Ur RahmanLahore Business School
PakistanDr Naheed Sultana
Lahore Business SchoolPakistan
Abstract
The main objective of this topic is to analyze and understand the effect of leverage on the profitability of the oil and gas sector of SAARC countries. It analyzes the relationship between leverage (Financial, operating and combined) and EPS of this sector. It aims to analyze how earning capacity of this sector is affected by operating costs and fixed financial charges. This explains the relationship between the Debt equity ratio and EPS and how effectively this sector be able debt financing. In this study selected oil and gas companies are taken for analysis and hypothesis are examined with the statistical methods of one way ANOVA and t-test.
Leverage is basically explained as the use of borrowed money to make an investment and return on that investment. It is more risky for a company which has ratio of financial leverage. But financial leverage is commonly used in various circumstances specially oil and gas sector as a means of altering the cash flow and financial position of a company. There are the following four positions which show a relationship with the level of financial leverage.First, it is the relation of equity and debt that means the rate of capital. The other is the influences on business operations and cycle of financial leverage. Then the company's industry and its branches as whole financial leverage level. Then the correlation between the current financial leverage ratio of the company with the middle leverage level. Lastly, the possibility of company's mission and philosophy with the situation connected to the ratios of financial leverage. The outcome of the financial leverage can also be used to push up income and growth however, it is much common for business industries in the phase of the boom period. Financial leverage ratio is relative to changing of profit and contrary to stability. Financial leverage greatly affects return on assets, return on investment and return on equity.
Need and Objectives of the Study:
An investor who would like to be rational and scientific in his investment activity has to evaluate a lot of information about past performance and the expected future performance of the companies, industries and the economy as a whole before taking the investment decision and hence, the present study attempts to analyze the impact of leverage on profitability of selected oil and gas companies in SAARC.The following are the objectives of the study
• To understand and analyze the leverage effects of the selected oil and gas companies.• To analyze the impact of leverage on profitability
• To assess the relationship between the financing mix and earnings per share.
Scope:
Financial Leverage
Financial Leverage is caused due to fixed financial interest in every organization. It is the ability of a business to use fixed financial charges to magnify the effects of changes in EBIT on the earning per share and profits. It involves the use of funds obtained at a fixed cost in the hope of increasing the return to the shareholders in future. The financial leverage is employed by every company is intended to earn more return on the fixed-charge funds than their costs. The surplus (or deficit) will increase (or decrease) the
http://www.abrj.org Page 29

American Based Research Journal ISSN Online (2304-7151) Vol 1-3
return on the owner’s equity and return on investments.
Combined Leverage
Operating and financial leverages together cause wide fluctuation in EPS for a given change in sales and operating costs. It can be calculated by multiplying the operating leverage and financial leverage. The operating leverage affects the EBIT and the financial leverage affects the EPS, ROE and ROI. The management has to manage a right combination of the operating and financial leverage. A company whose sales fluctuate widely and erratically should avoid use of high leverage because it will be exposed to a very high degree of risk.
Leverage and Earning Per Share
There is a close relationship between the financial leverage and Earning per Share of the company. If degree of financial leverage is high and the return on investment is greater than the cost of debt capital, then the impact of leverage on EPS will be favorable. The impact of financial leverage is unfavorable when the earning capacity of the firm is less than what is expected by the lenders (i.e.) the cost of debt.
Leverage and Return on investments:
The return on investment comes from leverage appreciation of the assets value which is normally based on income. It means assets are purchased with only a portion of the purchase price coming from the buyer and the balance coming from the lender. Any increases in the value of the entire assets represent a real return on the original amount invested and the investor will make profits in the long run.
Literature Review
Different industry presents different profitability. One of the old researches by Kotany (1922) found that different industry generates different level of profitability. Each industry requires different amount of capital and generates different amount of return such as the rates of profit in shoe
manufacturing industry is greater than tanning, commercial wheat flour mill, meat packing, milk and milk products, and agriculture industry.
Leland and Pyle (1977) model also predicts a positive correlation between firm quality and leverage. Similar arguments are presented by Brennan and Kraus (1987); Kale and Noe (1991). Graham (2000) estimates the marginal tax benefit of debt as a function of the amount of interest deducted and calculates total tax benefits of debt by integrating under this function
Hirshliefer and Thakor (1992) argue that when managers have career concerns, using stock options may actually motivate them to follow a conservative investment policy.Previous studies of the relationship between leverage and growth, such as McConnell and Servaes (1995) and Lang et al. (1996), use pooling regressions and in effect ignore individual firm effects.
The theories of Jensen (1986), Stulz (1990), and Grossman and Hart (1982) also suggest a negative relationship between leverage and investment, but their arguments are based on agency conflicts between managers and shareholders.Grounded on the pecking order theory, Myers and Majluf (1984) argued that the firm prefers the debt finance to the equity finance when using external financing. The signaling theory (Ross, 1977; Heinkel, 1982; Stien, 1992) states that a firm with favorable prospects will raise new capital through debt financing, while a firm with unfavorable prospects will go through equity financing. Incentive-signaling model developed by Ross (1977), provides a theory for the determination of the financial structure of the firm.
In their 1969 college textbook, Weston and Brigham told some of today’s businessmen and women that, "High fixed costs and low variable costs provide the greater percentage change in profits both upward and downward." [Weston, 86]
Archer and D’Ambrosio in their 1972 textbook said that, "The higher the proportion of fixed costs to total costs the higher the operating leverage of the firm..." [Archer, 421]. In their 1972 textbook,
http://www.abrj.org Page 30
American Based Research Journal ISSN Online (2304-7151) Vol 1-3
Schultz and Shultz, said that, "Since a fixed expense is being compared to an amount which is a function of a fluctuating base (sales), profit-and-loss results will not bear a proportionate relationship to that base. These results in fact will be subject to magnification, the degree of which depends on the relative size of fixed costs vis-a-vis the potential range of sales volume. This entire subject is referred to as operating leverage." [Schultz, 86]Roden and Lewellen took a sample of US firms from 1981 through 1990 and found a positive relationship between profitability and leverage.
Lang, Ofek and Stulz (1996) further contend that leverage affects growth of firms that have fewer investment opportunities because the likelihood of managers wasting resources in such firms is higherLang et al. (1996) distinguish between the impacts of leverage on growth in a firm’s core business from that in its non-core business. They argue that if leverage is a proxy for growth opportunities, its contractionary impact on investment in the core segment of the firm should be much more pronounced than in the non-core segment.
Debt on the other hand is usually defined as a contractual obligation to make a fixed payment or to make series of payments (Williams, Smith, and Young, 1998). Therefore, debt can also be defined as the liabilities mentioned in the balance sheet.Debt is one of the tools used by many companies to leverage their capital in order to increase profit. However, the affectivity of debt to increase profitability varies between companies. The ability of the company’s management to increase their profit by using debt indicates the quality of the management’s corporate governance. Good corporate governance shows the companies’ performance on their use of debt to increase their profit (Maher and Andersson, 1999).
One of the ways to measure the profit enjoyed by shareholders is by using return on equity (ROE) ratio. The reason is that ROE ratio is comparable between one companies to the other and can indicate the profitability of one industry with the other (Helfert, 2001).This is supported by Helfert (2001) on his book that financial performance measures and its
meanings vary by industry segments. Type of industry indicates risk, and tenacity to economic and political condition that affect the companies’ profitability. Therefore different industry might presents different rate of profitability.
Liang and Singh [2001] assert that the typical simplified financial statement approach used in textbooks fails to focus on the key issues and may lead to student confusion by introducing additional details that must also be explained. They offer a break-even point implied by the typical EBIT-EPS analysis used in many textbooks. Liang and Singh contend the break-even point suggests a straightforward cost of funds perspective that students can easily understand. Although Liang and Singh state their indifference point in terms of operating ROI, they demonstrate the decisions suggested by their criterion are identical to those found using examples which rely on break-even EPS analysis and the associated assumptions concerning numbers of shares outstanding.
Burney, Boyles, and Marcis [2001] discuss the use of the common comparative financial statement approach when the example statements are developed ad hoc during a spontaneous explanation of financial leverage which may arise before capital structure is formally addressed in the course. The authors point out those unintended counterproductive results may arise when such an ad hoc example is not properly structured with respect to interest rates and returns on equity. In their paper, reference is also made to the indifference point for capital structure changes as being defined relative to the Basic Earning Power (BEP) ratio, which is identical to Liang and Singh’s operating ROI.
Luoma and Spiller [2002] discuss teaching financial leverage in the context of accounting education. Primarily arguing for specific coverage of financial leverage in introductory accounting textbooks, they essentially introduce the multi-case simplified financial statements approach common in finance textbooks to their intended audience of accounting educators. Luoma and Spiller acknowledge that such material is usually given an entire chapter in prominent finance textbooks, but express concern that the lack of coverage in
http://www.abrj.org Page 31
American Based Research Journal ISSN Online (2304-7151) Vol 1-3
introductory accounting textbooks does not communicate the importance of the issue to financial managers who may take only the typical introductory level two course sequence in accounting. Their treatment of the issue is of interest to finance professors primarily because of its inclusion of relevant common accounting terminology (for example, “leverage benefit to common shareholders”).
Huang and Song employed a database which contained the market and accounting data from more than 1000 Chinese listed companies up to the year 2000. Authors found that leverage in Chinese firms increases with firm size, non-debt tax shields and fixed assets, and decreases with profitability and correlates with industries.Abor collected data from listed firms in Ghana and found a positive relationship between profitability and leverage. Nguyen and Neelakantan used small and medium Vietnamese firms to collectdata and found that leverage is positively related to firm growth and firm size, and negatively related to tangibility.
As it is explained by Michael Porter that industry presents different pattern of profitability due to different forces that the industry exposed to such as concentration, entry barriers, and growth (Spanos, Zaralis, and Lioukas, 2004).This means that when the macroeconomic condition is declining, then the value of return on equity ratio will also decline because the cash is used for investment. The other findings made by Lawrence, Diewert, and Fox (2004) describe that firm’s profit is affected by the change in productivity, price, and firm’s size.
However, to increase the assets to generate more profits, companies might use leverage. One type of leverage that companies use is debt. When debt is used to expand the companies by adding more operational assets, then it can generate more cash flows which are expected to increase the value of return on equity ratio (Brigham and Ehrhardt, 2005).This means that the company’s management can make use of the debt to increase the profit. It also can indicate the ability of company’s management
to maximize its operation on assets in making profit (Brigham and Ehrhardt, 2005).
Lyandres and Zdhanov (2005) find a positive relationship between leverage and investment for COMPUSTAT firms from 1970–2003. They argue that in a dynamic setting, firms compare the benefits of waiting, as value of real options increase with time, against the cost of rising default risk.The debt indicates all the current liabilities and long term debt. While the assets which is usedin calculating debt ratio, are the total assets mentioned on the balance sheet. This ratio indicates the size of debt in accordance to the assets owned. Theoretically the increase in the value of debt ratio will also trigger the increase value of ROE ratio (Brigham and Ehrhardt, 2005).Profitability can be affected by operating decisions when the assets are used effectively to increase profit. Operating decisions can indicate the effectiveness of the companies’ management in making the profit from the assets used. Therefore operational efficiency can be achieved by dividing sales or revenue with total assets (Sari, 2007).
There are several previous researches regarding the effect of debt to the value of ROE. One of them is Husnan (2001) that described that the use of debt statistically significant to the change in the value of non-multinational companies ROE, while it is not significant to the multinational companies. However, the research made by Harjanti and Tandelilin (2007) to all manufacture companies listed in Jakarta Stock Exchange from 2000 to 2004 indicated that profitability which was proxy by ROE, basic earning power (BEP), and gross profit ratio had negative significance to leverage.
If the Gross Domestic Product increases, then there is possibility that the inflation rate will also increase. Then if the inflation rate increases, the government will try to suppress it by increasing the Bank Indonesia interest rate (Chen, and Mahajan, 2008).
According to Brigham and Ehrhardt (2005), the value of ROE is affected by profit margin ratio, total assets turnover and equity multiplier or so called asset to equity ratio. Equity multiplier ratio
http://www.abrj.org Page 32
American Based Research Journal ISSN Online (2304-7151) Vol 1-3
is one of the financial ratios that can describe the availability of debt in making profit. ROE=Profit margin×Total Assets Turnover × Equity multiplier
The research on the use of Du Pont analysis to measure the profitability of a company has been used by many researchers. One of them is Listiadi (2007) who described that Du Pont analysis to investigate the company’s profitability that uses return on equity analysis is best used to measure the return on stockholder’s capital. Chen and Mahajan (2008) investigated the effects of macroeconomic conditions on corporate liquidity in 45 countries from 1994 to 2005.
The results show that macroeconomic variables such as gross domestic product growth rate, inflation, short term interest rate and government deficit affect corporate cash holdings. Company tends to hold more cash when the macro economy is developing, and reduce the cash for investment when the macro economy is declining.
Their research founds that when the companies increase their size to increase their productivity, the shareholders will enjoy higher return even though the product price decreases. This means that when the companies size increase, the profit of the companies will also increase.
Denis and Denis (2006) also look at the relationship between leverage and investment, but they do it in the context of diversified and focused firms. They argue that in diversified firms, investment is unevenly distributed over the high and low growth segments, and managers have the discretion to allocate debt service burden between different segments.
According to MSCI barra Research bulletin in 2008 is that a positive return to this risk factor indicates that highly leveraged firms are performing better than their less leveraged counterparts and vice versa. It was found that this factor generally moved in the same direction as the overall stock market but was also strongly influenced by the degree of risk aversion, dropping sharply during times of market stress, as observed during the current crisis as well as previous ones in the late 1990s and early 2000s.
The first study on bankruptcy and financial dire straits of enterprises was conducted by Beaver(1967). Covering 79 successful and failing enterprises during the period between 1954 and 1964, his study discusses the reasons of failure such as bankruptcy, failure in due payment of the bond yield and failure to pay the profit shares.
On the other hand, Altman (1968) uses the multiple discriminant analysis in his study. Within the scope of his analysis, he categorizes the enterprises into two groups: bankrupt and non bankrupt enterprises. Analyzing 33 bankrupt and 33 non-bankrupt enterprises according to the 22 ratios he identified under the category of basic ratios (liquidity ratio, financial leverage ratios, solvency ratios, efficiency and profitability ratios), the author achieved a successful prediction rate of 94% by obtaining the discriminant scores which yield the best results (Z score).
Myers explains that agency costs of debt may cause firms to take riskier investment after the issuance of debt to expropriate wealth from the firm’s bondholders because the firm’s equity is effectively a stock option.
Al-Qaisi collected data from United Arab Emirates (UAE) and found a negative relationship between profitability and leverage, and a positive relationship between firm size and leverage.
Odit and Gobardhun collected data from Mauritius firms. The authors found a positive association between leverage, asset structure, and firm’s growth. fza and Hussain used pooled data regression model on the sample of 26 firms f Automobile sector of Pakistan and found that capital structure is negatively correlated with profitability and positively correlated with taxes.
Previous studies of the relationship between leverage and growth, such as McConnell and Servaes (1995) and Lang et al. (1996), use pooling regressions and in effect ignore individual firm effects. To address the endogeneity issue mentioned earlier, that leverage might proxy for growth opportunities, Lang et al. (1996)
http://www.abrj.org Page 33
American Based Research Journal ISSN Online (2304-7151) Vol 1-3
distinguish between the impacts of leverage on growth in a firm’s core business from that in its non-core business.
They argue that if leverage is a proxy for growth opportunities, its contractionary impact on investment in the core segment of the firm should be much more pronounced than in the non-core segment.
The 3rd Meeting of SAARC Energy Ministers held in Colombo on January 29 with the participation of all SAARC Member States, the SAARC Secretariat and the SAARC En-ergy Centre. The meeting was chaired by Minister of Power and Energy of Sri Lanka, Mr. W. D. J. Seneviratne.
The Meeting of Energy Ministers was preceded by a meeting of Senior Officials on January 28, chaired by Secretary of the Ministry of Power and En-ergy of Sri Lanka, Mr. M. M. C. Ferdinando. The meeting discussed issues that included a Regional Energy Trade Study, an Action Plan on Energy Conservation and Energy Efficiency, Concept of a South Asian Energy Ring, Common Template on Technical and Commercial Aspects of the Electricity Grid Interconnections amongst the SAARC Mem-ber States and a Concept Paper on Joint Import of Crude Oil.
The main objective of this topic is to analyze and understand the effect of leverage on the profitability of the oil and gas sector of SAARC countries. It analyzes the relationship between leverage (Financial, operating and combined) and EPS of this sector. It aims to analyze how earning capacity of this sector is affected by operating costs and fixed financial charges. This explains the relationship between the Debt equity ratio and EPS and how effectively this sector be able debt financing. In this study selected oil and gas companies are taken for analysis and hypothesis are examined with the statistical methods of one way ANOVA and t-test.Leverage is basically explained as the use of borrowed money to make an investment and return on that investment. It is more risky for a company which has ratio of financial leverage. But financial leverage is commonly used in various
circumstances specially oil and gas sector as a means of altering the cash flow and financial position of a company. There are the following four positions which show a relationship with the level of financial leverage.First, it is the relation of equity and debt that means the rate of capital. The other is the influences on business operations and cycle of financial leverage. Then the company's industry and its branches as whole financial leverage level. Then the correlation between the current financial leverage ratio of the company with the middle leverage level. Lastly, the possibility of company's mission and philosophy with the situation connected to the ratios of financial leverage. The outcome of the financial leverage can also be used to push up income and growth however, it is much common for business industries in the phase of the boom period. Financial leverage ratio is relative to changing of profit and contrary to stability. Financial leverage greatly affects return on assets, return on investment and return on equity.
SAARC Energy Sector Overview
SAARC Member states have wide variation in the energy resources endowments. Pakistan and India are accounted for major share and contribution of oil, Natural gas and coal. However these geographical area of SAARC countries are large enough due to population and need in future that they are not able to meet future demands and needs so they have to contact with other sources of needs and other investments in other sources. Nepal and Bhutan heavily dependent on hydroelectric power plants and they see that they should have enough resources of energy to fulfill future demands and needs. Afghanistan is heavily dependent on imported energy.
The Maldives is largely dependent on oil and Bhutan, Nepal and Sri Lanka need a large part of their commercial energy needs, particularly electricity from hydropower, but are greatly dependent on imported petroleum products to meet the energy needs in other sectors of the economy. Bangladesh is largely reliant on natural gas. Such a greatly dependence on a single energy source form not only limits the choices of meeting different energy demands but also enhances the energy security concerns.
http://www.abrj.org Page 34
American Based Research Journal ISSN Online (2304-7151) Vol 1-3
Current Energy Trade between SAARC Member States
The existing geographical energy trade is made among the SMS is limited to electricity transfer between Bhutan-India and as well as India-Nepal which is of 5,620GWh and 329GWh respectively and export in petroleum products between India, Nepal, Bhutan, Bangladesh and Sri Lanka.
While the electricity is traded as based on different resources, the petroleum trade is particularly India is importing crude oil in excess of its demand to satisfy the petroleum demand in Bhutan, Nepal and some part of that of Sri Lanka. As a result of increase refining capacity and availability of excess of specific petroleum products, India started exporting diesel to Bangladesh. With the Indian Oil companies taking stake in the Sri Lankan petroleum industry, it is helping in partially meeting the petroleum product demand in Sri Lanka.
Bangladesh imports round 3-4 million tons of coal from the SAARC alliances and beyond the amount of imports may increase largely in coming years and the Government of Bangladesh is actively considering some coal based power plants for the country and the regional energy trade between South Asia and the rest of the world covers petroleum, coal, and limited electricity trade.
No inter or intra-Geographical gas transmission infrastructure is in place to meet the gas imports, except for the LNG terminals in India satisfying its own requirements. The inter-regional electricity trade is limited to Afghanistan importing power from Central Asian Republics (CAR) and Pakistan from Iran.
But the volume of this trade is nominal in comparison to its potential, the exploitation of which would require building of the essential infrastructure to support trade.
Financing of Projects
There are many and different stakes across the world who use cars and have financial worth to
invest and continue their projects and willingness to export energy to other SAARC countries and across geographical boundaries. Their investments by exporting the energy supplies to South Asia and them themselves, or in association with other investors can finance the interregional energy trade projects between South Asia and its neighboring regions.
Methodology
The study will adopt an analytical and descriptive research design. The data of the sample companies will be collected from the annual reports and the balance sheet published by the companies and the websites of the companies of SAARC Countries.
Sampling Techniques: The study will be done with special reference to public limited companies. The reason is being that the data or financial statements are readily available for them. The technique of Convenient Sampling is being adopted for the study.
Sample Design
Sampling Techniques:
The study is done with special reference to public limited companies. The reason is being that the data or financial statements are readily available for them. The technique of Convenient Sampling is being adopted for the study. The election of sample companies is made on the basis of market capitalization and they are selected among the top gainers during the last 10 years of SAARC countries.
Sample size: SAARC Public Limited companies.
Tools Used for Analysis
Leverage analysis, Mean, Standard Deviation,
Skewness “Lack of symmetry” used to understand the distribution of data.
It is the convexity of frequency curve and to test Correlation analysis and test of significance.
Analysis of variance (ANOVA):
http://www.abrj.org Page 35
American Based Research Journal ISSN Online (2304-7151) Vol 1-3
The statistical tool that is used for testing hypothesis is one-way Analysis of Variance.
Theoretical framework: Dependent Variable:
Return on Equity, Return on Investment, Return on Assts
Independent Variable:
Leverage (Financial, Operating)
Hypothesis of the Study
For better understanding of the effect of leverage on the profitability, the following hypothesis can be framed.
FL= Financial Leverage, OL = Operating Leverage, CL = Combined Leverage
Hypothesis 1 (H0): There is no significant relationship between FL and ROI
Hypothesis 2 (H0): There is no significant relationship between FL and ROE
Hypothesis 3 (H0): There is no significant relationship between FL and ROA
FL=Financial leverage
OP=operating leverage
Models:
ROE = α1 +β 11FL+ β12 OP+ Ui ---------------------- Model (1)
ROI = α2 + β21FL + β22 OL +Ui ----------------------- Model (2)
ROA = α3 + β31FL + β32 OL +Ui ----------------------- Model (3)
ROI= Return on investment
Hypothesis 1 (H0): There is no significant relationship between FL and ROI
Hypothesis 1 (H1): There is significant relationship between FL and ROI
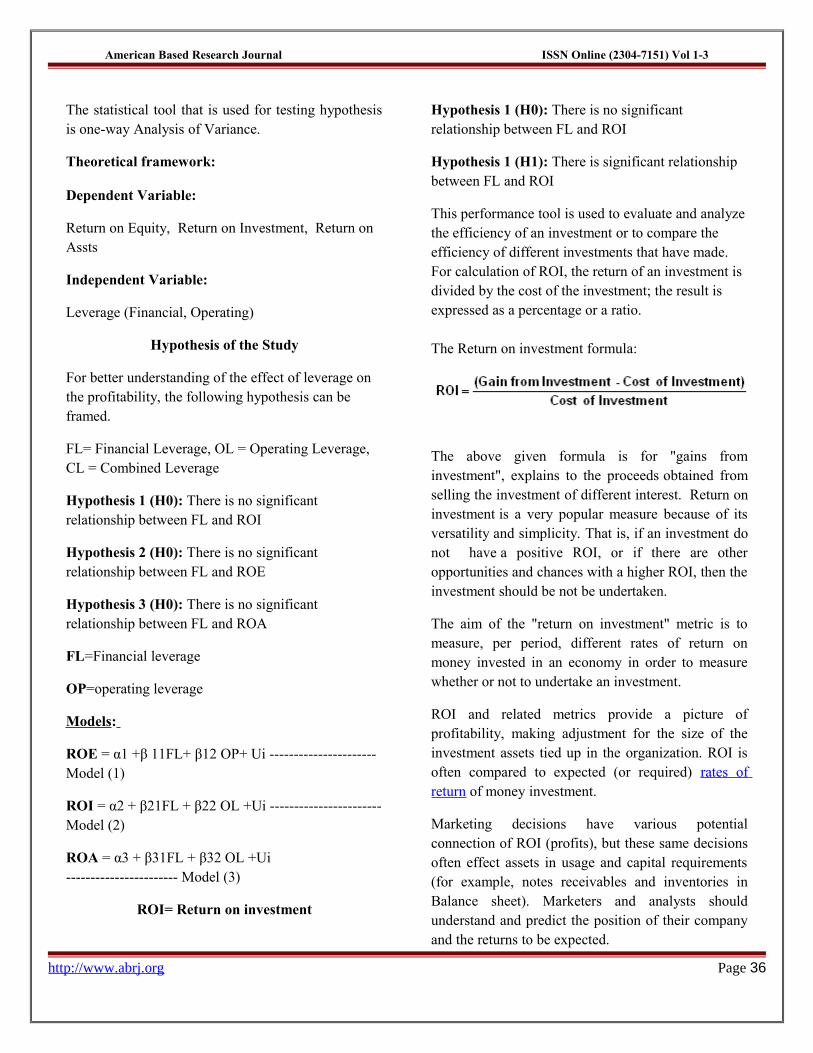
This performance tool is used to evaluate and analyze the efficiency of an investment or to compare the efficiency of different investments that have made. For calculation of ROI, the return of an investment is divided by the cost of the investment; the result is expressed as a percentage or a ratio.
The Return on investment formula:
The above given formula is for "gains from investment", explains to the proceeds obtained from selling the investment of different interest. Return on investment is a very popular measure because of its versatility and simplicity. That is, if an investment do not have a positive ROI, or if there are other opportunities and chances with a higher ROI, then the investment should be not be undertaken.
The aim of the "return on investment" metric is to measure, per period, different rates of return on money invested in an economy in order to measure whether or not to undertake an investment.
ROI and related metrics provide a picture of profitability, making adjustment for the size of the investment assets tied up in the organization. ROI is often compared to expected (or required) rates of return of money investment.
Marketing decisions have various potential connection of ROI (profits), but these same decisions often effect assets in usage and capital requirements (for example, notes receivables and inventories in Balance sheet). Marketers and analysts should understand and predict the position of their company and the returns to be expected.
http://www.abrj.org Page 36
American Based Research Journal ISSN Online (2304-7151) Vol 1-3
In current study of USA market analysis it is shown in a survey that nearly 200 senior marketing managers, 77 % responded that they found the "return on investment" metric very useful.
Calculation
For a single-period of an organization review the division of the return (net profit) by the resources that were made (investment).
Return on investment (%) = Net profit / Investment × 100
or
Return on investment = (Gain from investment - Cost of investment) / cost of investment
Leverage and Return on Investment (ROI)
A great deal of the return on investment comes from leveraged appreciation of the assets value by which is normally based upon the return.
By leverage, we mean that the assets are being purchased with a portion of the purchase price coming from the buyers and the balances coming from lenders. The loan will be repaid by the occupants' rental payments to the new buyers; therefore any appreciation in value of the asset represents a real return on the original amount invested. In short, the original loan will ultimately be paid off by tenants and the investors will profit in the long period.
The more leverage, the greater returns can be, but the losses can be larger as well. Leveraging your investment essentially makes the return more volatile, and if you can’t stomach the risk, don’t bother. If you own less risky investments than only individual stocks (and we hope you do) it makes little sense to lever your investments. If you want to up the risk in your portfolio, why not just take a smaller step and adjust your equity allocation upward? If you feel particularly strongly about a particular stock, you can invest in a LEAP, which may provide the upside of leverage when returns are high but may allow you to avoid paying out additional principal if the investment goes south.
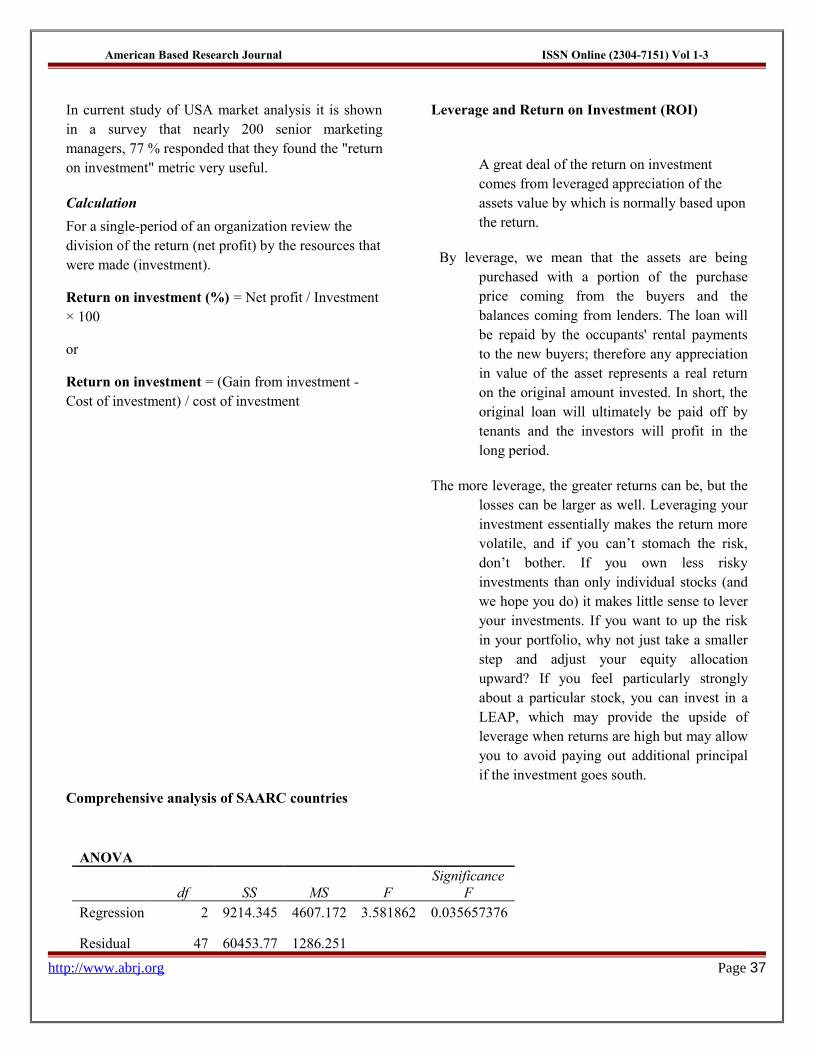
Comprehensive analysis of SAARC countries
ANOVA
df SS MS FSignificance
FRegression 2 9214.345 4607.172 3.581862 0.035657376
Residual 47 60453.77 1286.251
http://www.abrj.org Page 37
American Based Research Journal ISSN Online (2304-7151) Vol 1-3
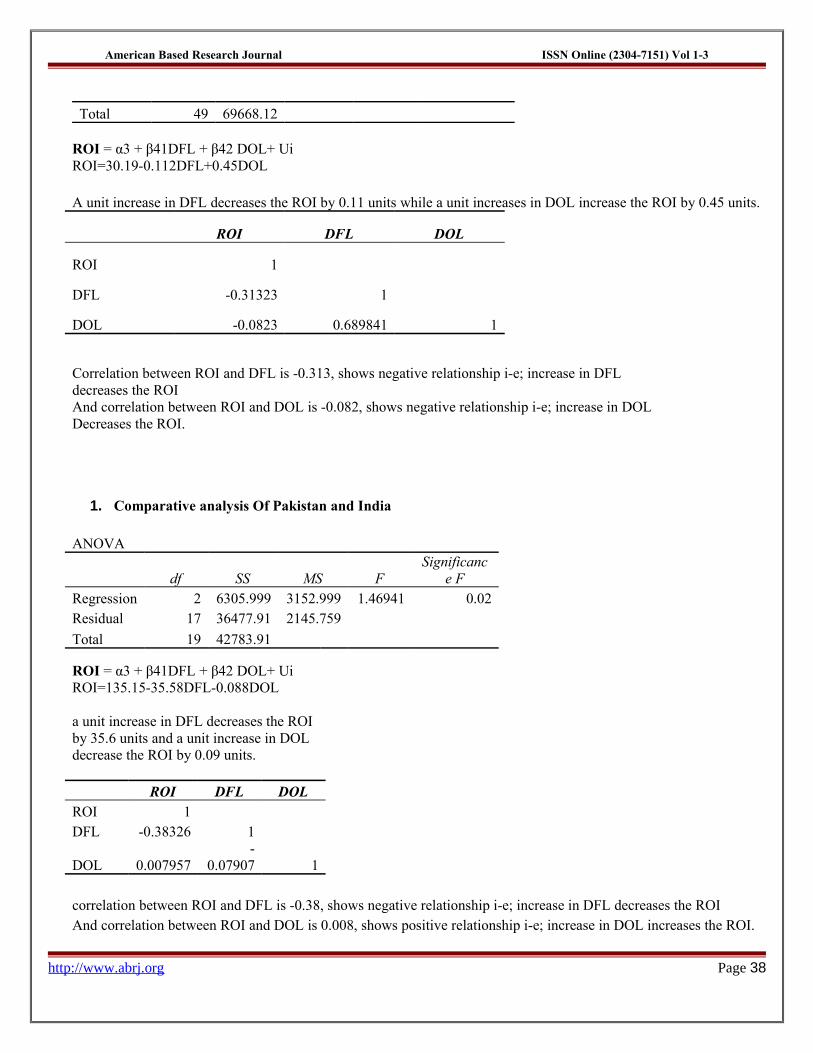
Total 49 69668.12
ROI = α3 + β41DFL + β42 DOL+ Ui ROI=30.19-0.112DFL+0.45DOL
A unit increase in DFL decreases the ROI by 0.11 units while a unit increases in DOL increase the ROI by 0.45 units.
ROI DFL DOL
ROI 1
DFL -0.31323 1
DOL -0.0823 0.689841 1
Correlation between ROI and DFL is -0.313, shows negative relationship i-e; increase in DFL decreases the ROIAnd correlation between ROI and DOL is -0.082, shows negative relationship i-e; increase in DOL Decreases the ROI.
1. Comparative analysis Of Pakistan and India
ANOVA
df SS MS FSignificanc
e FRegression 2 6305.999 3152.999 1.46941 0.02Residual 17 36477.91 2145.759
Total 19 42783.91
ROI = α3 + β41DFL + β42 DOL+ Ui ROI=135.15-35.58DFL-0.088DOL
a unit increase in DFL decreases the ROI by 35.6 units and a unit increase in DOL decrease the ROI by 0.09 units.
ROI DFL DOLROI 1DFL -0.38326 1
DOL 0.007957-
0.07907 1
correlation between ROI and DFL is -0.38, shows negative relationship i-e; increase in DFL decreases the ROIAnd correlation between ROI and DOL is 0.008, shows positive relationship i-e; increase in DOL increases the ROI.
http://www.abrj.org Page 38
American Based Research Journal ISSN Online (2304-7151) Vol 1-3
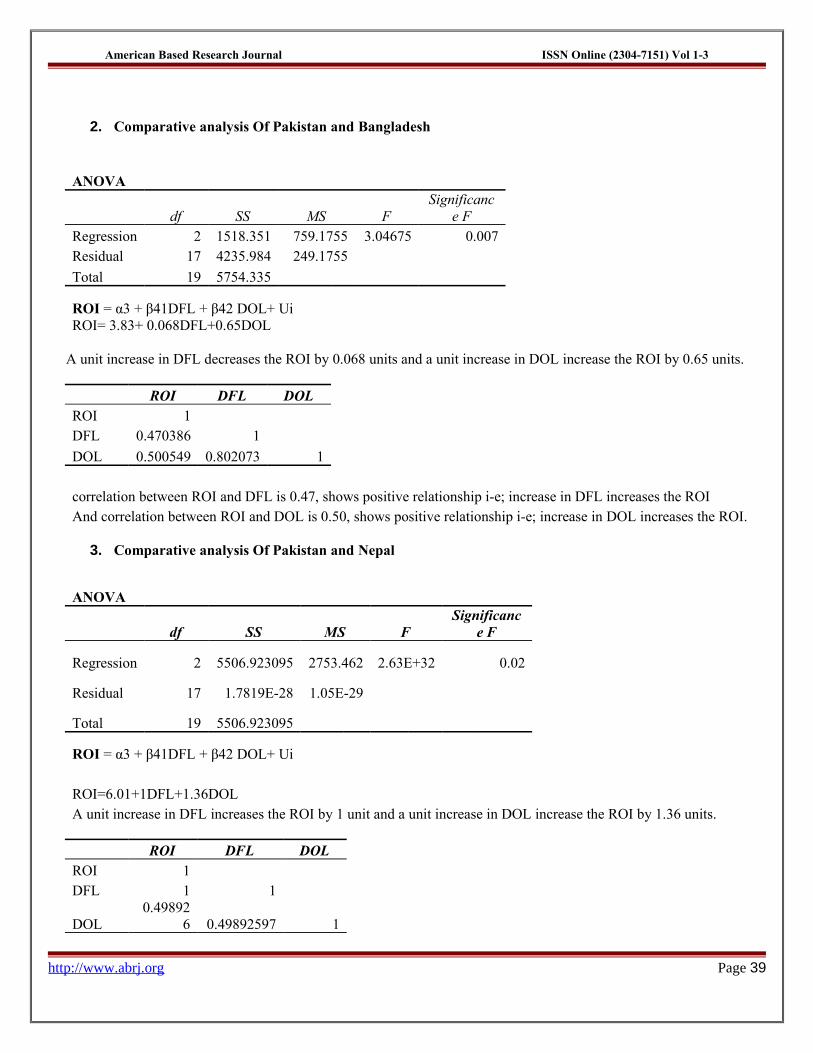
2. Comparative analysis Of Pakistan and Bangladesh
ANOVA
df SS MS FSignificanc
e FRegression 2 1518.351 759.1755 3.04675 0.007Residual 17 4235.984 249.1755
Total 19 5754.335
ROI = α3 + β41DFL + β42 DOL+ Ui ROI= 3.83+ 0.068DFL+0.65DOL
A unit increase in DFL decreases the ROI by 0.068 units and a unit increase in DOL increase the ROI by 0.65 units.
ROI DFL DOLROI 1DFL 0.470386 1
DOL 0.500549 0.802073 1
correlation between ROI and DFL is 0.47, shows positive relationship i-e; increase in DFL increases the ROIAnd correlation between ROI and DOL is 0.50, shows positive relationship i-e; increase in DOL increases the ROI.
3. Comparative analysis Of Pakistan and Nepal
ANOVA
df SS MS FSignificanc
e F
Regression 2 5506.923095 2753.462 2.63E+32 0.02
Residual 17 1.7819E-28 1.05E-29
Total 19 5506.923095
ROI = α3 + β41DFL + β42 DOL+ Ui
ROI=6.01+1DFL+1.36DOLA unit increase in DFL increases the ROI by 1 unit and a unit increase in DOL increase the ROI by 1.36 units.
ROI DFL DOLROI 1DFL 1 1
DOL0.49892
6 0.49892597 1
http://www.abrj.org Page 39
American Based Research Journal ISSN Online (2304-7151) Vol 1-3
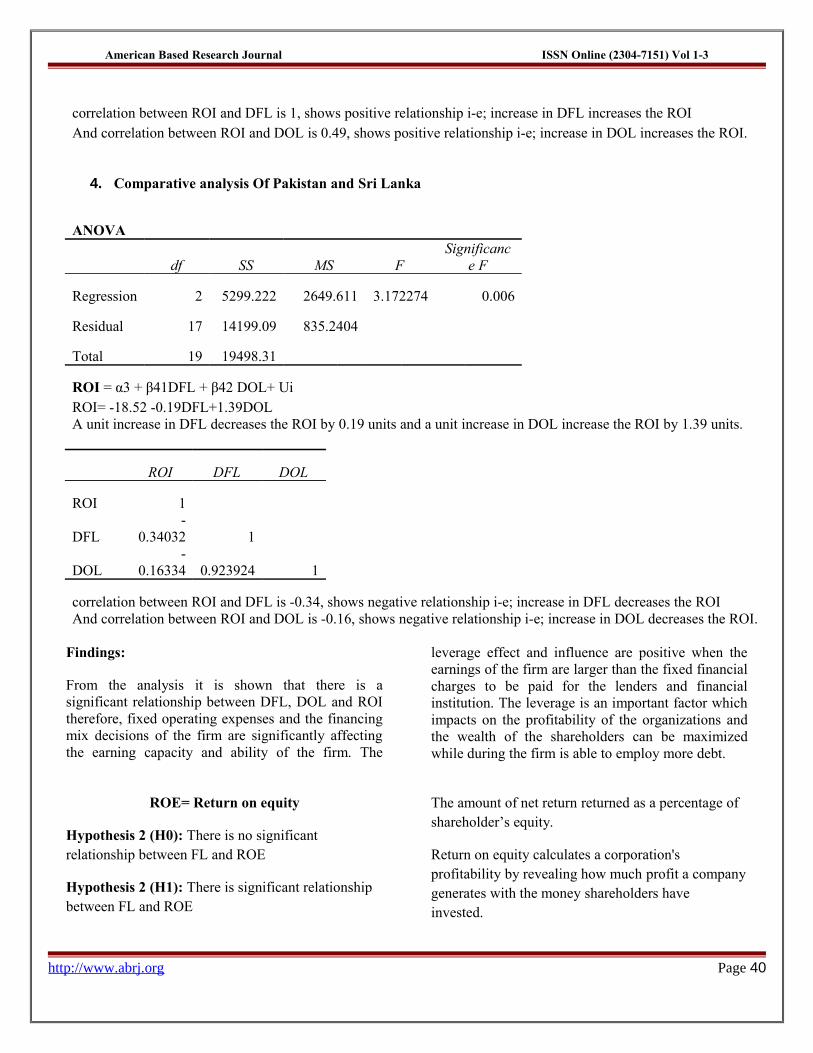
correlation between ROI and DFL is 1, shows positive relationship i-e; increase in DFL increases the ROIAnd correlation between ROI and DOL is 0.49, shows positive relationship i-e; increase in DOL increases the ROI.
4. Comparative analysis Of Pakistan and Sri Lanka
ANOVA
df SS MS FSignificanc
e F
Regression 2 5299.222 2649.611 3.172274 0.006
Residual 17 14199.09 835.2404
Total 19 19498.31
ROI = α3 + β41DFL + β42 DOL+ Ui ROI= -18.52 -0.19DFL+1.39DOLA unit increase in DFL decreases the ROI by 0.19 units and a unit increase in DOL increase the ROI by 1.39 units.
ROI DFL DOL
ROI 1
DFL-
0.34032 1
DOL-
0.16334 0.923924 1
correlation between ROI and DFL is -0.34, shows negative relationship i-e; increase in DFL decreases the ROIAnd correlation between ROI and DOL is -0.16, shows negative relationship i-e; increase in DOL decreases the ROI.
Findings:
From the analysis it is shown that there is a significant relationship between DFL, DOL and ROI therefore, fixed operating expenses and the financing mix decisions of the firm are significantly affecting the earning capacity and ability of the firm. The
leverage effect and influence are positive when the earnings of the firm are larger than the fixed financial charges to be paid for the lenders and financial institution. The leverage is an important factor which impacts on the profitability of the organizations and the wealth of the shareholders can be maximized while during the firm is able to employ more debt.
ROE= Return on equity
Hypothesis 2 (H0): There is no significant relationship between FL and ROE
Hypothesis 2 (H1): There is significant relationship between FL and ROE
The amount of net return returned as a percentage of shareholder’s equity.
Return on equity calculates a corporation's profitability by revealing how much profit a company generates with the money shareholders have invested.
http://www.abrj.org Page 40
American Based Research Journal ISSN Online (2304-7151) Vol 1-3
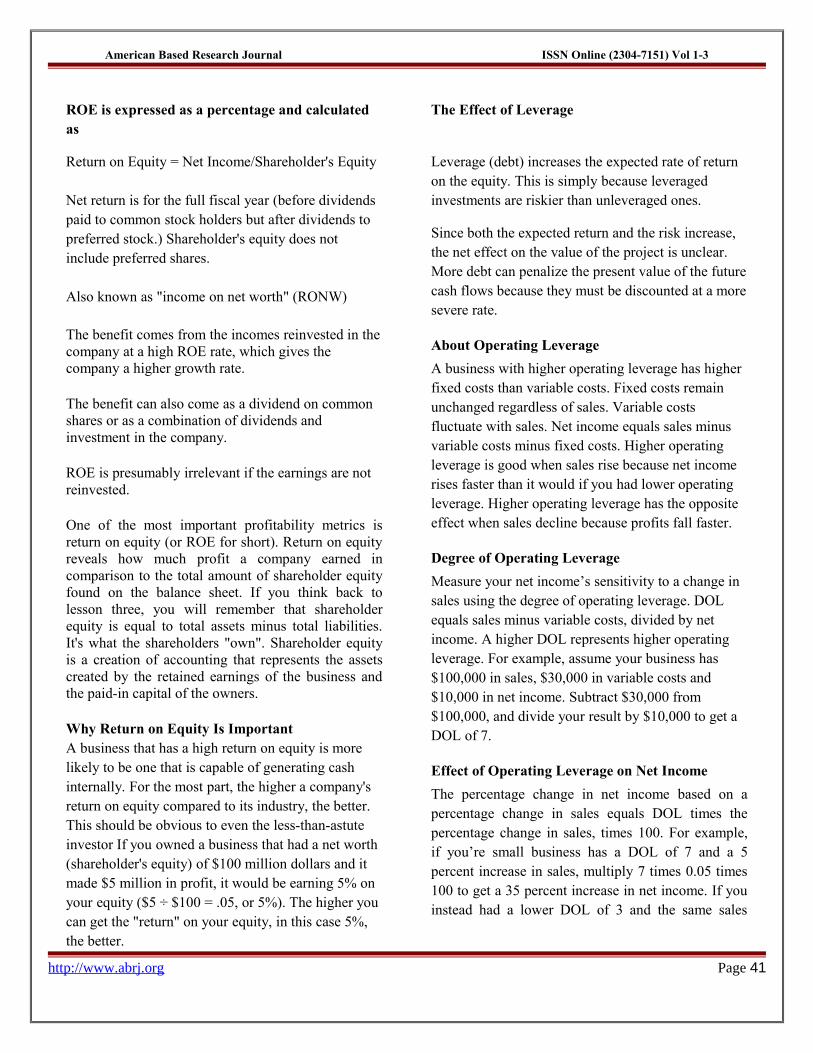
ROE is expressed as a percentage and calculated as
Return on Equity = Net Income/Shareholder's Equity
Net return is for the full fiscal year (before dividends paid to common stock holders but after dividends to preferred stock.) Shareholder's equity does not include preferred shares.
Also known as "income on net worth" (RONW)
The benefit comes from the incomes reinvested in the company at a high ROE rate, which gives the company a higher growth rate.
The benefit can also come as a dividend on common shares or as a combination of dividends and investment in the company.
ROE is presumably irrelevant if the earnings are not reinvested.
One of the most important profitability metrics is return on equity (or ROE for short). Return on equity reveals how much profit a company earned in comparison to the total amount of shareholder equity found on the balance sheet. If you think back to lesson three, you will remember that shareholder equity is equal to total assets minus total liabilities. It's what the shareholders "own". Shareholder equity is a creation of accounting that represents the assets created by the retained earnings of the business and the paid-in capital of the owners.
Why Return on Equity Is Important A business that has a high return on equity is more likely to be one that is capable of generating cash internally. For the most part, the higher a company's return on equity compared to its industry, the better. This should be obvious to even the less-than-astute investor If you owned a business that had a net worth (shareholder's equity) of $100 million dollars and it made $5 million in profit, it would be earning 5% on your equity ($5 ÷ $100 = .05, or 5%). The higher you can get the "return" on your equity, in this case 5%, the better.
The Effect of Leverage
Leverage (debt) increases the expected rate of return on the equity. This is simply because leveraged investments are riskier than unleveraged ones.
Since both the expected return and the risk increase, the net effect on the value of the project is unclear. More debt can penalize the present value of the future cash flows because they must be discounted at a more severe rate.
About Operating Leverage
A business with higher operating leverage has higher fixed costs than variable costs. Fixed costs remain unchanged regardless of sales. Variable costs fluctuate with sales. Net income equals sales minus variable costs minus fixed costs. Higher operating leverage is good when sales rise because net income rises faster than it would if you had lower operating leverage. Higher operating leverage has the opposite effect when sales decline because profits fall faster.
Degree of Operating Leverage
Measure your net income’s sensitivity to a change in sales using the degree of operating leverage. DOL equals sales minus variable costs, divided by net income. A higher DOL represents higher operating leverage. For example, assume your business has $100,000 in sales, $30,000 in variable costs and $10,000 in net income. Subtract $30,000 from $100,000, and divide your result by $10,000 to get a DOL of 7.
Effect of Operating Leverage on Net Income
The percentage change in net income based on a percentage change in sales equals DOL times the percentage change in sales, times 100. For example, if you’re small business has a DOL of 7 and a 5 percent increase in sales, multiply 7 times 0.05 times 100 to get a 35 percent increase in net income. If you instead had a lower DOL of 3 and the same sales
http://www.abrj.org Page 41
American Based Research Journal ISSN Online (2304-7151) Vol 1-3
increase, your net income would rise by just 15 percent, or 3 times 0.05 times 100.
Return on Equity
ROE equals net income divided by stockholders’ equity, times 100. Stockholders’ equity -- which is listed on the balance sheet -- is the value of stockholders’ stake in a business. For example, assume your small business has $10,000 in net income and $50,000 in stockholders’ equity. Divide $10,000 by $50,000, and multiply your result by 100
to get a 20 percent ROE. This means you generate net income equal to 20 percent of stockholders’ equity.
Effect of Operating Leverage on ROE
Because net return is the numerator of the ROE formula, operating leverage has a similar effect on ROE as it does on net return. A higher Degree of operating leverage boosts ROE when sales rise, but it also accelerates the lows in ROE when sales decline. You can boost your DOL by raising your fixed costs relative to variable costs, but be aware of the negative effects on ROE when sales decrease.
……………………………………………………………………………………………………………………………………………
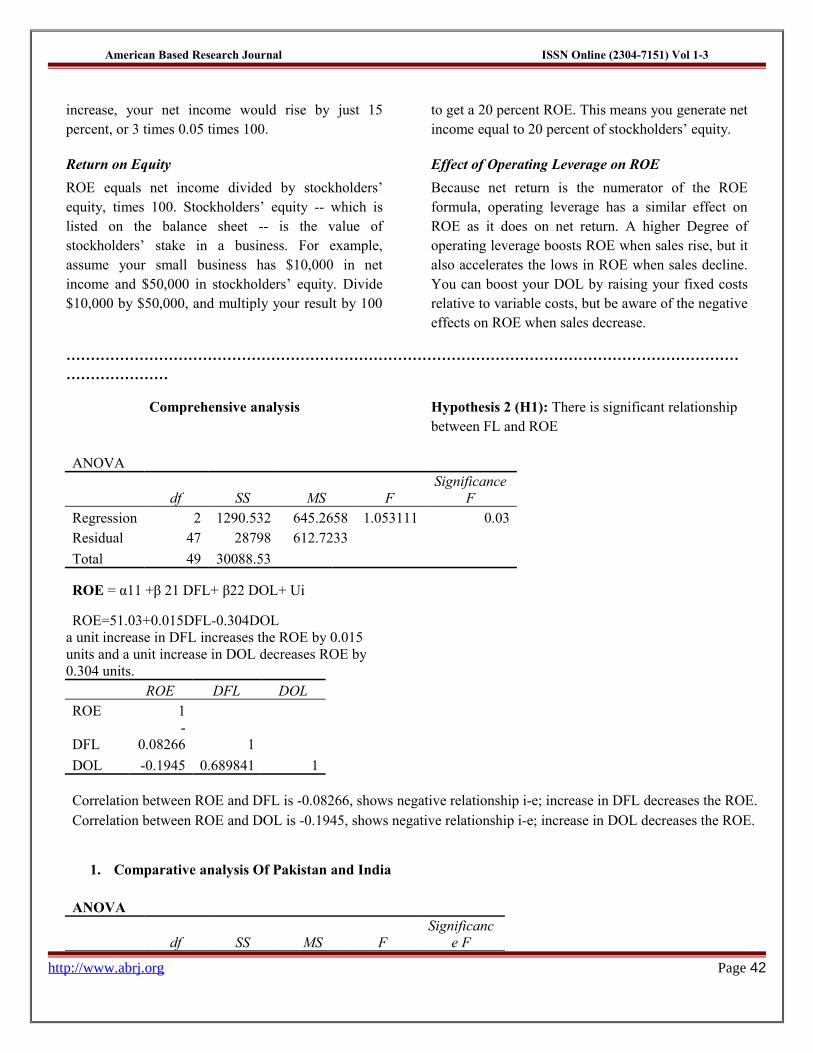
Comprehensive analysis Hypothesis 2 (H1): There is significant relationship between FL and ROE
ANOVA
df SS MS FSignificance
FRegression 2 1290.532 645.2658 1.053111 0.03Residual 47 28798 612.7233
Total 49 30088.53
ROE = α11 +β 21 DFL+ β22 DOL+ Ui
ROE=51.03+0.015DFL-0.304DOLa unit increase in DFL increases the ROE by 0.015 units and a unit increase in DOL decreases ROE by 0.304 units.
ROE DFL DOLROE 1
DFL-
0.08266 1
DOL -0.1945 0.689841 1
Correlation between ROE and DFL is -0.08266, shows negative relationship i-e; increase in DFL decreases the ROE.Correlation between ROE and DOL is -0.1945, shows negative relationship i-e; increase in DOL decreases the ROE.
1. Comparative analysis Of Pakistan and India
ANOVA
df SS MS FSignificanc
e F
http://www.abrj.org Page 42
American Based Research Journal ISSN Online (2304-7151) Vol 1-3
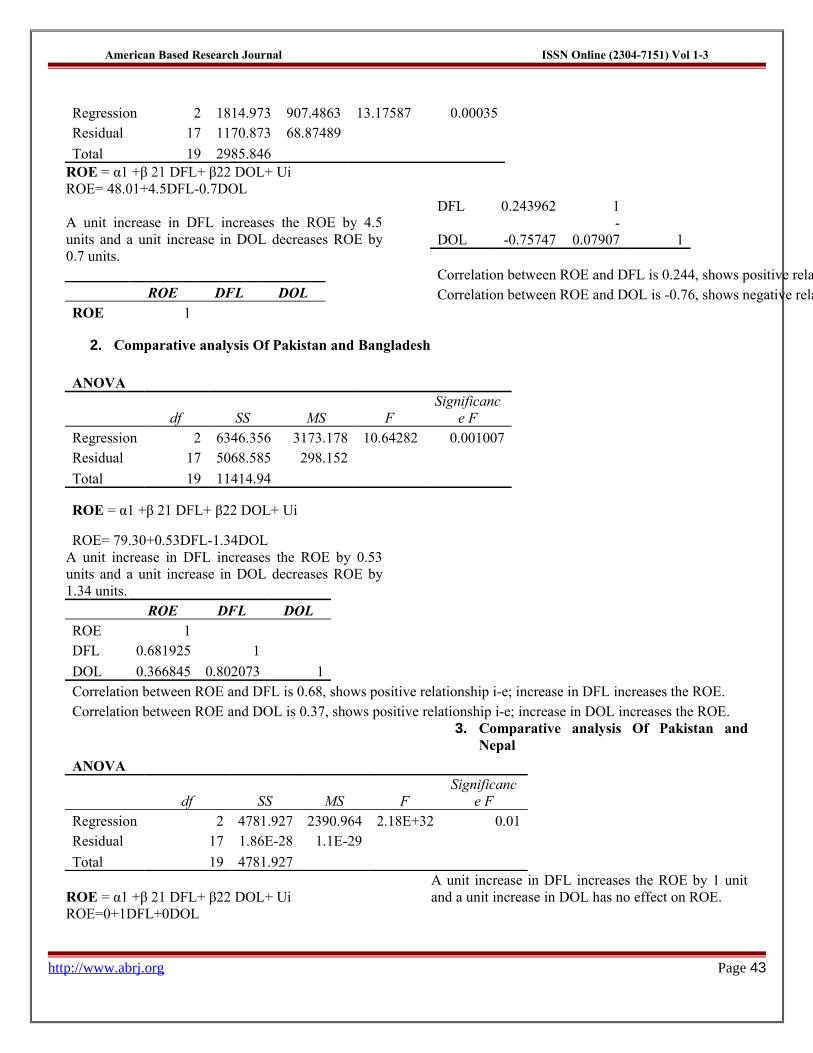
Regression 2 1814.973 907.4863 13.17587 0.00035Residual 17 1170.873 68.87489
Total 19 2985.846 ROE = α1 +β 21 DFL+ β22 DOL+ UiROE= 48.01+4.5DFL-0.7DOL
A unit increase in DFL increases the ROE by 4.5 units and a unit increase in DOL decreases ROE by 0.7 units.
ROE DFL DOLROE 1
DFL 0.243962 1
DOL -0.75747-
0.07907 1
Correlation between ROE and DFL is 0.244, shows positive relationship i-e; increase in DFL increases the ROE.Correlation between ROE and DOL is -0.76, shows negative relationship i-e; increase in DOL decreases the ROE.
2. Comparative analysis Of Pakistan and Bangladesh
ANOVA
df SS MS FSignificanc
e FRegression 2 6346.356 3173.178 10.64282 0.001007Residual 17 5068.585 298.152
Total 19 11414.94
ROE = α1 +β 21 DFL+ β22 DOL+ Ui
ROE= 79.30+0.53DFL-1.34DOLA unit increase in DFL increases the ROE by 0.53 units and a unit increase in DOL decreases ROE by 1.34 units.
ROE DFL DOLROE 1DFL 0.681925 1
DOL 0.366845 0.802073 1Correlation between ROE and DFL is 0.68, shows positive relationship i-e; increase in DFL increases the ROE.Correlation between ROE and DOL is 0.37, shows positive relationship i-e; increase in DOL increases the ROE.
3. Comparative analysis Of Pakistan and Nepal
ANOVA
df SS MS FSignificanc
e FRegression 2 4781.927 2390.964 2.18E+32 0.01Residual 17 1.86E-28 1.1E-29
Total 19 4781.927
ROE = α1 +β 21 DFL+ β22 DOL+ UiROE=0+1DFL+0DOL
A unit increase in DFL increases the ROE by 1 unit and a unit increase in DOL has no effect on ROE.
http://www.abrj.org Page 43
American Based Research Journal ISSN Online (2304-7151) Vol 1-3
ROE DFL DOLROE 1DFL 1 1
DOL0.00158983
4 0.00159 1
Correlation between ROE and DFL is 1, shows positive relationship i-e; increase in DFL increases the ROE.Correlation between ROE and DOL is0.001 shows positive relationship i-e; increase in DOL increases the ROE.
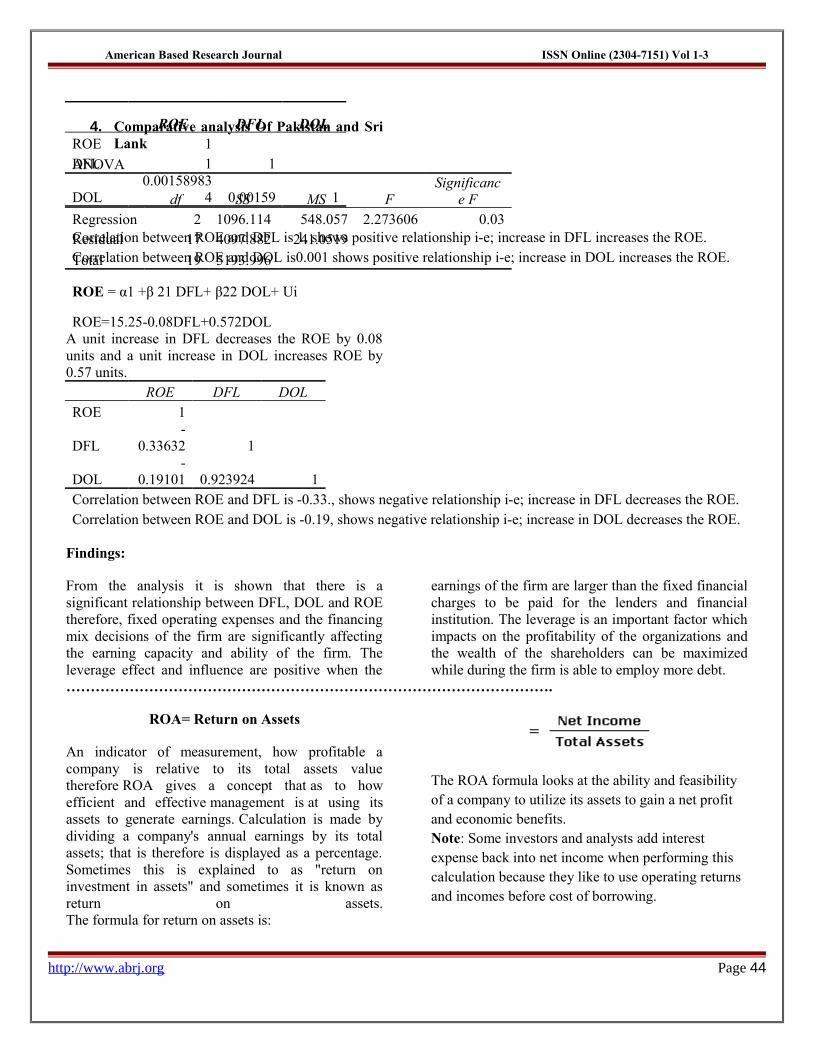
4. Comparative analysis Of Pakistan and Sri Lank
ANOVA
df SS MS FSignificanc
e FRegression 2 1096.114 548.057 2.273606 0.03Residual 17 4097.882 241.0519
Total 19 5193.996
ROE = α1 +β 21 DFL+ β22 DOL+ Ui
ROE=15.25-0.08DFL+0.572DOLA unit increase in DFL decreases the ROE by 0.08 units and a unit increase in DOL increases ROE by 0.57 units.
ROE DFL DOLROE 1
DFL-
0.33632 1
DOL-
0.19101 0.923924 1Correlation between ROE and DFL is -0.33., shows negative relationship i-e; increase in DFL decreases the ROE.Correlation between ROE and DOL is -0.19, shows negative relationship i-e; increase in DOL decreases the ROE.
Findings:
From the analysis it is shown that there is a significant relationship between DFL, DOL and ROE therefore, fixed operating expenses and the financing mix decisions of the firm are significantly affecting the earning capacity and ability of the firm. The leverage effect and influence are positive when the
earnings of the firm are larger than the fixed financial charges to be paid for the lenders and financial institution. The leverage is an important factor which impacts on the profitability of the organizations and the wealth of the shareholders can be maximized while during the firm is able to employ more debt.
……………………………………………………………………………………….
ROA= Return on Assets
An indicator of measurement, how profitable a company is relative to its total assets value therefore ROA gives a concept that as to how efficient and effective management is at using its assets to generate earnings. Calculation is made by dividing a company's annual earnings by its total assets; that is therefore is displayed as a percentage. Sometimes this is explained to as "return on investment in assets" and sometimes it is known as return on assets.The formula for return on assets is:
The ROA formula looks at the ability and feasibility of a company to utilize its assets to gain a net profit and economic benefits.Note: Some investors and analysts add interest expense back into net income when performing this calculation because they like to use operating returns and incomes before cost of borrowing.
http://www.abrj.org Page 44
American Based Research Journal ISSN Online (2304-7151) Vol 1-3
ROA tells us that what earnings are generated from invested capital (assets). ROA for public listed companies can differ substantially and will be largely dependent on the industry. This is because of that when using ROA as a comparative measure, it is best known to compare it against a company's previous ROA standards or the ROA of a similar company.
The assets of the company are composed of both debt and equity therefore both of these types of financing are used to fund the operations and assets of the company. The ROA figures explain investors an idea of how effectively the company is converting the money it has to invest into net income.
The higher the ROA number, the better will be, because the company is earning more money on less risky investment. For example, we can say that if one company has a net return of $1M and total assets of $5M, its ROA is 20%; however, if another company gains the same amount but has total assets of $10M, it will have an ROA of 10%.
Based on this analysis, the first company is better at converting because of its investment into profit. When we think about it, management's most important job is to make better choices in allocating its resources and funds. Anybody can make a profit and return by throwing a ton of money at a problem, but few managers gain at making large profits with little investment.
ROA is an indication, how profitable a company is before leverage, and is compared with companies in
the same industry with same specification of company. Since the figures for total assets of the company depends on the carrying value of the assets, some action is required for companies whose carrying value may not correspondence to the actual MV. Return on assets is a common figure used for analyzing performance of financial institutions and organizations. (Such as banks). Because the most of their assets will have a carrying value that is near to their actual MV. ROA is not useful for analysis between industries because of factors of scale and peculiar capital demands.
Net income in the numerator of the return on assets formula can be found on a organization's statement of financial income. Net profit is the amount earned by a company after subtracting out the expenses incurred, including depreciation and taxes. Average total assets in the denominator of the return on assets calculation formula is found on a company's statement of financial position. The average of total assets should be made based on the periods being evaluated.
Use of ROA Formula
The ROA formula can be utilized by an investor/Analyst or by a company internally and externally to evaluate if the company is turning a profit relative to their assets. It is important for an investor to consider that a company's return on assets can differ depending on which industry the companies do business in. A specific company may provide a product range that requires additional assets to manufacture the products relative to another industry.
http://www.abrj.org Page 45
American Based Research Journal ISSN Online (2304-7151) Vol 1-3
Analysis
ROA indicates about the number of cents gained on each dollar of assets. Thus higher values of return on assets show that business is making more profitable and returns. This ratio should be only used to compare companies in the same sector of companies. The reason for this is that companies in some sectors are most asset-motivated i.e. they need an expensive plant and equipment to generate income and returns compared with others. Their ROA will naturally become lower and lower than the ROA of companies which are low capital asset-insensitive. An increasing trend of ROA indicates that the profitability of the company is making improvement. Conversely, a decreasing trend means that profitability is declining and haphazard condition.
Return on Assets as a Measure of Asset Intensity (or How "Good" a Business Is).
The lower the profit per dollar of assets, the more asset-intensive a business is which means the higher the profit per dollar of assets, the less asset-intensive a business is.
All things being equal, the more capital asset-intensive a business, the more capital fund/money must be reinvested into it to continue generating more earnings. This is a bad indicator if a company has a ROA of 20%, it means that the company is earning $0.20 for each $1 in assets. As a general rule, anything below 5% is very asset-largely (manufacturing, railroads), anything above 20% is asset-light.
The first choice requires that we calculate net return margin and asset turnover.
Return on Assets (ROA) Ratio and Financial Leverage Gain
When a business realized a financial leverage gain for the year, it means that it is earning more profit on the money it has borrowed than the interest paid for the use that borrowed money. A good part of a business’s net return for the year could be due to financial leverage.
http://www.abrj.org Page 46
American Based Research Journal ISSN Online (2304-7151) Vol 1-3
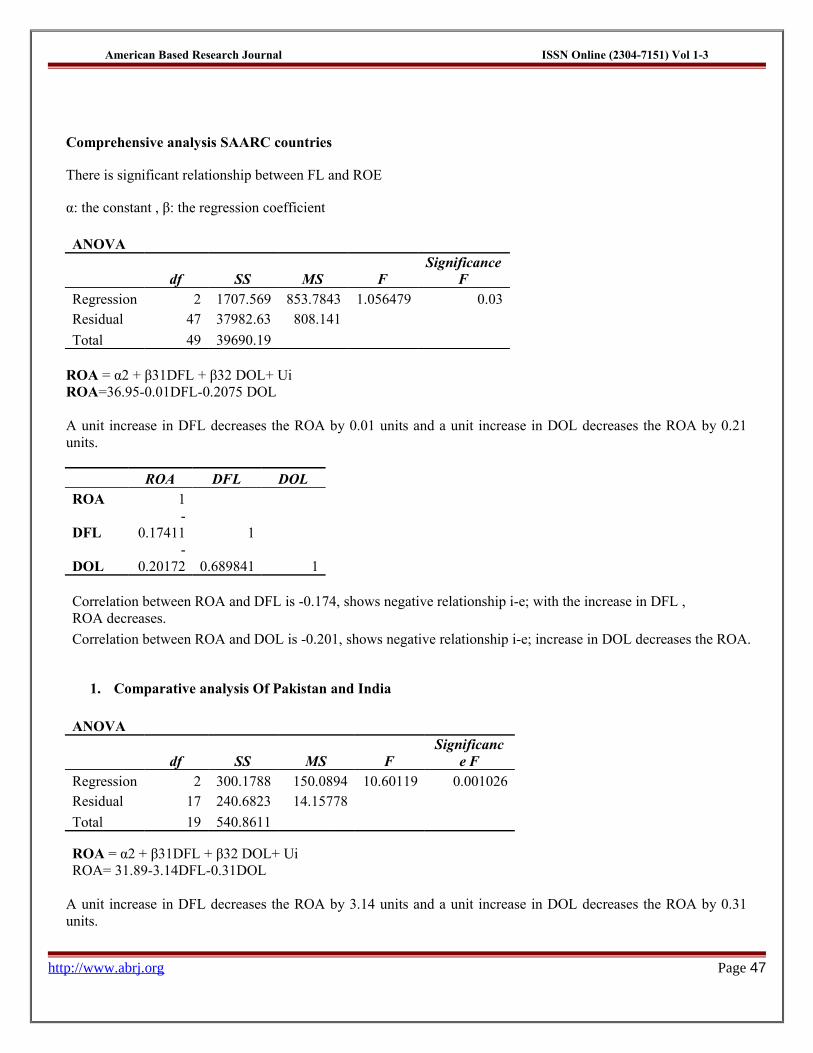
Comprehensive analysis SAARC countries
There is significant relationship between FL and ROE
α: the constant , β: the regression coefficient
ANOVA
df SS MS FSignificance
FRegression 2 1707.569 853.7843 1.056479 0.03Residual 47 37982.63 808.141
Total 49 39690.19
ROA = α2 + β31DFL + β32 DOL+ UiROA=36.95-0.01DFL-0.2075 DOL
A unit increase in DFL decreases the ROA by 0.01 units and a unit increase in DOL decreases the ROA by 0.21 units.
ROA DFL DOLROA 1
DFL-
0.17411 1
DOL-
0.20172 0.689841 1
Correlation between ROA and DFL is -0.174, shows negative relationship i-e; with the increase in DFL , ROA decreases.
Correlation between ROA and DOL is -0.201, shows negative relationship i-e; increase in DOL decreases the ROA.
1. Comparative analysis Of Pakistan and India
ANOVA
df SS MS FSignificanc
e FRegression 2 300.1788 150.0894 10.60119 0.001026Residual 17 240.6823 14.15778
Total 19 540.8611
ROA = α2 + β31DFL + β32 DOL+ UiROA= 31.89-3.14DFL-0.31DOL
A unit increase in DFL decreases the ROA by 3.14 units and a unit increase in DOL decreases the ROA by 0.31 units.
http://www.abrj.org Page 47
American Based Research Journal ISSN Online (2304-7151) Vol 1-3
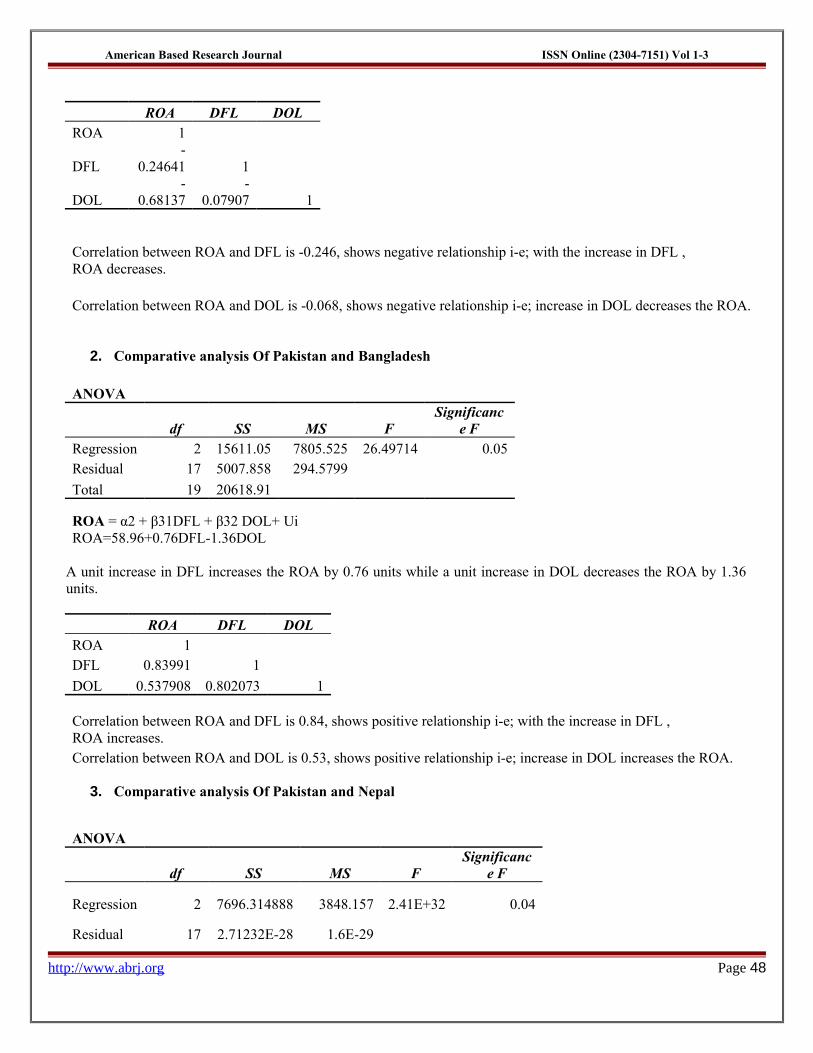
ROA DFL DOLROA 1
DFL-
0.24641 1
DOL-
0.68137-
0.07907 1
Correlation between ROA and DFL is -0.246, shows negative relationship i-e; with the increase in DFL ,ROA decreases.
Correlation between ROA and DOL is -0.068, shows negative relationship i-e; increase in DOL decreases the ROA.
2. Comparative analysis Of Pakistan and Bangladesh
ANOVA
df SS MS FSignificanc
e FRegression 2 15611.05 7805.525 26.49714 0.05Residual 17 5007.858 294.5799
Total 19 20618.91
ROA = α2 + β31DFL + β32 DOL+ UiROA=58.96+0.76DFL-1.36DOL
A unit increase in DFL increases the ROA by 0.76 units while a unit increase in DOL decreases the ROA by 1.36 units.
ROA DFL DOLROA 1DFL 0.83991 1
DOL 0.537908 0.802073 1
Correlation between ROA and DFL is 0.84, shows positive relationship i-e; with the increase in DFL , ROA increases. Correlation between ROA and DOL is 0.53, shows positive relationship i-e; increase in DOL increases the ROA.
3. Comparative analysis Of Pakistan and Nepal
ANOVA
df SS MS FSignificanc
e F
Regression 2 7696.314888 3848.157 2.41E+32 0.04
Residual 17 2.71232E-28 1.6E-29
http://www.abrj.org Page 48
American Based Research Journal ISSN Online (2304-7151) Vol 1-3
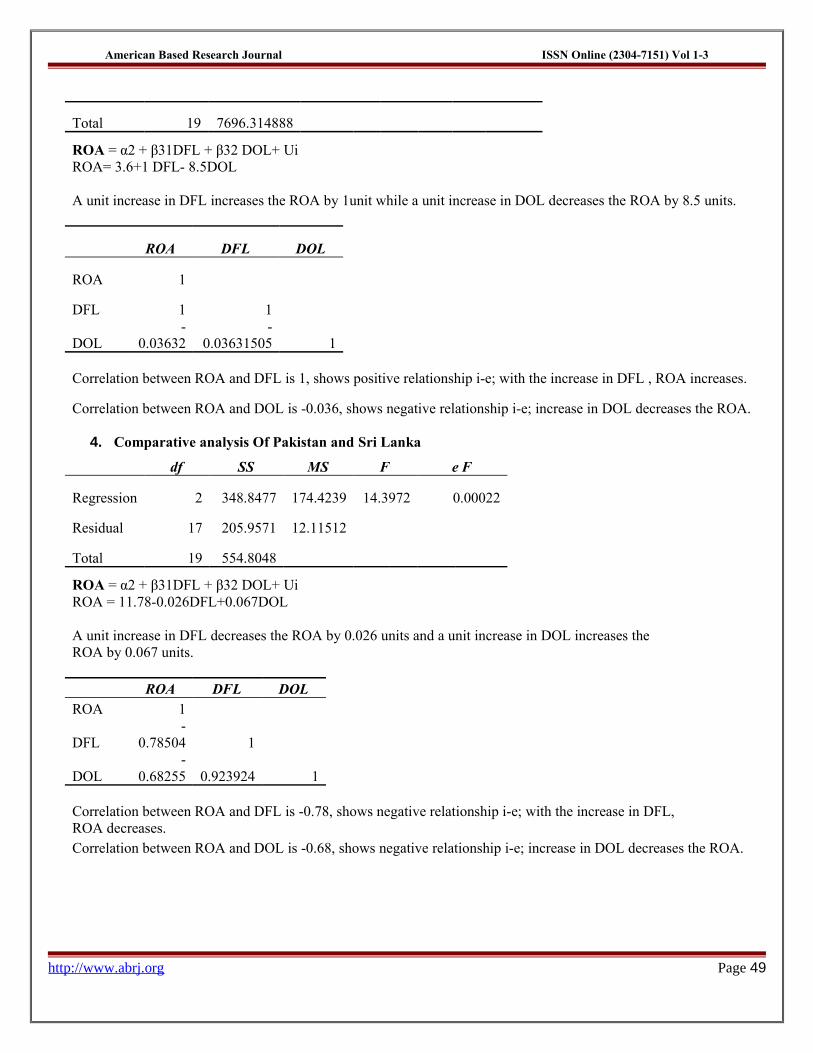
Total 19 7696.314888
ROA = α2 + β31DFL + β32 DOL+ UiROA= 3.6+1 DFL- 8.5DOL
A unit increase in DFL increases the ROA by 1unit while a unit increase in DOL decreases the ROA by 8.5 units.
ROA DFL DOL
ROA 1
DFL 1 1
DOL-
0.03632-
0.03631505 1
Correlation between ROA and DFL is 1, shows positive relationship i-e; with the increase in DFL , ROA increases.
Correlation between ROA and DOL is -0.036, shows negative relationship i-e; increase in DOL decreases the ROA.
4. Comparative analysis Of Pakistan and Sri Lanka
df SS MS F e F
Regression 2 348.8477 174.4239 14.3972 0.00022
Residual 17 205.9571 12.11512
Total 19 554.8048
ROA = α2 + β31DFL + β32 DOL+ UiROA = 11.78-0.026DFL+0.067DOL
A unit increase in DFL decreases the ROA by 0.026 units and a unit increase in DOL increases theROA by 0.067 units.
ROA DFL DOLROA 1
DFL-
0.78504 1
DOL-
0.68255 0.923924 1
Correlation between ROA and DFL is -0.78, shows negative relationship i-e; with the increase in DFL, ROA decreases. Correlation between ROA and DOL is -0.68, shows negative relationship i-e; increase in DOL decreases the ROA.
http://www.abrj.org Page 49
American Based Research Journal ISSN Online (2304-7151) Vol 1-3
……………………………………………………………………………………………………………………………………………
Findings:
From the analysis it is shown that there is a significant relationship between DFL, DOL and ROA therefore, fixed operating expenses and the financing mix decisions of the firm are significantly affecting the earning capacity and ability of the firm. The
leverage effect and influence are positive when the earnings of the firm are larger than the fixed financial charges to be paid for the lenders and financial institution. The leverage is an important factor which impacts on the profitability of the organizations and the wealth of the shareholders can be maximized while during the firm is able to employ more debt.
Data Collection
Financial statements are the raw data collected from various websites like www.capitaline.com and other company websites
Time Period of the Study
The study has been conducted during July 2001 to Dec 2010 for 10 years data.
Limitations: There is limited data available for 10 years in SAARC countries.
ConclusionsFrom the analysis it is shown that there is a significant relationship between DFL, DOL, ROI, ROE, and ROA therefore, fixed operating expenses and the financing mix decisions of the firm are significantly affecting the earning capacity and ability of the firm. The leverage effect and influence are positive when the earnings of the firm are larger than the fixed financial charges to be paid for the lenders and financial institution. The leverage is an important factor which impacts on the profitability of the organizations and the wealth of the shareholders can be maximized while during the firm is able to employ more debt.
References
Text Books
1] C.R.Kothari,(1995),“ResearchMethodology” , New Delhi, Wishswa Prakashan.2] Dr. S P Gupta, (33 rd Revised Edition 2004), “Statistical Methods”, New Delhi,Sultan&Sons.3] I.M Pandey, Financial Management, Vikas Publishing House Pvt ltd.,(2009)4] Khan&Jain, Financial Management,Tata McGraw-Hill(2007)Journals[1] European Journal of Economics, Finance and Administrative Sciences ISSN 1450- 2275 Issue 32 (2011)[2] The Universal Effects of Compounding and Leveraged Funds Volume 1 • spring 2009[3] Understanding Investment Leverage, AB0409E (03/2005) Manulife Bank
[4] The impact of leverage on firm investment: Canadian evidence, Journal of Corporate Finance 11 (2005) 277– 291[5] The Leverage Cycle, By Jean Geanakoplos Cowles Foundation Paper No.1304[6] Leverage and growth: effect of stock options Bank of Finland Research Discussion Papers 19 2011 ISBN 978-952-462-776-4 ISSN 1456-6184 (online)[7] Liquidity and Leverage Tobias Adrian Federal Reserve Bank of New York, First Version: June 2007 This Version: May 2008[8] Leases, Debt and Value. By: Aswath Damodaran Stern School of Business 44 West Fourth Street New York, NY 10012 April 2009[9] African Journal of Business Management Vol. 5(4), pp. 1312-1324, 18 February, 2011 Available online at http://www.academicjournals.org/AJBM ISSN 1993-8233 ©2011 Academic Journals[10] Financial Leverage, October 2008, MSCI Barra.[11] International Research Journal of Finance and Economics ISSN 1450-2887 Issue 19 (2008) Euro Journals Publishing, Inc. 2008
http://www.abrj.org Page 50

American Based Research Journal ISSN Online (2304-7151) Vol 1-3
[12] Journal of Applied Finance & Banking, vol.1, no.2, 2011, 19-37ISSN: 1792-6580 (print version), 1792-6599 (online)[13] M.P. Odit and Y.D. Gobardhun, The determinants of financial leverage of SME's in Mauritius, The International Business & Economics Research Journal, 10(3), (2011), 113-125.[14] S.C. Myers and N.S. Majluf, Corporate financing and investment decisions when firms have information those investors do not have, Journal of Financial Economics, 13, (1984), 187-221.[15]A Research Paper on Portfolio Leverage ratios by David Asermely in December 2010[16] An Analysis of the Effects of Operating and Financial Leverage on the Major U.S. Air Carriers’ Rates of Return: 1990-2003.[17] The Effect of Leverage on Firm Value and how the firm financial quality influence on this effect By Ming-Chang Cheng* and Zuwei-Ching Tzeng
[18] Does the Trade-off Theory Explain Debt Structure and Valuation for Divesting Parents in a Prosperous Australian Economy? By Cecil W. Lui, This article is derived from a chapter of my doctoral dissertation entitled “Divestiture Announcements in Australia: Causes and Consequences”.[19] Review of Accounting Studies, 8, 531–560, 2003 Kluwer Academic Publishers. Manufactured in The Netherlands[20] African Journal of Business Management Vol. 5(4), pp. 1312-1324, 18 February, 2011Available online at http://www.academicjournals.org/AJBM[21] Lintner, J. (1962), ‘Dividends, Earnings, Leverage, Stock Prices, and the Supply of Capital to Corporations’. Rev. Econ. Stat., 44(3):243- 269.[22] The impact of leverage on firm investment: Canadian evidence Journal of Corporate Finance 11 (2005) 277– 291
[23]Financial leverage and firm value Kuben ryan 27526977 in Gordon Institute of Business Science. 13 November, 2008
[24] Tang, C.-H. H., & Jang, S. S. (2007). Revisit to the determinants of capital structure: A comparison between lodging firms and software firms. Hospitality Management, 26, 175-187.
[25] Lewellen, K., 2006. Financing decisions when managers are risk averse. The Journal of Financial Economics 82 (3), 551-589.
[26] Figlewski, S., and X. Wang, 2000, “Is the “Leverage Effect” a Leverage Effect?” Working Paper New York University.
[27] Gritta, R., G. Chow and N. Freed “Measuring the Degrees of Operating, Financial, andCombined Leverage Facing the U.S. Air Carriers: 1979-1995,” Transportation LawJournal 26 (1), (Fall 1998), 51-71.[28] Jones, Charles. Investments: Analysis and Management. 9 ed. John Wiley & Sons, NewYork, N.Y. (2004), Ch. 6.[29] Brigham, Eugene and L. Gapenki. Intermediate Financial Management. Dryden Press,Orlando, FLA. (2004), Ch. 12.[30] Helfert, Erich A. (2001). “Financial Analysis: Tools and Techniques a Guide for Managers”. McGraw-Hill, United States of America.[31] Maher, Maria, and Thomas Andersson. Corporate Governance: Effect on Firm Performance and Economic Growth. Organization for Economic Co-Operation and Development. Organization for Economic Co-Operation and Development, 1999, page1-51.[32] KEPE (Center of Economic Planning and Research) (1989) Small and medium sizedenterprises (SMEs). Reports for the Program 1988–1992 (in Greek).[33] Michaelas, N., Chittenden, F. & Poutsiouris, P. (1999) Financial policy and capital structurechoice in U.K. SMEs: empirical evidence from company panel data, Small BusinessEconomics, 12, pp. 113–130.[34] Courtis, K. J. (1978) Modeling a financial ratio categoric framework, Journal of Finance andAccounting, (Summer), pp. 219–223.[35] Tamari, M. (1980) The financial structure of the small firm—an international comparison ofcorporate accounts in the U.S.A., France, U. K., Israel and Japan, American Journal of SmallBusiness, 4, pp. 20–34.[36] Gupta, M. C. (1969) The effects of size, growth and industry on the financial structure ofmanufacturing companies, Journal of Finance, 24, pp. 517–529
http://www.abrj.org Page 51
American Based Research Journal ISSN Online (2304-7151) Vol 1-3
[37] Levratto, N. (1997) Small firms finance in France, Small Business Economics, 8, pp. 279–295.[38] Rivaud-Danset, R., Dubocage, E. & Salais, R. (1998) Comparison between the financialstructure of SME versus large enterprise using the BACH data base, Université Paris–Nord,Faculté de Sciences Economiques, June
[39] Mira, S. F. (2002) On capital structure in the small and medium enterprises: the Spanish case,Instituto de Estudios Europeos, Universidad San Pablo–CEU, No. 2, March[40] Jaggi, B. & Gul, F. (1999) An analysis of joint effects of investment opportunity set, free cash flows and size on corporate debt policy, Review of Quantitative Finance and Accounting, 12,pp. 371–381
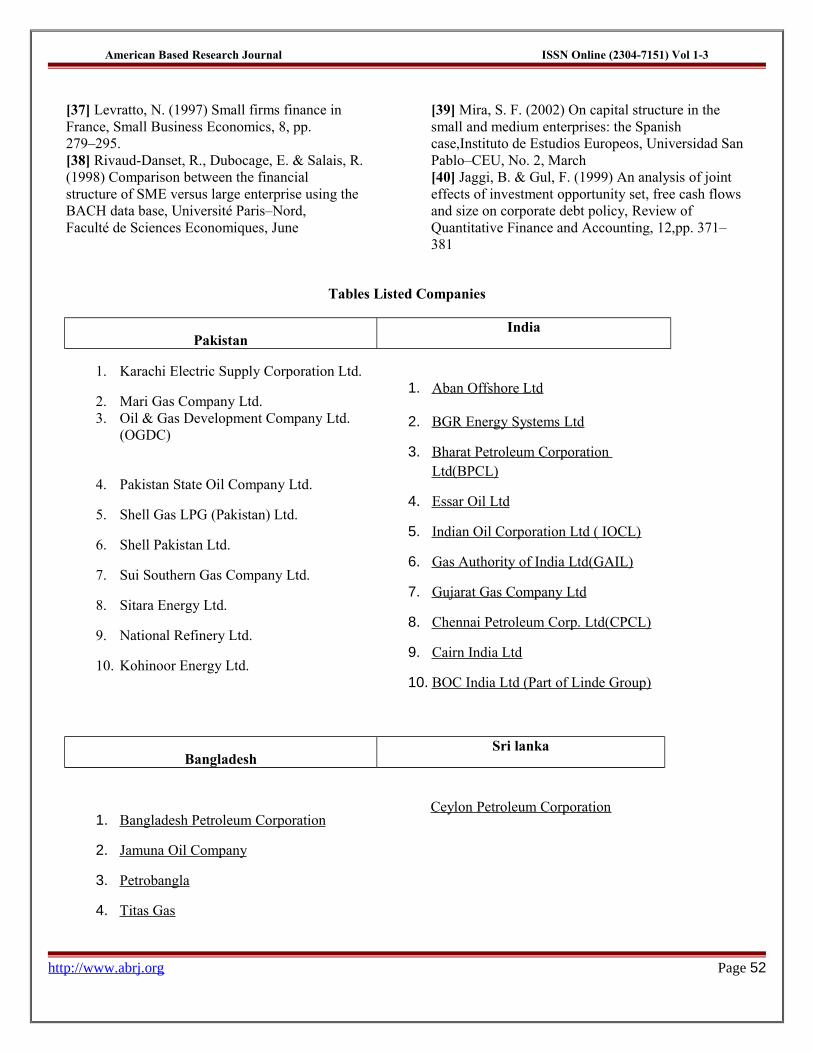
Tables Listed Companies
PakistanIndia
1. Karachi Electric Supply Corporation Ltd.
2. Mari Gas Company Ltd.1. Aban Offshore Ltd
3. Oil & Gas Development Company Ltd. (OGDC)
2. BGR Energy Systems Ltd
4. Pakistan State Oil Company Ltd.
3. Bharat Petroleum Corporation Ltd(BPCL)
5. Shell Gas LPG (Pakistan) Ltd.4. Essar Oil Ltd
6. Shell Pakistan Ltd.5. Indian Oil Corporation Ltd ( IOCL)
7. Sui Southern Gas Company Ltd.6. Gas Authority of India Ltd(GAIL)
8. Sitara Energy Ltd.7. Gujarat Gas Company Ltd
9. National Refinery Ltd.8. Chennai Petroleum Corp. Ltd(CPCL)
10. Kohinoor Energy Ltd.9. Cairn India Ltd
10. BOC India Ltd (Part of Linde Group)
BangladeshSri lanka
1. Bangladesh Petroleum Corporation Ceylon Petroleum Corporation
2. Jamuna Oil Company
3. Petrobangla
4. Titas Gas
http://www.abrj.org Page 52
American Based Research Journal ISSN Online (2304-7151) Vol 1-3
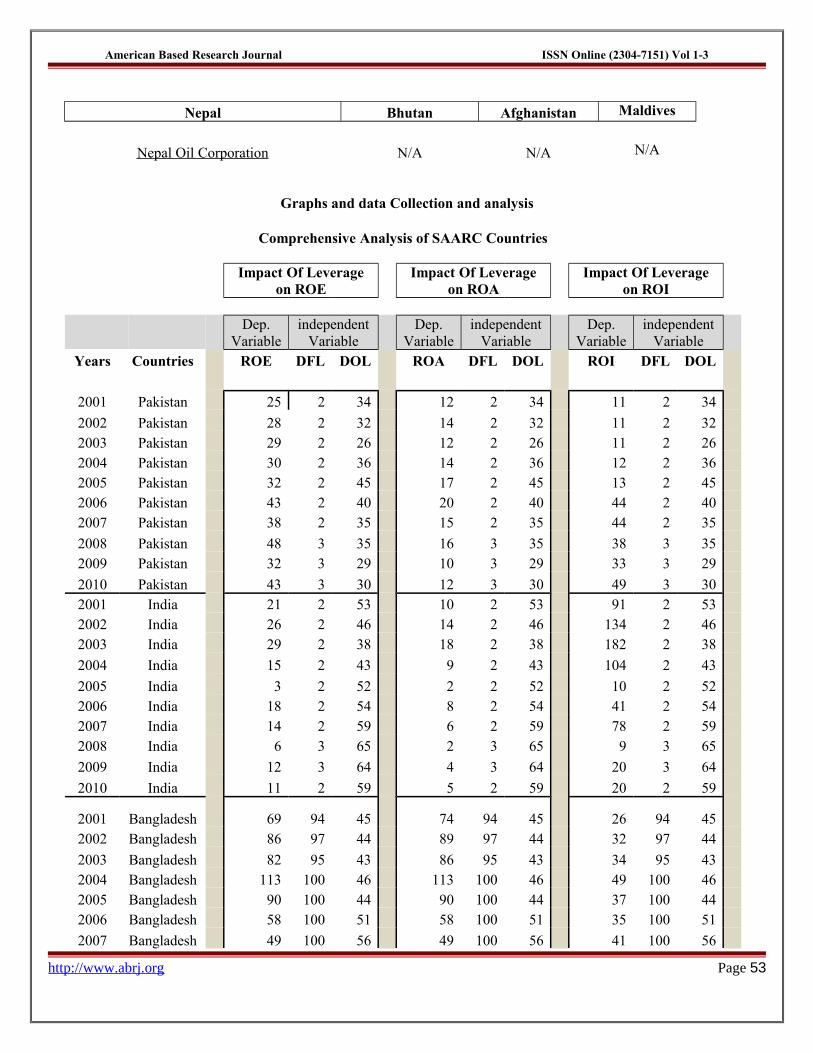
Nepal Bhutan Afghanistan Maldives
Nepal Oil Corporation N/A N/A N/A
Graphs and data Collection and analysis
Comprehensive Analysis of SAARC Countries
Impact Of Leverage
on ROEImpact Of Leverage
on ROAImpact Of Leverage
on ROI
Dep.
Variableindependent
Variable Dep.
Variableindependent
Variable Dep.
Variableindependent
Variable Years Countries ROE DFL DOL ROA DFL DOL ROI DFL DOL
2001 Pakistan 25 2 34 12 2 34 11 2 34
2002 Pakistan 28 2 32 14 2 32 11 2 32 2003 Pakistan 29 2 26 12 2 26 11 2 26 2004 Pakistan 30 2 36 14 2 36 12 2 36 2005 Pakistan 32 2 45 17 2 45 13 2 45 2006 Pakistan 43 2 40 20 2 40 44 2 40 2007 Pakistan 38 2 35 15 2 35 44 2 35
2008 Pakistan 48 3 35 16 3 35 38 3 35 2009 Pakistan 32 3 29 10 3 29 33 3 29
2010 Pakistan 43 3 30 12 3 30 49 3 30 2001 India 21 2 53 10 2 53 91 2 53 2002 India 26 2 46 14 2 46 134 2 46 2003 India 29 2 38 18 2 38 182 2 38
2004 India 15 2 43 9 2 43 104 2 43
2005 India 3 2 52 2 2 52 10 2 52 2006 India 18 2 54 8 2 54 41 2 54 2007 India 14 2 59 6 2 59 78 2 59 2008 India 6 3 65 2 3 65 9 3 65
2009 India 12 3 64 4 3 64 20 3 64
2010 India 11 2 59 5 2 59 20 2 59
2001 Bangladesh 69 94 45 74 94 45 26 94 45 2002 Bangladesh 86 97 44 89 97 44 32 97 44
2003 Bangladesh 82 95 43 86 95 43 34 95 43 2004 Bangladesh 113 100 46 113 100 46 49 100 46 2005 Bangladesh 90 100 44 90 100 44 37 100 44 2006 Bangladesh 58 100 51 58 100 51 35 100 51
2007 Bangladesh 49 100 56 49 100 56 41 100 56
http://www.abrj.org Page 53
American Based Research Journal ISSN Online (2304-7151) Vol 1-3
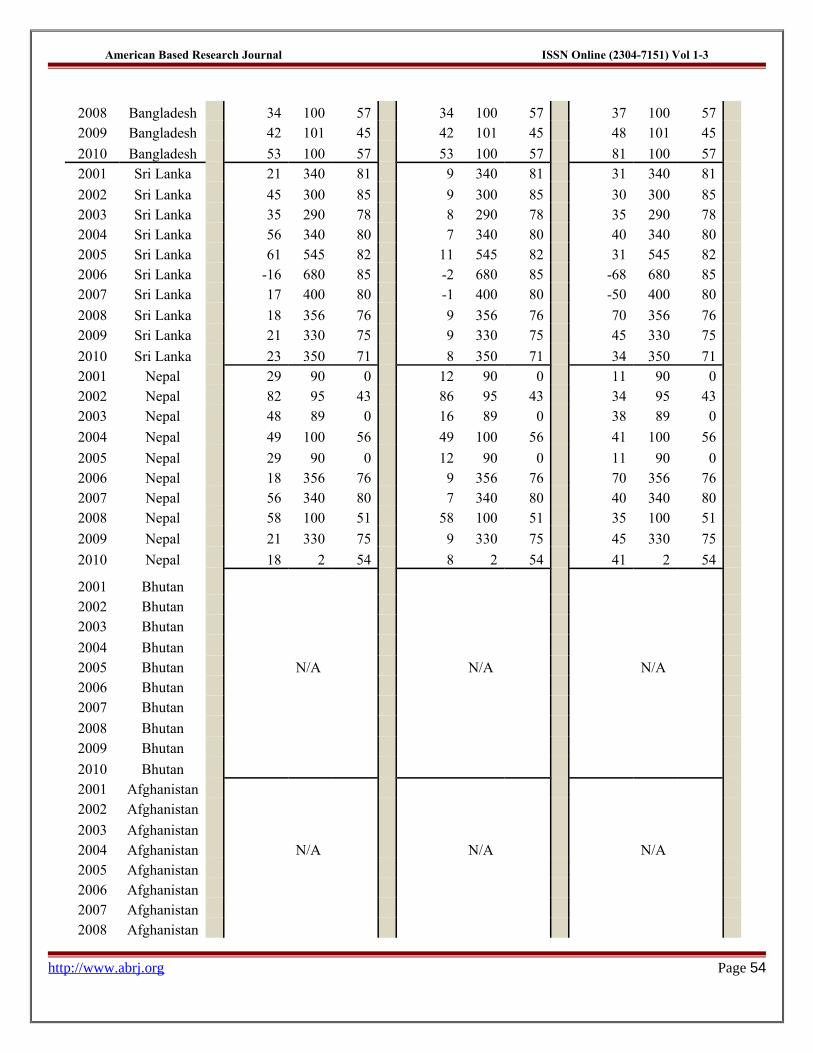
2008 Bangladesh 34 100 57 34 100 57 37 100 57 2009 Bangladesh 42 101 45 42 101 45 48 101 45
2010 Bangladesh 53 100 57 53 100 57 81 100 57 2001 Sri Lanka 21 340 81 9 340 81 31 340 81
2002 Sri Lanka 45 300 85 9 300 85 30 300 85 2003 Sri Lanka 35 290 78 8 290 78 35 290 78 2004 Sri Lanka 56 340 80 7 340 80 40 340 80 2005 Sri Lanka 61 545 82 11 545 82 31 545 82 2006 Sri Lanka -16 680 85 -2 680 85 -68 680 85 2007 Sri Lanka 17 400 80 -1 400 80 -50 400 80
2008 Sri Lanka 18 356 76 9 356 76 70 356 76 2009 Sri Lanka 21 330 75 9 330 75 45 330 75
2010 Sri Lanka 23 350 71 8 350 71 34 350 71 2001 Nepal 29 90 0 12 90 0 11 90 0 2002 Nepal 82 95 43 86 95 43 34 95 43 2003 Nepal 48 89 0 16 89 0 38 89 0
2004 Nepal 49 100 56 49 100 56 41 100 56
2005 Nepal 29 90 0 12 90 0 11 90 0 2006 Nepal 18 356 76 9 356 76 70 356 76 2007 Nepal 56 340 80 7 340 80 40 340 80 2008 Nepal 58 100 51 58 100 51 35 100 51
2009 Nepal 21 330 75 9 330 75 45 330 75
2010 Nepal 18 2 54 8 2 54 41 2 54
2001 Bhutan 2002 Bhutan 2003 Bhutan
2004 Bhutan 2005 Bhutan N/A N/A N/A 2006 Bhutan 2007 Bhutan
2008 Bhutan 2009 Bhutan
2010 Bhutan 2001 Afghanistan 2002 Afghanistan
2003 Afghanistan 2004 Afghanistan N/A N/A N/A 2005 Afghanistan 2006 Afghanistan 2007 Afghanistan 2008 Afghanistan
http://www.abrj.org Page 54
American Based Research Journal ISSN Online (2304-7151) Vol 1-3
2009 Afghanistan
2010 Afghanistan
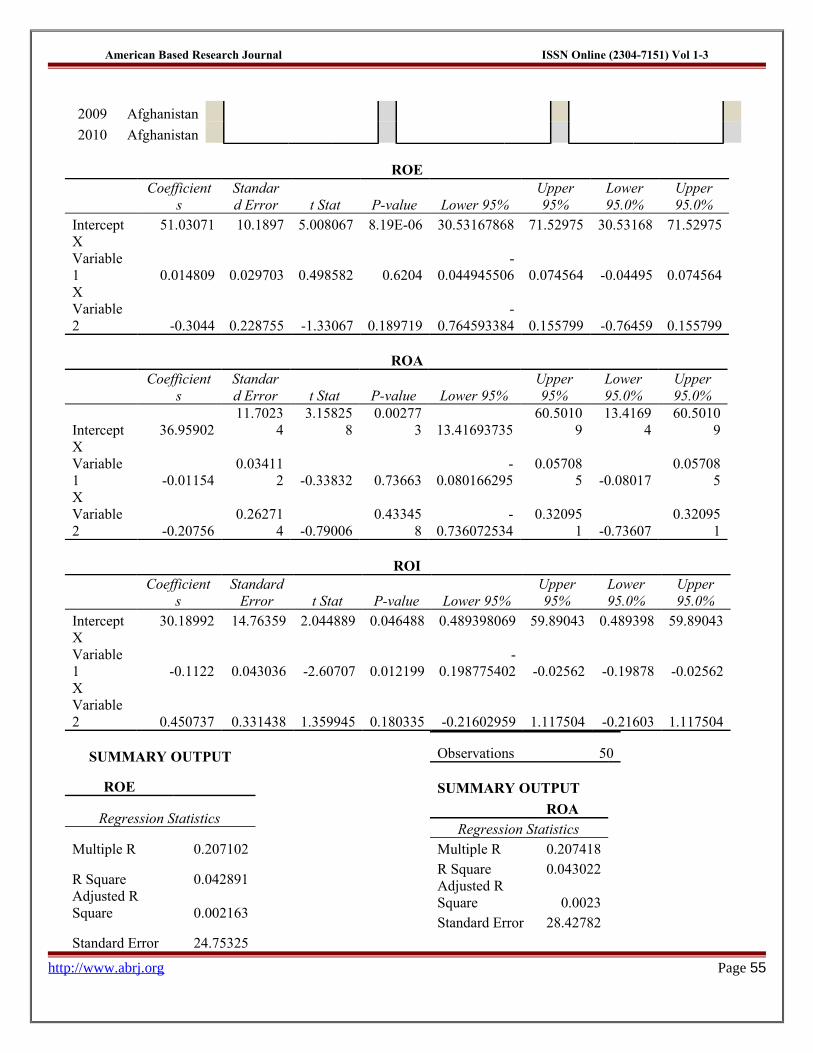
ROE
Coefficient
sStandard Error t Stat P-value Lower 95%
Upper 95%
Lower 95.0%
Upper 95.0%
Intercept 51.03071 10.1897 5.008067 8.19E-06 30.53167868 71.52975 30.53168 71.52975X Variable 1 0.014809 0.029703 0.498582 0.6204
-0.044945506 0.074564 -0.04495 0.074564
X Variable 2 -0.3044 0.228755 -1.33067 0.189719
-0.764593384 0.155799 -0.76459 0.155799
ROA
Coefficient
sStandard Error t Stat P-value Lower 95%
Upper 95%
Lower 95.0%
Upper 95.0%
Intercept 36.9590211.7023
43.15825
80.00277
3 13.4169373560.5010
913.4169
460.5010
9X Variable 1 -0.01154
0.034112 -0.33832 0.73663
-0.080166295
0.057085 -0.08017
0.057085
X Variable 2 -0.20756
0.262714 -0.79006
0.433458
-0.736072534
0.320951 -0.73607
0.320951
ROI
Coefficient
sStandard
Error t Stat P-value Lower 95%Upper 95%
Lower 95.0%
Upper 95.0%
Intercept 30.18992 14.76359 2.044889 0.046488 0.489398069 59.89043 0.489398 59.89043X Variable 1 -0.1122 0.043036 -2.60707 0.012199
-0.198775402 -0.02562 -0.19878 -0.02562
X Variable 2 0.450737 0.331438 1.359945 0.180335 -0.21602959 1.117504 -0.21603 1.117504
SUMMARY OUTPUT
ROE
Regression Statistics
Multiple R 0.207102
R Square 0.042891Adjusted R Square 0.002163
Standard Error 24.75325
Observations 50
SUMMARY OUTPUT
ROARegression Statistics
Multiple R 0.207418R Square 0.043022Adjusted R Square 0.0023Standard Error 28.42782
http://www.abrj.org Page 55
American Based Research Journal ISSN Online (2304-7151) Vol 1-3
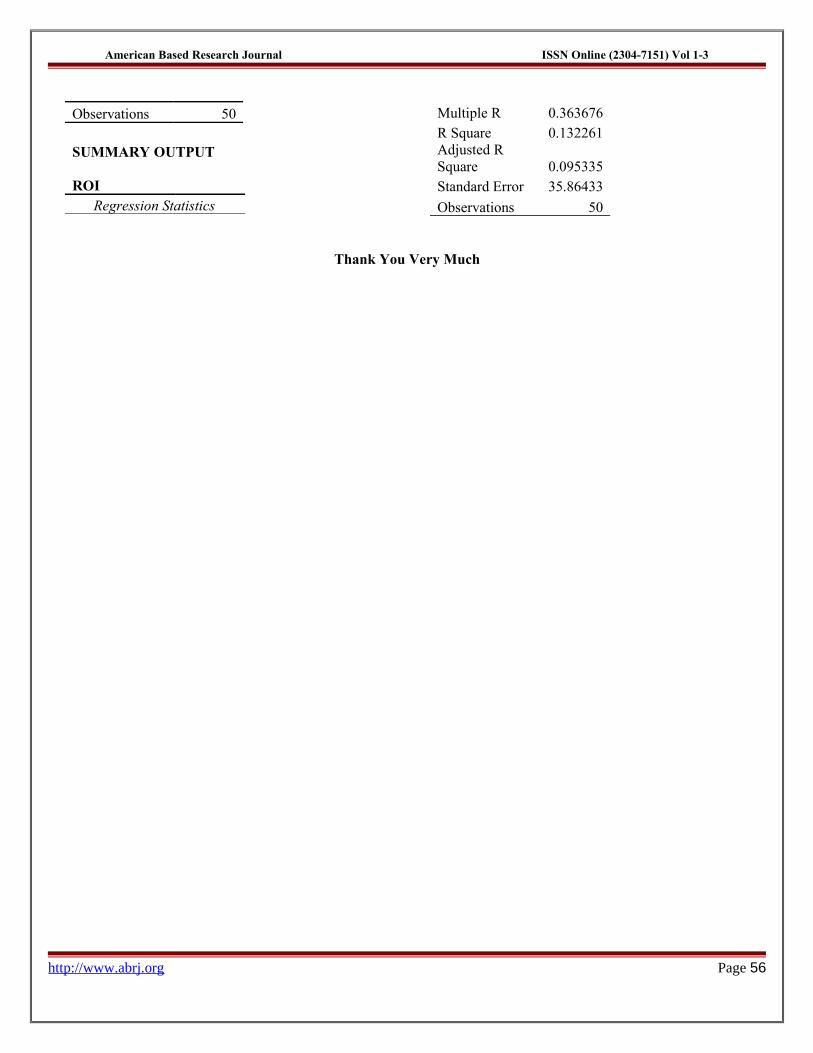
Observations 50
SUMMARY OUTPUT ROI
Regression Statistics
Multiple R 0.363676R Square 0.132261Adjusted R Square 0.095335Standard Error 35.86433
Observations 50
Thank You Very Much
http://www.abrj.org Page 56