klöckner & co - q2 2009 results
TRANSCRIPT
Klöckner & Co SEKlöckner & Co SE
A Leading Multi Metal Distributor
Q2/H1 2009 ResultsAnalysts‘
and Investors‘
Conference Call
A Leading Multi Metal Distributor
Q2/H1 2009 ResultsAnalysts‘
and Investors‘
Conference Call
August 13, 2009August 13, 2009
Dr. Thomas LudwigDr. Thomas Ludwig CEOCEO
Gisbert RGisbert Rüühlhl CFOCFO

2
Disclaimer
This presentation contains forward-looking statements. These statements use words like “believes”, “assumes”, “expects” or similar formulations. Various known and unknown risks, uncertainties and other factors could lead to material differences between the actual future results, financial situation, development or performance of our company and those either expressed or implied by these statements. These factors include, among other things:
Downturns in the business cycle of the industries in which we compete;
Increases in the prices of our raw materials, especially if we are unable to pass these costs along to customers;
Fluctuation in international currency exchange rates as well as changes in the general economic climate
and other factors identified in this presentation.
In view of these uncertainties, we caution you not to place undue reliance on these forward-looking statements. We assume no liability whatsoever to update these forward-looking statements or to conform them to future events or developments.
This presentation is not an offer for sale or a solicitation of an offer to purchase any securities of Klöckner & Co SE or any of its affiliates ("Klöckner & Co").
Securities of Klöckner & Co, including, but not limited to, rights, shares and bonds, may not be offered or sold in the United States or to or for the account or benefit of U.S. persons (as such term is defined in Regulation S under the U.S. Securities Act of 1933, as amended (the "Securities Act")) unless registered under the Securities Act or pursuant to an exemption from such registration.

3
Agenda
1.
Overview Q2/H1 2009, market and strategy Dr. Thomas Ludwig, CEO
2.
Financials Q2/H1 2009 and outlook Gisbert Rühl, CFO
Appendix
4
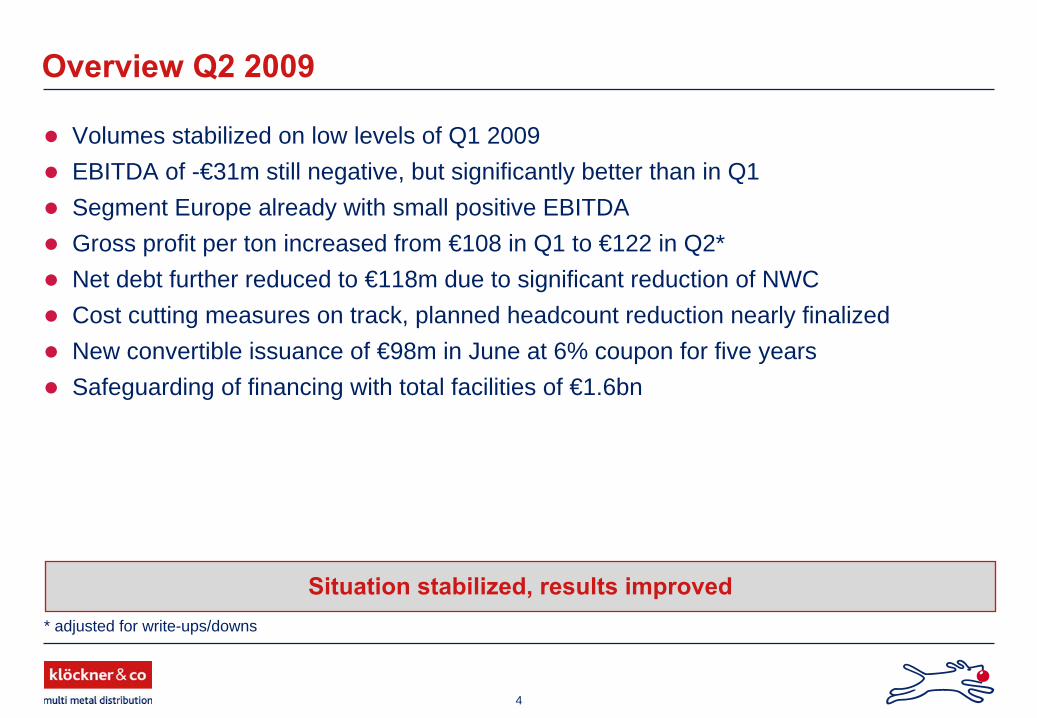
Situation stabilized, results improved
Overview Q2 2009
Volumes stabilized on low levels of Q1 2009EBITDA of -€31m still negative, but significantly better than in Q1Segment Europe already with small positive EBITDA Gross profit per ton increased from €108 in Q1 to €122 in Q2*Net debt further reduced to €118m due to significant reduction of NWCCost cutting measures on track, planned headcount reduction nearly finalizedNew convertible issuance of €98m in June at 6% coupon for five yearsSafeguarding of financing with total facilities of €1.6bn
* adjusted for write-ups/downs

5
Results Q2/H1 2009
(€m) Q2 2009 Q2 2008 Δ% H1 2009 H1 2008 Δ%
Volume (Ttons) 1,053 1,755 -39.9 2,121 3,475 -38.9
Sales 959 1,922 -50.1 2,054 3,582 -42.7
EBITDA -31 212 -114.6 -163 321 -150.6
EBIT -48 197 -124.3 -197 290 -167.8

6
Results Q2/Q1 2009
(€m) Q2 2009 Q1 2009 Δ%
Volume (Ttons) 1,053 1,068 -1.3
Sales 959 1,095 -12.5
EBITDA -31 -132 n.a.
EBIT -48 -149 n.a.
CommentsAdj. for working days and Easter season Q2 on same level as Q1Sales price in Q2 driven below Q1, but better gross margin due to less windfalls and write-ups for inventory
7
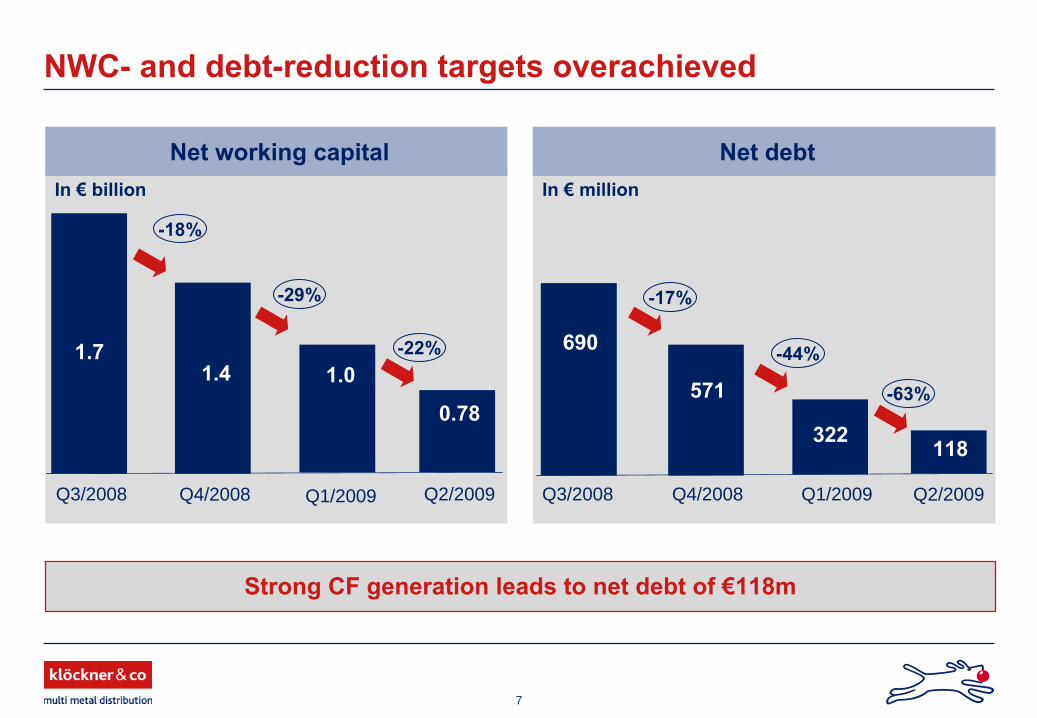
In €
million
Net debtIn €
billion
Net working capital
NWC-
and debt-reduction targets overachieved
Q3/2008 Q4/2008
1.71.4
Q3/2008 Q4/2008
-17%
690
571
322
-44%
Q2/2009 Q1/2009
0.78
-29%
Strong CF generation leads to net debt of €118m
118
Q2/2009
-18%
-63%
Q1/2009
1.0-22%

8
Market conditions are improving
IP increased slightly in Europe and started to stabilize in the USMarket conditions are improving as destocking is ending and demand stabilizingFaster improving market conditions in the US through finalized destocking and signs of sequential demand improvementLow risks of imports from China due to tight domestic market and strengthened pricesUtilization rates in the US and Europe are increasing due to stronger apparent demandPrices for carbon products and stainless products are picking-up in the US and also in Europe
NA domestic prices FOB US Midwest mill in USD/to
300
400
500
600
700
800
900
1000
1100
1200
Jan 0
6Mar
06May
06Ju
l 06
Sep 06
Nov 06
Jan 0
7Mar
07May
07Ju
l 07
Sep 07
Nov 07
Jan 0
8Mar
08May
08Ju
l 08
Sep 08
Nov 08
Jan 0
9Mar
09May
09Ju
l 09
HRC WF Beams
EU domestic prices in EUR/to
300
400
500
600
700
800
900
1000
Jan 0
6Apr
06Ju
l 06
Oct 07
Jan 0
7Apr
07Ju
l 07
Oct 07
Jan 0
8Apr
08Ju
ly 08
Oct 08
Jan 0
9Apr
09Ju
l 09
HRC Medium sections

9
Cost oriented programs
implemented, market oriented initiated
October 08 March 09 Summer 09
Wave 1
Wave 2
Wave 3
• 1,500 headcount reduction or 15% of total workforce targeted• Safeguard liquidity / Net working capital management• Safeguard financing• Capex cut < €25m• Acquisitions suspended
• Market oriented approach• Product portfolio• Value added services• Improvement of distribution
network based on adapted conditions
Driving market share organically and watching
out for acquisition opportunities
Approx. half of targeted €100m net savings in 2009 (incl. STAR) already realized
Net savings 2009 of €100m targeted,thereof €35-40m fixed costs*
* Company estimates

10
Structural improvements will be maintained
Sales
NWC as % of sales
100
100
Volume
Net cost
base
European sourcing and distribution optimization expected to lead to sustained lower inventories
Sustainable improvements increase competitiveness in next upturn
Initiated fixed cost savings expected to be maintained

11
Resume
Sharp cost cutting initiatives show results1,300 out of 1,500 of planned headcount reduction already completed or signedHalf of targeted €100m cost reduction for 2009 already realized
Flexible business model generated high cash flow in downturnStrong balance sheet and restructured €1.6bn facilities give enough headroom also for attractive acquisitions if opportunities arise during the financial crisisFurther stabilization of demand and volumes in H2 expected but due to summer holidays typical weaker demand in July/AugustFurther stabilization and improvement of prices in Q3 expectedPrice development beyond Q3 depends on the ability and intention of the producers to keep demand and production in balance and to bring idled capacity not back on stream too quickly
Tough H1, outlook improving
12
Agenda
1.
Overview Q2/H1 2009, market and strategy Dr. Thomas Ludwig, CEO
2.
Financials Q2/H1 2009 and outlook Gisbert Rühl, CFO
Appendix

13
Summary income statement Q2/H1 2009
(€m) Q22009
Q22008 Δ% H1
2009H1
2008 Δ%
Volume
(Ttons) 1,053 1,755 -39.9 2,121 3,475 -38.9Sales 959 1,922 -50.1 2,054 3,582 -42.7Gross profit% margin
161
16.8
46224.0
-65.2-30.2
23911.6
80322.4
-70.2-48.1
EBITDA% margin
-31
-3.2
21211.0
-114.6-129.3
-163-7.9
3219.0
-150.6-188.2
EBITFinancial result
-48-15
197-17
-124.3-8.5
-197-31
290-34
167.8-7.3
Income before
taxes -63 180 -135.1 -228 257 -189.0
Income taxes 16 -55 -128.8 54 -79 -168.2Minority interests -1 -3 -76.6 1 -5 -118.0Net income* -48 122 -139.5 -174 173 -200.5EPS basic
(€) -1.04 2.63 -139.6 -3.74 3.72 -200.5EPS
diluted (€) -0.85 2.48 -134.2 -3.28 3.54 -192.6
* Attributable to shareholders of Klöckner & Co SE

14
Factors impacting EBITDA Q2 2009
Impact Amount (€m) Comments
Windfall losses* -40 to -60
Declining prices affected almost all productsEffect difficult to quantify due to strong dynamics and very limited purchases
Volume losses* -100 to -120 Impact of poor economic environment
Special expense effects* 40 to 50Mainly driven by price related releases of inventory devaluation reserves at quarter end
Acquisitions / divestitures -16 Mainly affected by divestiture of KVT and Canada
One-offs 1 Sale of property in France
Exchange rate effects -2
* Company estimates

15
Organic volume development in North America -37.7%
Includes acquisition-related sales of €8m for Q2/2009 in North America
Comments
Segment performance Q2 2009
(€m) Europe North America
HQ/Consol. Total
Volume
(Ttons)
Q2 2009 815 238 - 1,053Q2 2008 1,223 532 - 1,755
Δ
% -33.3 -55.1 - -39.9Sales
Q2 2009 798 161 - 959Q2 2008 1,523 399 - 1,922
Δ
% -47.6 -59.7 - -50.1EBITDA
Q2 2009 3 -25 -8 -31% margin 0.3 -15.8 - -3.2
Q2 2008 150 67 -5 212% margin 9.9 16.7 - 11.0
Δ
% EBITDA -98.3 -138.2 - -114.6

16
Balance sheet Q2 2009
(€m) June 30, 2009
Dec. 31, 2008**
Long-term assets 775 811Inventories 604 1,001Trade receivables 591 799Cash & Cash equivalents* 616 297Other assets 173 176Total assets 2,759 3,084
Equity 938 1,081Total long-term liabilities 1,108 1,177
• thereof financial liabilities 626 813Total short-term liabilities 713 826
• thereof trade payables 417 392Total equity and liabilities 2,759 3,084
Net working capital 778 1,407
Net financial debt 118 571
* Including restricted cash of €7m; ** restated due to initial application of IFRIC 14
Shareholders’
equity:Decreased slightly from 35% to 34%Would be at 44% if cash would be used for net debt reduction
Financial debt:Leverage increased slightly from 0.95x to 1.03x EBITDAGearing reduced from 53% to 13%
Net Working Capital:Decrease is price- and volume driven
Comments

17
Statement of cash flow H1
Operating CF negatively impacted by volume drop, offset by change in NWC Investing CF mainly balanced because of postponement of acquisitions and investment cut
Comments(€m) H1 2009
H1 2008
Operating CF -170 317Changes in net working capital 640 -274Others -2 -40Cash flow from operating activities 468 3
Inflow from disposals of fixed assets/others 6 8Outflow from investments in fixed assets/ others -8 -282
Cash flow from investing activities -2 -274Equity component of convertible bondChanges in financial liabilities
26-149
0296
Net interest paymentsDividends
-220
-16-38
Cash flow from financing activities -145 242
Total cash flow 321 -29

18
Current financial structure
Bank Debt Securitized Debt
Capital MarketDebt
NWC Acquisitions
Changes in financial structure succeeded
SyndicatedLoan
€300m
BilateralFacilities ABS Convertible
Bonds
€400m €505m
€325m
31%
26%
43%
€98m
€1.6bn facilities without performance covenants allow to finance growth and to pursue acquisition opportunities
Liquidity position
Used credit lines
CashPosition
€616m
€734m
Net debt€118m
19
Outlook 2009
Volume development expected to remain subdued in H2Higher prices in Q3 but increasing capacity utilization could be a risk for Q4Strict cost cutting measures on track, headcount reduction nearly completedH2 results expected to be clearly better than H1 but offset of H1 losses not achievableMarket oriented action plan initiated to step ahead
Homework done, now looking ahead!

20
Agenda
1.
Overview H1 2009, market and strategy Dr. Thomas Ludwig, CEO
2.
Financials Q2/H1 2009 and outlook Gisbert Rühl, CFO
Appendix

21
Appendix
Table of contents
Financial calendar 2009 and contact details
Quarterly results and FY results 2005-2009
Current shareholder structure

22
Contact details Investor Relations
Dr. Thilo Theilen, Head of IR
Phone: +49 203 307 2050
Fax: +49 203 307 5025
E-mail: [email protected]
Internet: www.kloeckner.de
Financial calendar 2009
October 5+6: Capital Market Days
November 13: Q3 Interim Report
Financial calendar 2009 and contact details

23
(€m) Q2 2009
Q1 2009
Q4 2008
Q3
2008
Q22008
Q12008
FY2008
FY2007
FY2006
FY2005*
Volume (Ttons) 1,053 1,068 1,151 1,348 1,755 1,720 5,974 6,478 6,127 5,868Sales 959 1,095 1,394 1.773 1,922 1,660 6,750 6,274 5,532 4,964Gross profit 161 78 173 390 462 340 1,366 1,221 1,208 987% margin 16.8 7.1 12.4 22.0 24.0 20.5 20.2 19.5 21.8 19.9EBITDA -31 -132 -134 413 212 109 600 371 395 197% margin -3.2 -12.0 -9.6 23.3 11.0 6.6 8.9 5.9 7.1 4.0EBIT -48 -149 -152 395 197 93 533 307 337 135Financial result -15 -16 -18 -18 -17 -17 -70 -97 -64 -54Income before taxes -63 -165 -171 378 180 76 463 210 273 81
Income taxes 16 38 29 -30 -55 -24 -79 -54 -39 -29Minority interests -1 -2 -15 -4 3 -2 -14 23 28 16Net income -48 -126 -126 351 122 51 398 133 206 36EPS basic (€) -1.04 -2.70 -2.72 7.56 2.63 1.09 8.56 2.87 4.44 -EPS diluted (€) -0.85 -2.43 -2.44 7.01 2.48 1.06 8.11 2.87 4.44 -
Quarterly results and FY results 2005-2009
* Pro-forma consolidated figures for FY 2005, without release of negative goodwill of €139 million and without transaction costs of €39 million, without restructuring expenses of €17 million (incurred Q4) and without activity disposal of €1.9 million (incurred Q4).

24
Current shareholder structure
Source: Survey Thomson Financial (as of Feb. 09)
Identified institutional investors account for 66%
UK based investors dominate (Franklin previously accounted for US share, 9.89%)
Top 10 individual shareholdings represent around 31%
100% Free float
Retail shareholder represent 11%
CommentsGeographical breakdown of identified institutional investors
Germany
22%
United Kingdom31%
US21%
11%Rest of Europe
10%Switzerland
France4%1%
Rest of World

25
Our symbol
the earsattentive to customer needs
the eyeslooking forward to new developments
the nosesniffing out opportunities to improve performance
the ballsymbolic of our role to fetch and carry for our customers
the legsalways moving fast to keep up with the demands of the customers