klöckner & co se press conference presentation q1 2016 results
TRANSCRIPT
Q1 2016 Results
Press Conference
May 4, 2016
Gisbert Rühl | CEO
No.2 Q1 2016 Results | Analysts’ and Investors’ Conference | Klöckner & Co SE
Disclaimer
This presentation contains forward-looking statements which reflect the current views of the management of
Klöckner & Co SE with respect to future events. They generally are designated by the words “expect”, “assume”, “presume”, “intend”,
“estimate”, “strive for”, “aim for”, “plan”, “will”, “endeavor”, “outlook” and comparable expressions and generally contain information that relates
to expectations or goals for economic conditions, sales proceeds or other yardsticks for the success of the enterprise. Forward-looking
statements are based on currently valid plans, estimates and expectations. You therefore should view them with caution. Such statements are
subject to risks and factors of uncertainty, most of which are difficult to assess and which generally are outside of the control of Klöckner & Co
SE. The relevant factors include the effects of significant strategic and operational initiatives, including the acquisition or disposition of
companies. If these or other risks and factors of uncertainty occur or if the assumptions on which the statements are based turn out to be
incorrect, the actual results of Klöckner & Co SE can deviate significantly from those that are expressed or implied in these statements.
Klöckner & Co SE cannot give any guarantee that the expectations or goals will be attained. Klöckner & Co SE – notwithstanding existing
obligations under laws pertaining to capital markets – rejects any responsibility for updating the forward-looking statements through taking into
consideration new information or future events or other things.
In addition to the key data prepared in accordance with International Financial Reporting Standards, Klöckner & Co SE is presenting non-
GAAP key data such as EBITDA, EBIT, Net Working Capital and net financial liabilities that are not a component of the accounting
regulations. These key data are to be viewed as supplementary to, but not as a substitute for data prepared in accordance with International
Financial Reporting Standards. Non-GAAP key data are not subject to IFRS or any other generally applicable accounting regulations. Other
companies may base these concepts upon other definitions.

No.3
1. Highlights and update on strategy
2. Financials
3. Outlook
4. Appendix
Agenda
Q1 2016 Results | Analysts’ and Investors’ Conference | Klöckner & Co SE
No.4 Q1 2016 Results | Analysts’ and Investors’ Conference | Klöckner & Co SE
Highlights01
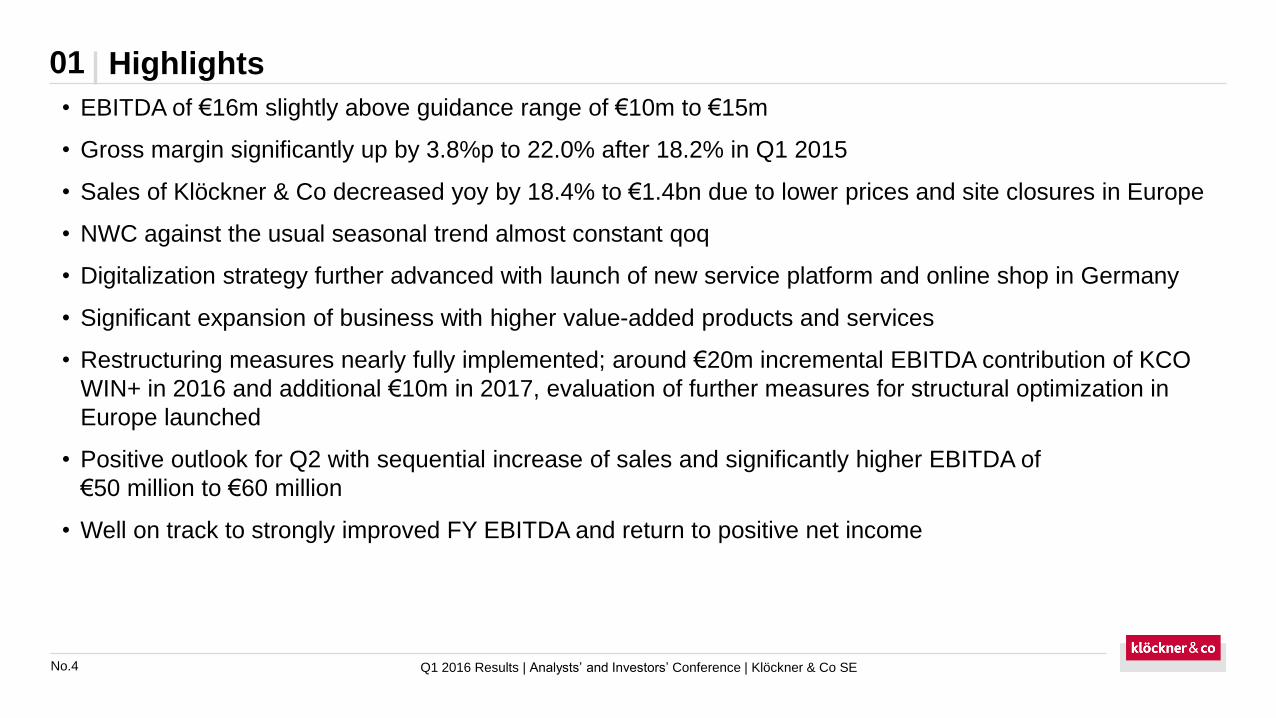
• EBITDA of €16m slightly above guidance range of €10m to €15m
• Gross margin significantly up by 3.8%p to 22.0% after 18.2% in Q1 2015
• Sales of Klöckner & Co decreased yoy by 18.4% to €1.4bn due to lower prices and site closures in Europe
• NWC against the usual seasonal trend almost constant qoq
• Digitalization strategy further advanced with launch of new service platform and online shop in Germany
• Significant expansion of business with higher value-added products and services
• Restructuring measures nearly fully implemented; around €20m incremental EBITDA contribution of KCO
WIN+ in 2016 and additional €10m in 2017, evaluation of further measures for structural optimization in
Europe launched
• Positive outlook for Q2 with sequential increase of sales and significantly higher EBITDA of
€50 million to €60 million
• Well on track to strongly improved FY EBITDA and return to positive net income
No.5 Q1 2016 Results | Analysts’ and Investors’ Conference | Klöckner & Co SE
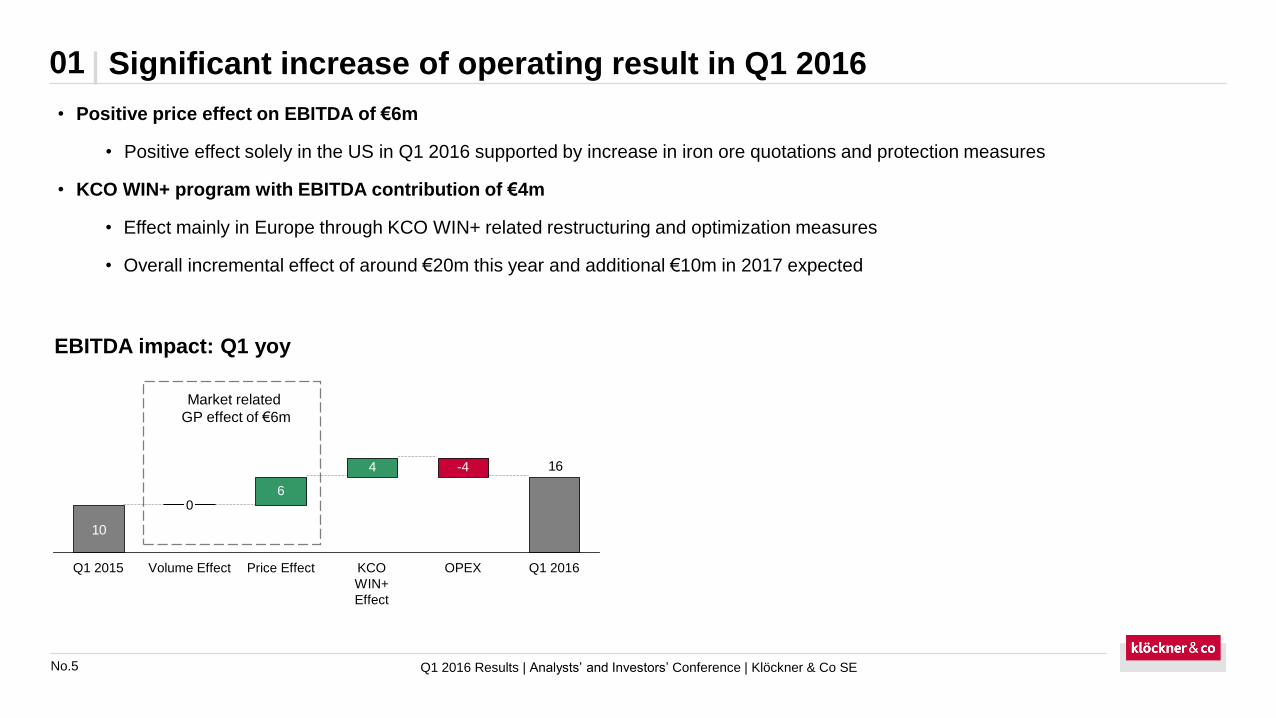
Significant increase of operating result in Q1 201601
EBITDA impact: Q1 yoy
Market related
GP effect of €6m
• Positive price effect on EBITDA of €6m
• Positive effect solely in the US in Q1 2016 supported by increase in iron ore quotations and protection measures
• KCO WIN+ program with EBITDA contribution of €4m
• Effect mainly in Europe through KCO WIN+ related restructuring and optimization measures
• Overall incremental effect of around €20m this year and additional €10m in 2017 expected
4
10
16
6
Price EffectVolume EffectQ1 2015
0
KCO
WIN+
Effect
-4
OPEX Q1 2016
No.6 Q1 2016 Results | Analysts’ and Investors’ Conference | Klöckner & Co SE
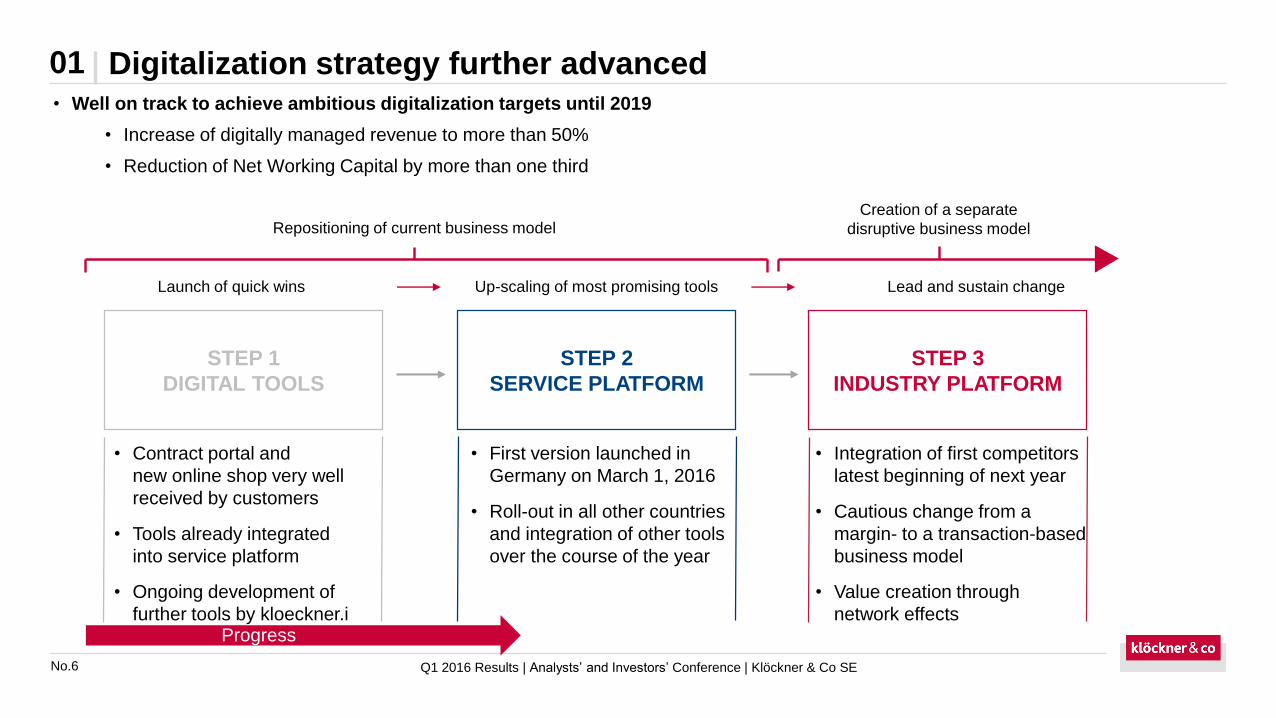
Digitalization strategy further advanced01• Well on track to achieve ambitious digitalization targets until 2019
• Increase of digitally managed revenue to more than 50%
• Reduction of Net Working Capital by more than one third
• Contract portal and
new online shop very well
received by customers
• Tools already integrated
into service platform
• Ongoing development of
further tools by kloeckner.i
• First version launched in
Germany on March 1, 2016
• Roll-out in all other countries
and integration of other tools
over the course of the year
• Integration of first competitors
latest beginning of next year
• Cautious change from a
margin- to a transaction-based
business model
• Value creation through
network effects
Repositioning of current business modelCreation of a separate
disruptive business model
Launch of quick wins Up-scaling of most promising tools Lead and sustain change
STEP 1
DIGITAL TOOLS
STEP 2
SERVICE PLATFORM
STEP 3
INDUSTRY PLATFORM
Progress
No.7
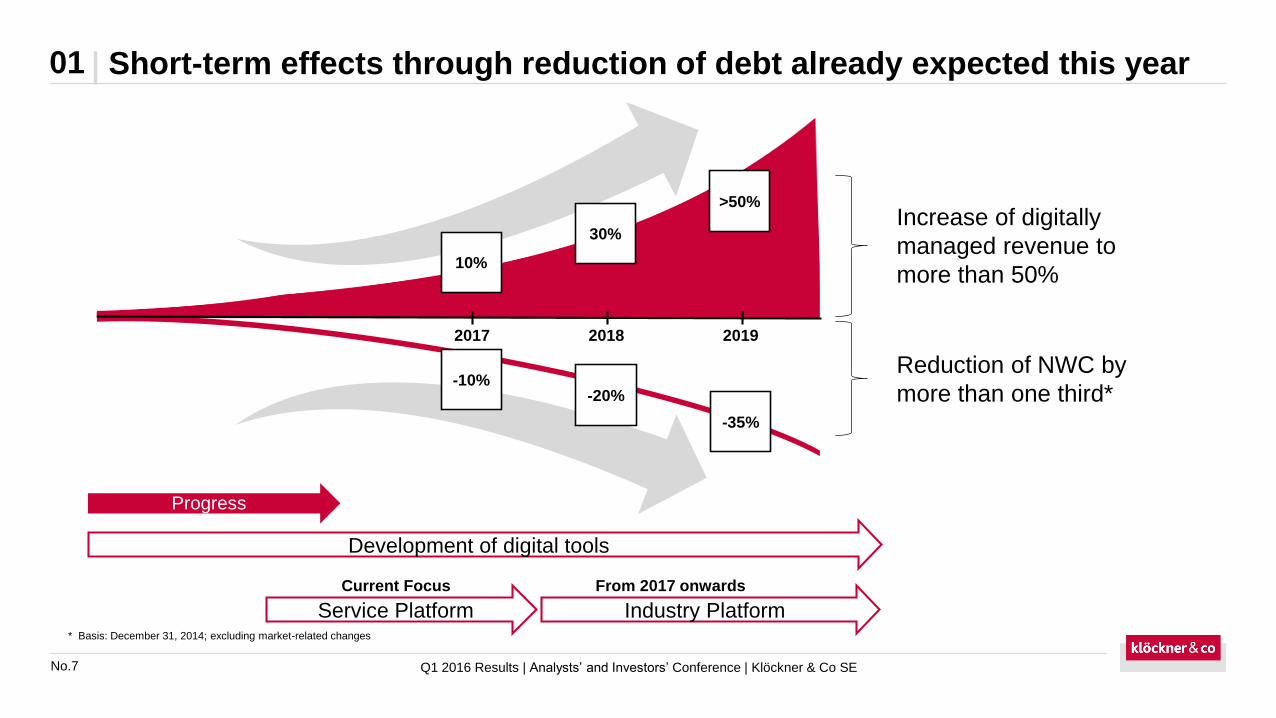
Short-term effects through reduction of debt already expected this year01
Reduction of NWC by
more than one third*
Increase of digitally
managed revenue to
more than 50%
Development of digital tools
Service Platform Industry Platform
Progress
Current Focus From 2017 onwards
* Basis: December 31, 2014; excluding market-related changes
-10%-20%
10%
30%
>50%
-35%
201920182017
Q1 2016 Results | Analysts’ and Investors’ Conference | Klöckner & Co SE

No.8
01
Network effect: the lager the network, the better the matches between supply and demand and the richer the data that
can be used to find matches*
* Alstyne, Parker, Choudary: Pipelines, Platforms, and the New Rules of Strategy, HBR 04/2016
Mid- and long-term effect through value creation by the platform
Q1 2016 Results | Analysts’ and Investors’ Conference | Klöckner & Co SE
No.9
20%
25%35%
20%
T A R G E T 2 0 1 7
Q1 2016 Results | Analysts’ and Investors’ Conference | Klöckner & Co SE
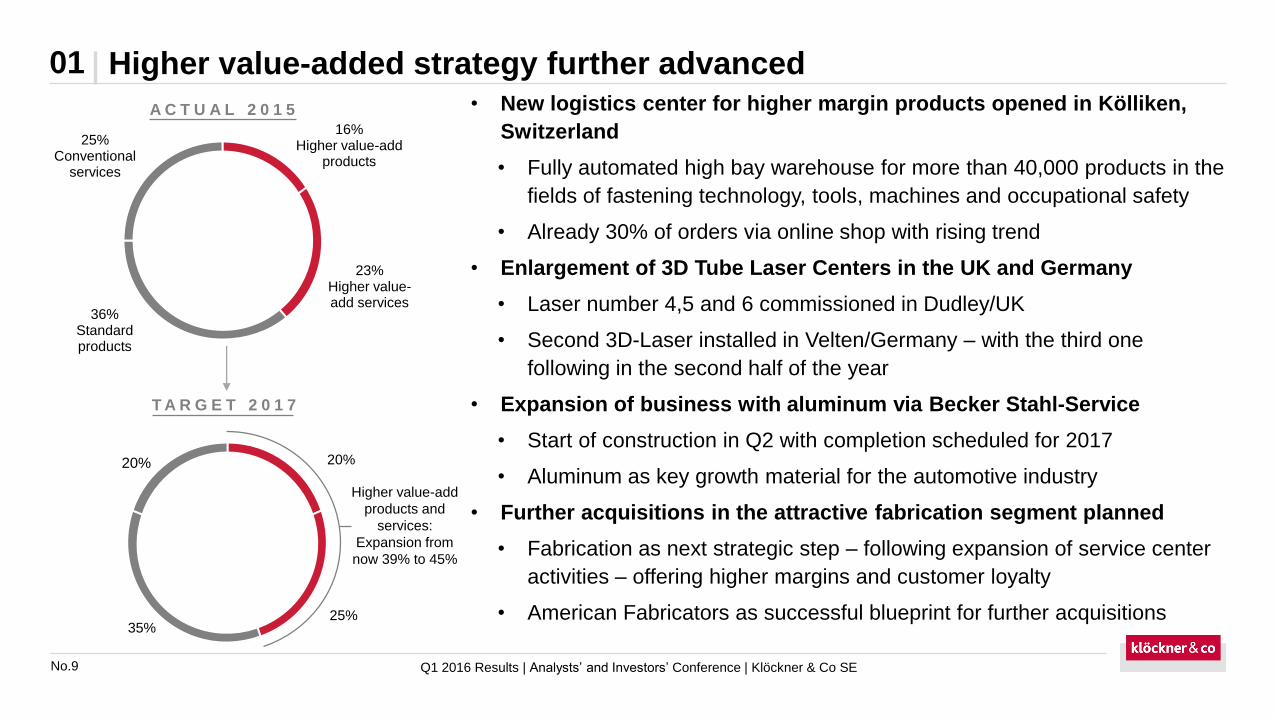
Higher value-added strategy further advanced01• New logistics center for higher margin products opened in Kölliken,
Switzerland
• Fully automated high bay warehouse for more than 40,000 products in the
fields of fastening technology, tools, machines and occupational safety
• Already 30% of orders via online shop with rising trend
• Enlargement of 3D Tube Laser Centers in the UK and Germany
• Laser number 4,5 and 6 commissioned in Dudley/UK
• Second 3D-Laser installed in Velten/Germany – with the third one
following in the second half of the year
• Expansion of business with aluminum via Becker Stahl-Service
• Start of construction in Q2 with completion scheduled for 2017
• Aluminum as key growth material for the automotive industry
• Further acquisitions in the attractive fabrication segment planned
• Fabrication as next strategic step – following expansion of service center
activities – offering higher margins and customer loyalty
• American Fabricators as successful blueprint for further acquisitions
16% Higher value-add
products
23%Higher value-add services
36% Standard products
25% Conventional
services
A C T U A L 2 0 1 5
Higher value-add
products and
services:
Expansion from
now 39% to 45%
No.10 Q1 2016 Results | Analysts’ and Investors’ Conference | Klöckner & Co SE
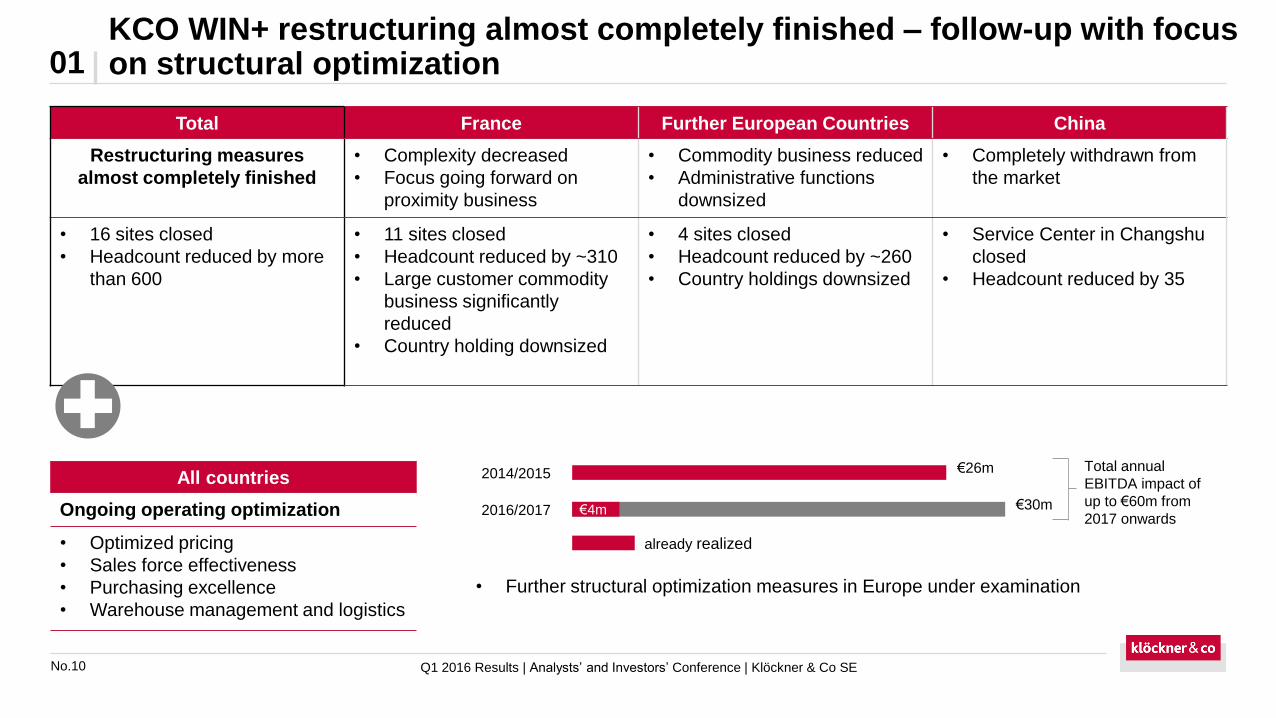
KCO WIN+ restructuring almost completely finished – follow-up with focus on structural optimization01
Total France Further European Countries China
Restructuring measures
almost completely finished
• Complexity decreased
• Focus going forward on
proximity business
• Commodity business reduced
• Administrative functions
downsized
• Completely withdrawn from
the market
• 16 sites closed
• Headcount reduced by more
than 600
• 11 sites closed
• Headcount reduced by ~310
• Large customer commodity
business significantly
reduced
• Country holding downsized
• 4 sites closed
• Headcount reduced by ~260
• Country holdings downsized
• Service Center in Changshu
closed
• Headcount reduced by 35
All countries
Ongoing operating optimization
• Optimized pricing
• Sales force effectiveness
• Purchasing excellence
• Warehouse management and logistics
2014/2015
2016/2017
already realized
€26m
€30m
Total annual
EBITDA impact of
up to €60m from
2017 onwards€4m
• Further structural optimization measures in Europe under examination
No.11
1. Highlights and update on strategy
2. Financials
3. Outlook
4. Appendix
Agenda
Q1 2016 Results | Analysts’ and Investors’ Conference | Klöckner & Co SE
No.12 Q1 2016 Results | Analysts’ and Investors’ Conference | Klöckner & Co SE
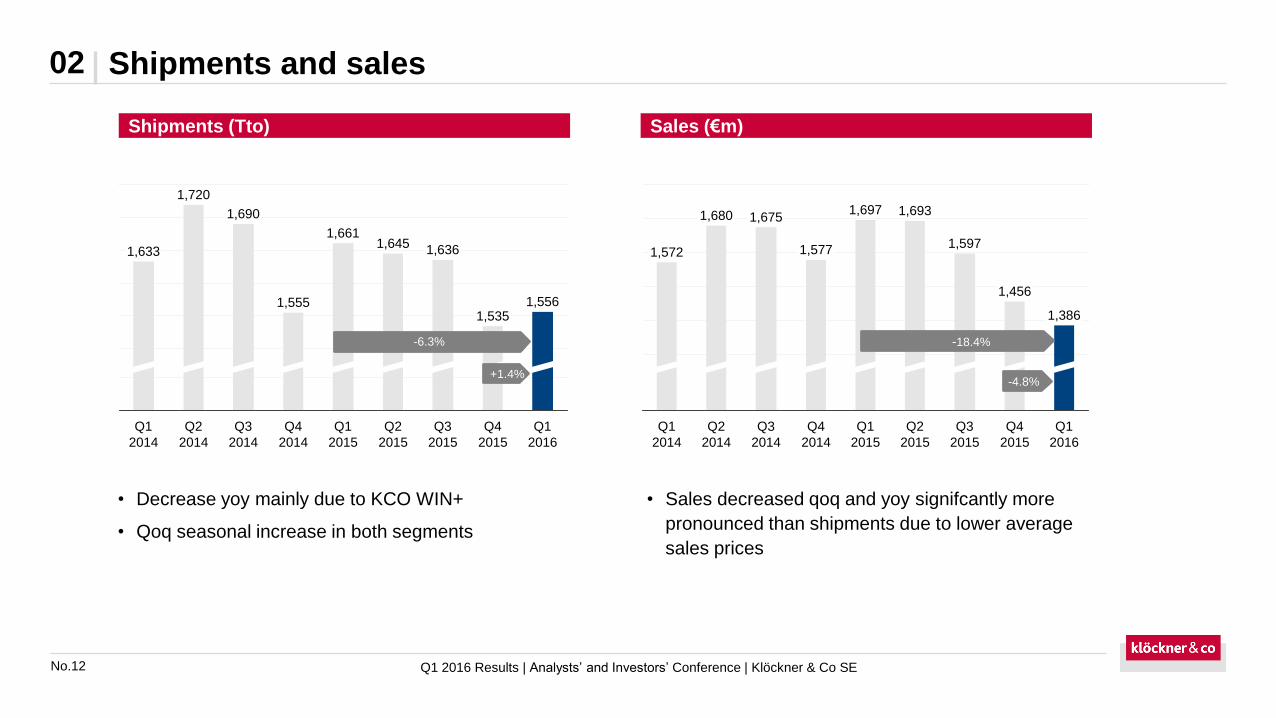
Shipments and sales02
• Decrease yoy mainly due to KCO WIN+
• Qoq seasonal increase in both segments
• Sales decreased qoq and yoy signifcantly more
pronounced than shipments due to lower average
sales prices
Q4
2015
1,535
Q3
2015
1,636
Q2
2015
Q1
2015
1,661
Q4
2014
1,556
Q1
2016
1,633
Q1
2014
1,720
Q2
2014
1,645
1,690
Q3
2014
1,555
Q2
2015
1,693
Q1
2015
1,697
Q4
2014
1,577
Q3
2014
Q1
2016
Q2
2014
1,680
Q1
2014
1,572
Q4
2015
1,456
1,386
Q3
2015
1,597
1,675
-6.3%
+1.4%
-18.4%
-4.8%
Shipments (Tto) Sales (€m)
No.13 Q1 2016 Results | Analysts’ and Investors’ Conference | Klöckner & Co SE
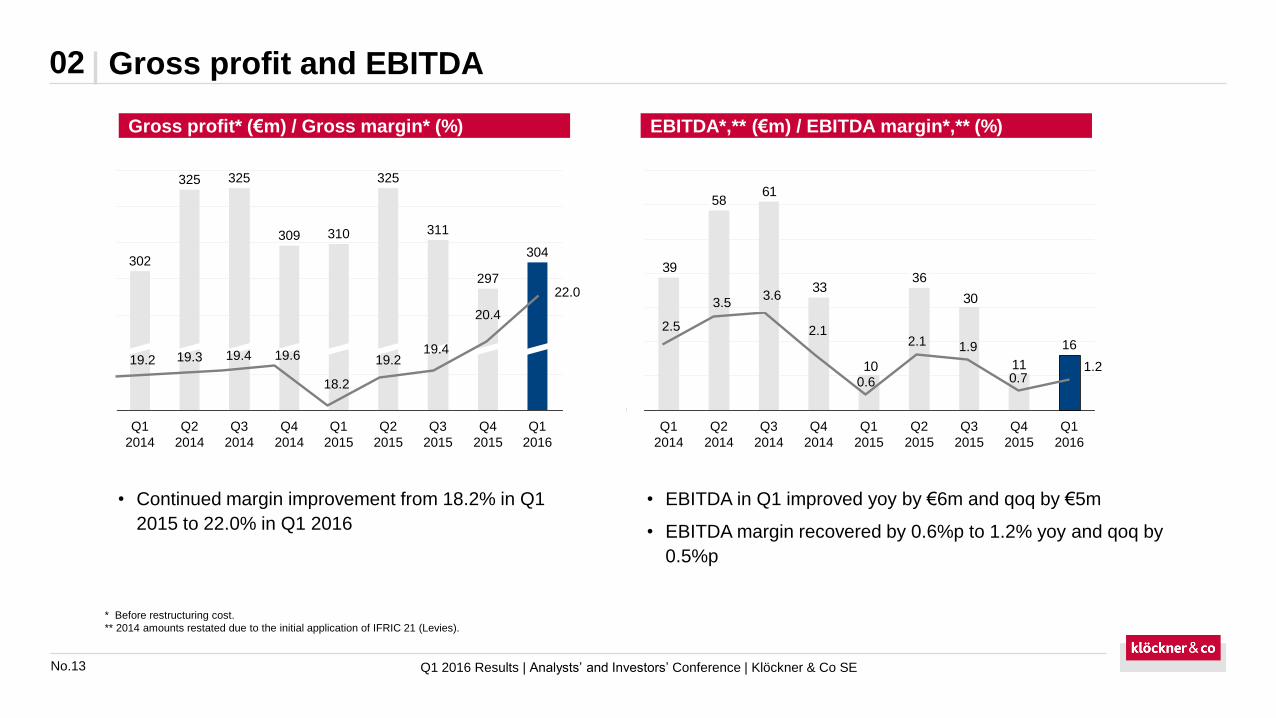
Gross profit and EBITDA02
* Before restructuring cost.
** 2014 amounts restated due to the initial application of IFRIC 21 (Levies).
11
30
10
33
61
39
Q1
2016
16
Q4
2015
Q3
2015
Q2
2015
36
Q1
2015
Q4
2014
Q3
2014
Q2
2014
58
Q1
2014
1.20.7
1.92.1
0.6
2.1
3.63.5
2.5
Q1
2014
302
310309
Q1
2016
Q2
2015
297
Q4
2015
311
Q3
2015
304
325325
Q1
2015
325
Q2
2014
Q3
2014
Q4
2014
19.4
22.0
20.4
19.219.2 19.419.3
18.2
19.6
• Continued margin improvement from 18.2% in Q1
2015 to 22.0% in Q1 2016
• EBITDA in Q1 improved yoy by €6m and qoq by €5m
• EBITDA margin recovered by 0.6%p to 1.2% yoy and qoq by
0.5%p
Gross profit* (€m) / Gross margin* (%) EBITDA*,** (€m) / EBITDA margin*,** (%)
No.14 Q1 2016 Results | Analysts’ and Investors’ Conference | Klöckner & Co SE
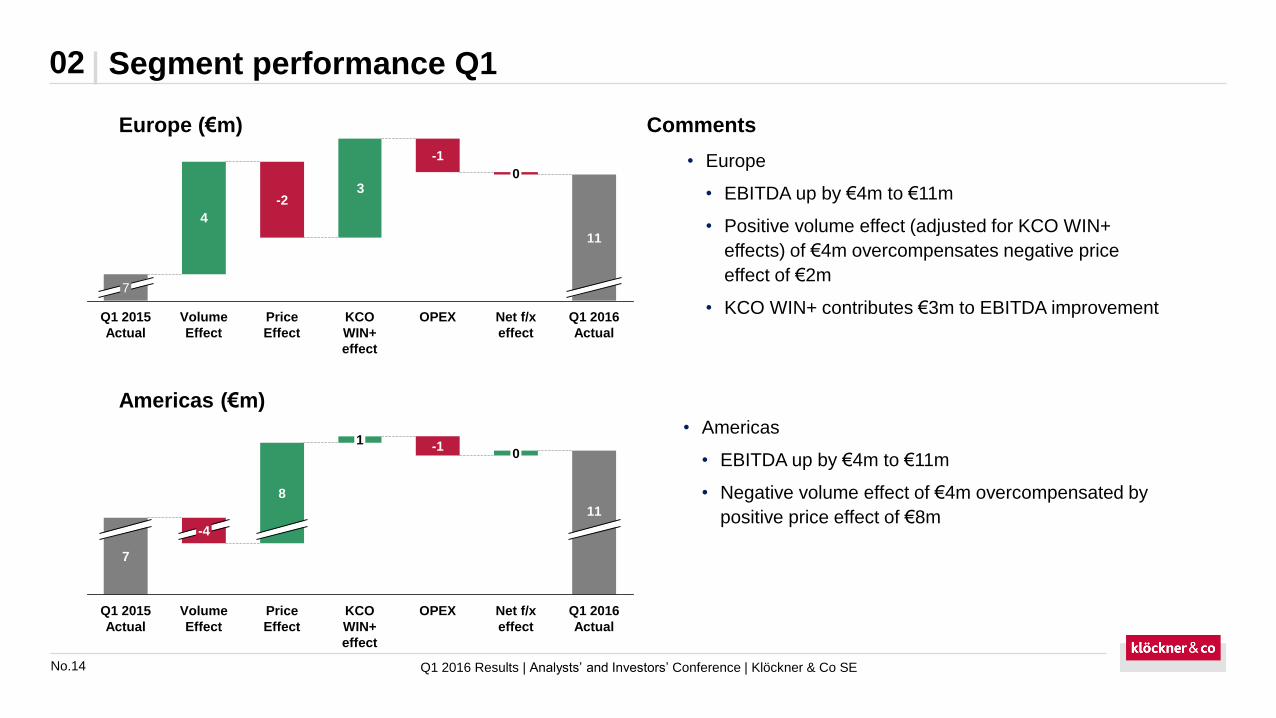
Segment performance Q102
• Europe
• EBITDA up by €4m to €11m
• Positive volume effect (adjusted for KCO WIN+
effects) of €4m overcompensates negative price
effect of €2m
• KCO WIN+ contributes €3m to EBITDA improvement
CommentsEurope (€m)
Americas (€m)
0
OPEX
-1
KCO
WIN+
effect
1
Price
Effect
Q1 2016
Actual
11
Net f/x
effect
8
Volume
Effect
-4
Q1 2015
Actual
7
3
4
KCO
WIN+
effect
Price
Effect
-2
Volume
Effect
Q1 2015
Actual
7
Q1 2016
Actual
11
Net f/x
effect
0
OPEX
-1
• Americas
• EBITDA up by €4m to €11m
• Negative volume effect of €4m overcompensated by
positive price effect of €8m
No.15 Q1 2016 Results | Analysts’ and Investors’ Conference | Klöckner & Co SE
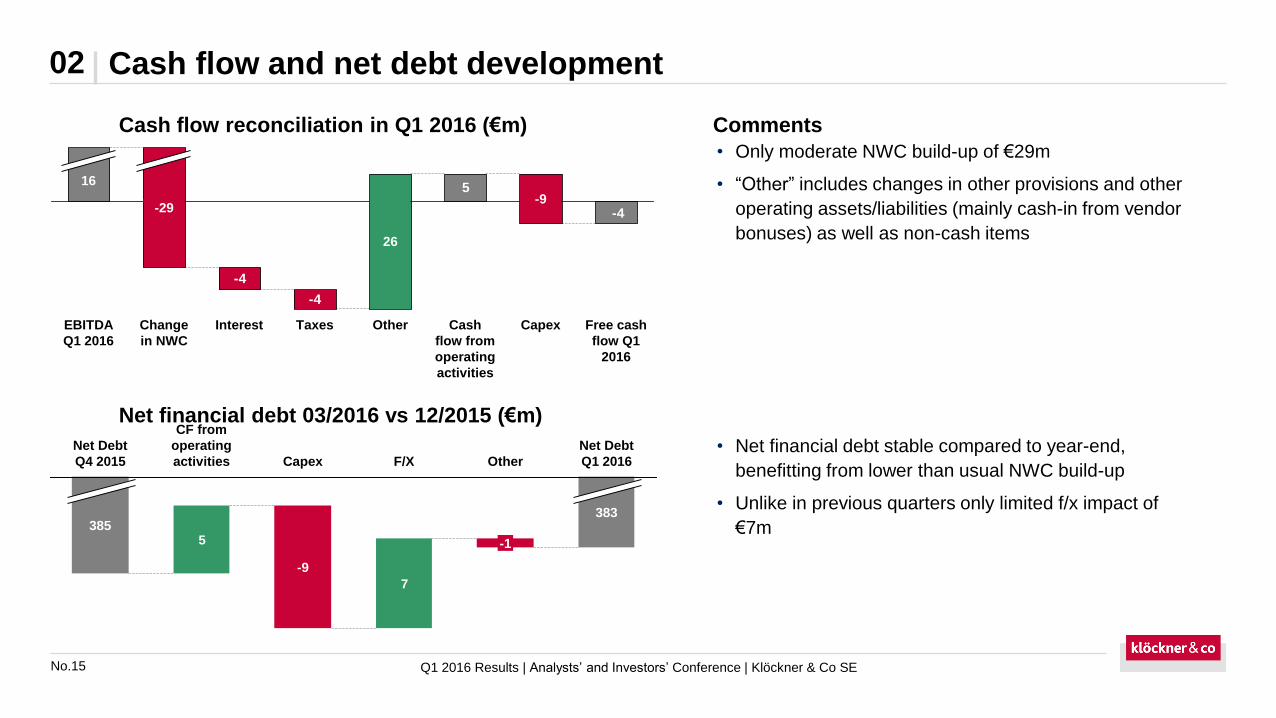
Cash flow and net debt development02
36
• Only moderate NWC build-up of €29m
• “Other” includes changes in other provisions and other
operating assets/liabilities (mainly cash-in from vendor
bonuses) as well as non-cash items
-4
-4
5
-4
Free cash
flow Q1
2016
Capex
-9
Cash
flow from
operating
activities
Other
26
TaxesInterestChange
in NWC
-29
EBITDA
Q1 2016
16
CommentsCash flow reconciliation in Q1 2016 (€m)
• Net financial debt stable compared to year-end,
benefitting from lower than usual NWC build-up
• Unlike in previous quarters only limited f/x impact of
€7m
Net financial debt 03/2016 vs 12/2015 (€m)
7
5
Net Debt
Q1 2016
383
Other
-1
F/XCapex
-9
CF from
operating
activities
Net Debt
Q4 2015
385
No.16 Q1 2016 Results | Analysts’ and Investors’ Conference | Klöckner & Co SE
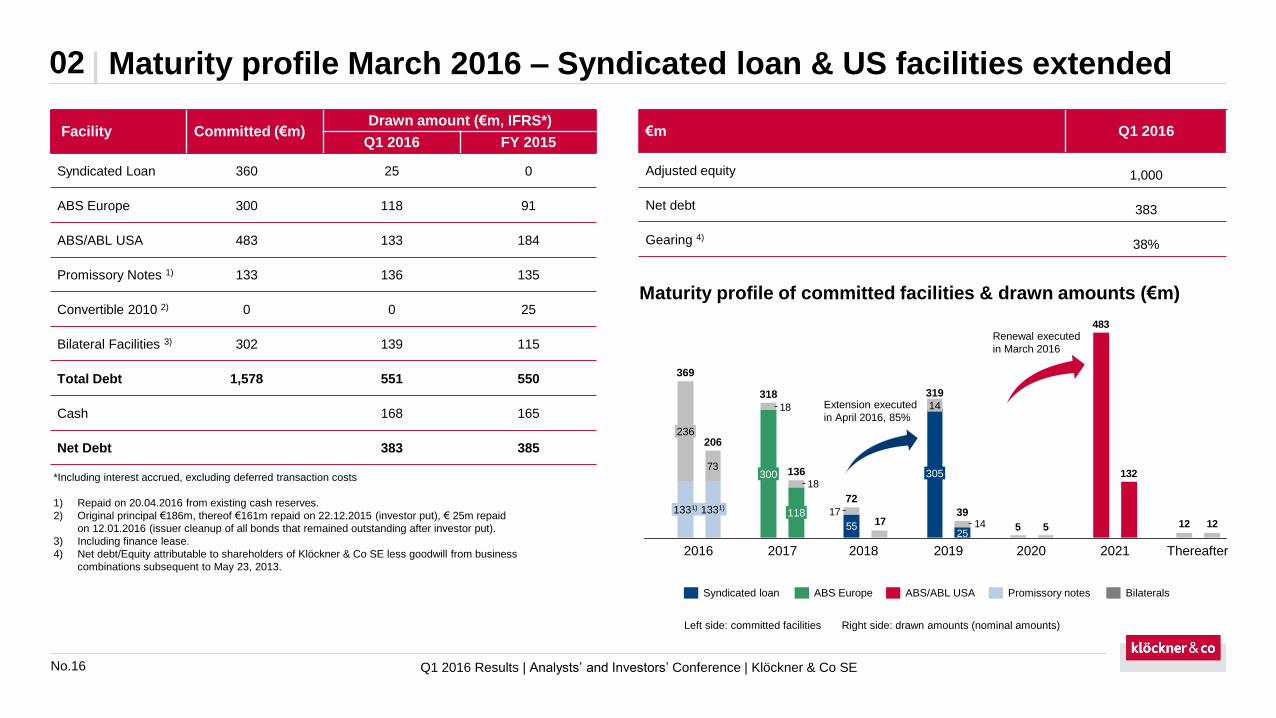
Maturity profile March 2016 – Syndicated loan & US facilities extended 02
Facility Committed (€m)Drawn amount (€m, IFRS*)
Q1 2016 FY 2015
Syndicated Loan 360 25 0
ABS Europe 300 118 91
ABS/ABL USA 483 133 184
Promissory Notes 1) 133 136 135
Convertible 2010 2) 0 0 25
Bilateral Facilities 3) 302 139 115
Total Debt 1,578 551 550
Cash 168 165
Net Debt 383 385
€m Q1 2016
Adjusted equity 1,000
Net debt 383
Gearing 4)38%
Maturity profile of committed facilities & drawn amounts (€m)
Left side: committed facilities Right side: drawn amounts (nominal amounts)
ABS/ABL USA BilateralsSyndicated loan ABS Europe Promissory notes
*Including interest accrued, excluding deferred transaction costs
1) Repaid on 20.04.2016 from existing cash reserves.
2) Original principal €186m, thereof €161m repaid on 22.12.2015 (investor put), € 25m repaid
on 12.01.2016 (issuer cleanup of all bonds that remained outstanding after investor put).
3) Including finance lease.
4) Net debt/Equity attributable to shareholders of Klöckner & Co SE less goodwill from business
combinations subsequent to May 23, 2013.
2555
132
483
121255141717
18
18
73
206
1331)
369
1331)
236
136
118
318
300
39
319
305
14
72
Extension executed
in April 2016, 85%
Renewal executed
in March 2016
2016 2017 2018 2019 2020 2021 Thereafter

No.17
1. Highlights and update on strategy
2. Financials
3. Outlook
4. Appendix
Agenda
Q1 2016 Results | Analysts’ and Investors’ Conference | Klöckner & Co SE
No.18 Q1 2016 Results | Analysts’ and Investors’ Conference | Klöckner & Co SE
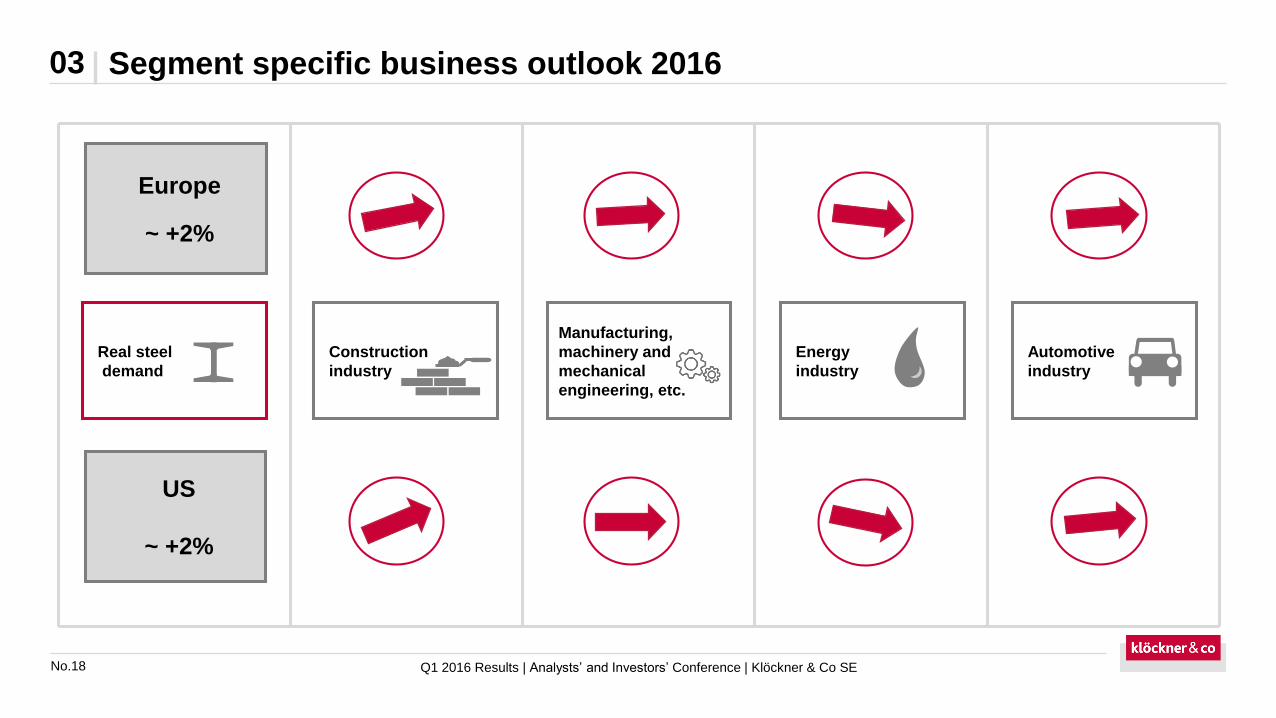
Segment specific business outlook 201603
Energy
industry
Real steel
demand
Europe
~ +2%
Construction
industry
Manufacturing,
machinery and
mechanical
engineering, etc.
Automotive
industry
US
~ +2%
No.19 Q1 2016 Results | Analysts’ and Investors’ Conference | Klöckner & Co SE
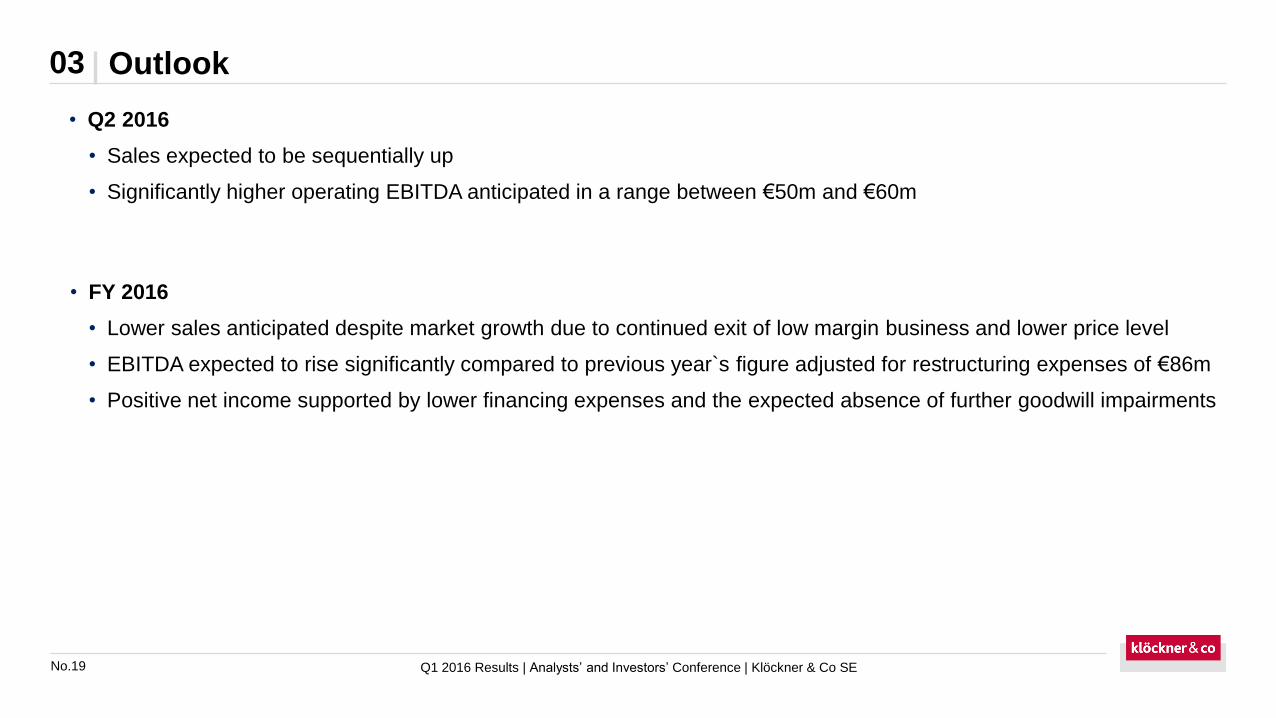
Outlook 03
• Q2 2016
• Sales expected to be sequentially up
• Significantly higher operating EBITDA anticipated in a range between €50m and €60m
• FY 2016
• Lower sales anticipated despite market growth due to continued exit of low margin business and lower price level
• EBITDA expected to rise significantly compared to previous year`s figure adjusted for restructuring expenses of €86m
• Positive net income supported by lower financing expenses and the expected absence of further goodwill impairments
No.20
1. Highlights and update on strategy
2. Financials
3. Outlook
4. Appendix
Agenda
Q1 2016 Results | Analysts’ and Investors’ Conference | Klöckner & Co SE
No.21 Q1 2016 Results | Analysts’ and Investors’ Conference | Klöckner & Co SE
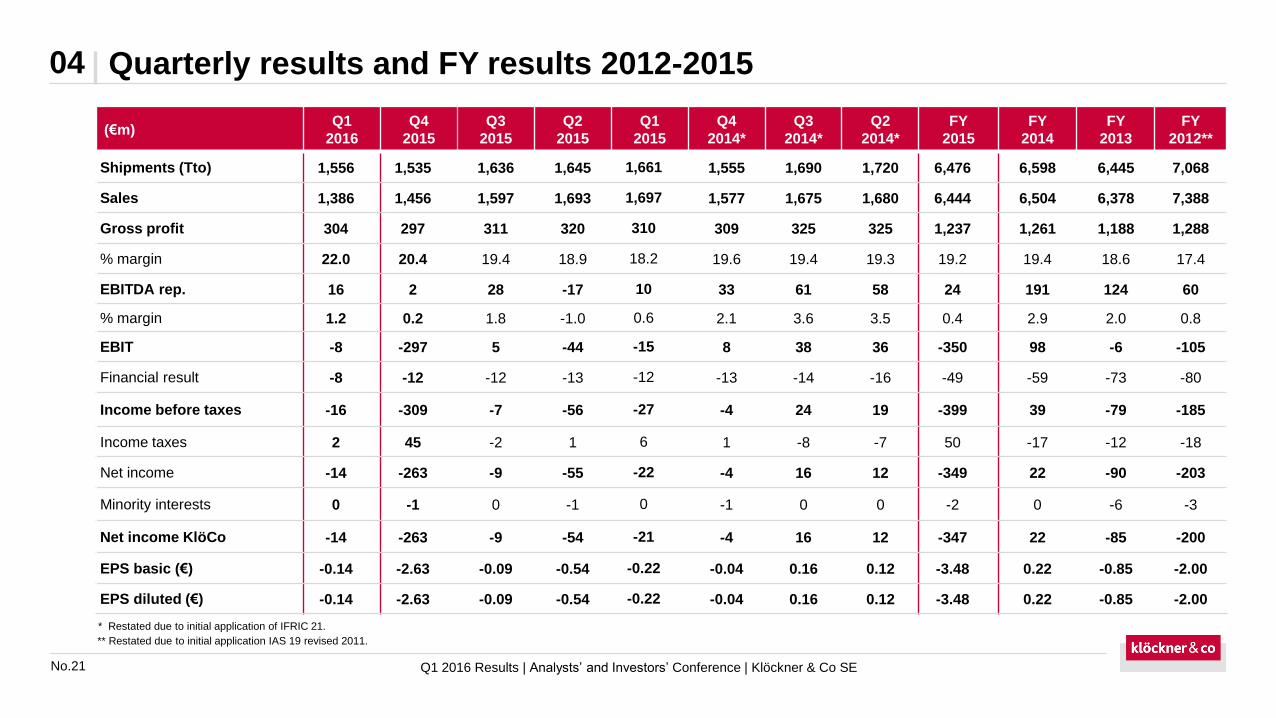
Quarterly results and FY results 2012-201504
(€m)Q1
2016
Q4
2015
Q3
2015
Q2
2015
Q1
2015
Q4
2014*
Q3
2014*
Q2
2014*
FY
2015
FY
2014
FY
2013
FY
2012**
Shipments (Tto) 1,556 1,535 1,636 1,645 1,661 1,555 1,690 1,720 6,476 6,598 6,445 7,068
Sales 1,386 1,456 1,597 1,693 1,697 1,577 1,675 1,680 6,444 6,504 6,378 7,388
Gross profit 304 297 311 320 310 309 325 325 1,237 1,261 1,188 1,288
% margin 22.0 20.4 19.4 18.9 18.2 19.6 19.4 19.3 19.2 19.4 18.6 17.4
EBITDA rep. 16 2 28 -17 10 33 61 58 24 191 124 60
% margin 1.2 0.2 1.8 -1.0 0.6 2.1 3.6 3.5 0.4 2.9 2.0 0.8
EBIT -8 -297 5 -44 -15 8 38 36 -350 98 -6 -105
Financial result -8 -12 -12 -13 -12 -13 -14 -16 -49 -59 -73 -80
Income before taxes -16 -309 -7 -56 -27 -4 24 19 -399 39 -79 -185
Income taxes 2 45 -2 1 6 1 -8 -7 50 -17 -12 -18
Net income -14 -263 -9 -55 -22 -4 16 12 -349 22 -90 -203
Minority interests 0 -1 0 -1 0 -1 0 0 -2 0 -6 -3
Net income KlöCo -14 -263 -9 -54 -21 -4 16 12 -347 22 -85 -200
EPS basic (€) -0.14 -2.63 -0.09 -0.54 -0.22 -0.04 0.16 0.12 -3.48 0.22 -0.85 -2.00
EPS diluted (€) -0.14 -2.63 -0.09 -0.54 -0.22 -0.04 0.16 0.12 -3.48 0.22 -0.85 -2.00
* Restated due to initial application of IFRIC 21.
** Restated due to initial application IAS 19 revised 2011.
No.22 Q1 2016 Results | Analysts’ and Investors’ Conference | Klöckner & Co SE
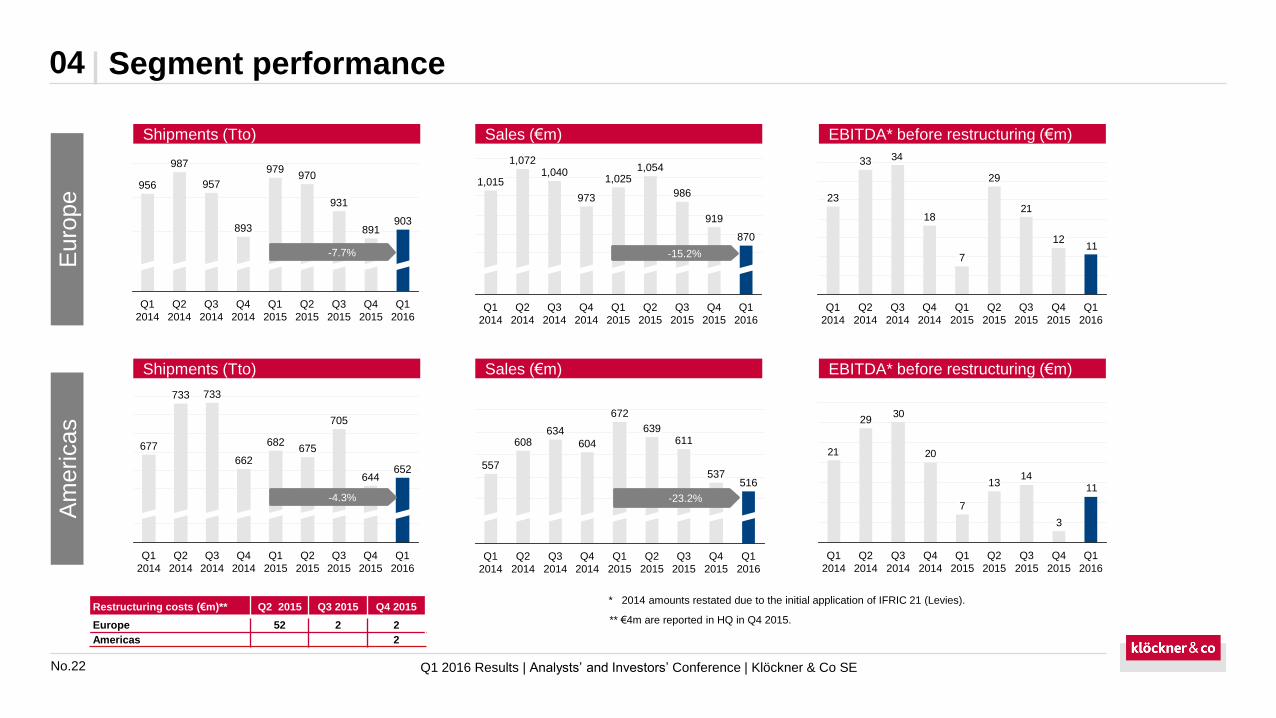
Segment performance04
* 2014 amounts restated due to the initial application of IFRIC 21 (Levies).
Q1
2016
903
Q4
2015
891
Q3
2015
931
Q2
2015
970
Q1
2015
979
Q4
2014
893
Q3
2014
957
Q2
2014
987
Q1
2014
956
919
Q3
2015
Q2
2015
1,054
Q1
2015
1,025
Q4
2014
973 986
Q1
2016
870
Q4
2015
Q3
2014
1,040
Q2
2014
1,072
Q1
2014
1,015
11
21
34
Q2
2015
29
Q1
2015
7
Q4
2014
18
Q3
2014
Q2
2014
33
Q1
2014
23
Q1
2016
Q4
2015
12
Q3
2015
Q4
2015
644
Q3
2015
705
Q2
2015
675
Q1
2015
682
Q4
2014
662
Q3
2014
733
Q2
2014
733
Q1
2014
677
Q1
2016
652
Q1
2014
557
Q3
2014
672
Q2
2015
537
608634
Q1
2015
611
Q2
2014
604
Q4
2014
639
Q3
2015
516
Q4
2015
Q1
2016
1114
20
30
21
Q3
2014
Q2
2014
29
Q1
2014
3
Q1
2016
Q4
2015
13
Q3
2015
7
Q2
2015
Q1
2015
Q4
2014
-7.7%
-4.3%
-15.2%
-23.2%
Euro
pe
Am
ericas
Restructuring costs (€m)** Q2 2015 Q3 2015 Q4 2015
Europe 52 2 2
Americas 2
Shipments (Tto) Sales (€m) EBITDA* before restructuring (€m)
Shipments (Tto) Sales (€m) EBITDA* before restructuring (€m)
** €4m are reported in HQ in Q4 2015.
No.23 Q1 2016 Results | Analysts’ and Investors’ Conference | Klöckner & Co SE
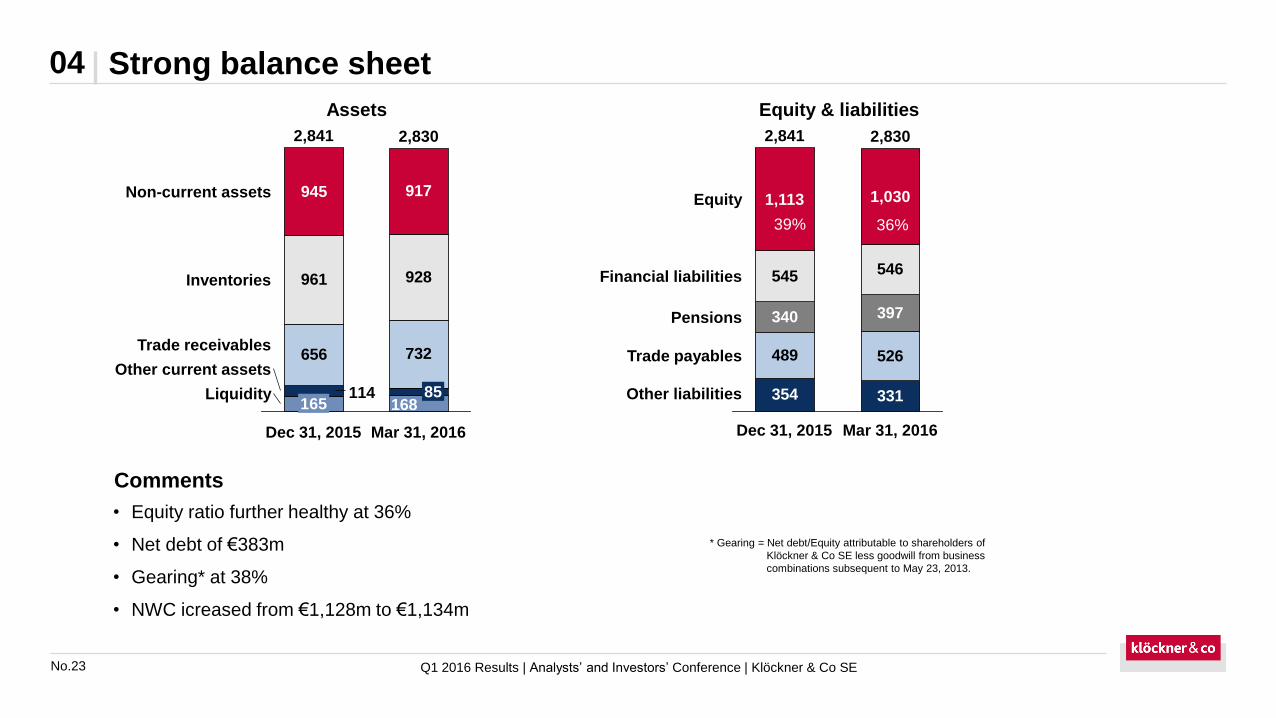
Strong balance sheet04
• Equity ratio further healthy at 36%
• Net debt of €383m
• Gearing* at 38%
• NWC icreased from €1,128m to €1,134m
* Gearing = Net debt/Equity attributable to shareholders of
Klöckner & Co SE less goodwill from business
combinations subsequent to May 23, 2013.
Comments
Assets Equity & liabilities
39% 39%
656 732
168114
928961
917945
Inventories
Non-current assets
Mar 31, 2016
2,830
85
Dec 31, 2015
2,841
165Liquidity
Other current assets
Trade receivables
354 331
489 526
340 397
545 546
Other liabilities
Trade payables
Pensions
Financial liabilities
Equity
Mar 31, 2016
2,830
1,030
Dec 31, 2015
2,841
1,113
39% 36%
No.24 Q1 2016 Results | Analysts’ and Investors’ Conference | Klöckner & Co SE
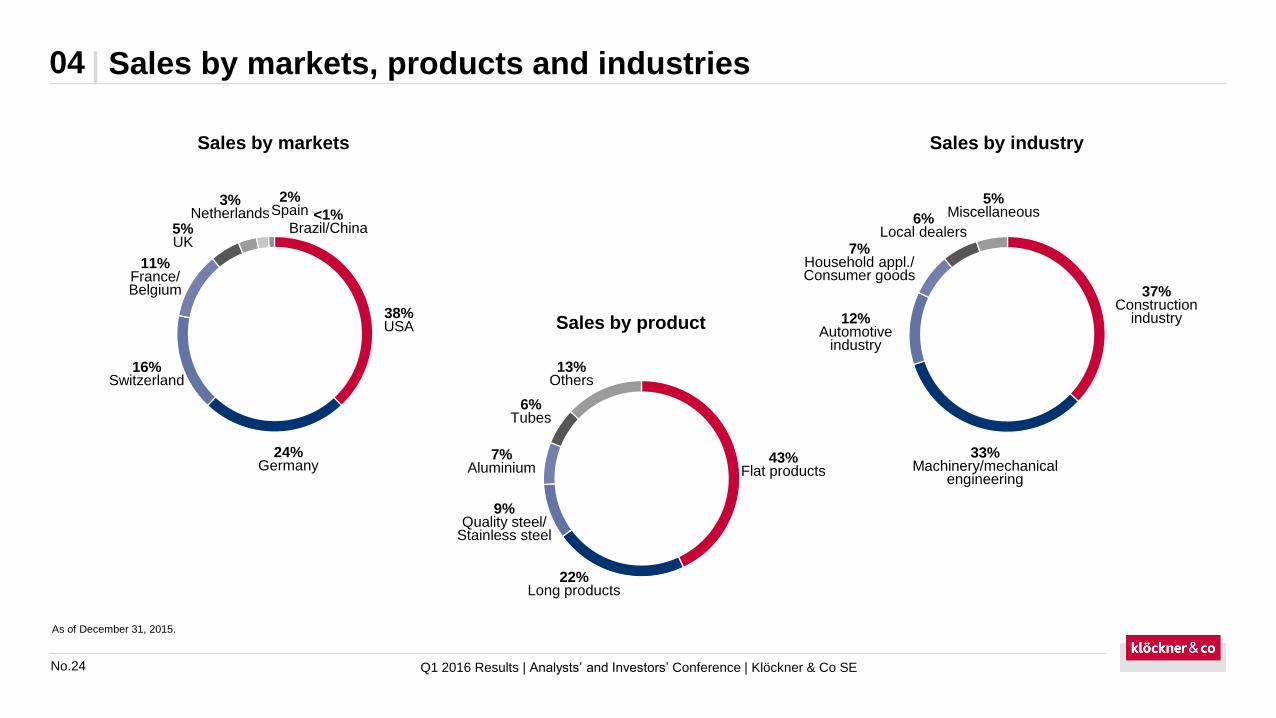
Sales by markets, products and industries04
As of December 31, 2015.
Sales by markets Sales by industry
Sales by product
5%UK
<1%Brazil/China
11%France/Belgium
16%Switzerland
24%Germany
38%USA
3%Netherlands
2%Spain
6%Tubes
7%Aluminium
9%Quality steel/
Stainless steel
22%Long products
43%Flat products
13%Others
12%Automotive
industry
5%Miscellaneous6%
Local dealers
33%Machinery/mechanical
engineering
37%Construction
industry
7%Household appl./Consumer goods
No.25 Q1 2016 Results | Analysts’ and Investors’ Conference | Klöckner & Co SE
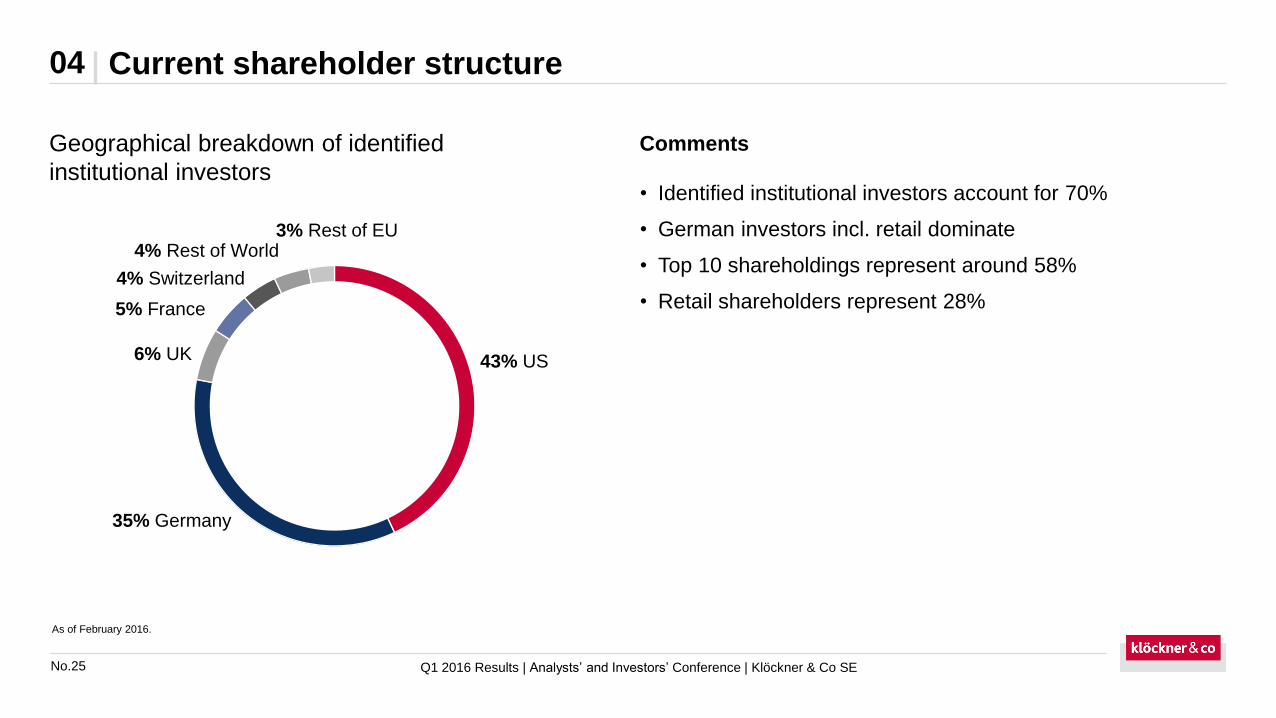
Current shareholder structure04
Geographical breakdown of identified
institutional investors• Identified institutional investors account for 70%
• German investors incl. retail dominate
• Top 10 shareholdings represent around 58%
• Retail shareholders represent 28%
Comments
3% Rest of EU
43% US
4% Rest of World
4% Switzerland
6% UK
5% France
35% Germany
As of February 2016.
Financial calendar 2016
Christian PokroppHead of Investor Relations & Corporate Communications
Phone: +49 203 307 2050
Fax: +49 203 307 5025
Email: [email protected]
Internet: www.kloeckner.com
May 13, 2016 Annual General Meeting 2016,Düsseldorf
August 4, 2016 Q2 interim report 2016
November 3, 2016 Q3 interim report 2016
Contact details