job strain and heart rate variability in resident physicians within a general hospital
TRANSCRIPT
AMERICAN JOURNAL OF INDUSTRIAL MEDICINE
Job Strain and Heart Rate Variability inResident Physicians Within a General Hospital
Sendy Isarel Hernandez-Gaytan, ScD,1 Stephen J. Rothenberg, PhD,2
Paul Landsbergis, PhD, MPH,3 Leonor Cedillo Becerril, ScD,4 Guillermo De Leon-Leon, ME,5
Sean M. Collins, ScD,6 and Francisco Javier Dıaz-Vasquez, MHSA5�
Objective To evaluate the association of heart rate variability with job strain in firstyear resident physicians.Methods We performed the study at the ‘‘Manuel Gea Gonzalez’’ General Hospital inMexico City. 54 resident doctors were studied over a period of 24 hr in their first yearof specialization. Two questionnaires were administered: the first on general demo-graphics, and the second, the Job Content Questionnaire. Heart rate variability wasevaluated through the frequency domain (low-frequency power, high-frequency power,and low-frequency power/high-frequency power ratio) and time domain (SDNN). Thedoctors wore a Holter monitor over a 24-hr period, which included a workday plustheir on-call time. They recorded their activities in a log.Results Compared to physicians in the ‘‘low strain’’ category, physicians working inthe ‘‘passive’’ category had lower overall peak-to-peak cardiac variability (standarddeviation of N–N intervals, SDNN), �9.08% (95% CI �17.97, 0.74), a �25% (95%CI �45.00, 0.22) lower high-frequency power, and �26.95% (95% CI �39.00,�12.53) lower low-frequency power. Physicians working in the ‘‘high strain’’ categoryhad lower low-frequency power, �17.85% (95%CI �32.34, �0.25), and lower low-frequency/high-frequency ratio �24.29% (95% CI 38.08, 7.42) compared to those inthe ‘‘low strain’’ category.Conclusions High job strain and low job control among medical residents wereassociated with several indicators of lowered heart rate variability. Thus, analysisof heart rate variability may be an informative marker for evaluating thephysiological impacts of workplace stressors. Am. J. Ind. Med.� 2012 Wiley Periodicals, Inc.
KEY WORDS: job strain; heart rate variability; demand–control model
Disclosure Statement: The authors report no conflicts of interests.1Instituto Nacional de Enfermedades Respiratorias,Me¤ xico,DF,Mexico2Instituto Nacional de Salud Publica, Cuernavaca,Morelos,Mexico3Department of Environmental and Occupational Health Sciences, School of Public
Health, State University of NewYork-DownstateMedical Center,NewYork,NewYork4Instituto Nacional de Ecolog�a,Me¤ xico,DF,Mexico5Comisio¤ n Coordinadora de Institutos Nacionales de Salud y Hospitales de Alta
Especialidad,Me¤ xico, DF,Mexico6Department of Physical Therapy, School of Health and Environment, University of
Massachusetts, Lowell,Massachusetts
Contract grant sponsor: Irving J. Selikoff International Scholar of the Mount Sinai Schoolof Medicine; Contract grant number:D43TW000640.
*Correspondence to: Francisco Javier D|¤ az-Va¤ squez, MHSA, Comisio¤ n Coordinadora deInstitutos Nacionales de Salud y Hospitales de Alta Especialidad, Perife¤ rico Sur 4118, 1erPiso, Col. Jardines del Pedregal, Delegacio¤ n A¤ lvaro Obrego¤ n, C.P. 01900, Me¤ xico, DF, Mexico.E-mail: [email protected]
Accepted 28 June 2012DOI10.1002/ajim.22098.Published online inWiley Online Library
(wileyonlinelibrary.com).
�2012WileyPeriodicals,Inc.
INTRODUCTION
Heart rate variability (HRV) measures are useful
descriptors and predictors of cardiac prognosis in the clin-
ically ill [Kristal-Boneh et al., 1995; Task Force of the
European Society of Cardiology and The North American
Society of Pacing and Electrophysiology, 1996; Stein and
Kleiger, 1999] and can predict cardiovascular morbidity
and mortality in healthy individuals [Tsuji et al., 1994,
1996; Dekker et al., 1997].
Several studios have shown that low HRV is associat-
ed with cardiovascular disease [Togo and Takahashi,
2009]. Lombardi et al. [2001] found that the parameters
most consistent with cardiovascular disease (CVD) risk
were the standard deviation of all NN intervals (SDNN),
high Frequency (HF), low Frequency (LF). However, the
parameter low-frequency/high-frequency ratio was less
consistently associated with CVD risk.
HRV is an indicator of heart rate regulation; it meas-
ures autonomic nervous system interactions, reflecting
all the physiological factors that modulate the normal
heart rate. In general, highly stressed people exhibit
reduced HRV as a result of the overactivity of the sympa-
thetic nervous system [Kang et al., 2004] and reduced ac-
tivity of the parasympathetic nervous system. HRV
analysis has been proposed to assess job strain and its re-
lation with cardiovascular diseases [Kristal-Boneh et al.,
1995].
One widely studied model [Belkic et al., 2004], evalu-
ating main job characteristics leading to stress is the de-
mand–control model [Karasek and Theorell, 1990; Schnall
et al., 1994], also known as the job strain model [Van Der
Doef and Maes, 1999].
The model describes two work dimensions: psycho-
logical job demands and job control [Schnall et al., 1994].
Job demands refer to work exigencies in terms of quantity,
promptness, effort, time [Karasek, 1985]. Job control, also
called job decision latitude, refers to those conditions
which make learning and skill development and their exer-
cise possible. Decision latitude includes two components:
skills and authority; these components are usually com-
bined in one measure [Van Der Doef and Maes, 1999].
Job strain (or high-strain jobs) occurs when the human
body is psychologically overloaded (high demands) and
the worker has little control over the job [Karasek and
Theorell, 2000]. Jobs strain increase the risk of cardiovas-
cular diseases [Van Der Doef and Maes, 1999].
There is a wide array of research on work stress using
the demand–control model and cardiovascular diseases,
but very few studies have examined the association be-
tween work stress and changes in the heart rate variability.
HRV studies have been carried out in samples of shipyard
workers [Kang et al., 2004], manufacturing workers [Van
Amelsvoort et al., 2000], nurses [Riese et al., 2004], and
other workers [Collins et al., 2005], but physicians in
training have not previously been studied using the
demand–control model and HRV.
The demand–control model proposes that professio-
nals such as physicians are classified as having active jobs
[Karasek et al., 1998]; that is, they are exposed to high
psychological demands mixed with high decision latitude.
We expect to find a much lower percentage of resident
physicians in the active category, due to a high work load
combining extensive training and patient treatment activi-
ties [Michie and Sandhu, 1994; Butterfield, 1998]. In
Mexico, first year residents have little decision-making lat-
itude; they basically carry out medical procedures ordered
by more advanced residents and staff physicians.
Studies of resident physicians have evaluated sleeping
hours and their consequences in car accidents, resident
physician’s satisfaction [Perry and Osborne, 2003] and
contrasting the quality of life between resident physicians
and staff physicians, including depression, drug abuse,
loneliness, marriage breakdown and cognitive damage
[Sargent et al., 2004]. But there are no studies regarding
resident physicians’ stress using the demand–control mod-
el and HRV. The purpose of the study was to evaluate the
association of HRV with job strain in first year resident
physicians at a general hospital. The hypothesis of this
study is that a reduction will be observed in the param-
eters of heart rate variability associated with stress in resi-
dent doctors who report high job strain compared to those
who report low job strain.
METHODS
We performed the study at the ‘‘Manuel Gea
Gonzalez’’ General Hospital in Mexico City. A total of 54
resident doctors with the following attributes were includ-
ed: (1) free of diagnosed cardiovascular diseases; (2) not
under treatment with medications that act on the autono-
mous nervous system; and (3) entered their first year of
specialization within various medical specialties in the
month of March in the years 2007 and 2008. The medical
specializations were anesthesiology, general surgery, gyne-
cology and obstetrics, internal medicine, ophthalmology,
otolaryngology, orthodontics, orthopedics, pathology, pedi-
atrics, radiology and imaging, and medical emergencies.
The Research and Ethical Boards of the Manuel Gea
Gonzalez General Hospital and the National Institute of
Public Health approved the study. Each medical resident
signed an informed consent. Between the months of
August 2007 and February 2008, resident physicians were
given two types of questionnaires during their working
hours: the first questionnaire collected data on general
background and personal characteristics, health habits, and
medical history; the second questionnaire was the Job
Content Questionnaire (JCQ) [Karasek, 1985], which
2 Hernandez-Gaytan et al.

assesses psychological job demands (five items) and job
decision latitude (nine items).
Residents responded on a 5-point Likert scale as
follows: strongly agree (5), agree (4), neither agree nor
disagree (3), disagree (2), and strongly disagree (1). We
used the median of the psychological demands scale
and the median of the job decision latitude scale as
the cutoff point to classify these variables as high or low.
The resulting combinations of the two dimensions were:
(a) low strain (low demands–high latitude); (b) passive
(low demands–low latitude); (c) active (high demands–
high latitude); and (d) high strain (high demands–low
latitude).
Holter Monitoring and Heart RateVariability
Heart rate variability was evaluated throughout a
24 hr period. The Holter monitor was a 3 channel recorder
with 7 leads (CSG-HP3VER306 model, Cardiosolutions
Group INC, 1000-North Washington Blvd Sarasota, FL),
with a 200 Hz sampling rate, and 8 bit resolution. Skin
preparation and electrode placement were according to the
international standard [Task Force of the European Society
of Cardiology and The North American Society of Pacing
and Electrophysiology, 1996]. The ECG signal was
recorded from the standard lead configurations (V2, V4,
V5). Only 24 hr reading records were used. The data was
processed with Holter Plus III software version 3.06. Only
those segments without noise were analyzed. All the
ectopic beats were automatically and manually identified
and were excluded from the analysis. A cardiologist certi-
fied by the Mexican Council of Cardiology reviewed
all electrocardiographic records. Each resident wore the
Holter-type recorder during the entire 24-hr shift at
the hospital, including their regular daily work activities.
The residents recorded their own activities throughout
their shift every hour in a logbook. The seven activity
groups were: medical assistance, medical visit, rest (they
were also asked to include the time devoted to sleeping, in
hours and minutes), surgical activities, food ingestion, aca-
demic activities and anesthesiology activities. In this hos-
pital, all resident doctors work an 8-hr daytime shift.
Nevertheless, each third day the resident is asked to fulfill
a 24-hr (on-call) period and carry on with their 8-hr day-
time shift. Upon completion of the second day, the resi-
dent has worked a total of 32 hr, then rests and the next
day comes back to work their normal daytime shift plus
the on-call time. This hospital offers 12 distinct residency
programs. Each medial specialty has its unique academic
program with different times devoted to theoretical and
practical classes, presentations before the specialty group,
medical visits to hospitalized patients, surgical procedures,
and emergency room service. Thus, the work load of
residents in different specialties varies in both timing dur-
ing working hours and in tasks performed.
Frequency domain HRV variables were calculated
through spectral analyses using fast Fourier transforma-
tion. We calculated (a) low frequency (LF, 0.04–0.15 Hz)
is an indicator of sympathetic autonomic response [Task
Force of the European Society of Cardiology and The
North American Society of Pacing and Electrophysiology,
1996]. Yeragani et al. [1993] reported lower LF among
panic disorder patients; (b) High Frequency (HF, 0.15–
0.4 Hz) is an indicator of parasympathetic autonomic
response [Malliani et al., 1991, 1994]. Friedman and
Thayer [1998] found lower HF among patients with
generalized anxiety disorder; and (c) the low-frequency/
high-frequency ratio reflects the global sympatho-vagal
balance [Sztajzel, 2004] and can be used as a measure of
this balance, in the frequency domain over the total
period (24 hr) of the monitoring and for the 24 one-hour
periods. The HRV measurement in the time domain was
calculated by the standard deviation of all the NN inter-
vals (SDNN) for the total period (24 hr) of monitoring
and per 1-hr period. SDNN is a global HRV index that
reflects the long term circadian components and rates of
the variability within the recording period of 24 hr
[Sargent et al., 2004].
Low values of SDNN, HF power represents an
increase of cardiovascular risk and psychological stress
and job strain.
Statistical Analysis
Descriptive statistics summarized the socio-demo-
graphic and physiological features of the resident physi-
cians’ sample. All four dependent variables (a) low-
frequency power; (b) high-frequency power; (c) low-fre-
quency power/high-frequency power ratio; and (d) HRV
(measured with SDNN) were natural log transformed. We
used mixed linear models [Diggle, 1996].
Each measurement was modeled as Yij ¼ Bo þBiTij þ B2Gi þ V0j þ V1iTij þ eij where i represents each
individual 1. . .54 (each physician), j represents each group
1. . .12 (specialty), Yij corresponds to those variables
which depend on the HRV parameters (low-frequency
power, high-frequency power, low-frequency/high-
frequency ratio, SDNN) of each subject, Bo is the
intercept, Tij is the time variable for individual i in time
j, Gi are the fixed explanatory variables in the subject
throughout the study including categories of the demand–
control model (low strain, passive, active, and high strain),
sex, age, body mass index (BMI) with BMI (weight
in kg/height in m2) as a categorical variable where
low BMI < 18.5, normal BMI ¼ 18.5–24.9, overweight
BMI ¼ 25–29.9, and obese BMI > 30 [WHO, 1995], the
waiting time variable is the time in days that each
Job Strain Influences Heart Rate Variability in Residents Physicians 3
physician waited from the start of their specialty training
until the day on which they started their electrocar-
diographic record (Holter)), V0j is the random intercept
(specialty and physicians), V1i are the variables with ran-
dom effects (physicians’ activities and time of day) within
each specialty. The model assumes that random effects
have a normal distribution with a mean ¼ 0 and a con-
stant variability; Bo, Bi, B2 are the adjusted effect
coefficients, V is the random coefficient vector and e is therandom error term which follows the following distribu-
tion: eij � N(0, s i2 þ s d
2) where: si2 ¼ variability be-
tween subjects; sd2 ¼ variability within subjects. Akaike’s
information criteria (AIC) was used to select the model
with best fit [Akaike, 1974]. To determine if the addition
of a random intercept improved model adjustment, the
Maximum Likelihood test was used at a ¼ 0.05. The
quality of the final model adjustment was verified by nor-
mal quantile–quantile plot of residuals. The confounding
effect of the age, sex, and BMI, variables was evaluated.
Associations with a P < 0.05 value in the main effects
were considered, with a confidence interval of 95%. The
Stata statistical package version 9.0 (StataCorp LP, Col-
lege Station, TX) was used.
In addition, we tested for significant association be-
tween job demands and job decision latitude and the four
dependent variables, in linear mixed models. Models V
and VI (see Apendix) present the main effects of decision
latitude and demands each entered as dichotomous varia-
bles split at the median score.
In the Results Section, coefficients and intervals for
categorical variables are shown in percentages for the four
multivariable models, converted using the formula:
(100 � (exp(coefficient)�1))[Halvorsen and Palmquist,
1980; Kennedy, 1981], for natural log dependent variables
whereas continuous variables are naturally read as percent
change.
RESULTS
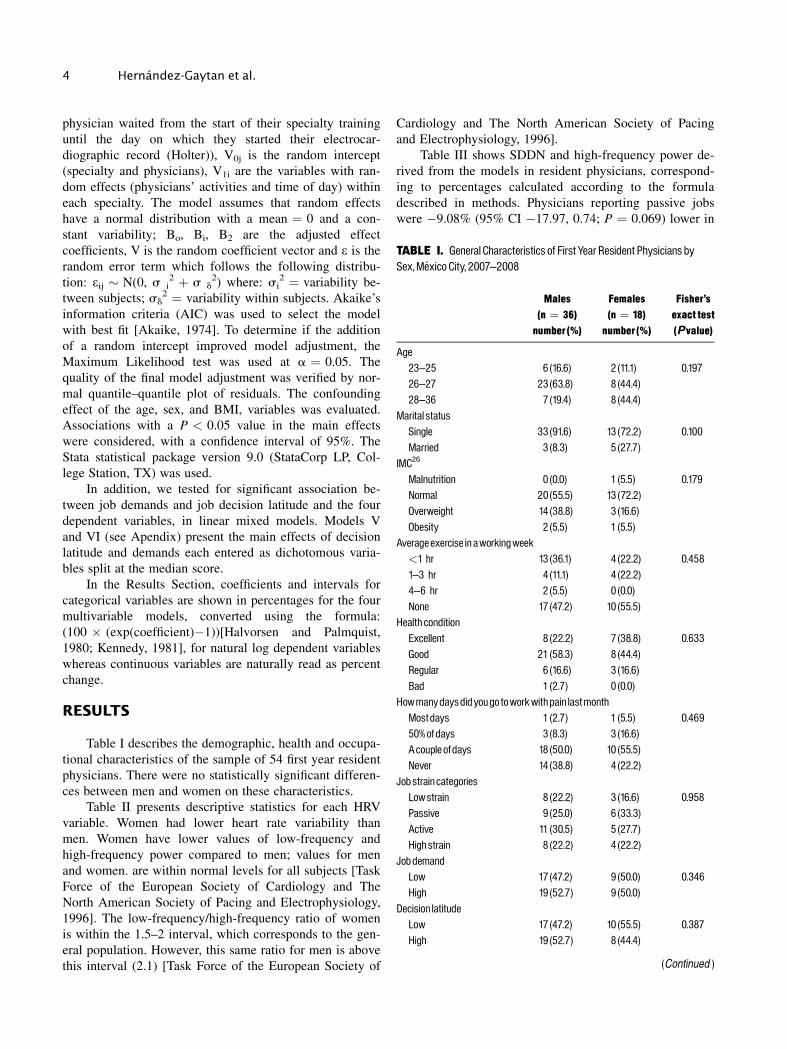
Table I describes the demographic, health and occupa-
tional characteristics of the sample of 54 first year resident
physicians. There were no statistically significant differen-
ces between men and women on these characteristics.
Table II presents descriptive statistics for each HRV
variable. Women had lower heart rate variability than
men. Women have lower values of low-frequency and
high-frequency power compared to men; values for men
and women. are within normal levels for all subjects [Task
Force of the European Society of Cardiology and The
North American Society of Pacing and Electrophysiology,
1996]. The low-frequency/high-frequency ratio of women
is within the 1.5–2 interval, which corresponds to the gen-
eral population. However, this same ratio for men is above
this interval (2.1) [Task Force of the European Society of
Cardiology and The North American Society of Pacing
and Electrophysiology, 1996].
Table III shows SDDN and high-frequency power de-
rived from the models in resident physicians, correspond-
ing to percentages calculated according to the formula
described in methods. Physicians reporting passive jobs
were �9.08% (95% CI �17.97, 0.74; P ¼ 0.069) lower in
TABLE I. General Characteristics of First Year Resident Physicians bySex,Me¤ xico City, 2007^2008
Males(n ¼ 36)number (%)
Females(n ¼ 18)number (%)
Fisher’sexact test(Pvalue)
Age23^25 6 (16.6) 2 (11.1) 0.19726^27 23(63.8) 8 (44.4)28^36 7 (19.4) 8 (44.4)
Marital statusSingle 33(91.6) 13 (72.2) 0.100Married 3 (8.3) 5 (27.7)
IMC26
Malnutrition 0 (0.0) 1 (5.5) 0.179Normal 20(55.5) 13 (72.2)Overweight 14 (38.8) 3 (16.6)Obesity 2 (5.5) 1 (5.5)
Averageexercise in aworkingweek<1 hr 13 (36.1) 4 (22.2) 0.4581 3 hr 4 (11.1) 4 (22.2)4^6 hr 2 (5.5) 0 (0.0)None 17 (47.2) 10 (55.5)
Health conditionExcellent 8 (22.2) 7 (38.8) 0.633Good 21 (58.3) 8 (44.4)Regular 6 (16.6) 3 (16.6)Bad 1 (2.7) 0 (0.0)
Howmanydaysdidyougo toworkwithpain lastmonthMostdays 1 (2.7) 1 (5.5) 0.46950%ofdays 3 (8.3) 3 (16.6)Acouple ofdays 18 (50.0) 10 (55.5)Never 14 (38.8) 4 (22.2)
Jobstrain categoriesLowstrain 8 (22.2) 3 (16.6) 0.958Passive 9 (25.0) 6 (33.3)Active 11 (30.5) 5 (27.7)Highstrain 8 (22.2) 4 (22.2)
JobdemandLow 17 (47.2) 9 (50.0) 0.346High 19 (52.7) 9 (50.0)
Decision latitudeLow 17 (47.2) 10 (55.5) 0.387High 19 (52.7) 8 (44.4)
(Continued )
4 Hernandez-Gaytan et al.

SDNN and �25.75% (95% CI �45.00, 0.22; P ¼ 0.052)
lower in the high-frequency power component (parasym-
pathetic) compared to physicians reporting low job strain.
These differences approached statistical significance. No
significant difference was found for either SDNN or the
high-frequency power component when comparing high
job strain to low job strain physicians.
Table IV shows that physicians reporting passive jobs
were �26.95% (95%CI �39.00, �12.53) lower in low-fre-
quency power compared to those reporting low-strain jobs.
Physicians reporting high job strain was �17.85% (95%CI
�32.34, �0.25) lower in low-frequency power (sympa-
thetic) compared to those reporting low job strain.
The low-frequency/high-frequency ratio was �24.29%
(95%CI �38.08, �7.42) lower in physicians reporting high
job strain than in those reporting low job strains.
When the components of job strain (job demands and
job decision latitude) were examined separately, job
demands were not significantly associated with any HRV
parameter (see Appendix in Supporting Information).
However, job decision latitude was significantly associated
with 25.84% higher low-frequency power (95%CI 9.39,
44.77) and 18.62% higher low-frequency/high-frequency
ratio (95% CI 2.44, 37.34). Thus, the associations we ob-
served between job strain and lower low-frequency power
and lower low-frequency/high-frequency ratio, were due
to the effect of job decision latitude and not job demands.
DISCUSSION
The present study provides evidence of lower heart
rate variability over four of its parameters (standard devia-
tion of all of the NN intervals, high-frequency power, low-
frequency power and the ratio of low-frequency power
over high-frequency power), in residents reporting passive
jobs or high-strain jobs compared to those reporting low-
strain jobs.
Our hypothesis that high-strain jobs would demon-
strated reduced high-frequency power was not confirmed.
However, we found lower high-frequency power in the
TABLE I. (Continued )
Males(n ¼ 36)number (%)
Females(n ¼ 18)number (%)
Fisher’sexact test(Pvalue)
SpecialtiesEmergency care 5 (13.89) 2 (11.11) 0.246Radiology 1 (2.78) 1 (5.56)Pediatrics 3 (8.33) 4 (22.22)Orthopedics 3 (8.33) 0 (0.00)Orthodontics 0 (0.00) 2 (11.11)Ophthalmology 3 (8.33) 1 (5.56)Internalmedicine 4 (11.11) 2 (11.11)Otolaryngology 2 (5.56) 0 (0.00)Pathologic anatomy 1 (2.78) 1 (5.56)Anesthesiology 4 (11.11) 2 (11.11)Gynecologyandobstetrics 3 (8.33) 3 (16.67)General surgery 7 (19.44) 0 (0.00)
TABLE II. Descriptive Statistics of Heart RateVariability in First Year Resident Physicians by Sex,Mexico City, 2007^2008
Na
Men1 (n ¼ 36) Women1 (n ¼ 18)
PvaluebMeanc 95%CIofmean Meanc 95%CIofmean
Heart rate (beats/min) 54 84.3 83.4,85.3 88.8 87.4,90.0 0.127Heart ratevariability (SDNN) (ms)2 54 87.2 84.6,89.8 74.6 71.5,77.6Low-frequencypower (ms)2 54 652.5 621.7,683.2 363.9 340.3,387.5High-frequencypower (ms)2 54 676.0 609.2,742.7 443.4 387.2,499.7Low-frequencypower/high-frequencypower ratio 54 2.1 1.9,2.1 1.5 1.4,1.6
Na Geometricmean 95%CIofgeometricmean Geometricmean 95%CIofgeometricmean Pvalue
Heart ratevariability (ms)2 54 80.1 77.9,82.3 68.9 66.4,71.6 0.046Low-frequencypower (ms)2 54 517.4 493.1,542.9 293.9 275.7,313.2 0.001High-frequencypower 54 322.0 296.5,349.7 242.48 218.2,269.3 0.092Low-frequencypower/high-frequencypower ratio 54 1.6 1.5,1.6 1.2 1.1,1.3 0.018
aN refers to number of subjects; each subject value is themean of 24 consecutive1-hr electrocardiogram samples.bP values are for the difference in meansbetweenmen andwomen.cDistributions of all heart rate variables except ‘‘heart Rate’’ were highly right-skewed; thus,means of these variables and their 95% confidence intervals are not accuratemeasuresof central tendency and uncertainty andP-value of sexdifferences of arithmeticmeans are not shown. Arithmeticmeans are shown only for comparisonswith published literature,where they are frequently used.More accurate measures of central tendency and their uncertainty in this data set are shown for the geometric means and 95% CI.Pvalues of sexdifferences for geometric means are statistically valid.
Job Strain Influences Heart Rate Variability in Residents Physicians 5

group of doctors reporting passive jobs (P ¼ 0.06). Eller’s
study et al. [2010 reported a reduction of high-frequency
power in men (nursery school teachers, teachers, police-
men, engineers, technical personnel and salesmen) with
lack of support (P ¼ 0.05). Vrijkotte et al. [2000] found
high-frequency power to be lower in men exposed to
greater job stress (as measured by the effort-reward imbal-
ance model). However, Van Amelsvoort et al. [2000]
found no association between the high-frequency power
parameter and the categories of the demand–control
model.
Our hypothesis was also not confirmed for variability
of heart rate (SDNN). However, we did observe lower
SDNN among residents reporting passive jobs (P ¼ 0.06).
Kangs study et al. [2004 reported reduction in SDNN
(P ¼ 0.06) in the high-strain group. Collins et al. [2005]
found no association between heart rate variability and
high job strain (P ¼ 0.46). Riese et al. [2004] found no
effect on heart rate variability in job strain by itself or in
interaction with social support. Van Amelsvoort’s study
et al. Van Amelsvoort et al., 2000[2000] found no associa-
tion between heart rate variability and high demands plus
low control (job strain), but reported a reduction in SDNN
(17%, P ¼ 0.05) in the category of high demands and
high control. In addition, Hintsanen et al. [2007] found
that high effort–reward imbalance (ERI) was associated
with low heart rate variability in women, but found no
association in men.
TABLE III. Job strain and Heart RateVariability (SDDNandHigh-Frequency Power),Mixed LinearModel, in Resident Physicians,Mexico City, 2007^2008
Variable
SDNNa,b High-frequencypowera
% 95%CIc Pvalue % 95%CIc Pvalue
Jobstrain categoriesLowstraind
Passive �9.089 �17.97,0.74 0.069 �25.75 �45.00,0.22 0.052Active 0.180 �8.57,9.77 0.968 �10.42 �31.51,17.12 0.421Highstrain �0.240 �10.21,11.94 0.965 �7.70 �21.52,49.60 0.626
SexWomend
Men 11.54 3.66,20.02 0.003 23.13 �0.64,52.63 0.057Age23^25d
26^27 �4.18 �12.72,5.20 0.370 �9.73 �31.41,18.80 0.46528^36 �19.21 �27.48,�10.00 0.001 �48.04 �62.07,�28.82 0.001
IMCe
<18.5d
18.5^24.9 �33.45 �48.94,�13.27 0.003 �80.44 �90.88,�58.02 0.00125^29.9 �29.17 �45.58,�7.82 0.010 �78.92 �90.16,�54.82 0.001>30 �41.69 �56.94,�21.04 0.001 �90.86 �96.18,�78.11 0.001
ActivityRestd
Medical visit �14.73 �24.22,�4.05 0.008 �40.78 �55.32,�21.51 0.001Medical assistance �9.65 �18.65,0.33 0.058 �18.52 �36.20,4.03 0.101Surgical activities �5.67 �17.10,7.31 0.375 �17.56 �39.43,12.19 0.220Food ingestion �15.50 �24.72,�5.16 0.004 �35.05 �50.59,�14.64 0.002Academic activities �2.43 �13.74,10.32 0.694 �10.96 �33.56,19.32 0.437Anesthesiologyactivities �23.63 �38.01,�5.89 0.011 �47.19 �68.00,�12.83 0.013
Waitingperiod (days) 0.03 �0.009,0.09 0.145 6.18 �0.08,0.21 0.146
aN refers to sample size.The target number of1-hr measurements for the 54 resident physicianswas1,296.bSDNNstandard deviation of all theNN intervals.cConfidence intervals at 95%.dReference category.eCategories according toWHO (normal18.5^24.9, overweight 25^29.9, and obese>30 kg/m2).
6 Hernandez-Gaytan et al.
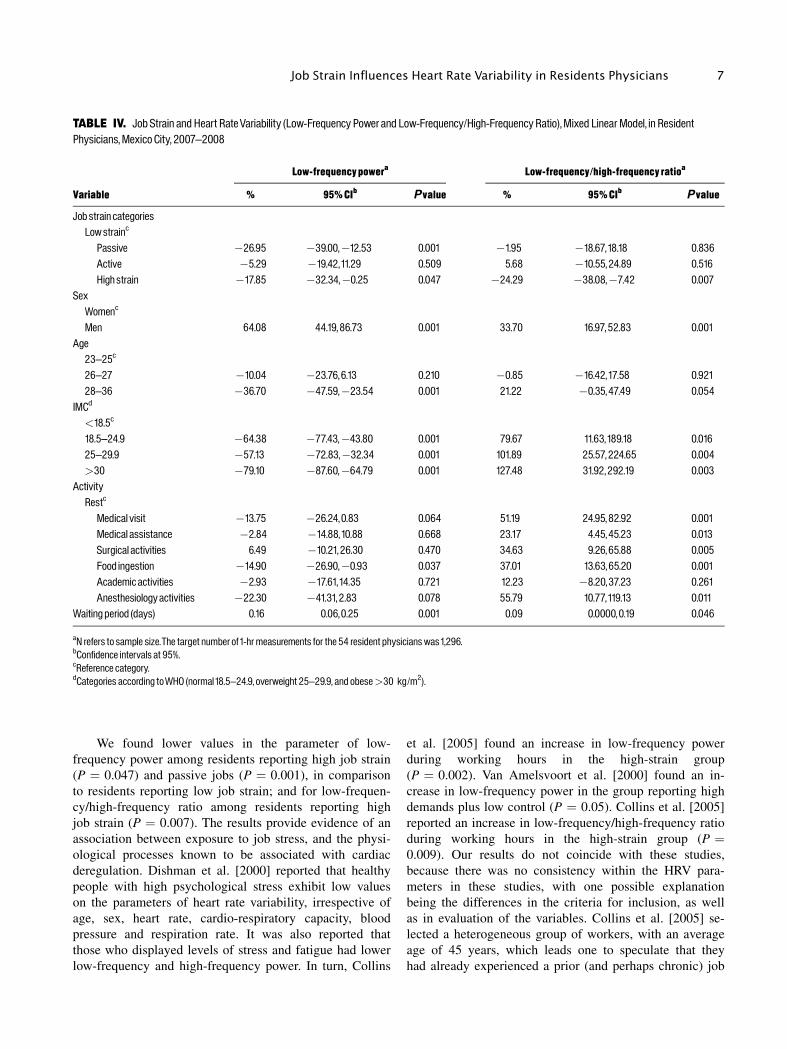
We found lower values in the parameter of low-
frequency power among residents reporting high job strain
(P ¼ 0.047) and passive jobs (P ¼ 0.001), in comparison
to residents reporting low job strain; and for low-frequen-
cy/high-frequency ratio among residents reporting high
job strain (P ¼ 0.007). The results provide evidence of an
association between exposure to job stress, and the physi-
ological processes known to be associated with cardiac
deregulation. Dishman et al. [2000] reported that healthy
people with high psychological stress exhibit low values
on the parameters of heart rate variability, irrespective of
age, sex, heart rate, cardio-respiratory capacity, blood
pressure and respiration rate. It was also reported that
those who displayed levels of stress and fatigue had lower
low-frequency and high-frequency power. In turn, Collins
et al. [2005] found an increase in low-frequency power
during working hours in the high-strain group
(P ¼ 0.002). Van Amelsvoort et al. [2000] found an in-
crease in low-frequency power in the group reporting high
demands plus low control (P ¼ 0.05). Collins et al. [2005]
reported an increase in low-frequency/high-frequency ratio
during working hours in the high-strain group (P ¼0.009). Our results do not coincide with these studies,
because there was no consistency within the HRV para-
meters in these studies, with one possible explanation
being the differences in the criteria for inclusion, as well
as in evaluation of the variables. Collins et al. [2005] se-
lected a heterogeneous group of workers, with an average
age of 45 years, which leads one to speculate that they
had already experienced a prior (and perhaps chronic) job
TABLE IV. Job Strain and Heart RateVariability (Low-Frequency Power and Low-Frequency/High-Frequency Ratio),Mixed LinearModel, in ResidentPhysicians,Mexico City, 2007^2008
Variable
Low-frequencypowera Low-frequency/high-frequency ratioa
% 95%CIb Pvalue % 95%CIb Pvalue
Jobstrain categoriesLowstrainc
Passive �26.95 �39.00,�12.53 0.001 �1.95 �18.67,18.18 0.836Active �5.29 �19.42,11.29 0.509 5.68 �10.55,24.89 0.516Highstrain �17.85 �32.34,�0.25 0.047 �24.29 �38.08,�7.42 0.007
SexWomenc
Men 64.08 44.19,86.73 0.001 33.70 16.97,52.83 0.001Age23^25c
26^27 �10.04 �23.76,6.13 0.210 �0.85 �16.42,17.58 0.92128^36 �36.70 �47.59,�23.54 0.001 21.22 �0.35,47.49 0.054
IMCd
<18.5c
18.5^24.9 �64.38 �77.43,�43.80 0.001 79.67 11.63,189.18 0.01625^29.9 �57.13 �72.83,�32.34 0.001 101.89 25.57,224.65 0.004>30 �79.10 �87.60,�64.79 0.001 127.48 31.92,292.19 0.003
ActivityRestc
Medical visit �13.75 �26.24,0.83 0.064 51.19 24.95,82.92 0.001Medical assistance �2.84 �14.88,10.88 0.668 23.17 4.45,45.23 0.013Surgical activities 6.49 �10.21,26.30 0.470 34.63 9.26,65.88 0.005Food ingestion �14.90 �26.90,�0.93 0.037 37.01 13.63,65.20 0.001Academic activities �2.93 �17.61,14.35 0.721 12.23 �8.20,37.23 0.261Anesthesiology activities �22.30 �41.31,2.83 0.078 55.79 10.77,119.13 0.011
Waitingperiod (days) 0.16 0.06,0.25 0.001 0.09 0.0000,0.19 0.046
aN refers to sample size.The target number of1-hr measurements for the 54 resident physicianswas1,296.bConfidence intervals at 95%.cReference category.dCategories according toWHO (normal18.5^24.9, overweight 25^29.9, and obese>30 kg/m2).
Job Strain Influences Heart Rate Variability in Residents Physicians 7

stressor exposure. Likewise, the subjects were asked to re-
cord their activities in a diary, which permitted tracking
variations in diurnal rhythm. Van Amelsvoort et al. [2000]
selected persons from specific populations who were start-
ing a new job, with the average age of this group being
30 years. Young people have less time on the job, and
thus fewer years of exposure to job stressors.
It is important to note that the first-year residents in
our study work 24 hr straight, and that the following
morning they work an 8-hr shift and then rest but this is
when they carry out their academic tasks and prepare for
exams and class presentations. Previous studies have dem-
onstrated evidence that long working hours modify HRV
parameters [Kageyama et al., 1997]. Since long working
hours may be correlated with job demands, that suggested
an analysis of job demands and HRV.
With respect to the analysis of the parameters of low-
frequency power and high-frequency power by sex, we
found lower values in comparison to the values in the gen-
eral population [Task Force of the European Society of
Cardiology and The North American Society of Pacing
and Electrophysiology, 1996]. We also found that men
have higher low-frequency/high-frequency ratio in com-
parison with the value for the population at large. These
results demonstrate that there is a difference by sex with
respect to heart rate variability, and to its low-frequency
power, high-frequency power and low-frequency/high-
frequency ratio components. We stratified the multi-level
analysis by sex for each of the four parameters, and found
significantly different associations by sex in the categories
of the demand–control model, but these findings are not
presented in this article due to the small sample size and
uneven distribution of the sample by sex. An analysis by
sex should be replicated in a larger and more evenly bal-
anced sample. This analysis should be replicated in a larg-
er and more homogeneous sample. It is known that there
are other factors—like sex [Pomeranz et al., 1985; OBrien
et al., 1986; Umetani et al., 1998], age [Stein et al., 1997;
Ramaekers et al., 1998], BMI [WHO, 1995], exercise [De
Meersman, 1993], circadian cycle [Furlan et al., 2000],
and atmospheric pollution [Schneider et al., 2010], which
may modify the HRV and ought to be controlled for in
study design or analysis. In our study, we adjusted for sex,
age, and BMI. We also recorded use of medications that
may have altered the HRV, but this was not included in
the final analysis because it was not statistically significant
in preliminary analyses.
Limitations of the Study
The small sample size of 54 medical residents, and
the imbalance between men (36) and women (18), made it
difficult to use interactive models and reduced the
statistical power of the stratified models. There was also a
disproportional distribution of medical residents by spe-
cialties certain specialialties like radiology, orthodontics
and pathological anatomy had two members each in the
sample, while other specialties had as many as seven, such
as emergency care and general surgery. We evaluated
only heart rate variability and its parameters over the
working day (8 hr) plus the on-call time (16 hr), for a
total of 24 hr. It would have been useful to evaluate the
working day by itself, in order to be able to make compar-
isons. In addition, no questions were included regarding
exhaustion. The study began after 3 months of the aca-
demic cycle for the medical residents, and bio-markers of
stress (such as cortisol levels) were not available. The
questionnaires were administered 3 months following
the beginning of the residency, which suggests that the
doctors had already adapted to the various activities, job
demands, and decision-making. This last factor was
tracked through a waiting-time variable (which is the
time, in days, that each doctor waits, from their entry into
the specialty, up to the day on which their Holter electro-
cardiographic recording began). The strengths of this
study are the repetition of observations for each doctor,
and the extensive tracking for each of the doctors, through
a log where they wrote down each one of the activities
that they carried out.
CONCLUSIONS
Medical residents in their first academic year report-
ing low demand–low control (passive) and high demand–
low control (high strain) jobs had some lower parameters
of heart rate variability, as compared with their colleagues
reporting low demand–high control (low strain) jobs,
over a 24-working hour period. These results suggest that
medical residents work in stressful conditions that may
increase their risk of heart disease, and it is important to
note that they still have three more years ahead of them
before they complete their specialty.
Twenty-four-hour cardiac monitoring is an informa-
tive marker for evaluation of the impact of work stressor
and alteration in the equilibrium of the autonomic nervous
system due workplace factors. Additional research is need-
ed concerning the response of heart rate variability to
acute or chronic stressors, given that the pathophysiologi-
cal mechanisms are not yet clear.
ACKNOWLEDGMENTS
This study was financed by Irving J. Selikoff Interna-
tional Scholar of the Mount Sinai School of Medicine.
The project described was supported in part by Award
8 Hernandez-Gaytan et al.
Number D43TW000640 from the Fogarty International
Center ITREOH program. The Content is solely the re-
sponsibility of the authors and does not necessarily repre-
sent the official views of the Fogarty International Center
or the National Institutes of Health. Likewise, a great
gratitude to Dr. Moises Selman, Research Director of the
National Institute of Respiratory Diseases Ismael Cosio
Villegas because with his valuable management the reali-
zation of this project was possible. Thanks to our transla-
tor Ken Hansen.
APPENDIX
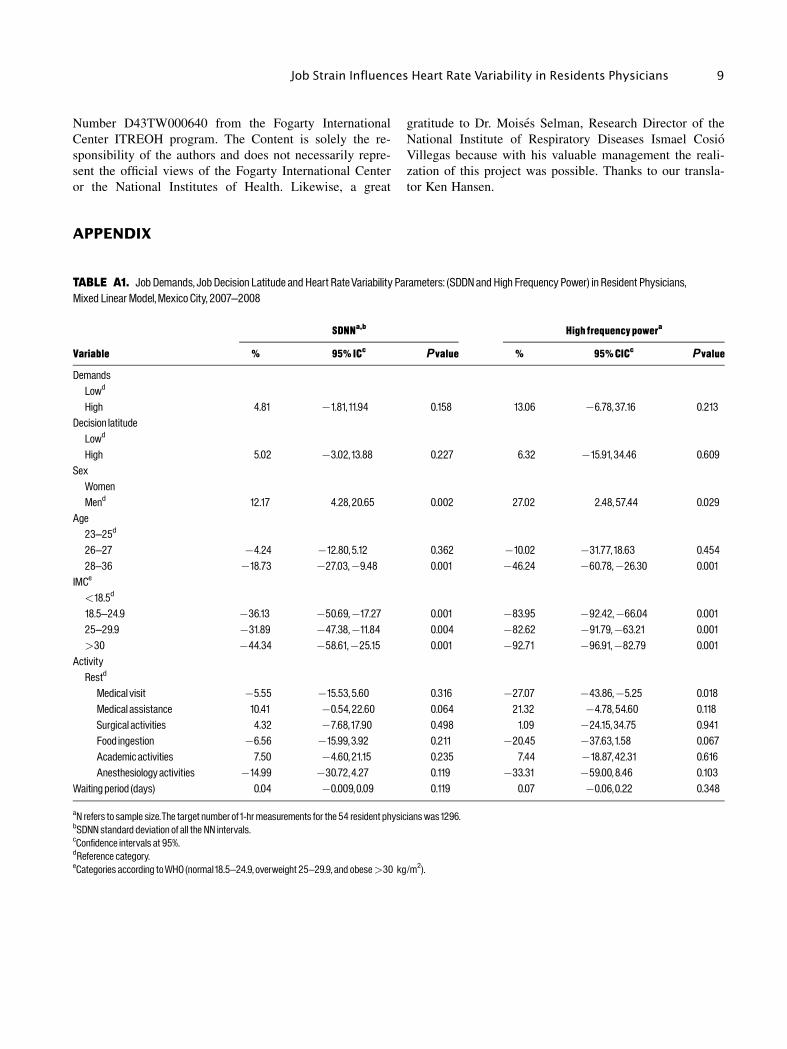
TABLE A1. Job Demands, JobDecision Latitude and Heart RateVariability Parameters: (SDDNandHigh Frequency Power) in Resident Physicians,Mixed LinearModel,Mexico City, 2007^2008
Variable
SDNNa,b Highfrequencypowera
% 95%ICc Pvalue % 95%CICc Pvalue
DemandsLowd
High 4.81 �1.81,11.94 0.158 13.06 �6.78,37.16 0.213Decision latitudeLowd
High 5.02 �3.02,13.88 0.227 6.32 �15.91,34.46 0.609SexWomenMend 12.17 4.28,20.65 0.002 27.02 2.48,57.44 0.029
Age23^25d
26^27 �4.24 �12.80,5.12 0.362 �10.02 �31.77,18.63 0.45428^36 �18.73 �27.03,�9.48 0.001 �46.24 �60.78,�26.30 0.001
IMCe
<18.5d
18.5^24.9 �36.13 �50.69,�17.27 0.001 �83.95 �92.42,�66.04 0.00125^29.9 �31.89 �47.38,�11.84 0.004 �82.62 �91.79,�63.21 0.001>30 �44.34 �58.61,�25.15 0.001 �92.71 �96.91,�82.79 0.001
ActivityRestd
Medical visit �5.55 �15.53,5.60 0.316 �27.07 �43.86,�5.25 0.018Medical assistance 10.41 �0.54,22.60 0.064 21.32 �4.78,54.60 0.118Surgical activities 4.32 �7.68,17.90 0.498 1.09 �24.15,34.75 0.941Food ingestion �6.56 �15.99,3.92 0.211 �20.45 �37.63,1.58 0.067Academic activities 7.50 �4.60,21.15 0.235 7.44 �18.87,42.31 0.616Anesthesiology activities �14.99 �30.72,4.27 0.119 �33.31 �59.00,8.46 0.103
Waitingperiod (days) 0.04 �0.009,0.09 0.119 0.07 �0.06,0.22 0.348
aN refers to sample size.The target number of1-hr measurements for the 54 resident physicianswas1296.bSDNNstandard deviation of all the NN intervals.cConfidence intervals at 95%.dReference category.eCategories according toWHO (normal18.5^24.9, overweight 25^29.9, and obese>30 kg/m2).
Job Strain Influences Heart Rate Variability in Residents Physicians 9
REFERENCES
Akaike H. 1974. A new look at the statistical model identification.IEEE Trans Automat Control AC-19:716–723.
Belkic KL, Landesbergis PA, Schanall P, Baker D. 2004. Is job straina major source of cardiovascular disease risk? Scand J Work EnvironHealth 30(2):85–128.
Butterfield PS. 1998. The stress of residency. A review of the litera-ture. Arch Intern Med 148(6):1428–1435.
Collins S, Karasek R, Costas K. 2005. Job strain and autonomic indi-ces of cardiovascular disease risk. Am J Ind Med 48:182–193.
De Meersman RE. 1993. Heart rate variability and aerobic fitness.Am Heart J 125:726.
Dekker JM, Shouten EG, Klootwijk P, Pool J, Swemme CA,Kromhout D. 1997. Heart rate variability from short electo-cardio-graphic recordings predicts mortality from all causes in middle-agedand elderly men. The Zuptphen Study. Am J Epidemiol 145:899–908.
Diggle PJ, Liang KY, Zeger SL. 1996. Analysis of longitudinal data.Oxford, UK: Claredon Press. p 126–129.
Dishman RK, Nakamura Y, Garcia ME, Thompson RW, Dunn AL,Blair SN. 2000. Heart rate variability, trait anxiety, and perceivedstress among physically fit men and women. Int J Psychophysiol37(2):121–133.
Eller NH, Kristiansen J, Hansen AM. 2010. Long-term effects ofphychosocial factors of home and work on biomarkers of stress. Int JPsychophysiol 79(2):195–202.
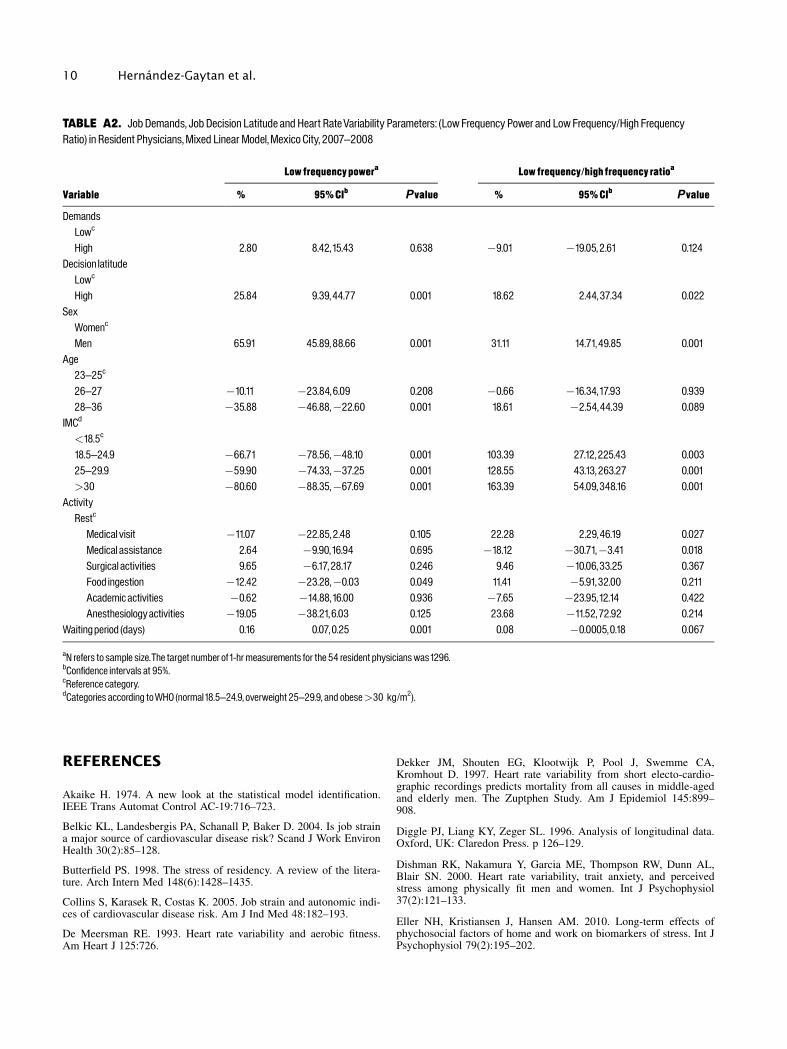
TABLE A2. JobDemands, Job Decision Latitude andHeart RateVariability Parameters: (LowFrequency Power and LowFrequency/High FrequencyRatio) in Resident Physicians,Mixed Linear Model,Mexico City, 2007^2008
Variable
Low frequencypowera Low frequency/highfrequency ratioa
% 95%CIb Pvalue % 95%CIb Pvalue
DemandsLowc
High 2.80 8.42,15.43 0.638 �9.01 �19.05,2.61 0.124Decision latitudeLowc
High 25.84 9.39,44.77 0.001 18.62 2.44,37.34 0.022SexWomenc
Men 65.91 45.89,88.66 0.001 31.11 14.71,49.85 0.001Age23^25c
26^27 �10.11 �23.84,6.09 0.208 �0.66 �16.34,17.93 0.93928^36 �35.88 �46.88,�22.60 0.001 18.61 �2.54,44.39 0.089
IMCd
<18.5c
18.5^24.9 �66.71 �78.56,�48.10 0.001 103.39 27.12,225.43 0.00325^29.9 �59.90 �74.33,�37.25 0.001 128.55 43.13,263.27 0.001>30 �80.60 �88.35,�67.69 0.001 163.39 54.09,348.16 0.001
ActivityRestc
Medical visit �11.07 �22.85,2.48 0.105 22.28 2.29,46.19 0.027Medical assistance 2.64 �9.90,16.94 0.695 �18.12 �30.71,�3.41 0.018Surgical activities 9.65 �6.17,28.17 0.246 9.46 �10.06,33.25 0.367Food ingestion �12.42 �23.28,�0.03 0.049 11.41 �5.91,32.00 0.211Academic activities �0.62 �14.88,16.00 0.936 �7.65 �23.95,12.14 0.422Anesthesiologyactivities �19.05 �38.21,6.03 0.125 23.68 �11.52,72.92 0.214
Waitingperiod (days) 0.16 0.07,0.25 0.001 0.08 �0.0005,0.18 0.067
aN refers to sample size.The target number of1-hr measurements for the 54 resident physicianswas1296.bConfidence intervals at 95%.cReference category.dCategories according toWHO (normal18.5^24.9, overweight 25^29.9, and obese>30 kg/m2).
10 Hernandez-Gaytan et al.

Friedman BH, Thayer JF. 1998. Autonomic balance revisited: Panicanxiety and heart rate variability. J Psychosom Res 44:133–151.
Furlan R, Barbic F, Piazza S, Tinelli M, Seghizzi Malliani A. 2000.Modifications of cardiac aunotomic profile associated with a shiftschedule of work. Circulation 102(16):1912–1916.
Halvorsen R, Palmquist R. 1980. The interpretation of dummy varia-bles in semilogarithmic equations. Am Econ Rev 70(3):474–475.
Hintsanen M, Elovaino M, Puttonen S, Kivimaki M, Koskinen T,Raitakari OT, Keltikangas-Jarvinen L. 2007. Effort–reward imbal-ance, heart rate and heart rate variability: The Cardiovascular Risk inYoung Finns Study. Int J Behav 14(4):202–212.
Kageyama T, Nishikido N, Honda Y, Kurokawa Y, Imai H, Kobaya-shi T, Kaneko T, Kabuto M. 1997. Effects of obesity, current smok-ing status, and alcohol consumption on heart rate variability in malewhite-collar workers. Int Arch Occup Environ Health 69:447–454.
Kang M, Koh S, Cha B, Park J. 2004. Association between Job stresson heart rate variability and Metabolic Syndrome in Shipyard maleworkers. Yonsei Med 45(5):838–846.
Karasek RA. 1985. Job content instrument: Questionnaire and usersguide. Los Angeles: University of South California.
Karasek RA, Theorell T. 1990. Healthy work: Stress, productivity,and the reconstruction of working life. New York, NY: Basic Books.
Karasek RA, Theorell T. 2000. The demand–control–support modeland CVD. In: Schnall PL, Belkic K, Landesbergis P, guest editors.The workplace and cardiovascular disease. Philadelphia, PA: Hanley& Belfus, Inc., p 78–83.
Karasek R, Brisson C, Amick B. 1998. The Job Content Question-naire (JCQ): An instument for internationally comparative assess-ments of psychosocial job characteristics. J Occup Health Psych3(4):322–355.
Kennedy P. 1981. Estimation with correctly interpreted dummy vari-ables in semilogarithmic equations. Am Econ Rev 71(4):801.
Kristal-Boneh E, Raifal M, Froom P, Ribak J. 1995. Hear rate vari-ability in health and disease. Scand J Work Environ Health 21:85–95.
Lombardi F, Makikallio T, Myerburg R, Huikuri H. 2001. Suddencardiac death:role of heart rate variability to identify patients at risk.Cardiovasc Res 50:210–217.
Malliani A, Pagani M, Lombardi F, Cerutti S. 1991. Cardiovascularneural regulation explored in the frequency domain. Circulation84:428–492.
Malliani A, Lombardi F, Pagani M. 1994. Power spectrum analysisof heart rate variability: A tool to explore neural regulatory mecha-nisms. Br Heart J 71:1–2.
Michie S, Sandhu S. 1994. Stress management for clinical medicalstudents. Med Edu 28:528–533.
OBrien IA, OHare P, Corral RJ. 1986. Heart rate variability inhealthy subject: Effects of age and the derivation of normal rangesfor tests of autonomic function. Br Heart J 55:348–354.
Perry M, Osborne W. 2003. Health and wellness in residents whomatriculate into physician training programs. Am J Obstet Gynecol7:670–683.
Pomeranz B, Macualay RJ, Caudill MA, Kutz I, Adam D, GordonD, Kilborn KM, Barger AC. 1985. Assessment of autonomic func-tion in humans by heart rate spectral analysis. Am J Physiol 248:H151–H153.
Ramaekers D, Ector H, Aubert AE, Ruben A, Van de Werf F.1998. Heart rate variability and heart rate in healthy volunteers. Isthe female autonomic nervous system cardioprotective? Eur Heart J19:1334–1341.
Riese H, Van Doornen LJ, Houtman IL, De Geus E. 2004. Job strainin relation to ambulatory blood pressure, heart rate, and heart ratevariability among female nurses. Scand J Work Environ Health30(6):477–485.
Sargent C, Sotile W, Sotile MO, Rubash H, Barrack R. 2004. Stressand coping among orthopaedic surgery residents and faculty. J BoneJoint Surg 86(7):1579–1586.
Schnall PL, Landesbergis PA, Baker D. 1994. Job strain and cardio-vascular disease. Ann Rev Public Health 15:381–411.
Schneider A, Hampel R, Ibald-Mulli A, Zareba W, Schmidt G,Schneider R, Ruckerl R, Couderc JP, Mykins B, Oberorster G, WolkeG, Pitz M, Wichmann HE. 2010. Changes in deceleration capacity ofheart rate and heart rate variability induced by ambient air pollutionin individuals with coronary artery disease. Part Fibre Toxicol 7:29.
Stein PK, Kleiger RE. 1999. Insights from the study of heart ratevariability. Annu Rev Med 50:249–261.
Stein PK, Kleiger RE, Rottman JN. 1997. Differing effects of age onheart rate variability. Am J Cardiology 80:302–305.
Sztajzel J. 2004. Heart rate variability: A noninvasive electrocar-diographic method to measure the autonomic nervous system. SwissMed Wkly 134:514–522.
Task Force of the European Society of Cardiology and the NorthAmerican Society of Pacing and Electrophysiology. 1996. Heart ratevariability: Standards of measurement, physiological interpretation,and clinical use. Circulation 93:1043–1065.
Togo F, Takahashi M. 2009. Heart rate variability in occupationalhealth: A systematic review. Ind Health 47:589–602.
Tsuji H, Venditti FJJ, Manders ES, Evans JC, Larson MG, FeldmanCL, Levy D. 1994. Reduced heart rate variability and mortality riskin an elderly cohort. The Framingham Heart Study. Circulation 90:878–883.
Tsuji H, Larson MG, Venditti FJJ, Manders ES, Evans JC, FeldmanCL, Levy D. 1996. Impact of reduced heart rate variability on riskfor cardiac events. The Framingham Heart Study. Circulation 94:2850–2855.
Umetani K, Singer DH, McCraty R. 1998. Twenty four hour timedomain heart rate variability and heart rate: Relations to age andgender over nine decades, JACC 31:593–601.
Van Amelsvoort LGPM, Schouten EG, Maan AC, Swenne CA,Kok FJ. 2000. Occupational determinants of heart rate variability, IntArch Occup Environ Health 73:255–262.
Van der Doef M, Maes S. 1999. The job demand–control(–support)model and phychological well-being: A review of 20 years of empir-ical research. Work Stress 13:87–114.
Vrijkotte TG, Van Doornen LJ, de Geus EJ. 2000. Effects of workstress on ambulatory blood pressure, heart rate, and heart rate vari-ability. Hypertension 35(4):880–886.
WHO. 1995. Physical status: The use and interpretation of anthro-pometry. Geneva: World Health Organization.
Yeragani VK, Pohl R, Berger R, Balon R, Ramesh C, Glitz D,Srinivasan K, Weinberg P. 1993. Decreased heart rate variability inpanic disorder patients: A study of power-spectral analysis of heartrate. Psychiatry Res 46:89–103.
Job Strain Influences Heart Rate Variability in Residents Physicians 11