lateral variability in strain along a mass-transport
TRANSCRIPT

This is a repository copy of Lateral variability in strain along a mass-transport deposit (MTD) toewall: a case study from the Makassar Strait, offshore Indonesia.
White Rose Research Online URL for this paper:https://eprints.whiterose.ac.uk/163309/
Version: Accepted Version
Article:
Nugraha, HD, Jackson, CA-L, Johnson, HD et al. (1 more author) (2020) Lateral variability in strain along a mass-transport deposit (MTD) toewall: a case study from the Makassar Strait, offshore Indonesia. Journal of the Geological Society. jgs2020-071. ISSN 0016-7649
https://doi.org/10.1144/jgs2020-071
© 2020 The Author(s). Published by The Geological Society of London. All rights reserved. This is an author produced version of an article published in Journal of the Geological Society. Uploaded in accordance with the publisher's self-archiving policy.
[email protected]://eprints.whiterose.ac.uk/
Reuse
Items deposited in White Rose Research Online are protected by copyright, with all rights reserved unless indicated otherwise. They may be downloaded and/or printed for private study, or other acts as permitted by national copyright laws. The publisher or other rights holders may allow further reproduction and re-use of the full text version. This is indicated by the licence information on the White Rose Research Online record for the item.
Takedown
If you consider content in White Rose Research Online to be in breach of UK law, please notify us by emailing [email protected] including the URL of the record and the reason for the withdrawal request.

Lateral variability in strain along a mass-transport deposit (MTD) toewall: a 1
case study from the Makassar Strait, offshore Indonesia 2
Harya D. Nugraha1,2*, Christopher A-L. Jackson1, Howard D. Johnson1, and David M. Hodgson3 3
1Basins Research Group (BRG), Department of Earth Science and Engineering, Imperial College, 4
London SW7 2BP, UK 5
2Department of Geological Engineering, Universitas Pertamina, Jakarta 12220, Indonesia 6
3Stratigraphy Group, School of Earth and Environment, University of Leeds, Leeds LS2 9JT, UK 7
*Corresponding author (email: [email protected]) 8
Abstract: Contractional features characterise the toe domain of mass-transport deposits (MTDs). 9
Their frontal geometry is typically classified as frontally-confined or frontally-emergent. However, it 10
remains unclear how frontal emplacement style and contractional strain within an MTD can vary along 11
strike. We use bathymetry and 3D seismic reflection data to investigate lateral variability of frontal 12
emplacement and strain within the toe domain of the Haya Slide in the Makassar Strait. The slide 13
originated from an anticline flank collapse, and the toe domain is characterised by a radial fold-and-14
thrust belt that reflects southwestwards emplacement. The frontal geometry of the slide changes 15
laterally. In the S, it is frontally-confined, associated with a deep, c. 200 mbsf, and planar basal shear 16
surface. The frontal geometry gradually changes to frontally-emergent in the W, associated with a 17
shallow, c. 120 mbsf, and NE-dipping, c. 3o, basal shear surface. Strain analysis shows c. 8-14% 18
shortening, with cumulative throw of the thrusts that increases along strike westwards from c. 20-40 19
to c. 40-80 m. We show that even minor horizontal translation of MTDs (c. 1 km) can result in marked 20
lateral variability in frontal geometry and strain within the failed body, which may influence their seal 21
potential in petroleum systems. 22

Mass-transport deposits (MTDs) are the deposits of creep, slide, slump, and debris flow processes (e.g. 23
Dott 1963; Nardin et al. 1979; Nemec 1991; Moscardelli & Wood 2008; Posamentier & Martinsen 24
2011; Ogata et al. 2012). MTD emplacement can cause major geohazards for offshore infrastructures 25
and coastal communities (e.g. Tappin et al. 2001; Vanneste et al. 2013; Takagi et al. 2019) and can be 26
an important component of a functional petroleum system (e.g. Weimer & Shipp 2004). For example, 27
MTDs can provide seals for hydrocarbon accumulations (Algar et al. 2011; Omeru 2014; Cardona et al. 28
2016) and, less commonly, may act as reservoirs (Sawyer et al. 2007; Shanmugam 2012; Arfai et al. 29
2016). In particular, their seal potential depends on a combination of the lithology, external geometry 30
and internal structural heterogeneity of the emplaced mass, which are all influenced by emplacement 31
processes (e.g. Alves et al. 2014). Thus, it is important to understand their transport processes to 32
assess their seal potential in a petroleum system. 33
The nature of the failed mass in the vicinity of the toewall defines two frontal geometrical types (Frey-34
Martínez et al. 2006): (i) frontally-confined types characterised by a toewall that prevents a failed mass 35
from further downdip translation, and (ii) frontally-emergent types reflecting a failed mass that 36
extends above and beyond the toewall to translate further downdip onto the adjacent seabed. In 37
some cases, both styles can develop within a single mass-transport event (Moernaut & De Batist 2011; 38
Armandita et al. 2015; Clare et al. 2018). The seismic expression of both frontal termination types are 39
well-known (Trincardi & Argnani 1990; Huvenne et al. 2002; Lastras et al. 2004; Joanne et al. 2013), 40
but the processes occurring in the toe domain remain poorly constrained (e.g. evolution of the basal 41
shear surface prior to termination at the toewall). Outcrop studies have provided detailed insights on 42
processes in the toe domain, but a full 3D analysis is hindered by limited exposure extent (Martinsen 43
& Bakken 1990; Van Der Merwe et al. 2011; Ogata et al. 2012; Sobiesiak et al. 2016; Cardona et al. 44
2020). Furthermore, very few studies have attempted to balance extensional and contractional strains 45
across the entire body of an MTD (e.g. Bull & Cartwright 2019; Steventon et al. 2019). Likewise, the 46
way in which strain varies along-strike within an MTD remains poorly understood. 47

Here, we use high-resolution multibeam bathymetry and high-quality 3D seismic reflection data to 48
study the Haya Slide (hereafter the ‘slide’), in the Makassar Strait, offshore western Sulawesi 49
(Indonesia). This dataset demonstrates how frontal toewall style can change laterally during 50
emplacement of a single mass-transport event. The bathymetry data capture the seabed expression 51
of both the headwall and toe domains of this slide, while the 3D seismic reflection data only image 52
the toe domain, which is the focus of this study (Fig. 1). The seismic image quality and use of seismic 53
attributes enable us to characterise intra-MTD strain in great detail. Our specific aims are to: (i) 54
evaluate kinematic indicators and reconstruct transport processes of the slide, (ii) assess lateral 55
variability of the slide's frontal geometry and infer its controlling factors, (iii) quantitatively examine 56
along-strike changes of intra-MTD strain, and (iv) discuss how lateral variations in strain may induce 57
lateral variability of seal potential of MTDs. 58
GEOLOGICAL SETTING 59
The Makassar Strait is situated within a seismically active area, where four major plates interact (the 60
Eurasia, Indo-Australia, Philippine Sea, and Pacific plates; Fig. 1a) (Daly et al. 1991). The strait separates 61
the islands of Sulawesi and Borneo, and is divided into the North and South Makassar basins (Fig. 1b). 62
A strong southwards-flowing contour current, the Indonesia Throughflow (ITF), presently carries water 63
masses through the strait at a relatively high velocity (i.e. 1 m/s, see Fig. 1a; Mayer & Damm 2012), 64
from the Pacific Ocean to the Indian Ocean. Brackenridge et al. (2020) suggest that the ITF 65
preconditions the slopes bounding the Makassar Strait to fail, whereas earthquakes in this seismic-66
prone region may act as a trigger mechanism. More specifically, the ITF transports a high suspended 67
sediment load southward from the Mahakam Delta, causing relatively rapid deposition and steepening 68
of the continental slope along the western margin of the strait, which results in (i) slope 69
oversteepening, and (ii) high pore-fluid pressures (Brackenridge et al. 2020). Such preconditioning 70
factors for slope failure are consistent with the unusually large number of near-seabed MTDs 71
(Pleistocene to Recent), which range in size from 5 to >600 km3 (Brackenridge et al. 2020). 72

The water depth along the strait is 200-2000 m (Guntoro 1999), with (i) a relatively broad shelf area 73
along the western margin (including the actively prograding Mahakam Delta; e.g. Allen & Chambers 74
1998; Roberts & Sydow 2003), and (ii) a narrower and steeper shelf along the eastern margin, which 75
is more tectonically active and bounded by three fold-thrust belts, namely the Northern (NSP), Central 76
(CSP) and Southern (SSP) structural provinces (see Fig. 1b; Puspita et al. 2005). These two marginal 77
areas are the sources of the MTDs transported into the basins (Fig. 1c). The two basins are connected 78
by the deep (c. 2000 m) and narrow (c. 45 km-wide) Labani Channel, and are cut by major structural 79
features, such as the Palu-Koro and Paternoster transform fault zones (Cloke et al. 1999) (Fig. 1b). We 80
here focus on the Haya Slide (Fig. 1d); this is located c. 10 km off the coast of Sulawesi, at the southern 81
end of the Labani Channel, close to the southern margin of the SSP (Fig. 1b). The slide is a shallowly 82
buried MTD with only a thin (<8 m) cover of modern sediment and a clear present-day seabed 83
expression. 84
DATA SET AND METHODOLOGY 85
Data set 86
The study is based primarily on bathymetry, 3D seismic reflection and well data (Fig. 1b and d). TGS 87
provided the multibeam echosounder bathymetry data (TGS_Pat survey), which covers an area of c. 88
20,000 km2. Lateral resolution of these data is 25 x 25 m and geomorphic features are enhanced by a 89
shaded relief map with 0o azimuth and 45o angle. Core descriptions of near-seabed sediments (c. 3-7 90
mbsf) are also available (i.e. TGS009 and TGS194, see Fig. 1b). Although none of these cores directly 91
sample the Haya Slide, they enable the likely lithology of the slide to be inferred. 92
The post-stack time-migrated (PSTM) 3D seismic reflection and exploration well data (see Fig. 1b) are 93
provided by the Information and Data Centre, Ministry of Energy and Mineral Resources (PUSDATIN 94
ESDM), Indonesia. The seismic reflection data cover an area of 1598 km2, with a bin spacing of 25 m x 95
12.5 m (inline x crossline) and a dominant frequency of 50 Hz at the base of the Haya Slide (c. 200 96
mbsf). We estimate that the spatial resolution of the seismic data, given an average velocity of the 97
sedimentary package of interest derived from the wells (1495 m/s), is c. 7 m. The average velocity of 98

the near-seabed sediments is relatively low, likely due to the high water content. Similar values are 99
obtained for near-seabed, deep-water sediments penetrated in the South Makassar MTC area, which 100
is located c. 135 km to the SW of our study area (see Fig. 1b; Armandita et al. 2015). The 3D seismic 101
data are zero-phase with SEG normal polarity with an increase in acoustic impedance expressed as a 102
positive amplitude. 103
The two wells (XR-1 and XS-1) do not penetrate the Haya Slide, and there are no drill cuttings data 104
available, even within the general stratigraphic interval containing the slide. However, the correlation 105
of the basal shear surface to the XR-1 and XS-1 wells (see ‘detachment level’ in Fig. 1d) enables the 106
velocity of the sedimentary package containing the slide to be inferred. Using these data allows the 107
conversion of measured vertical distances from time (ms TWT) to depth (m). 108
The bathymetry data allow delineation of the external geometry of the slide (Fig. 2). These data also 109
allow the headwall and a lateral margin (Eastern Lateral Margin, Fig. 2) of the slide to be determined 110
(not covered by the 3D seismic reflection data). 111
Seismic interpretation 112
The 3D seismic reflection data cover most of the toe domain of the slide (Figs. 2 and 3). Mapping of 113
the seabed and basal shear surface of the slide enables us to constrain the structural style of its toe 114
domain and infer the emplacement processes of the slide. Two seismic attributes were used to 115
visualise the range of intra-MTD structures. First, variance was used to enhance discontinuities such 116
as imbricated thrusts (e.g. Chopra & Marfurt 2007). Second, spectral decomposition (RGB blending) 117
was conducted to highlight heterogeneities of internal body of the slide, by blending three bins of 118
frequency volume with assigned colours (i.e. red, green and blue represent low, mid and high 119
frequencies, respectively) (e.g. Partyka et al. 1999; Eckersley et al. 2018). We extracted these 120
attributes along an isoproportional slice, i.e. proportionally located halfway between the seabed and 121
the basal shear surface (see Zeng et al. 1998), and horizontal time-slices, thereby generating map-view 122
images of seismic facies and structural variability (e.g. Fig. 3b). 123

Strain analysis 124
Shortening calculation 125
We calculate shortening and investigate longitudinal strain distribution within the toe domain of the 126
Haya Slide by using the well-established line-length method (Dahlstrom 1969; Totake et al. 2018; Bull 127
& Cartwright 2019; Steventon et al. 2019). We selected a representative depth-converted seismic 128
section that is parallel to the dominant transport direction of the slide (Figs. 3b and 4a). This was 129
determined based on the analysis of kinematic indicators, including the trend of the lateral margin 130
and fold-and-thrust belt (e.g. Bull et al. 2009). Shortening values (𝑒) of faulted and folded pre-131
kinematic strata are estimated by comparing the present length (𝐿 ) with the cumulative length of the 132
faulted and folded pre-kinematic horizon (𝐿 ) (Eq. 1). 133
𝑒 = (𝐿 − 𝐿 ) 𝐿⁄ (1) 134
However, the estimated shortening values from this line-length method provides only a minimum 135
value, since it does not account for shortening within pop-up blocks due to sub-seismic strain, and 136
lateral compaction accommodated by porosity loss via dewatering and/or grain crushing (Moore et al. 137
2011; Armandita et al. 2015; Alsop et al. 2019; Steventon et al. 2019). 138
Along-strike strain analysis 139
As contractional features (e.g. thrusts, and thrust-bound pop-up blocks) in the toe domain of the slide 140
are highly segmented along-strike, we focus on a contractional feature where a pre-kinematic horizon 141
can be interpreted over the longest along-strike distance. We measured throw along the strike of 142
internal and bounding thrust faults of the contractional pop-up blocks at intervals of 20-200 m. As 143
most of the thrust faults dip steeply (40o-60o), we quantify fault displacement by measuring throw 144
rather than heave. This is because the heave of steeply-dipping thrusts diminishes with increasing dip 145
(Totake et al. 2018). We then plot throw against along-strike distance. 146

RESULTS AND INTERPRETATION 147
General characteristics of the Haya Slide 148
External geometry and lithological composition 149
The Haya Slide is c. 16 km long, extending southwestwards from the lower slope (c. 1700 m below sea-150
level) to the basin floor (c. 2000 mbsl). The slide has a lobate geometry (Fig. 2): (i) it is c. 7 km-wide in 151
its headwall region on the lower slope, (ii) widens to c. 15 km along its frontal margin in the centre of 152
the basin floor, and (iii) covers an area of 150 km2. The slide was derived from the southern flank of a 153
thrust-cored anticline within the SSP (Figs. 1 and 2). The anticline has a broadly arcuate trend and is 154
dissected by the headwall of the slide, extending from 1700 to 1900 mbsl (Fig. 2). The external limits 155
of the slide are defined as follows (Fig. 2): (i) Northern Lateral Margin, (ii) Eastern Lateral Margin, and 156
(iii) Frontal Margin. This external geometry, and the position of the headwall of the slide, indicates 157
that the slide was emplaced towards the SW. 158
Correlation with the laterally equivalent, slide-hosting package in wells XR-1 and XS-1 (Fig. 1d), 159
confirms that the slide is located stratigraphically within the Quaternary. Cores from the slope 160
(TGS009) and basin floor (TGS194) locations (Fig. 1b) indicate that: (i) slope sediments are composed 161
of argillaceous (fine to medium) sand, with low-medium cohesion and medium-high water content, 162
and (ii) basin floor sediments are characterised by very soft to firm clay, with medium cohesion and 163
medium-high water content. 164
Thickness variation and area sub-division 165
The 3D seismic reflection data cover c. 78% of the slide, mainly covering its downdip portion and 166
excluding the headwall region (see inset map in Fig. 3a). Thickness patterns (Fig. 3a) and frequency 167
characteristics (Fig. 3b) display gradual variations in both strike and dip directions, which enable 168
subdivision of the slide. Strike-oriented thickness variations highlight three distinct areas (Fig. 3a): (i) 169
A (c. 170-200 m thick), (ii) B (c. 140-170 m), and (iii) C (c. 70-140 m). All three areas thin and wedge-170
out abruptly downdip, at approximately the same rate, towards the Frontal Margin. Area C also thins 171
abruptly along strike, at a similar rate, towards the Northern Lateral Margin that represents a 172

boundary separating the downslope-translating slide and stationary substrate. The Eastern Lateral 173
Margin is inferred using bathymetry data alone, whereas the Northern Lateral Margin is imaged 174
directly by the 3D seismic reflection data. 175
Description of MTD seismic facies 176
Dip-oriented variations are defined by an isoproportional slice, taken midway between the basal shear 177
surface and seabed (Fig. 3b), which shows frequency changes indicative of seismic facies and/or 178
structural variability. The inner part of the slide is characterised by an overall lower RGB blend 179
frequency and relatively short, discontinuous along-strike lineations. In contrast, outer areas display 180
higher RGB blend frequency with longer, more continuous lineations, which extend across Areas A-C 181
(Fig. 3b). These lineations predominantly trend E (090-270o) in the S (Area A) and N to NW (000-180o, 182
020-200o) in the W (Area C). 183
Three dip-oriented seismic sections across Areas A, B and C, oriented perpendicular to the curved 184
lineations (Fig. 3b), define the internal character of the slide (Fig. 4a-c). These sections show that the 185
inner part of the slide comprises chaotic, highly discontinuous, low-amplitudes reflections, which 186
corresponds to the low RGB blend frequency seen in the spectral decomposition map (Fig. 3b). 187
Between the inner and outer parts, we observe isolated, high RGB blend frequency bodies (Fig. 3b). 188
These bodies correlate with isolated, folded, high-amplitude reflections encased within the 189
background chaotic and transparent reflections (Fig. 4a-c). The more continuous curved lineations in 190
the outer part of the slide (Fig. 3b) correspond to pairs of sharp discontinuities within the slide (Figs. 191
4a-c). These discontinuities converge downward onto the basal shear surface and mark the boundary 192
between folded and relatively horizontal reflections (e.g. Fig. 4a). 193
In map-view, there are also 20 to 65 km-long, 50 to 150 m-wide curved discontinuities extending 194
mainly within the outer part (see white dotted lines in Fig. 3b). These discontinuities crosscut the high 195
RGB blend frequency bodies, and orientated oblique, and become sub-parallel downslope, to the 196
continuous lineations bounding the bodies (Fig. 3b). 197

Interpretation of MTD seismic facies 198
The seismic expression of the inner part (low RGB blend frequency with predominantly chaotic and 199
transparent reflections) is typical of an internally disorganised and highly deformed debrite, as 200
compared to other, drilled examples of MTDs (e.g. Piper et al. 1997; Posamentier & Martinsen 2011). 201
The isolated bodies between the inner and outer parts are interpreted as megaclasts, with their long 202
axes oriented sub-parallel to the curved lineations (Jackson 2011; Alves 2015; Gamboa & Alves 2015; 203
Hodgson et al. 2018; Sobiesiak et al. 2018; Sobiesiak et al. 2019). 204
The continuous lineations in map-view (Fig. 3b) corresponding to reflection discontinuities in seismic 205
sections (Figs. 4a-c), are interpreted as forethrusts (i.e. NE-dipping) and backthrusts (SW-dipping). 206
These thrusts bound the high RGB blend frequency bodies (in map-view, see Fig. 3b) that correspond 207
to the folded reflections in their hangingwalls (in seismic sections, e.g. Fig 4a). These bodies are 208
interpreted as ‘pop-up blocks’ (e.g. Frey-Martínez et al. 2006; Bull & Cartwright 2019). 209
The pop-up blocks are crosscut along-strike by the curved discontinuities that trend oblique to them 210
upslope and become sub-parallel downslope (see white dotted lines in Fig. 3b). These discontinuities 211
are interpreted as sub-orthogonal shear zones (sensu Steventon et al. 2019) that may record 212
boundaries between different flow cells that moved at different speed within the translating failed 213
mass (e.g. Masson et al. 1993; Steventon et al. 2019). This differential speed might be induced by 214
intermittent deceleration of flow cells, as shearing along the shear zones halted when they merged 215
downslope with the thrusts at different times (Fig. 3b) (e.g. Steventon et al. 2019). Therefore, these 216
shear zones represent strike-slip movement between flow cells. Due to the predominantly sub-217
orthogonal orientation relative to the dominant transport direction, the shear zones are not 218
interpreted as longitudinal shear zones (sensu Bull et al. 2009). This is because the longitudinal shear 219
zones are orientated sub-parallel to the local transport direction (Masson et al. 1993; Gee et al. 2005; 220
Bull et al. 2009; Steventon et al. 2019). 221

Although thrust-bound pop-up blocks typify the outer part of the slide, there are significant lateral 222
variations (from Area A to Area C) in structural style and seismic facies characteristics, which are 223
described below. 224
Area A 225
Characteristics of Area A 226
A gradual downslope-deepening of the basal shear surface characterises the base of the slide in Area 227
A. The surface steps up to form a steep ramp (c. 60o) that defines the slide’s frontal margin (Fig. 4a). 228
The basal shear surface is deepest (c. 200 mbsf) adjacent to the frontal margin, with the basal shear 229
surface essentially being horizontal. The upper surface of the slide is of low relief in the inner part, and 230
it becomes more rugose down-dip and reaches its highest relief (15 m) at the frontal margin. 231
Seismic reflections in the outer part of the slide in Area A are well-imaged and can be directly 232
correlated with undeformed strata beyond the frontal margin, despite being contractionally offset by 233
thrust faults (Fig. 4a). The internal reflections of the slide become more irregular, and harder to trace, 234
towards the inner part. In area A, the average throw and dip of the fore- and backthrusts are c. 30 m 235
and c. 45o, respectively, with the spacing between thrust pairs (measured from crest to crest of pop-236
up blocks) ranging from 400 to 500 m. 237
Interpretation of Area A 238
The steep frontal ramp that separates undeformed basin-floor strata from the slide is a classic 239
frontally-confined (sensu Frey-Martínez et al. 2006) termination style (Fig. 4a). In the inner part, the 240
low seabed relief may partly reflect the infilling of the slide’s top-surface relief by post-emplacement 241
sedimentation (ponded sediments in Fig. 4a). In the outer part, the thickness of the slide (c. 200 m) is 242
only expressed by minimal seabed relief at the edge of the deposit (c. 15 m), similar to previously 243
documented frontally-confined MTDs (e.g. Lastras et al. 2004; Frey-Martinez et al. 2005). 244
Internal reflections show higher preservation of stratal reflections in the outer than the inner parts, 245
suggesting that the youngest thrust is located at the frontal margin of the slide (Fig. 4a), similar to 246

those observed from outcrops (e.g. Alsop et al. 2019) and seismic reflection data (e.g. Frey-Martínez 247
et al. 2006; Bull & Cartwright 2019). Physical modelling results suggest that regular spacing of fore- 248
and backthrusts is indicative of an MTD that was translated on a low friction basal shear surface (Huiqi 249
et al. 1992). 250
Area B 251
Characteristics of Area B 252
The basal shear surface in Area B progressively steps up through stratigraphy to define a ramp-flat-253
ramp structural configuration (Fig. 3a and Fig. 4b). The basal shear surface is deepest (c. 170 mbsf) 254
immediately upslope from the first and deepest frontal ramp with the highest relief (30 m). The other 255
two ramps are more gently-dipping and have lower relief (c. 20 m) (Fig. 4b). These three ramps 256
truncate otherwise continuous, sub-parallel reflections defining the pre-slide substrate (i.e. composed 257
of moderately cohesive clay). The substrate in Area B dips very gently (c. 1o) in an opposing direction 258
(i.e. northeastwards) to the slide transport direction. The seabed in Area B is smooth but becomes 259
more rugose downdip (Fig. 4b). Most notably, the highest seabed relief (c. 10 m) is located 260
immediately above the deepest point of the basal shear surface. 261
The nature and distribution of the seismic facies in Area B differs from those of Area A, which are 262
characterised by a much higher level of reflection discontinuity. Also, the least disturbed strata (i.e. 263
semi-continuous seismic reflections) occur in the central part of the slide, immediately upslope from 264
the first frontal ramp. Directly above the frontal ramps, reflections are extremely chaotic with variable, 265
higher amplitude seismic facies encased within more extensive transparent seismic intervals, which 266
resemble those in the inner part (Fig. 4b). 267
In the central area, where stratal reflections have the highest preservation, pop-up blocks and thrusts 268
are geometrically similar to those in Area A (Fig. 4b). However, these pop-up blocks have a spacing of 269
c. 150-300 m, which is about half that of Area A. Measuring the throw and dip of thrusts in Area B is 270
harder than in Area A, due to more chaotic arrangement of internal reflections. The continuous nature 271

of pop-up blocks and thrusts in map-view (Fig. 3b), however, suggest that the more chaotic 272
arrangement in seismic sections is likely due to seismic resolution limitations and the closer spacing 273
of the thrusts. Where we can trace a marker horizon between thrust-bound pop-ups, the throw and 274
dip of the thrusts are 49 m and 60o, respectively (i.e. similar to the maximum values observed in Area 275
A). 276
A distinctive upstanding, undeformed block is identified on a variance time-slice and seismic section 277
(see ‘Intact block’ in Fig. 5), which marks the transition between Area A and B. This block extends 278
gradationally downwards into the undeformed slope-to-basin floor strata (Fig. 5b), which continue 279
unbroken towards the E (Fig. 5a). The block is bound in the N by the steep frontal ramp defining Area 280
A and pop-up blocks within the toe domain of the slide (in the W and S). The block is capped by sub-281
parallel, variable-amplitude reflections, while in the S it is bound by folded reflections that are cross-282
cut by minor thrusts. These thrusts detach onto a reflection that is stratigraphically shallower than the 283
basal shear surface within the slide’s main body (Fig. 5b). 284
Interpretation of Area B 285
The stepped geometry of the basal shear surface confining the slide in Area B argues against frontal 286
emergence of the slide (Frey-Martínez et al. 2006). Seismic facies above the stepped frontal ramp 287
comprise variable-amplitude, somewhat chaotic reflections that resemble debrites (cf. Posamentier 288
& Kolla 2003; Ortiz-Karpf et al. 2017) (Fig. 4b). Pop-up blocks in Area B are located immediately updip 289
from the frontal ramps (Fig. 4b). Here, the slide is thinner, and it contains more closely-spaced pop-290
up blocks than those in Area A. We therefore speculate that there might be a relationship between 291
thickness and pop-up block width/thrust fault spacing. This is consistent with the physical and 292
numerical modelling by Liu & Dixon (1995), who demonstrate a positive linear relationship between 293
thrust spacing and thickness of the strata. 294
The intact block (i.e. composed of continuous reflections) can consistently be separated from folded 295
and discontinuous reflections above and to the sides of the block (Fig. 5b). Therefore, we suggest that 296

the basal shear surface steps up above this block, before stepping down to the reflection onto which 297
the minor thrusts detach (Fig. 5b). The surface then steps up again to define the outermost frontal 298
margin in Area B. Beyond this outermost frontal margin, a gently folded reflection is observed that 299
probably marks the position where the next thrust would have formed (Frey-Martínez et al. 2006). 300
We interpret the intact block as a piece of in situ substrate, based on its lack of deformation and 301
gradational seismic facies relationship with underlying and adjacent basin floor strata. Hence, it can 302
be interpreted as a remnant block (sensu Bull et al. 2009). The minor thrusts downdip from the 303
remnant block suggest that there is a zone of relatively high strain beyond the main body of the slide 304
(Fig. 5b). This zone of high strain could be a distributed shear zone, where compressional stress is 305
transmitted beyond the frontal ramp (Hodgson et al. 2018). However, in those cases, the distributed 306
shear zone is commonly in direct contact with the frontal margin of the main body (e.g. Watt et al. 307
2012). 308
In our case, the remnant block exists in between two zones of relatively high strain (Fig. 5b). Therefore, 309
an alternative interpretation is that the minor thrusts represent the lateral propagation of thrusts 310
eastwards from Area C (Fig. 5a). This interpretation is plausible given that minor thrusts can be traced 311
westwards on the variance time-slice, towards the main body of the slide (i.e. into Area C, Fig. 5a). The 312
relationship between the main body of the slide, the remnant block, and the minor thrusts, partially 313
resemble a process referred to as ‘enveloping’ (Hodgson et al. 2018). For example, a remnant block 314
could form when an uneven frontal margin to the slide envelopes a large piece of substrate, but with 315
the process terminating prior to complete entrainment of the block due to cessation of the slide’s 316
translation. 317

Area C 318
Characteristics of Area C 319
The basal shear surface in the outer part of Area C exhibits a similar geometry and internal 320
characteristics to that of Area B, especially the staircase-like geometry of the basal shear surface (Fig. 321
4c). However, the basal shear surface here is associated with a pronounced change in dip and dip 322
direction, defined by a change from c. 1o basinward dip to a c. 3o landward dip (Figs. 4c and 6a). This 323
change in dip coincides with the deepest (120 mbsf) occurrence of the basal shear surface. The seabed 324
in Area C is characterised by a (i) c. 10 m vertical relief, and (ii) a c. 6 km long and 2 km wide 'bulge', 325
immediately updip of the slide’s frontal margin (Figs. 4c, 6b-c). Adjacent to the Northern Lateral 326
Margin, the basal shear surface is relatively flat, and the seabed shows rugosity similar to that in Areas 327
A and B, but with a shorter wavelength (Fig. 6d). 328
The internal characteristics of the slide in Area C, which resemble those in Area B, comprise the 329
following: (i) chaotic reflections of variable amplitude encased within very low-amplitude reflections 330
at the frontal margin, (ii) pop-up blocks within the slide’s outer part, and (iii) megaclast-bearing 331
debrites in the inner part (Fig. 4c). However, the pop-up blocks in Area C are more closely spaced (c. 332
100-150 m) than those in Area B, which results in low stratal preservation in seismic sections (Fig. 4c). 333
Thus, despite being well-imaged in map-view, from which pop-up blocks spacing can be measured 334
(Fig. 3b), dip and throw measurements in Area C are uncertain (Fig. 4c). 335
The frontal margin in Area C is characterised by rapid pinch-out of the slide’s internal body onto the 336
inclined (c. 3o) substrate (Fig. 4c). Towards the Northern Lateral Margin, the spacing between pop-up 337
blocks is even shorter (c. 70-100 m), and the basal shear surface is shallower (70 mbsf) (Figs. 3 and 338
6d). 339
Near the frontal margin, sub-parallel, discontinuous, high-amplitude reflections occur between the 340
basal shear surface and the largely transparent seismic facies defining the main body of the slide (Fig. 341
4c). These reflections are identical, thus could be directly correlated, to the reflections within a c. 25 342

m-thick interval located basinward of the slide, comprising inclined, largely undeformed, reflections 343
(Fig. 4c). 344
The boundary between Areas B and C comprises a NE-trending/NW-facing ramp, which is laterally 345
continuous with the NW-trending/NE-facing frontal ramp of Area B (Fig. 7a). Variance attributes 346
extracted from a 50 ms TWT thick window above the basal shear surface show several NW-trending 347
lineations that terminate against the NE-trending ramp. In seismic section, these lineations 348
correspond to fold-and-thrust belt structures in Area C (Fig. 7b). Thus, the NE-trending ramp forms a 349
boundary between the fold-and-thrust system and the undeformed substrate. The NE-trending ramp 350
also coincides with a positive relief on the seabed. 351
Interpretation of Area C 352
The slope gradient break at the basal shear surface and emergent of the leading-edge part of the slide 353
that onlaps onto the underlying inclined substrate are likely to be related. We suggest that the physical 354
impact of the downslope-translating slide onto its substrate was highest where the basal shear surface 355
abruptly changes dip and dip direction (Ogata et al. 2014b). Following this impact, variations in the 356
mechanical properties of the substrate likely controlled the morphology of the basal shear surface 357
(Strachan 2002; Frey-Martinez et al. 2005; Moernaut & De Batist 2011). For instance, substrates with 358
higher shear strengths (e.g. due to lower pore-pressure) force the basal shear surface to step-up to 359
shallower substrates and propagate along inclined substrates that have lower shear strength (Fig. 4c). 360
The inclined basal shear surface and momentum gained by the slide at the dip change provide 361
sufficient inertial energy for the translating mass to abandon the basal shear surface and emerge onto 362
the coeval basin floor, and to onlap the bathymetric high (Figs. 4c, 6b) (Frey-Martinez et al. 2005; Frey-363
Martínez et al. 2006). Therefore, we classify the slide in Area C as frontally-emergent (sensu Frey-364
Martinez et al. 2006). However, the slide also becomes frontally-confined adjacent to the Northern 365
Lateral Margin, where the slide is thin, and the basal shear surface is relatively flat and lacks a distinct 366
dip change (Fig. 6d; cf. Area A in Fig. 4a). 367

The abrupt change in basal shear surface dip has at least two additional consequences. Firstly, the 368
internal body of the slide was likely disaggregated due to the buttressing effect of the underlying 369
substrate (Mandl & Crans 1981). This resulted in the partially-disaggregated debrite facies in the 370
frontal margin area, which is manifested as the broad bulge on the seabed (Fig. 6b-c). Secondly, the 371
impact of the translating mass onto the substrate develops a zone of stratigraphically parallel, 372
discontinuous reflections directly on top of the basal shear surface (e.g. Joanne et al. 2013; Hodgson 373
et al. 2018; Sobiesiak et al. 2018; Steventon et al. 2019). We interpret these reflections as lying within 374
the basal shear zone, in which the substrate was deformed due to compressional forces exerted by 375
the slide, but was not fully entrained (e.g. Joanne et al. 2013; Festa et al. 2016; Hodgson et al. 2018; 376
Sobiesiak et al. 2018; Ogata et al. 2019; Cardona et al. 2020). 377
The abrupt boundary between Areas B and C indicates that the basal shear surface evolved differently 378
between the two areas, where the frontal ramp of Area B was cross-cut by the main body in Area C 379
(Fig. 7a). This cross-cutting relationship probably formed by the slide’s erosion of the substrate in Area 380
C, which formed the NW-facing ramp (Fig. 7a-b). Lateral variations in basal shear surface growth and 381
geometry could also be related to lateral variations in the mechanical properties of the stratigraphy 382
overlying the basal shear surface (e.g. permeability, pore-pressure and related shear strength). In 383
addition, variations in the magnitude of stress exerted by the slide onto, and into, the substrate in 384
adjacent areas may have occurred (Strachan 2002; Frey-Martinez et al. 2005). Positive seabed relief 385
adjacent to the NE-trending ramp likely reflects a buttressing effect of the main body of the slide 386
against the ramp as new material was entrained by the slide (Fig. 7b). 387
Strain distribution in the toe domain 388
We here estimate the translation distance of the Haya Slide based on an assessment of shortening 389
within Area A that has the best preservation of internal reflections. We also quantify intra-MTD strain 390
of a pop-up block within Area A to investigate how strain varies along strike. 391

Shortening and vertical strain variability 392
The distance travelled by the slide can be estimated by measuring total shortening in the frontally-393
confined part of toe domain, as long as the fold-and-thrust belts and the internal reflections are well-394
preserved and imaged (cf. Frey-Martínez et al. 2006; Bull & Cartwright 2019). However, we note that 395
the calculated translation distance here is a first-degree estimation of how far the slide has travelled 396
in the toe domain (Frey-Martínez et al. 2006), and, thus, it does not represent run-out distance, which 397
is measured from the headwall to the leading-edge of the deposit (Clare et al. 2018). 398
A representative depth-converted seismic-section in Area A (interval velocity derived from wells XR-1 399
and XS-1) was selected for our shortening calculation based on line-length method (see Figs. 3b and 400
4a). This section is orientated perpendicular to the strike of the fold-and-thrust belt, and stratal 401
reflections within individual thrust-bound blocks are well-imaged, and can thus be interpreted with 402
confidence. Two intra-MTD horizons were interpreted (H1-2, see Fig. 4a) to better constrain the 403
amount of horizontal shortening and to determine how this varies vertically. These horizons extend 404
from undeformed basin-floor strata to the updip limit of the outer part (Fig. 4a). 405
The present and restored lengths of H1, the deepest horizon, are 6.73 km and 7.79 km, respectively, 406
which equate to 14% contraction (1.06 km). In contrast, the shallower H2 horizon experienced only 407
8% contraction (0.61 km), derived from present and initial lengths of 6.65 km and 7.26 km, 408
respectively. This analysis shows two key results: (i) contractional structures in Area A (Fig. 4a) formed 409
in response to horizontal translation of the slide over a relatively short distance (0.61-1.06 km), and 410
(ii) greater contraction of the deeper H1 horizon compared to the shallower H2 indicates depth-411
dependent layer shortening, which is explained further below. 412
Along-strike strain variability 413
An along-strike analysis enables the kinematics behind the spatial configuration of fold-and-thrust 414
belts to be assessed (Dahlstrom 1969). Such studies have been performed for kilometre-scale, deep-415
water fold-and-thrust belts using 3D seismic reflection data (e.g. Higgins et al. 2009; Totake et al. 416

2018). Here, we document the along-strike variability of intra-MTD strain at a significantly smaller-417
scale, but exceptionally well-imaged, fold-thrust system within the Haya Slide. 418
We conducted the along-strike analysis on Pop-up Block 3 (i.e. the third block counted from the frontal 419
margin, and herein referred to as PB-3; see Fig. 4a) and its associated fore- and backthrusts. This pop-420
up block is ideal for this analysis because its main bounding thrust fault (FT-1) and Horizon H2 can be 421
interpreted over the longest distance (c. 3 km along strike, see Fig. 8a); other pop-up blocks are shorter 422
and more segmented along strike (c. 0.5-1 km). 423
Structural configuration in map view. Mapping of H2 laterally from the representative section of Area 424
A (i.e. Fig. 4a) reveals a more complicated configuration of pop-up structures associated with PB-3; 425
whereas there is only a single pop-up in the E (PB-3a), there are two in the W (PB-3b-c; Fig. 8a). These 426
three pop-up blocks are readily identified on a variance time-slice (Fig. 8b). Here, one of the sub-427
orthogonal shear zones identified in the previous section (see General Characteristics and white 428
dotted lines in Fig. 3b), trends oblique to, and cross-cuts, the thrust faults near the central part of the 429
focused study area (white dotted line in Fig. 8b). This shear zone clearly defines the boundary between 430
PB-3a in the E (i.e. eastern domain) and PB-3b and c in the W (i.e. western domain, see Fig. 8a). At this 431
shear zone, the southern margin of the PB-3a and b shows an 80 m left-lateral (sinistral) offset (Fig. 432
8b). 433
PB-3a is bound on its northern margin by one major backthrust (BT-1), and one minor FT-2 exists 434
adjacent to FT-1. In contrast, PB-3b is bound on its northern side by BT-2 and -3 that forms a 'soft-435
linkage' with each other (sensu Walsh & Watterson 1991). Unlike PB-3a and -b, PB-3c is not bound by 436
FT-1, but is instead bound by two forethrusts (FT-4 and FT-5) and two backthrusts (BT-4 and BT-5). BT-437
1 and BT-4 are soft-linked (near the shear zone) and bound the northern margin of PB-3a and c, 438
respectively (Fig. 8a). The faults bounding the three pop-up structures generally strike E-W to ESE-439
WNW. In addition to the faults that define PB-3a-c, we identify two faults (i.e. FT-3 and BT-6) within 440
the shear zone that bound a narrow (c. 100 m-wide), high-relief (c. 20 m-high) block (Fig. 8a-b). 441

Throw profiles. An along-strike throw projection of individual fore- and backthrust faults shows 442
irregular shapes of throw profiles (Fig. 8c). T-x plot of FT-1 shows a slightly bimodal throw profile, 443
where it has a slightly lower throw (c. 5-10 m) in the western (PB-3b) than in the eastern (PB-3a) 444
domains (Fig. 8c). This contrasts with an increase of the number of thrusts in the western domain, 445
resulting in a significantly higher cumulative throw: from c. 20-40 m in the E to c. 40-80 m in the W 446
(Fig. 8c). A local minimum in the cumulative throw profile, which coincides with the local minima of 447
FT-3, marks the boundary between the eastern and western domains (Fig. 8c). The seismic sections 448
across PB-3 depict the change in the fold-and-thrust configuration along strike (Fig. 8d-f), from the 449
eastern area, across the shear zone, to the western area. 450
Interpretation. We interpret the two different strain domains within the translated mass (i.e. the 451
eastern and western domains, see Fig. 8a-b), separated by an intra-MTD, syn-emplacement shear zone 452
(i.e. the sub-orthogonal shear zone described in General Characteristics and highlighted by the white 453
dotted lines in Fig. 3b). These two domains were likely transported a similar distance. This is because 454
the western domain appeared to travel downdip only a small amount further than the eastern domain 455
(i.e. 80 m) when compared to the overall estimated translation distance of the slide (i.e. 8-14% of 0.61-456
1.06 km translation distance). There are also more thrusts in the western than the eastern domains 457
(Fig. 8a-b). Between the two domains, the narrow and high-relief block is interpreted as an uplifted 458
block that may have formed due to transpression within the shear zone (Sanderson & Marchini 1984). 459
The throw profiles of the individual fore- and back-thrusts resemble larger, tectonic-scale fold-thrust 460
systems, such as the compressional tectonics in offshore NW Borneo (Totake et al. 2018) and the 461
gravitational tectonics of the Niger Delta (Higgins et al. 2009). The markedly higher cumulative throw 462
of the western domain, as compared to the eastern domain, implies that the western domain 463
experienced markedly different amounts of contraction (Fig. 8c). This might indicate that pop-up 464
structures in the western domain are in a more advanced phase of growth (e.g. Cartwright et al. 1995; 465
Totake et al. 2018). The local minima in the cumulative throw profile may represent a paleo-linkage 466

site (Ellis & Dunlap 1988), which in this study coincides with the shear zone (Fig. 8a-b). Hence, the 467
shear zone not only reflects differential timing or velocities of translating masses within an MTD 468
(Masson et al. 1993; Bull et al. 2009; Steventon et al. 2019), but it could also separate two translating 469
masses recording different amounts of strain, despite being translated for a similar distance. 470
DISCUSSION 471
We here discuss the slide transport processes and lateral variability of frontal emplacement and intra-472
MTD strain within the toe domain. Also, we discuss the implications for assessing the seal potential of 473
MTDs in relation to hydrocarbon accumulations. 474
Modes of transport 475
Frey-Martínez et al. (2006) show the headwall domain of frontally-confined MTDs are defined by 476
internally coherent, normal fault-bound blocks. In this domain, there is only limited depletion of the 477
failed mass immediately downdip of the headwall. However, more recent studies show that major 478
sediment depletion in the headwall domain can occur even if the MTDs are frontally confined (e.g. 479
Lastras et al. 2004; Watt et al. 2012; Joanne et al. 2013). In such cases, these frontally-confined MTDs 480
are generally characterised by strongly disaggregated, debritic material in their inner parts, rather 481
than fault-bound blocks. Downdip, contractional structures (e.g. folds and imbricated thrusts) display 482
increasing stratal preservation distally. 483
The Haya Slide comprises an inner, debrite-dominated part and an outer part dominated by 484
contractional structures. The debrite likely originated from the collapse of the southern flank of an 485
updip anticline (see Fig. 3). This deformed the seabed and entrained the substrate (Fig. 9a), which 486
resulted in flow bulking further downslope (Gee et al. 2001; Gee et al. 2007; Butler & McCaffrey 2010; 487
Ogata et al. 2019). Substrate entrainment and subsequent downslope translation then produced 488
transparent seismic facies (i.e. the debrite in Fig. 4), indicating that the incorporated material was 489
increasingly disaggregated (Posamentier & Kolla 2003; Ortiz-Karpf et al. 2017). Erosion and 490
disaggregation by the debris flow continued until the shear stress exerted by the flow was unable to 491

entrain more substrate (Fig. 9b). At this point, the debris flow applied significant shear and 492
compressional stress (lateral loading) to the substrate ahead of, and to the sides of, the flow (Butler 493
& McCaffrey 2010; Hodgson et al. 2018). 494
The strata ahead of the debris flow were translated a short distance (i.e. 0.61-1.06 km), forming 495
broadly symmetrical pairs of fore- and backthrusts (Fig. 9c). This symmetrical geometry of the thrusts 496
is likely due to horizontal buckling on a low friction basal surface during shearing (Huiqi et al. 1992). 497
The low basal friction may reflect the fact that the failed mass was translating on high-water content 498
substrate with high pore pressure (e.g. Armandita et al. 2015). The two styles of MTD-substrate 499
interactions, i.e. erosion and deformation (Fig. 9c), have been documented elsewhere, both in seismic 500
reflection (e.g. Schnellmann et al. 2005; Watt et al. 2012; Joanne et al. 2013; Ogata et al. 2014a; Bull 501
& Cartwright 2019; Omeru & Cartwright 2019; Steventon et al. 2019), and field data (Van Der Merwe 502
et al. 2011; Ogata et al. 2012; Ogata et al. 2014b; Festa et al. 2016; Sobiesiak et al. 2016; Hodgson et 503
al. 2018; Ogata et al. 2019; Sobiesiak et al. 2019; Cardona et al. 2020). Adjacent to the toewall, the 504
basal shear surface exhibits different geometries along strike (Fig. 10). This along-strike variability will 505
be discussed in the following section. 506
Lateral variability of the toe domain 507
Lateral variability of frontal confinement 508
Moernaut & De Batist (2011) investigated sub-lacustrine MTDs to understand what controls whether 509
an MTD remains confined, or whether it abandons its basal shear surface and emerges onto the coeval 510
basin floor. They conclude that the drop height and depth of the basal shear surface are the main 511
factors controlling frontal emplacement style. The former represents a driving force (i.e. gravitational 512
potential energy), and the latter represents a resisting force (i.e. potential energy needed to be 513
exceeded for the MTD to emerge). 514
The Haya Slide originated from a headwall at a depth of c. 1700 mbsl, and its frontal margin is at c. 515
2000 mbsl (the basinward extent of Areas A to C) (see Fig. 3). Thus, the drop height of the slide is 300 516

m, which provided a similar driving force (potential energy) for all the three frontal areas. However, 517
the depth of the basal shear surface, and thus the thickness of the slide, varies laterally: it is deepest 518
in Area A (c. 200 mbsf) and shallowest in Area C (c. 120 mbsf). This lateral variability of basal shear 519
surface depth, slide thickness and degree of confinement must also reflect lateral changes in the ratio 520
between the resisting and driving forces (Fig. 10). In particular, the driving forces needed for the slide’s 521
emergence in Area A were greater than that in Area C. Therefore, the Haya Slide exhibits a lateral 522
variation of frontal emplacement (Fig. 10); i.e. full frontal confinement in Area A, partial confinement 523
across several staircase-like frontal ramps in Area B, to frontal emergence in Area C. Lateral friction 524
along the Northern Lateral Margin may have also locally increased the resisting force in addition to 525
the basal friction (e.g. Joanne et al. 2013), such that the slide is frontally-confined in that area despite 526
being at its thinnest (Fig. 6d). 527
There is also a broad correlation between the basal shear surface morphology (i.e. depth and slope 528
gradient break) and the overlying structural style in the toe domain. In Area A, for example, a relatively 529
flat gradient, coupled with a deep basal shear surface, is associated with a steep (c. 60o) frontal margin 530
(Figs. 4a and 10). This steep frontal margin represents the youngest forethrust that was formed as the 531
slide ceased to translate (Fig. 11a) (e.g. Watt et al. 2012; Joanne et al. 2013; Alsop et al. 2019). 532
In contrast, Area C displays a low-angle (3o), upslope-dipping, and relatively shallow basal shear 533
surface related to the frontal ramp and slide emergence onto the coeval basin floor (Figs. 4c and 10). 534
Here, a bathymetric high (see Fig. 6a-c) that existed prior to slide emplacement formed inclined strata 535
ahead of the slide. This inclination increased the impact of the slide onto the substrate as also 536
documented in Ogata et al. (2014b). The increased impact led to: (i) the formation of basal shear zone, 537
and (ii) allowed the slide to transfer remaining exerted stress by abandoning the basal shear surface 538
and translate on the coeval seafloor (Fig. 11b). Such distal bathymetric confinement has also been 539
documented elsewhere, for instance, in offshore Colombia, where channel-levee morphology could 540
deflect and/or block debris flows (Ortiz-Karpf et al. 2017). 541

Areas A and C represent end-member styles of the basal shear surfaces frontal geometry (i.e. frontally-542
confined and frontally-emergent). Morphologically, the basal shear surface in Area B lies between 543
Areas A and C, being defined by a low-angle (1o) surface, an intermediate-depth and a staircase-like 544
set of frontal ramps (Fig. 4b and 10). The formation of these ramps can be compared to the ramps and 545
flats present along non-planar thrust faults, where the ramps tend to form in relatively high-shear 546
strength layers, and the flats (e.g. basal shear surface connecting the ramps) in weaker layers (Fossen 547
2016). The potential energy of the slide in Area B might have been progressively (rather than 548
instantaneously) dissipated in the distal area (Fig. 11c). Here, the basal shear surface may have 549
propagated downslope along a horizon until it encountered a layer with higher shear strength (i.e. the 550
red point in Fig. 11c). At that point, the basal shear surface stepped-up through stratigraphy and 551
continued to propagate in shallower levels (i.e. initiated from the green point in Fig. 11c). This process 552
might have continued several times to form the staircase-like frontal ramps, eventually terminating 553
when the shear strength of the strata ahead of the flow exceeded the shear stress exerted by the slide 554
(Fig. 11c). Alternatively, the staircase-like geometry might represent a transitional style between full 555
frontal confinement and full frontal emergence. The first frontal ramp in Area B links along-strike to 556
the frontal ramp in Area A (Fig. 3a). Thus, this first step can be interpreted as the initial toewall. 557
However, this initial toewall was not developed to form a steep ramp such as that in Area A. Instead, 558
the debrite-like seismic facies above the subsequent steps might represent a style of frontal 559
emergence (Fig. 4b). Consequently, the slide must have abandoned the basal shear surface, and 560
progressively shallowed and incorporated material downdip from the initial toewall. This differs to 561
Area C where the slide expelled material on to the coeval basin floor. 562
There is also some degree of correlation between the depth of the basal shear surface and the degree 563
of disaggregation adjacent to the toewall. In Area A, where the basal shear surface is deeply rooted, 564
internal reflections of the slide are well-preserved (Fig. 11a). In contrast, in Areas B and C, where the 565
basal shear surface progressively shallows, internal reflections of the slide exhibit debritic facies, 566
indicating internal disaggregation (Fig. 11b-c). A similar relationship has also been documented in the 567

thinner part of MTDs in offshore Brazil (Alves & Cartwright 2009; Gamboa et al. 2011) and offshore 568
Colombia (Ortiz-Karpf et al. 2017). These studies conclude that the shallowing basal shear surface led 569
to an increase in shear stress at the base of the flow with increased disaggregation. 570
Hence, we conclude that the interplay between stresses exerted by parent flow and variation of 571
mechanical properties of the substrate (both locally and regionally), controls the morphology of the 572
basal shear surface (Figs. 10 and 11) (Bull et al. 2009; Shanmugam 2015; Hodgson et al. 2018; Sobiesiak 573
et al. 2018). 574
Lateral variability of intra-MTD strain 575
Only a few studies have used seismic reflection data to quantify intra-MTD strain (Bull & Cartwright 576
2019; Steventon et al. 2019). More specifically, these studies have focused on: (i) strain balancing 577
between headwall and toe domains of MTDs located in offshore Uruguay (Steventon et al. 2019) and 578
offshore Norway (i.e. Confined Stroregga Slide (CSS), Bull & Cartwright 2019); and (ii) assessment of 579
depth-dependant layer shortening in the toe domain (Steventon et al. 2019). The Uruguay example 580
shows that contractional strain in the toe domain is apparently greater than (by c. 3-14%), and thus 581
does not balance, extensional strain in the headwall domain (Steventon et al. 2019). This strain deficit 582
could be attributed to sub-seismic penetrative strain, likely associated with grain-scale deformation, 583
and porosity and fluid loss (Koyi 1995; Koyi et al. 2004; Burberry 2015; Dalton et al. 2017; Alsop et al. 584
2019). In contrast, the study of the CSS found that extensive sediment depletion in the headwall 585
domain is accommodated by only relatively mild contraction (c. 5%) in the toe domain (Bull & 586
Cartwright 2019). This discrepancy is inferred to reflect a subsequent phase of deformation that 587
involved the removal of a significant amount of material from the headwall domain after 588
emplacement of the CSS. 589
Besides longitudinal balancing of MTDs, seismic-scale vertical variability of intra-MTD strain has also 590
been documented. Steventon et al. (2019) documented that the deeper horizon (i.e. closer to the 591
basal shear surface) experienced more shortening (c. 27%) than the shallower horizons (c. 18%) in the 592

toe domain of the MTD, offshore Uruguay. We find similar results in the Haya Slide, where deeper 593
(H1) and shallower (H2) horizons record c. 14% and c. 8% of shortening, respectively (Fig. 4a). These 594
observations suggest that the magnitude of shortening estimate depends on the measurement depth 595
due to depth-dependant horizontal shortening, with strain being greatest at depth. Physical models 596
of horizontal shortening suggest that the increase of shortening with depth is balanced by bed-length 597
decrease, lateral compaction of deeper layers, layer-normal thickening of shallower layers, and 598
increased thrust displacement (Koyi 1995; Koyi et al. 2004; Burberry 2015). One or a combination of 599
these processes might occur within the toe domain of a seismic-scale MTD. 600
The examples above show that intra-MTD strain varies both longitudinally and vertically. Our along-601
strike analysis of PB-3 and its associated thrusts indicate that intra-MTD strain also varies laterally, 602
with a shear zone separating two domains of contraction within a translated mass (Fig. 8). This 603
represents a seismic-scale example of the field data-derived, multi-cell flow model of Alsop & Marco 604
(2014) (see also Farrell 1984). This model states that a first-order, single-cell MTD is composed of many 605
smaller, second-order flow cells that are formed during translation and may locally interact (Alsop & 606
Marco 2014). This local interaction is revealed by our along-strike analysis of PB-3, which we infer is 607
contained within a more extensive, first-order cell. The eastern and western domains of the pop-up 608
block represent second-order flow cells, with the shear zone representing the flow cells boundary. 609
In the context of the multi-cell flow model, the formation processes of the structural configurations 610
of PB-3 could be captured in a simplified schematic model comprising three phases of development. 611
In Phase 1, PB-3 might initially have been a single body (or cell) of sediment experiencing the same 612
amount of stress laterally, leading to the formation of a through-going master forethrust (i.e. F-1 in 613
Fig. 12a), i.e. analogous to FT-1 in Figure 8. An alternative interpretation is that the curved fault trace 614
of F-1 in map-view (i.e. similar to FT-1 in Fig. 8a-b) and its slightly bimodal throw profile on strike 615
projection (i.e. similar to FT-1 in Fig. 8c), together suggest that F-1 formed due to a merger of two 616
thrust segments (e.g. Schreurs et al. 2016). Each thrust segment bound the frontal margin of proto 617

PB-3a and PB-3b, with the linkage point between them now indicated by a local minimum on its throw 618
profile (Fig. 12a). 619
In Phase 2, velocity perturbations during translation of the first-order cell initiated the formation of 620
the sub-orthogonal shear zone and caused formation of the two second-order flow cells (i.e. the 621
western and eastern cells, Fig. 12b) within the initially continuous cell (i.e. Fig. 12a). The velocity 622
perturbations could be induced by: (i) variable basal shear stress resulting from thickness variation of 623
the first-order cell (i.e. thinning westwards, see Figs. 3a and 12b) (e.g. Alsop & Marco 2014), and/or 624
(ii) early deceleration of the eastern cell as the shear zone became sub-parallel to F-1, associated with 625
the closer position of the eastern cell relative to the frontal confinement of Area A (see Fig. 3b and 626
12b) (e.g. Steventon et al. 2019).The shear zone laterally partitioned the amount of stress across the 627
PB-3, resulting in differential structural growth in the eastern and western cells forming PB-3a and PB-628
3b-c, respectively (Fig. 12b). 629
In Phase 3, downslope translation of the eastern cell ceased prior to the western cell. The still-moving 630
western cell accommodated the still-applied stresses imposed by material towards its rear by the 631
formation of additional contractional structures and the growth of existing structures (i.e. PB-3b and 632
c, Fig. 12c). Hence, the western cell records a more advanced stage of contraction than the eastern 633
cell, as expressed by the higher number of thrusts and the larger cumulative throw of the thrusts (Fig. 634
12c) (e.g. Cartwright et al. 1995; Totake et al. 2018). This process results in an along-strike variability 635
in the style and magnitude of intra-MTD strain, with the shear zone separating the intra-MTD cells 636
that record the different amount of strain. 637
Impact of intra-MTD strain on seal potential 638
MTDs can play at least two roles in the development of petroleum systems: they commonly serve as 639
seals (Algar et al. 2011; Cardona et al. 2016), and more rarely act as reservoirs (Sawyer et al. 2007; 640
Algar et al. 2011; Shanmugam 2012; Arfai et al. 2016; Cardona et al. 2016). This is controlled by three 641
key parameters: (i) provenance lithology, most notably sand/mud ratio (Jenner et al. 2007; Omosanya 642

& Alves 2013), (ii) substrate lithology and erodibility (e.g. Cardona et al. 2020), and (iii) the degree of 643
internal disaggregation, where a strongly disaggregated MTD could have high seal potential due to 644
significant permeability reduction (Alves et al. 2014; Omeru 2014; Cardona et al. 2016). The driving 645
factors of this permeability reduction include: (i) internal lithological mixing of fine and coarse grains 646
that produces an unsorted matrix (Ogata et al. 2019); (ii) alignment of clay minerals due to shearing 647
during transport (Bennett et al. 1991; Ikari & Saffer 2012; Cardona et al. 2016); and (iii) grain crushing 648
in otherwise good-quality reservoirs (Crawford 1998). 649
The seal potential of highly-disaggregated cohesive MTDs may be compromised by two factors. First, 650
the entrainment of coarser-grained substrate, such as by a debris flow that overrides earlier sandy 651
turbidites, could result in sandier, and less cohesive debrite downslope (Dykstra et al. 2011; Ortiz-652
Karpf et al. 2017). This incorporation of sandy materials could also lead to an increase of pore-scale 653
(µm) effective porosity and permeability (Dykstra et al. 2011). Second, large (km-scale) rafted blocks 654
(megaclasts) with reservoir potential, encased within an otherwise very fine-grained, low-permeability 655
debritic matrix of an MTD (Gamboa & Alves 2015; Cardona et al. 2016; Cardona et al. 2020), could 656
provide localised high-permeability zones (e.g. internal faults and fractures) that can promote fluid 657
migration and hydrocarbon leakage (Gamboa & Alves 2015). The pore-scale permeability variations 658
can only be inferred from well logs (e.g. Sun & Alves 2020), cores (e.g. Tripsanas et al. 2003), and 659
outcrops (Dykstra et al. 2011; Ogata et al. 2019). However, only 3D seismic reflection data allow three-660
dimensional analysis of the megaclast-scale, high-permeability zones (Gamboa & Alves 2015; Cox et 661
al. 2020). Therefore, integration of multi-scale data types is essential (e.g. Dykstra et al. 2011; Ogata 662
et al. 2014a), where possible, thereby enabling comprehensive analysis of the seal potential of MTDs 663
(e.g. Cardona et al. 2016). 664
Seal competence can vary longitudinally, from head to toe domains of the MTD, due to substrate 665
entrainment and shearing during transport (e.g. Cardona et al. 2020). The Haya Slide is a clay-rich MTD 666
that contains debritic facies in the inner part; this area may therefore represent a good hydrocarbon 667

seal when compared to the imbricated, but otherwise internally moderately undeformed blocks 668
present in the outer part (Figs. 3b and 4). 669
In the outer part, however, we also document notable along-strike variations in seismic facies (Fig. 4). 670
For instance, Area A is characterised by imbricated thrusts. If these thrusts lack clay smear and are 671
relatively permeable compared to the flanking, very fine-grained host rock, they may be conduits for 672
fluid migration, implying a higher seal risk for this area (i.e. low seal potential). Towards Area C, seismic 673
facies become more chaotic and transparent, suggesting a higher degree of deformation and internal 674
disaggregation. Seismic facies in Area C may thus suggest a better seal potential here than in Area A 675
because chaotic and transparent seismic facies have higher seal potential than blocky MTDs containing 676
preserved stratigraphy (Alves et al. 2014; Omeru 2014). Therefore, our results suggest that seal 677
potential of an MTD can vary along both depositional dip and strike within any one domain. 678
CONCLUSIONS 679
A recent mass-transport complex (MTD), the Haya Slide, has been characterised in the Makassar Strait 680
based on high-quality 3D seismic reflection and bathymetry data. The slide originated from the 681
collapsed flank of an anticline in the NE and transported radially to the SW. An along-strike analysis of 682
the toe domain of the slide has provided the following conclusions: 683
1. The inner part of the toe domain is characterised by a debrite, which passes, first, downdip 684
into megaclast-bearing debrite and, second, into coherent pop-up blocks towards the outer 685
part. The debrite and the pop-up blocks are genetically-related, bound by the same surfaces 686
(i.e. basal shear surface and seabed). Lateral loading by the debrite onto coherent strata 687
induced progressive downslope failure. Shortening estimates across the coherent strata show 688
8-14% of shortening, equating to 0.6-1.1 km of downslope translation. 689
2. The outer part of the toe domain exhibits the variations in: (i) depth and gradient of the basal 690
shear surface, (ii) trend and spacing of the pop-up blocks and their associated thrust faults, 691
and (iii) frontal geometry. A deep and relatively flat basal shear surface is associated with 692

frontal confinement, where steep ramp separates undeformed strata and the slide. A shallow 693
and upflow-dipping basal shear surface is associated with frontal emergence of the slide onto 694
the coeval basin floor. Between these two extremes, the frontal geometry is characterised by 695
staircase-like frontal ramps. Internal architecture of the slide may also be related to the 696
geometry of the basal shear surface, where highly disaggregated material can be associated 697
with the progressive downslope-shallowing basal shear surface. The interplay between drop 698
height (i.e. driving force), and along-strike depth variation of basal shear surface (i.e. resistive 699
force), likely to determine the lateral variability of frontal geometry of the slide. For instance, 700
where resistive force < driving force led to frontal emergence, otherwise the slide would be 701
frontally confined. 702
3. A detailed study of fold-and-thrust structures within the region of pop-up block shows along-703
strike variability of intra-MTD strain. This shows western and eastern regions of the toe 704
domain, separated by a sub-orthogonal shear zone, experiencing different amounts of 705
contraction. The western regime records a higher amount of strain, reflecting a more 706
advanced phase of structural growth, i.e. indicated by higher throw values and number of 707
thrusts, compared to its eastern counterpart. 708
4. MTDs commonly serve as seals in a petroleum system. However, previous studies have shown 709
that MTDs could have variable seal potential based on its axial domains (headwall to toe) due 710
to different degree of disaggregation and substrate entrainment. MTDs that are dominated 711
by mud-rich debrite are likely to have good seal potential because the combination of low-712
permeability matrix and clay mineral alignment reduces pore throat size and connectivity. In 713
contrast, MTDs that contain blocky facies with imbricated thrusts, could have lower seal 714
potential because larger pore-throat properties (if they are sand-rich), and open fracture 715
systems (e.g. thrusts that lack clay smear and are relatively more permeable than the 716
surrounding host rock) could aid fluid flow. The Haya Slide shows that the debritic and blocky 717
facies of an MTD could co-exist longitudinally (e.g. debrite in the headwall-to-translational 718

domains and fold-and-thrust systems in the toe domain). More importantly, the slide also 719
exhibits lateral variations of the internal facies (e.g. fold-and-thrust systems could laterally 720
pass to debrite within the toe domain). Therefore, these longitudinal and lateral variations of 721
facies, and associated rock properties, should be considered when assessing MTD seal 722
potential in petroleum systems. 723
ACKNOWLEDGEMENT 724
We thank Information and Data Centre, Ministry of Energy and Mineral Resources (PUSDATIN ESDM) 725
of the Republic of Indonesia for providing 3D seismic reflection and well data, and TGS for providing 726
multibeam bathymetry and near-seabed core data. Schlumberger, Geoteric and Midland Valley 727
Exploration for granting software licences to Imperial College London. The first author thanks the 728
Indonesia Endowment Fund for Education (LPDP) (Grant No.: 20160822019161) for its financial 729
support. We thank the editor, Giovanni Camanni, and the reviewers, Kei Ogata and an anonymous 730
reviewer, for constructive reviews that significantly improve the earlier version of this manuscript. 731
Thank you also to Michael Steventon and Sophie Pan for discussions on structural interpretation 732
techniques. 733
CONFLICT OF INTEREST 734
No conflict of interest declared. 735

REFERENCES 736
Algar, S., Milton, C., Upshall, H., Roestenburg, J. & Crevello, P. 2011. Mass-transport deposits of the 737 deepwater northwestern Borneo margin - Characterization from seismic-reflection, borehole, and 738 core data with implications for hydrocarbon exploration and exploitation. Mass-transport deposits in 739 deepwater settings: Society for Sedimentary Geology (SEPM) Special Publication 96, 7-38. 740
741 Allen, G.P. & Chambers, J.L. 1998. Sedimentation in the modern and Miocene Mahakam Delta. 742 Indonesian Petroleum Association, Jakarta. 743
744 Alsop, G.I. & Marco, S. 2014. Fold and fabric relationships in temporally and spatially evolving slump 745 systems: A multi-cell flow model. Journal of Structural Geology, 63, 27-49. 746
747 Alsop, G.I., Weinberger, R., Marco, S. & Levi, T. 2019. Fold and Thrust Systems in Mass-Transport 748 Deposits Around the Dead Sea Basin. Submarine Landslides: Subaqueous Mass Transport Deposits 749 from Outcrops to Seismic Profiles, 139-153. 750
751 Alves, T.M. 2015. Submarine slide blocks and associated soft-sediment deformation in deep-water 752 basins: A review. Marine and Petroleum Geology, 67, 262-285. 753
754 Alves, T.M. & Cartwright, J.A. 2009. Volume balance of a submarine landslide in the Espírito Santo 755 Basin, offshore Brazil: Quantifying seafloor erosion, sediment accumulation and depletion. Earth and 756 Planetary Science Letters, 288, 572-580, http://doi.org/10.1016/j.epsl.2009.10.020. 757
758 Alves, T.M., Kurtev, K., Moore, G.F. & Strasser, M. 2014. Assessing the internal character, reservoir 759 potential, and seal competence of mass-transport deposits using seismic texture: A geophysical and 760 petrophysical approach. AAPG Bulletin, 98, 793-824, http://doi.org/10.1306/09121313117. 761
762 Arfai, J., Lutz, R., Franke, D., Gaedicke, C. & Kley, J. 2016. Mass-transport deposits and reservoir quality 763 of Upper Cretaceous Chalk within the German Central Graben, North Sea. International Journal of 764 Earth Sciences, 105, 797-818. 765
766 Armandita, C., Morley, C.K. & Rowell, P. 2015. Origin, structural geometry, and development of a giant 767 coherent slide: The South Makassar Strait mass transport complex. Geosphere, 11, 376-403, 768 http://doi.org/10.1130/ges01077.1. 769
770 Bennett, R.H., Bryant, W.R. & Hulbert, M.H. 1991. Microstructure of fine-grained sediments: From mud 771 to shale. Springer Science & Business Media. 772
773 Brackenridge, R., Nicholson, U., Sapiie, B., Stow, D. & Tappin, D. 2020. Indonesian Throughflow as a 774 preconditioning mechanism for submarine landslides in the Makassar Strait. Geological Society, 775 London, Special Publications, 500. 776
777

Bull, S. & Cartwright, J.A. 2019. Line length balancing to evaluate multi-phase submarine landslide 778 development: an example from the Storegga Slide, Norway. Geological Society, London, Special 779 Publications, 500. 780
781 Bull, S., Cartwright, J. & Huuse, M. 2009. A review of kinematic indicators from mass-transport 782 complexes using 3D seismic data. Marine and Petroleum Geology, 26, 1132-1151, 783 http://doi.org/10.1016/j.marpetgeo.2008.09.011. 784
785 Burberry, C.M. 2015. Spatial and temporal variation in penetrative strain during compression: Insights 786 from analog models. Lithosphere, 7, 611-624. 787
788 Butler, R. & McCaffrey, W. 2010. Structural evolution and sediment entrainment in mass-transport 789 complexes: outcrop studies from Italy. Journal of the Geological Society, 167, 617-631. 790
791 Cardona, S., Wood, L.J., Day-Stirrat, R.J. & Moscardelli, L. 2016. Fabric development and pore-throat 792 reduction in a mass-transport deposit in the Jubilee Gas Field, Eastern Gulf of Mexico: consequences 793 for the sealing capacity of MTDs Submarine Mass Movements and their Consequences. Springer, 27-794 37. 795
796 Cardona, S., Wood, L.J., Dugan, B., Jobe, Z. & Strachan, L.J. 2020. Characterization of the Rapanui mass-797 transport deposit and the basal shear zone: Mount Messenger Formation, Taranaki Basin, New 798 Zealand. Sedimentology, http://doi.org/10.1111/sed.12697. 799
800 Cartwright, J.A., Trudgill, B.D. & Mansfield, C.S. 1995. Fault growth by segment linkage: an explanation 801 for scatter in maximum displacement and trace length data from the Canyonlands Grabens of SE Utah. 802 Journal of Structural Geology, 17, 1319-1326. 803
804 Chopra, S. & Marfurt, K.J. 2007. Seismic attributes for prospect identification and reservoir 805 characterization. Society of Exploration Geophysicists Tulsa, Oklahoma. 806
807 Clare, M., Chaytor, J., Dabson, O., Gamboa, D., Georgiopoulou, A., Eady, H., Hunt, J., Jackson, C., et al. 808 2018. A consistent global approach for the morphometric characterization of subaqueous landslides. 809 Geological Society, London, Special Publications, 477, SP477. 415. 810
811 Cloke, I., Milsom, J. & Blundell, D. 1999. Implications of gravity data from East Kalimantan and the 812 Makassar Straits: a solution to the origin of the Makassar Straits? Journal of Asian Earth Sciences, 17, 813 61-78. 814
815 Cox, D.R., Huuse, M., Newton, A.M., Gannon, P. & Clayburn, J. 2020. Slip sliding away: Enigma of large 816 sandy blocks within a gas-bearing mass transport deposit, offshore northwestern Greenland. AAPG 817 Bulletin, 104, 1011-1043. 818
819 Crawford, B. 1998. Experimental fault sealing: shear band permeability dependency on cataclastic 820 fault gouge characteristics. Geological Society, London, Special Publications, 127, 27-47. 821
822

Dahlstrom, C. 1969. Balanced cross sections. Canadian Journal of Earth Sciences, 6, 743-757. 823
824 Dalton, T., Paton, D., Oldfield, S., Needham, D. & Wood, A. 2017. The importance of missing strain in 825 Deep Water Fold and Thrust Belts. Marine and Petroleum Geology, 82, 163-177. 826
827 Daly, M., Cooper, M., Wilson, I., Smith, D.t. & Hooper, B. 1991. Cenozoic plate tectonics and basin 828 evolution in Indonesia. Marine and Petroleum Geology, 8, 2-21. 829
830 Dott, R. 1963. Dynamics of subaqueous gravity depositional processes. AAPG Bulletin, 47, 104-128. 831
832 Dykstra, M., Garyfalou, K., Kertznus, V., Kneller, B., Milana, J.P., Molinaro, M., Szuman, M. & 833 Thompson, P. 2011. Mass-transport deposits: Combining outcrop studies and seismic forward 834 modeling to understand lithofacies distributions, deformations, and their seismic stratigraphic 835 expression. SEPM Special Publication, 96, 293-310. 836
837 Eckersley, A.J., Lowell, J. & Szafian, P. 2018. High-definition frequency decomposition. Geophysical 838 Prospecting, 66, 1138-1143. 839
840 Ellis, M.A. & Dunlap, W.J. 1988. Displacement variation along thrust faults: Implications for the 841 development of large faults. Journal of Structural Geology, 10, 183-192. 842
843 Farrell, S.G. 1984. A dislocation model applied to slump structures, Ainsa Basin, South Central 844 Pyrenees. Journal of Structural Geology, 6, 727-736. 845
846 Festa, A., Ogata, K., Pini, G.A., Dilek, Y. & Alonso, J.L. 2016. Origin and significance of olistostromes in 847 the evolution of orogenic belts: A global synthesis. Gondwana Research, 39, 180-203. 848
849 Fossen, H. 2016. Structural geology. Cambridge University Press. 850
851 Frey-Martinez, J., Cartwright, J. & Hall, B. 2005. 3D seismic interpretation of slump complexes: 852 examples from the continental margin of Israel. Basin Research, 17, 83-108, 853 http://doi.org/10.1111/j.1365-2117.2005.00255.x. 854
855 Frey-Martínez, J., Cartwright, J. & James, D. 2006. Frontally confined versus frontally emergent 856 submarine landslides: A 3D seismic characterisation. Marine and Petroleum Geology, 23, 585-604, 857 http://doi.org/10.1016/j.marpetgeo.2006.04.002. 858
859 Gamboa, D. & Alves, T.M. 2015. Three-dimensional fault meshes and multi-layer shear in mass-860 transport blocks: Implications for fluid flow on continental margins. Tectonophysics, 647, 21-32. 861
862 Gamboa, D., Alves, T. & Cartwright, J. 2011. Distribution and characterization of failed (mega) blocks 863 along salt ridges, southeast Brazil: Implications for vertical fluid flow on continental margins. Journal 864 of Geophysical Research: Solid Earth, 116. 865
866

Gee, M., Gawthorpe, R. & Friedmann, J. 2005. Giant striations at the base of a submarine landslide. 867 Marine Geology, 214, 287-294. 868
869 Gee, M., Uy, H., Warren, J., Morley, C. & Lambiase, J. 2007. The Brunei slide: a giant submarine 870 landslide on the North West Borneo Margin revealed by 3D seismic data. Marine Geology, 246, 9-23. 871
872 Gee, M.J., Masson, D.G., Watts, A.B. & Mitchell, N.C. 2001. Passage of debris flows and turbidity 873 currents through a topographic constriction: seafloor erosion and deflection of flow pathways. 874 Sedimentology, 48, 1389-1409. 875
876 Guntoro, A. 1999. The formation of the Makassar Strait and the separation between SE Kalimantan 877 and SW Sulawesi. Journal of Asian Earth Sciences, 17, 79-98. 878
879 Higgins, S., Clarke, B., Davies, R.J. & Cartwright, J. 2009. Internal geometry and growth history of a 880 thrust-related anticline in a deep water fold belt. Journal of Structural Geology, 31, 1597-1611. 881
882 Hodgson, D., Brooks, H., Ortiz-Karpf, A., Spychala, Y., Lee, D. & Jackson, C.-L. 2018. Entrainment and 883 abrasion of megaclasts during submarine landsliding and their impact on flow behaviour. Geological 884 Society, London, Special Publications, 477, SP477. 426. 885
886 Huiqi, L., McClay, K. & Powell, D. 1992. Physical models of thrust wedges Thrust tectonics. Springer, 887 71-81. 888
889 Huvenne, V.A., Croker, P.F. & Henriet, J.P. 2002. A refreshing 3D view of an ancient sediment collapse 890 and slope failure. Terra Nova, 14, 33-40. 891
892 Ikari, M.J. & Saffer, D.M. 2012. Permeability contrasts between sheared and normally consolidated 893 sediments in the Nankai accretionary prism. Marine Geology, 295, 1-13. 894
895 Jackson, C.A. 2011. Three-dimensional seismic analysis of megaclast deformation within a mass 896 transport deposit; implications for debris flow kinematics. Geology, 39, 203-206. 897
898 Jenner, K.A., Piper, D.J., Campbell, D.C. & Mosher, D.C. 2007. Lithofacies and origin of late Quaternary 899 mass transport deposits in submarine canyons, central Scotian Slope, Canada. Sedimentology, 54, 19-900 38. 901
902 Joanne, C., Lamarche, G. & Collot, J.Y. 2013. Dynamics of giant mass transport in deep submarine 903 environments: the Matakaoa Debris Flow, New Zealand. Basin Research, 25, 471-488. 904
905 Koyi, H. 1995. Mode of internal deformation in sand wedges. Journal of Structural Geology, 17, 293-906 300. 907
908

Koyi, H.A., Sans, M., Teixell, A., Cotton, J. & Zeyen, H. 2004. The significance of penetrative strain in 909 the restoration of shortened layers—Insights from sand models and the Spanish Pyrenees. In: McClay, 910 K.R. (ed) Thrust tectonics and hydrocarbon systems. AAPG Memoir, 82, p. 207-222. 911
912 Lastras, G., Canals, M., Urgeles, R., Hughes-Clarke, J.E. & Acosta, J. 2004. Shallow slides and pockmark 913 swarms in the Eivissa Channel, western Mediterranean Sea. Sedimentology, 51, 837-850. 914
915 Liu, S. & Dixon, J.M. 1995. Localization of duplex thrust-ramps by buckling: analog and numerical 916 modelling. Journal of Structural Geology, 17, 875-886. 917
918 Mandl, G. & Crans, W. 1981. Gravitational gliding in deltas. Geological Society, London, Special 919 Publications, 9, 41-54. 920
921 Martinsen, O. & Bakken, B. 1990. Extensional and compressional zones in slumps and slides in the 922 Namurian of County Clare, Ireland. Journal of the Geological Society, 147, 153-164. 923
924 Masson, D., Huggett, Q. & Brunsden, D. 1993. The surface texture of the Saharan debris flow deposit 925 and some speculations on submarine debris flow processes. Sedimentology, 40, 583-598. 926
927 Mayer, B. & Damm, P. 2012. The Makassar Strait throughflow and its jet. Journal of Geophysical 928 Research: Oceans, 117. 929
930 Moernaut, J. & De Batist, M. 2011. Frontal emplacement and mobility of sublacustrine landslides: 931 results from morphometric and seismostratigraphic analysis. Marine Geology, 285, 29-45. 932
933 Moore, G.F., Saffer, D., Studer, M. & Pisani, P.C. 2011. Structural restoration of thrusts at the toe of 934 the Nankai Trough accretionary prism off Shikoku Island, Japan: Implications for dewatering processes. 935 Geochemistry, Geophysics, Geosystems, 12. 936
937 Moscardelli, L. & Wood, L. 2008. New classification system for mass transport complexes in offshore 938 Trinidad. Basin Research, 20, 73-98, http://doi.org/10.1111/j.1365-2117.2007.00340.x. 939
940 Nardin, T.R., Hein, F., Gorsline, D.S. & Edwards, B. 1979. A review of mass movement processes 941 sediment and acoustic characteristics, and contrasts in slope and base-of-slope systems versus 942 canyon-fan-basin floor systems. In: Doyle, L.E. & Pilkey, O.H. (eds) Geology of continental slopes. Soc. 943 Econ. Paleont. and Min. Special Publication 27, 61-74. 944
945 Nemec, W. 1991. Aspects of sediment movement on steep delta slopes. In: Colella, A. & Prior, D.B. 946 (eds) Coarsed-Grained Deltas. International Association of Sedimentologists, 10, 29-73. 947
948 Ogata, K., Mutti, E., Pini, G.A. & Tinterri, R. 2012. Mass transport-related stratal disruption within 949 sedimentary mélanges: examples from the northern Apennines (Italy) and south-central Pyrenees 950 (Spain). Tectonophysics, 568, 185-199. 951
952

Ogata, K., Mountjoy, J., Pini, G.A., Festa, A. & Tinterri, R. 2014a. Shear zone liquefaction in mass 953 transport deposit emplacement: a multi-scale integration of seismic reflection and outcrop data. 954 Marine Geology, 356, 50-64. 955
956 Ogata, K., Festa, A., Pini, G., Pogačnik, Ž. & Lucente, C. 2019. Substrate deformation and incorporation 957 in sedimentary mélanges (olistostromes): Examples from the northern Apennines (Italy) and 958 northwestern Dinarides (Slovenia). Gondwana Research, 74, 101-125. 959
960 Ogata, K., Pogačnik, Ž., Pini, G.A., Tunis, G., Festa, A., Camerlenghi, A. & Rebesco, M. 2014b. The 961 carbonate mass transport deposits of the Paleogene Friuli Basin (Italy/Slovenia): internal anatomy and 962 inferred genetic processes. Marine Geology, 356, 88-110. 963
964 Omeru, T. 2014. Mass Transport Deposits: Implications for Reservoir Seals. (PhD Thesis) Cardiff 965 University, Cardiff 966
967 Omeru, T. & Cartwright, J.A. 2019. The efficacy of kinematic indicators in a complexly deformed Mass 968 Transport Deposit: Insights from the deepwater Taranaki Basin, New Zealand. Marine and Petroleum 969 Geology, 106, 74-87. 970
971 Omosanya, K.O. & Alves, T.M. 2013. A 3-dimensional seismic method to assess the provenance of 972 Mass-Transport Deposits (MTDs) on salt-rich continental slopes (Espírito Santo Basin, SE Brazil). 973 Marine and Petroleum Geology, 44, 223-239. 974
975 Ortiz-Karpf, A., Hodgson, D.M., Jackson, C.A.-L. & McCaffrey, W.D. 2017. Influence of Seabed 976 Morphology and Substrate Composition On Mass-Transport Flow Processes and Pathways: Insights 977 From the Magdalena Fan, Offshore Colombia. Journal of Sedimentary Research, 87, 189-209. 978
979 Partyka, G., Gridley, J. & Lopez, J. 1999. Interpretational applications of spectral decomposition in 980 reservoir characterization. The Leading Edge, 18, 353-360. 981
982 Piper, D.J.W., Pirmez, C., Manley, P.L., Long, D., Flood, R.D., Normark, W.R. & Showers, W. 1997. Mass 983 Transport Deposits of the Amazon Fan. In: Flood, R.D., Piper, D.J.W., Klaus, A. & Peterson, L.C. (eds.) 984 Ocean Drilling Program, Scientific Results, 109-146. 985
986 Posamentier, H.W. & Kolla, V. 2003. Seismic geomorphology and stratigraphy of depositional elements 987 in deep-water settings. Journal of Sedimentary Research, 73, 367-388. 988
989 Posamentier, H.W. & Martinsen, O.J. 2011. The character and genesis of submarine mass-transport 990 deposits: insights from outcrop and 3D seismic data. Mass-transport deposits in deepwater settings: 991 Society for Sedimentary Geology (SEPM) Special Publication 96, 7-38. 992
993 Puspita, S.D., Hall, R. & Elders, C.F. 2005. Structural styles of the offshore West Sulawesi fold belt, 994 North Makassar Straits, Indonesia. Thirtieth IPA Annual Convention & Exhibition. Indonesian 995 Petroleum Association (IPA), Jakarta. 996
997

Roberts, H.H. & Sydow, J. 2003. Late Quaternary stratigraphy and sedimentology of the offshore 998 Mahakam delta, east Kalimantan (Indonesia). SEPM Special Publication, 76, 125-145. 999
1000 Sanderson, D.J. & Marchini, W. 1984. Transpression. Journal of Structural Geology, 6, 449-458. 1001
1002 Sawyer, D.E., Flemings, P.B., Shipp, R.C. & Winker, C.D. 2007. Seismic geomorphology, lithology, and 1003 evolution of the late Pleistocene Mars-Ursa turbidite region, Mississippi Canyon area, northern Gulf 1004 of Mexico. AAPG Bulletin, 91, 215-234. 1005
1006 Schnellmann, M., Anselmetti, F.S., Giardini, D. & McKENZIE, J.A. 2005. Mass movement-induced fold-1007 and-thrust belt structures in unconsolidated sediments in Lake Lucerne (Switzerland). Sedimentology, 1008 52, 271-289. 1009
1010 Schreurs, G., Buiter, S.J., Boutelier, J., Burberry, C., Callot, J.-P., Cavozzi, C., Cerca, M., Chen, J.-H., et 1011 al. 2016. Benchmarking analogue models of brittle thrust wedges. Journal of Structural Geology, 92, 1012 116-139. 1013
1014 Shanmugam, G. 2012. Origin and Classification of Sandy Mass-Transport Deposits Handbook of 1015 Petroleum Exploration and Production. Elsevier, 9, 41-65. 1016
1017 Shanmugam, G. 2015. The landslide problem. Journal of Palaeogeography, 4, 109-166. 1018
1019 Sobiesiak, M.S., Kneller, B., Alsop, G.I. & Milana, J.P. 2016. Internal deformation and kinematic 1020 indicators within a tripartite mass transport deposit, NW Argentina. Sedimentary Geology, 1021 http://doi.org/10.1016/j.sedgeo.2016.04.006. 1022
1023 Sobiesiak, M.S., Kneller, B., Alsop, G.I. & Milana, J.P. 2018. Styles of basal interaction beneath mass 1024 transport deposits. Marine and Petroleum Geology, 98, 629-639. 1025
1026 Sobiesiak, M.S., Buso, V.V., Kneller, B., Alsop, G.I. & Milana, J.P. 2019. Block Generation, Deformation, 1027 and Interaction of Mass-Transport Deposits With the Seafloor: An Outcrop-Based Study of the 1028 Carboniferous Paganzo Basin (Cerro Bola, NW Argentina). Submarine Landslides: Subaqueous Mass 1029 Transport Deposits from Outcrops to Seismic Profiles, 91-104. 1030
1031 Steventon, M.J., Jackson, C.A., Hodgson, D.M. & Johnson, H.D. 2019. Strain analysis of a seismically 1032 imaged mass-transport complex, offshore Uruguay. Basin Research, 31, 600-620. 1033
1034 Strachan, L.J. 2002. Geometry to genesis: a comparative field study of slump deposits and their modes 1035 of formation. University of Wales. Cardiff. 1036
1037 Sun, Q. & Alves, T. 2020. Petrophysics of fine-grained mass-transport deposits: A critical review. 1038 Journal of Asian Earth Sciences, 192, 104291, https://doi.org/10.1016/j.jseaes.2020.104291. 1039
1040

Takagi, H., Pratama, M.B., Kurobe, S., Esteban, M., Aránguiz, R. & Ke, B. 2019. Analysis of generation 1041 and arrival time of landslide tsunami to Palu City due to the 2018 Sulawesi earthquake. Landslides, 16, 1042 983-991. 1043
1044 Tappin, D., Watts, P., McMurtry, G., Lafoy, Y. & Matsumoto, T. 2001. The Sissano, Papua New Guinea 1045 tsunami of July 1998—offshore evidence on the source mechanism. Marine Geology, 175, 1-23. 1046
1047 Totake, Y., Butler, R.W., Bond, C.E. & Aziz, A. 2018. Analyzing structural variations along strike in a 1048 deep-water thrust belt. Journal of Structural Geology, 108, 213-229. 1049
1050 Trincardi, F. & Argnani, A. 1990. Gela submarine slide: a major basin-wide event in the Plio-Quaternary 1051 foredeep of Sicily. Geo-Marine Letters, 10, 13. 1052
1053 Tripsanas, E., Bryant, W. & Prior, D. 2003. Structural characteristics of cohesive gravity-flow deposits, 1054 and a sedimentological approach on their flow mechanisms Submarine Mass Movements and Their 1055 Consequences. Springer, 129-136. 1056
1057 Van Der Merwe, W.C., Hodgson, D.M. & Flint, S.S. 2011. Origin and terminal architecture of a 1058 submarine slide: a case study from the Permian Vischkuil Formation, Karoo Basin, South Africa. 1059 Sedimentology, 58, 2012-2038, http://doi.org/10.1111/j.1365-3091.2011.01249.x. 1060
1061 Vanneste, M., Forsberg, C.F., Glimsdal, S., Harbitz, C.B., Issler, D., Kvalstad, T.J., Løvholt, F. & Nadim, F. 1062 2013. Submarine landslides and their consequences: what do we know, what can we do? Landslide 1063 science and practice. Springer, 5-17. 1064
1065 Walsh, J.J. & Watterson, J. 1991. Geometric and kinematic coherence and scale effects in normal fault 1066 systems. Geological Society, London, Special Publications, 56, 193-203. 1067
1068 Watt, S., Talling, P., Vardy, M., Masson, D., Henstock, T., Hühnerbach, V., Minshull, T., Urlaub, M., et 1069 al. 2012. Widespread and progressive seafloor-sediment failure following volcanic debris avalanche 1070 emplacement: Landslide dynamics and timing offshore Montserrat, Lesser Antilles. Marine Geology, 1071 323, 69-94. 1072
1073 Weimer, P. & Shipp, C. 2004. Mass Transport Complexes: Musing on past uses and suggestions for 1074 future directions. Offshore Technology Conference, Houston. 1075
1076 Zeng, H., Henry, S.C. & Riola, J.P. 1998. Stratal slicing, Part II: Real 3-D seismic data. Geophysics, 63, 1077 514-522. 1078

FIGURE CAPTIONS 1079
Fig. 1. Geological setting and location map of the study area. (a) The Makassar Strait is surrounded by 1080
tectonically active regions, where Eurasia, Indo-Australia, Philippine Sea and Pacific plates interact. A 1081
strong ocean current flowing from Pacific towards Indian oceans, Indonesia Throughflow (ITF), flows 1082
through the Makassar Strait (red arrow). (b) The study area is located in the southern end of Labani 1083
Channel, that connects the North and South Makassar basins. Major structural features include fault 1084
zones (Palu-Koro and Paternoster fault zones) and fold-thrust belts (e.g. Brackenridge et al., 2020; 1085
Cloke et al., 1999). The fold-thrust belts are divided into the Northern (NSP), Central (CSP) and 1086
Southern (SSP) structural provinces (Puspita et al., 2005). The dark blue line marks the extent of 3D 1087
seismic reflection data, and the green line outlines the area covered by multibeam data. Two green 1088
dots represent wells within the seismic reflection data. The small, yellow area marks the extent of the 1089
Haya Slide (see Fig. 2). Blue and red dots are the location of near-seabed sediment cores of TGS009 1090
and TGS194, respectively. (c) A cartoon cross-section across the Makassar Strait showing MTDs 1091
accumulation in the basin and their related sources, i.e. prograding shelf (related to Mahakam Delta) 1092
in the W and collapse of anticline flanks in the E. Inferred based on Puspita et al. (2005) and 1093
Brackenridge et al. (2020). (d) A seismic line correlating the Haya Slide (yellow-shaded) and the two 1094
wells (i.e. XS-1 and XR-1). 1095
Fig. 2. Seabed topography, as defined by this bathymetry map, shows the external geometry of the 1096
Haya Slide. The slide originated from the NE (collapse of the southern flank of a thrust-cored anticline) 1097
and transported towards the SW. This study focuses on the toe domain of the slide (red outline), which 1098
is mostly imaged by the 3D seismic reflection data (blue outline). The toe domain of the slide has a 1099
radial geometry, where the Eastern and Northern lateral margins trending N-S and E-W, respectively. 1100
Fig. 3. Key maps of the Haya Slide. (a) Thickness map covering the toe domain of the Haya Slide. The 1101
slide is thickest (200 m) in the southern part and thins toward the Northern Lateral Margin. Laterally, 1102
three areas can be defined based on its frontal geometry (i.e. Area A, B, and C). An inset map showing 1103
the focus area of the slide, captured by 3D seismic reflection data. (b) Spectral decomposition map 1104
showing internal seismic facies of the slide. Axially, the slide can be divided into inner and outer parts 1105
with ‘soft’ boundary between them. The inner part is dominated by debrite containing megaclasts, 1106
and the outer part is dominated by pop-up blocks. 1107
Fig. 4. Seismic sections across Area A, B, and C, showing similar general characteristics, where debrite 1108
dominates the inner part, and pop-up blocks dominate the outer part. However, the three areas have 1109
different characteristics of frontal margin. (a) Area A is characterised by frontal confinement and 1110
coherent pop-up blocks. Translation distance was estimated by calculating shortening amount at H1 1111

and 2, i.e. 8-14% shortening equating to 0.6-1.1 km. (b) Area B is characterised by frontal ramps with 1112
more chaotic reflections adjacent to frontal margin, and less coherent pop-up blocks. (c) Area C is 1113
characterised by frontal emergence and a broad bulge on the seabed above steeply-inclined 1114
detachment surface. 1115
Fig. 5. Deformation ahead of the parent flow. (a) Variance time-slice showing distributed shear zone 1116
downdip from an intact block. Thrusts forming this distributed shear zone laterally propagate 1117
eastwards. (b) Seismic section showing distributed shear zone, showing deformed strata ahead 1118
immediately downdip from the intact block. Folded strata ahead of the BSS, interpreted as an 1119
unformed thrust. 1120
Fig. 6. Relationship between basal shear surface morphology, and seabed in Area C and the adjacent 1121
area. (a) Basal shear surface structure map showing slope gradient break in Area C. (b) Seabed 1122
structure map showing a broad area of high seabed relief (seabed bulge). (c) Spatial relationship 1123
between slope gradient break on the BSS and the occurrence of the seabed bulge, leading to frontal 1124
emergence of the slide. (d) Seismic section adjacent to Northern Lateral Margin showing closely-1125
spaced pop-up blocks and frontal confinement of the slide. 1126
Fig. 7. The boundary between Areas B and C. (a) Variance along the BSS (50 ms windowed above) 1127
showing an abrupt boundary between Area B and C. (b) A ramp marks the boundary between Area B 1128
and C, and expressed as positive relief on the seabed. 1129
Fig. 8. Along-strike quantitative analysis of Pop-up Block 3 (see Fig. 4a). (a) Time structure map of H2 1130
(see Fig. 4a) and associated faults. (b) Variance time-slice showing lateral extent of Pop-up Block 3. (c) 1131
Throw vs. Distance (T-x) plot of fore- and backthrusts bounding Pop-up Block 3. Shear zone separates 1132
two bodies that have different amount of strain, i.e. the area to the west of the shear zone 1133
experienced more contraction as shown by cumulative throw as compared the area eastwards from 1134
the shear zone. (d-f) Seismic sections showing along-strike variability of faults bounding Pop-up Block 1135
3. 1136
Fig. 9. Schematic model of emplacement processes of the Haya Slide. (a) Debris flow, originated from 1137
failed anticline (see Fig. 2) entered the basin, deformed the seabed, and then entrained substrate into 1138
the flow. (b) Substrate erosion and entrainment continued to occur up to the point where the debris 1139
flow did not have sufficient shear stress for substrate entrainment. Thus, the remaining exerted stress 1140
deformed substrate ahead of the flow (i.e. lateral loading). (c) Subsequent compressional deformation 1141
occurred, allowing a relatively short translation distance (0.61 to 1.06 km) in the toe domain, which 1142
has different frontal geometries along strike. 1143

Fig. 10. A summary of downdip and along-strike variations in Areas A, B and C of the Haya Slide. Note 1144
the lateral changes in structural style and internal facies characteristics. 1145
Fig. 11. Evolution of basal shear surface adjacent to the toewall of the Haya Slide, showing 1146
development of (a) frontal confinement in Area A, (b) frontal emergence in Area C, and (c) staircase-1147
like frontal ramps in Area B, which is an intermediate (transitional) style between frontal confinement 1148
and emergence. 1149
Fig. 12. A simplified schematic depiction of along-strike strain variability within PB-3 (see Figs. 3b, 4a 1150
and 8). (a) An initial stage of PB-3 formation, where it experienced similar amount of stress along strike 1151
forming a through-going, master forethrust (F-1). (b) Intra-MTD velocity perturbations led to the 1152
formation of a curved, sub-orthogonal shear zone, resulting in the formation of second-order flow 1153
cells (i.e. eastern and western cells), and along-strike stress partitioning by the shear zone led to the 1154
formation of PB-3a-c. (c) The eastern cell halted earlier than the western cell due to closer frontal 1155
confinement (i.e. Area A), so that the still-translating western cell experienced more strain as indicated 1156
by the higher number of thrusts and cumulative throw values. Inspired by Totake et al. (2018). 1157

Figure 1 1158
1159
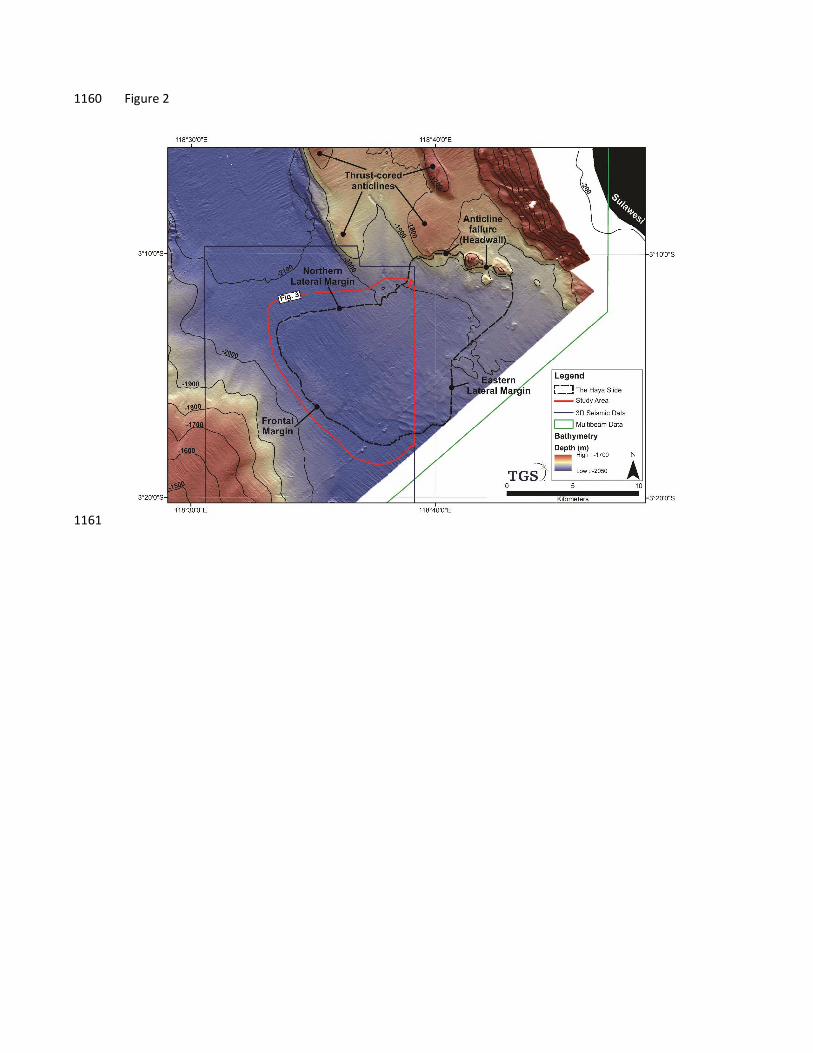
Figure 2 1160
1161

Figure 3 1162
1163

Figure 4 1164
1165

Figure 5 1166
1167

Figure 6 1168
1169

Figure 7 1170
1171

Figure 8 1172
1173

Figure 9 1174
1175

Figure 10 1176
1177

Figure 11 1178
1179

Figure 12 1180
1181