it initiative roi tool-nm
TRANSCRIPT

document.xls User Guide 1 of 30
Business Case ROI Workbook for IT Initiatives
On This WorksheetWorkbook Table of ContentsKey FeaturesModel Components / FlowchartInstructionsDisclaimerTerms of Use / Use Rights / End-User License Agreement (EULA)Support
Workbook Table of Contents
Title Description
Organizational Profile
Initiative Descriptions
Implementation Costs
IT Labor TCO Savings Estimates IT labor TCO (as-is and to-be) and TCO savings enabled by the solution
Direct Cost Savings Estimates non-labor direct IT and business cost savings enabled by the solution.
User Productivity Benefits
Revenue Impact
Financial Analysis
Key Features
Worksheet Name
Profile
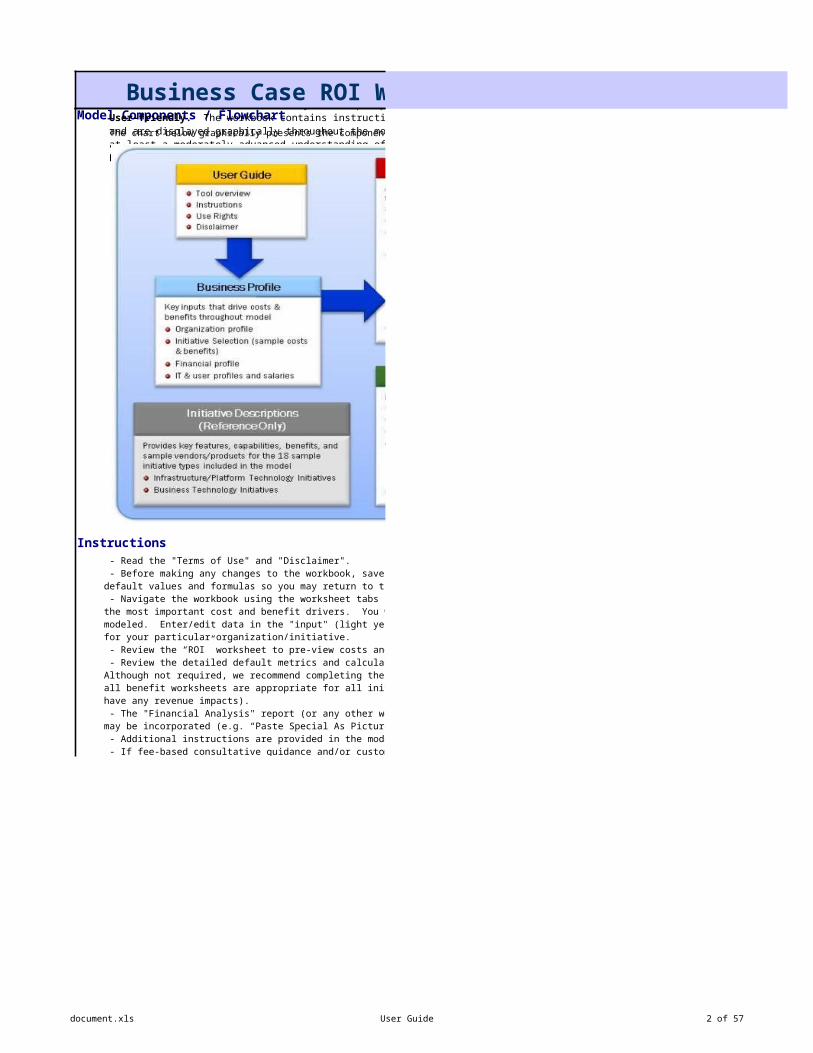
Collects information about: organization size, location, and industry; end user types and labor costs; and the initiative to be modeled. This information is used to estimate default values for all costs and benefits throughout the rest of the model. It displays a summary of costs and benefits of the scenario modeled.
InitiativesFor Reference Only: provides key features, capabilities, benefits, and common vendors/products for the 18 sample initiative types included in the model.
CostsEstimates all costs (direct and indirect) needed to implement, fully adopt, and support the solution. Cost categories include: hardware, software, IT labor, and user labor, including one-time and annual on-going costs.
IT Labor
Direct Savings
Productivity
Estimates user time/labor savings enabled by the solution. First estimates the amount of time users spend conducting common business activities then estimates how much the solution is expected to increase the efficiency of conducting key activities. The time savings is discounted using a "Productivity Conversion Factor", then converted into $ value.
RevenueEstimates how and how much the solution is expected to increase revenue. The benefit is the profit on the incremental revenue.
KPIs Key Performance Indicator Assessment (Optional)
Assessment of how the solution may impact a variety of business KPIs. In this model, these KPI changes are not converted into financial benefits.
ROI Summary of costs & benefits by type; Cash flow analysis; calculation of ROI, payback period, NPV, and IRR; and graphs
Supports most types of enterprise-scale technology initiatives. Includes sample cost and benefit data for 18 common initiative typesComprehensive assessment of initiative costs and benefitsCosts: hardware; software; IT labor, training, and services; and user labor and trainingBenefits: IT labor TCO savings, other direct cost savings, user productivity benefits, revenue growth, and non-financial key performance indicatorsCalculates annual on-going IT Labor TCO (total cost of ownership)Comprehensive financial analysis. Calculates project cash flow, cost-benefit analysis, ROI, NPV, IRR, and payback period Supports rapid (30 minute) or detailed (3+ day) assessments. This model was designed to provide either a rapid assessment (by just entering/selecting basic organizational profile and initiative information) or a very detailed (3+ day) assessment by modifying hundreds of detailed inputs.Protected, yet customizable: Essentially all values can be modified. Many custom cost and benefit items can be added. Formulas and other areas of the model that should not be modified are protected (locked) to maintain intended functionality. HCR can provide additional fee-based customization, if desired. Based on industry-standard calculations and industry-leading methodologies. It is as transparent as possible so the user is able to understand how the costs and benefits are calculated. Provides research-based default values. Default values (labor costs, user type mix, financial information, etc.) are provided based on your industry, geography, organization size and initiative type to enable more rapid assessments. Extensive research was conducted to find highly reputation sources for these. Data/estimate sources are listed. You may overwrite any of the pre-populated defaults.User-friendly. The workbook contains instructions, descriptions, and references. Results are updated real-time and are displayed graphically throughout the model. Although the model is user-friendly, we recommend users have at least a moderately-advanced understanding of business value concepts to develop a credible business case.Free download. No registration required.
This tool is a comprehensive general-purpose business value model (ROI calculator) to support the development of business cases for enterprise-scale information technology-based projects. It provides a robust structure to help organizations assess the business value (costs, benefits, TCO, and ROI) of technology projects/initiatives. This workbook can be used as a standard corporate business case template for technology-based initiatives. It can also be used by consultants and technology vendors to articulate the business value of their products and solutions.
document.xls User Guide 2 of 30
Business Case ROI Workbook for IT InitiativesModel Components / Flowchart
Instructions
The chart below graphically presents the components of the model.
- Read the "Terms of Use" and "Disclaimer". - Before making any changes to the workbook, save the workbook under a different name. This will preserve the original default values and formulas so you may return to them at a later time. - Navigate the workbook using the worksheet tabs at the bottom. Start with the "Profile" tab. This worksheet contains the most important cost and benefit drivers. You will also see a summary view of the costs and benefits of the scenario modeled. Enter/edit data in the "input" (light yellow) cells. Edit (overwrite) the default values to customize results for your particular organization/initiative. - Review the “ROI” worksheet to pre-view costs and benefits. - Review the detailed default metrics and calculations in the "Costs" (red tab) and Benefit (green tabs) worksheets. Although not required, we recommend completing the “Costs” worksheet first to more clearly define the initiative. Not all benefit worksheets are appropriate for all initiative types (for example, some infrastructure initiatives may not have any revenue impacts). - The "Financial Analysis" report (or any other worksheet) can be printed or saved as PDF/XPS. Portions of the model may be incorporated (e.g. “Paste Special As Picture”) into a more comprehensive business case-type report. - Additional instructions are provided in the model - If fee-based consultative guidance and/or customizations are desired, contact HCR.

document.xls User Guide 3 of 30
Business Case ROI Workbook for IT InitiativesDisclaimer
Terms of Use / Use Rights / End-User License Agreement (EULA)
Support
© Copyright, 2006-2008, Hall Consulting & Research LLC, All Rights Reserved. www.hallcr.com
This tool is intended to help guide organizations in better understanding approximate/potential costs and benefits. Due to limitations of simulation tools, actual results may differ significantly than results estimated in this tool. Investment decisions should not be based on the results of this model alone -- it is not intended to be a substitute for professional advice.
This information is provided to you as a tool “as is” with the understanding that there are no representations or warranties of any kind either express or implied.
In no event shall HCR or suppliers be liable for any damages, including those arising as a result of HCR or supplier negligence, whether those damages are direct, consequential, incidental, or special, flowing from your use of or inability to use the tool, or information provided herewith, or results of the tool's use, even if HCR or suppliers has been advised of the possibility of such damages.
By using the software/document, you accept these terms. If you do not accept them, do not use the software. - You may use, copy, redistribute, display, print, and reproduce this software/document - You may NOT sell, rent, lease, or lend this software/document or portions/derivations of it - You may NOT create derivative works from this software/document - You may NOT "reverse-engineer" the software/document - You may only modify portions of the software/document designated as "Input" cells (light yellow cells) - You must maintain all copyright and other notices contained in this software/document. - You may incorporate only static (e.g. values, graphics) portions of this software/document within other documents (e.g. a business case report) as long as the dynamic (e.g. equations, macros) functionality of the workbook is not also incorporated or duplicated.
HCR does not provide free support for free downloads. However, we do welcome any comments, suggestions, and feedback.
HCR can provide fee-based services, including telephonic support, workbook customizations, and comprehensive consulting engagements to assist with business case development and validation.

document.xls Profile 4 of 30
Organizational Profile
Required Organization/Initiative Data Summary Pre-view of Results
Average / Mixed Per PC
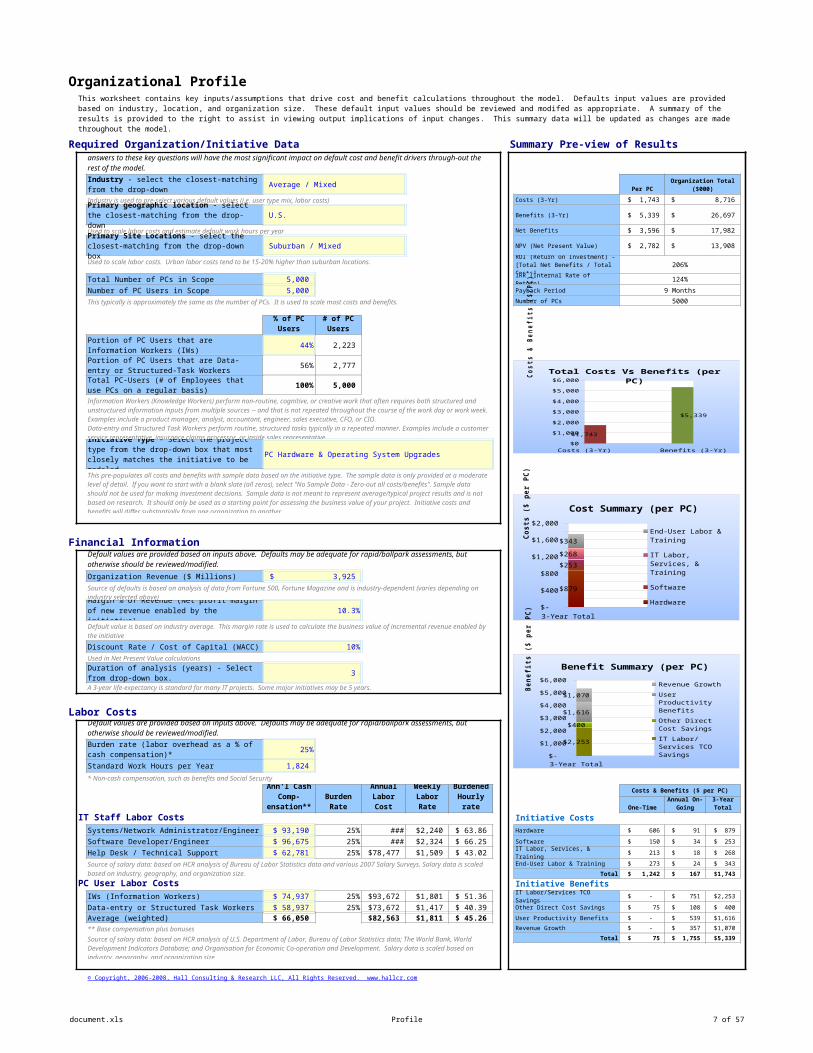
Industry is used to pre-select various default values (i.e. user type mix, labor costs) Costs (3-Yr) $ 1,743 $ 8,716
U.S. Benefits (3-Yr) $ 5,339 $ 26,697
Used to scale labor costs and estimate default work hours per year Net Benefits $ 3,596 $ 17,982
Suburban / Mixed NPV (Net Present Value) $ 2,782 $ 13,908
Used to scale labor costs. Urban labor costs tend to be 15-20% higher than suburban locations.206%
Total Number of PCs in Scope 5,000 IRR (Internal Rate of Return) 124%
Number of PC Users in Scope 5,000 Payback Period 9 Months
This typically is approximately the same as the number of PCs. It is used to scale most costs and benefits. Number of PCs 5000
44% 2,223
56% 2,777
100% 5,000
PC Hardware & Operating System Upgrades
Financial Information
Organization Revenue ($ Millions) $ 3,925
10.3%
Discount Rate / Cost of Capital (WACC) 10%Used in Net Present Value calculations
3
A 3-year life-expectancy is standard for many IT projects. Some major initiatives may be 5 years.
Labor Costs
25%
Standard Work Hours per Year 1,824 * Non-cash compensation, such as benefits and Social Security
Costs & Benefits ($ per PC)
One-Time
IT Staff Labor Costs Initiative CostsSystems/Network Administrator/Engineer $ 93,190 25% $ 116,488 $ 2,240 $ 63.86 Hardware $ 606 $ 91 $ 879
Software Developer/Engineer $ 96,675 25% $ 120,844 $ 2,324 $ 66.25 Software $ 150 $ 34 $ 253
Help Desk / Technical Support $ 62,781 25% $ 78,477 $ 1,509 $ 43.02 IT Labor, Services, & Training $ 213 $ 18 $ 268
End-User Labor & Training $ 273 $ 24 $ 343
Total $ 1,242 $ 167 $ 1,743
PC User Labor Costs Initiative BenefitsIWs (Information Workers) $ 74,937 25% $ 93,672 $ 1,801 $ 51.36 IT Labor/Services TCO Savings $ - $ 751 $ 2,253
Data-entry or Structured Task Workers $ 58,937 25% $ 73,672 $ 1,417 $ 40.39 Other Direct Cost Savings $ 75 $ 108 $ 400
Average (weighted) $ 66,050 $ 82,563 $ 1,811 $ 45.26 User Productivity Benefits $ - $ 539 $ 1,616
** Base compensation plus bonuses Revenue Growth $ - $ 357 $ 1,070
Total $ 75 $ 1,755 $ 5,339
© Copyright, 2006-2008, Hall Consulting & Research LLC, All Rights Reserved. www.hallcr.com
This worksheet contains key inputs/assumptions that drive cost and benefit calculations throughout the model. Defaults input values are provided based on industry, location, and organization size. These default input values should be reviewed and modifed as appropriate. A summary of the results is provided to the right to assist in viewing output implications of input changes. This summary data will be updated as changes are made throughout the model.
Enter values or select the closest fit from the drop-down menus. These are the most important inputs in the model. Your answers to these key questions will have the most significant impact on default cost and benefit drivers through-out the rest of the model.
Industry - select the closest-matching from the drop-down
Organization Total ($000)
Primary geographic location - select the closest-matching from the drop-down
Primary Site Locations - select the closest-matching from the drop-down box
ROI (Return on Investment) - [Total Net Benefits / Total Costs]
% of PC Users
# of PC Users
Portion of PC Users that are Information Workers (IWs)
Portion of PC Users that are Data-entry or Structured-Task Workers
Total PC-Users (# of Employees that use PCs on a regular basis)Information Workers (Knowledge Workers) perform non-routine, cognitive, or creative work that often requires both structured and unstructured information inputs from multiple sources -- and that is not repeated throughout the course of the work day or work week. Examples include a product manager, analyst, accountant, engineer, sales executive, CFO, or CIO.Data-entry and Structured Task Workers perform routine, structured tasks typically in a repeated manner. Examples include a customer service representative, insurance claims processor, or inside sales representative.
Initiative Type - Select the project type from the drop-down box that most closely matches the initiative to be modeled
This pre-populates all costs and benefits with sample data based on the initiative type. The sample data is only provided at a moderate level of detail. If you want to start with a blank slate (all zeros), select "No Sample Data - Zero-out all costs/benefits". Sample data should not be used for making investment decisions. Sample data is not meant to represent average/typical project results and is not based on research. It should only be used as a starting point for assessing the business value of your project. Initiative costs and benefits will differ substantially from one organization to another.
Default values are provided based on inputs above. Defaults may be adequate for rapid/ballpark assessments, but otherwise should be reviewed/modified.
Source of defaults is based on analysis of data from Fortune 500, Fortune Magazine and is industry-dependent (varies depending on industry selected above)
Margin % of Revenue (Net profit margin of new revenue enabled by the initiative)Default value is based on industry average. This margin rate is used to calculate the business value of incremental revenue enabled by the initiative
Duration of analysis (years) - Select from drop-down box.
Default values are provided based on inputs above. Defaults may be adequate for rapid/ballpark assessments, but otherwise should be reviewed/modified.
Burden rate (labor overhead as a % of cash compensation)*
Average Ann'l Cash
Comp-ensation**
Burden Rate
Burdened Annual Labor Cost
Burdened Weekly Labor Rate
Burdened Hourly
rateAnnual On-
Going3-Year Total
Source of salary data: based on HCR analysis of Bureau of Labor Statistics data and various 2007 Salary Surveys. Salary data is scaled based on industry, geography, and organization size.
Source of salary data: based on HCR analysis of U.S. Department of Labor, Bureau of Labor Statistics data; The World Bank, World Development Indicators Database; and Organisation for Economic Co-operation and Development. Salary data is scaled based on industry, geography, and organization size.
Costs (3-Yr) Benefits (3-Yr)$0
$1,000
$2,000
$3,000
$4,000
$5,000
$6,000
$1,743
$5,339
Total Costs Vs Benefits (per PC)
Co
sts
& B
en
efi
ts (
$/P
C)
3-Year Total $-
$200 $400 $600 $800
$1,000 $1,200 $1,400 $1,600 $1,800 $2,000
$879
$253
$268
$343
Cost Summary (per PC)
End-User Labor & Train-ing
IT Labor, Services, & Training
Software
Hardware
Cost
s ($
per P
C)
3-Year Total $-
$1,000
$2,000
$3,000
$4,000
$5,000
$6,000
$2,253
$400
$1,616
$1,070
Benefit Summary (per PC)
Revenue Growth
User Productivity Benefits
Other Direct Cost Sav-ings
IT Labor/Services TCO Savings
Bene
fits
($ p
er P
C)

document.xls Initiatives 5 of 30
Description of Sample Initiatives (for reference only)
Infrastructure/Platform Technology InitiativesInitiative Type Key Features, Capabilities, Benefits Sample Vendors And Products
Storage
Security
Outsourcing
PC HW/OS Upgrades
· Improved performance, reliability, security, manageability, productivity
· Microsoft Windows Vista, Linux, Red Hat, Novell· Notebook, desktop, thin-client · Dell, HP, Apple, Toshiba, Lenovo, Fujitsu, Acer, Sony, Gateway
· Intel, AMD
Server HW/SW Upgrades
· Virtualization, consolidation, clustering · Microsoft Windows Server, Novell SUSE, Red hat, Unix, Solaris, IBM AIX, HP–UX
· Improved performance, reliability, manageability, security · IBM, HP, Dell, Sun, Fujitsu, Bull· Multi-core, 64-bit, RISC/Itanium, x86· Web servers, application servers, DBMS servers, data warehouse servers, infrastructure servers, high performance
Infrastructure Mgmt / Networking
· Asset inventory/management, OS management, configuration management, change management, systems management, software distribution, application packaging
· Microsoft System Center Configuration Manager, MDOP, Active Directory
· Directory services, group policy objects · IBM Tivoli, BMC Software, CA Unicenter, HP, LANDesk, Novell ZENworks, Symantec Altiris, Cisco Systems
· IPV6, LAN, WAN· VOIP – voice over Internet protocol· Digital storage of business data and documents · EMC, HP, IBM, Sun, Hitachi, EDS, Network Appliance· Archival, records management, tape backup, SAN, NAS, disk arrays, iSCSI, fibre channel
· IBM DB2, Microsoft Exchange, Microsoft SQL Server, Oracle, SAP
· Capacity management, performance analysis, storage provisioning, quota management, event management· Security planning, assessment, incident/breach management · McAfee, Symantec, CA, Trend Micro· Identity and access management, encryption, smartcards, authentication, authorization, patch management
· Cisco Systems, NetIQ· Firewalls, antivirus, anti-malware, anti-spyware, network access control, information and data rights management
· VeriSign, IBM, Unisys
Application Development / Architecture
· Improved software quality, integration, usability · Microsoft .NET, Visual Studio· Custom developed software · IBM WebSphere, Rational· Rapid application development · Sun Microsystems Java· Middleware, application server · Java/J2EE/EE, Ruby on Rails, PHP, Python, Perl· Web services, Service-Oriented Architecture, SaaS (software as a service)
· Oracle Fusion Middleware, Application Server· Enterprise architecture (EA) · BEA Systems WebLogic, JBoss (Red Hat), SAP NetWeaver
Compliance, Governance, Risk
· Methods and software to ease compliance with regulations such as HIPPA, Sarbanes-Oxley, Basel II
· BearingPoint, Deloitte, Ernst & Young, IBM, KPMG, PricewaterhouseCoopers· ITIL, COBIT, Six Sigma, CMM, ISO 17799/9000, PMBOK
· Maturity models (Microsoft’s Infrastructure Optimization Maturity Model)
· Portfolio management, IT-business alignment, balanced scorecard, service level management, risk management · Business continuity – disaster planning / recovery · IT governance, policies, internal audit, monitoring· Outsource IT and business processes, applications, infrastructure, or initiatives to reduce costs and improve results
· Accenture, Capgemini, Cognizant, CSC, EDS, IBM, HP, Siemens, CompuCom, Infosys, Keane, Perot Systems, Satyam, TCS, Wipro, Getronics, Unisys
· Infrastructure management: helpdesk, on-site support, desktop management, data center services
· AT&T, IBM, MCI-Digex, Qwest, Rackspace, Verio
· BPO – business process outsourcing· Offshore services· Application outsourcing, web hosting
Wireless/ Mobility
· Wireless e-mail, mobile access to line-of-business applications, unified communications,
· Microsoft Windows Mobile, Palm, Symbian· VPN, mobile remote access, telecommuting · RIM BlackBerry, Nokia, Apple iPhone, Sharp, Motorola/Symbol,
Fujitsu,
· Handheld devices, smartphone, PDAs · 3Com, Cisco Systems, Nortel Networks, Siemens· Wireless LAN/WAN, 802.11n, WiMAX, CDMA, UMTS, GPRS, EDGE
· Equant, AT&T, MCI, BT, Sprint, Verizon
Sample data should not be used for making investment decisions. Sample data is not meant to represent average/typical project results, is not based on research, and is not provided at the lowest level of detail. It should only be used as a starting point for assessing the business value of your project. Initiative costs and benefits will differ substantially from one organization to another.

document.xls Initiatives 6 of 30
Description of Sample Initiatives (for reference only)Business Technology Initiatives
Initiative Type Key Features, Capabilities, Benefits Sample Vendors And Products
CRM
Office Productivity Software
· Word processing, spreadsheets, personal databases, presentation graphics software, personal information
· Microsoft Office 2007· OpenOffice.org· Sun StarOffice· Google Apps
Messaging/ Collaboration
· E-mail, calendaring/scheduling, task management, unified communications
· Microsoft SharePoint, Exchange, Live Meeting· Real-time collaboration, presence, instant messaging, web conferencing
· IBM Domino / Lotus Notes· Social computing, blogs, wikis · Oracle Collaboration Suite· Team workspaces, project management, discussion threads, document workflow
· Sun Java Enterprise System· Novell GroupWise· WebEx Communications
Content Management
· Document management, web content management, document imaging, records management, digital asset
· Microsoft SharePoint· Knowledge management, information management · EMC Documentum, FileNet, Hummingbird, IBM Content
Management, Interwoven, Mobius Management Systems, Open Text, Oracle Content Services, Stellent, and Vignette
· Intranets, Extranets, Portals
E-commerce / Internet
· Web sites for external business information dissemination, marketing, sales transactions, etc.
· Microsoft IIS, Commerce Server· Web storefronts, shopping cart management, taxation, personalization, transaction management, settlement and
· ATG, Escalate Retail, Comergent, Oracle, SAP· B2B, B2C, AJAX, mashups
Business Process Mgmt / Integration
· Process modeling, monitoring and management · Microsoft BizTalk Server, SharePoint Server· Workflow, business rules, automation, electronic forms · Captaris Workflow, EMC Documentum, Global 360, IBM FileNet,
Open Text
· BAM (business activity monitoring) · Pegasystems, Oracle, SAP, TIBCO, webMethods, BEA Systems, SeeBeyond, GXS, Sterling Commerce
· EAI (enterprise application integration)
Business Intelligence / Data Mgmt
· Database management systems (DBMS), data warehousing, data marts, online transaction processing (OLTP)
· Microsoft SQL Server, PerformancePoint Server· Master data management, data quality, metadata · Teradata, IBM, Oracle, MySQL, Ingres, PostgreSQL, Sybase
· Financial planning, corporate performance management, reporting, analytics, dashboards, scorecards, enterprise search, ETL, OLAP, query
· Oracle Hyperion, Business Objects, Informatica, Cognos, Information Builders, MicroStrategy, SAS
Business Applications (Vertical, LOB)
· Wide variety of specialized software that helps organizations streamline business processes and improve results
· Various products/vendors by business function and industry
· Customer Relationship Management · Oracle Siebel, PeopleSoft· Sales force automation, marketing campaign management, customer information management, order entry, customer
· Onyx, Sage, mySAP CRM, Salesforce.com, Amdocs· Hosted CRM · Microsoft Dynamics CRM
ERP / Supply Chain
· Enterprise resource planning: supply chain management, operations/production management, inventory management,
· SAP· Oracle Fusion (E-Business Suite, J.D. Edwards, PeopleSoft)
· Lawson, Intentia, Infor, Sage, Ariba, · Microsoft Dynamics
© Copyright, 2006-2008, Hall Consulting & Research LLC, All Rights Reserved. www.hallcr.com
document.xls Costs 7 of 30
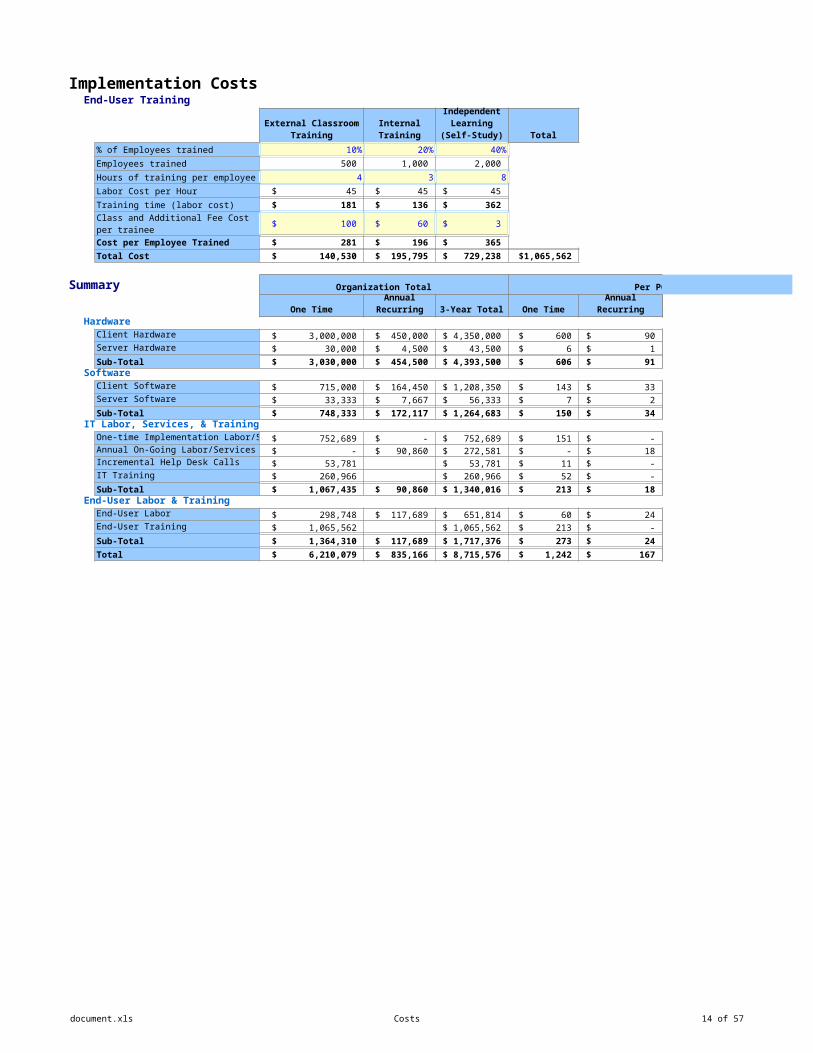
Implementation Costs
Hardware Cost per Unit
Unit Label Unit Quantity One-Time* 3-Year Total Comments
Client HardwarePCs PCs 2,500 $ 1,000 $ 150 $ 3,625,000
PC Upgrades PCs 2,500 $ 200 $ 30 $ 725,000
Mobile Devices - $ 200 $ 30 $ -
Other - $ 200 $ 30 $ -
Sub Total $ 3,000,000 $ 450,000 $ 4,350,000
Server HardwareServers Servers 1.7 $ 15,000 $ 2,250 $ 36,250
Terabytes 0.5 $ 10,000 $ 1,500 $ 7,250
Network Equipment - $ - $ -
Other - $ - $ -
Sub Total $ 30,000 $ 4,500 $ 43,500
Total $ 3,030,000 $ 454,500 $ 4,393,500
* One-Time costs are typically incurred at the beginning of the project. Annual Recurring costs are on-going costs necessary throughout the life of the project.
Software
The software license is typically a one-time cost. Software maintenance (Software Assurance) is an optional annual recurring cost
3-Year Total Comments
Client SoftwareApplication A 1,500 $ 300 $ 69 $ 760,500
Application B - $ 100 $ 23 $ -
Desktop Operating System 2,500 $ 100 $ 23 $ 422,500
Client Access Licenses (CALs) 1,500 $ 10 $ 2 $ 25,350
Other $ -
Sub Total $ 715,000 $ 164,450 $ 1,208,350
Server SoftwareServer Operating System 1.7 $ 2,000 $ 460 $ 5,633
Database 2 $ 8,000 $ 1,840 $ 22,533
Server Application 2 $ 10,000 $ 2,300 $ 28,167
Utilities - $ - $ -
Other $ -
Sub Total $ 33,333 $ 7,667 $ 56,333
Total $ 748,333 $ 172,117 $ 1,264,683
IT Labor, Services, & Training
One-time Implementation Labor/ServicesTime
Time Unit One-Time 3-Year Total Comments
Planning, Evaluation and Project Person-weeks 30.0 $ 2,240 $ 67,204
Engineering Person-weeks 18.0 $ 2,240 $ 40,323
Development Person-weeks 33.6 $ 2,240 $ 75,269
Lab Testing Person-weeks 7.2 $ 2,240 $ 16,129
Pilot Testing Person-weeks 12.0 $ 2,240 $ 26,882
Rollout Person-weeks 36.0 $ 2,240 $ 80,645
Performance Tuning Person-weeks 4.8 $ 2,240 $ 10,753
Documentation Person-weeks 4.8 $ 2,240 $ 10,753
Implementation User Support Person-weeks 4.8 $ 2,240 $ 10,753
Consultants Person-weeks 48.0 $ 6,720 $ 322,581
External Services Person-weeks 9.6 $ 6,720 $ 64,516
Other Person-weeks 12.0 $ 2,240 $ 26,882
Total $ 752,689 $ - 752,689
*1 Person-week is equivalent to 2 employees each dedicating 50% of a week to the task or 1 person dedicating 8 hrs per week over 5 weeks.
Annual Recurring*
Storage (including backups, redundancy, power supplies, etc.)
License Quantity
One-Time (License)
Annual Recurring
(Main-tenance)
Annual Recurring
Cost per Time Unit
This worksheet estimates all costs needed to implement the initiative, including hardware, software, IT labor/services, and user labor costs.

document.xls Costs 8 of 30
Implementation CostsThis worksheet estimates all costs needed to implement the initiative, including hardware, software, IT labor/services, and user labor costs.
Annual On-Going Labor/ServicesUnit Quantity
Unit* One-Time Cost per Unit 3-Year Total Comments
Maintenance Full Time Equivalents 0.20 $ 116,488 $ 69,893
Support FTEs 0.20 $ 116,488 $ 69,893
Customization FTEs 0.10 $ 116,488 $ 34,946
Development FTEs 0.20 $ 116,488 $ 69,893
Upgrades FTEs 0.04 $ 116,488 $ 13,979
Performance Tuning FTEs 0.04 $ 116,488 $ 13,979
External Services FTEs - $ 174,731 $ -
Bandwidth - $ -
Other - $ -
Total $ - $ 90,860 272,581
*FTE (Full Time Equivalent): 1 full time employee is equivalent to 2 employees each dedicating 50% of their work time to the task
Incremental Help Desk Calls
40%
1.5
25
Additional service desk time (hours) 1250.0
Total $ 53,781
IT Training
3-Year Total Comments
Staff trained with this type of training 11.2 56.0 56.0
Hours of training per staff member 32 16 40
Labor Cost per Hour $ 64 $ 64 $ 64
Training time (labor cost) $ 2,044 $ 1,022 $ 2,555
$ 1,500 $ 300 $ 75
Cost per Employee Trained $ 3,544 $ 1,322 $ 2,630
Total Cost $ 39,689 $ 74,022 $ 147,255 $ 260,966
End-User Labor & TrainingEnd-User Labor
Hours per User Impacted
% of Users Impacted # Of Users One-Time 3-Year Total Comments
Solution planning & testing 2% 100 10 $ 45,265
2% 100 1 $ 4,526
6% 300 5 2 $ 149,374
System configuration 20% 1000 4 0 $ 181,059
4% 200 0 10 $ 271,589
Other 0% 0 0 0 $ -
Other 0% 0 0 0 $ -
Total $ 298,748 $ 117,689 $ 651,814
Annual Recurring
Percentage of users who contact the service desk due to issues/questions related to the solution implementation
Number of contacts per user (who contact the help desk)
Average service desk resolution time per call (in minutes)
Formal (Classroom) Training
Internal Training
Independent Learning (Self-
Study)
Class and Additional Fee Cost per trainee
Annual On-Going
Downtime (Unable to be productive); e.g. during implementation of the solution
Resolution of issues related to the new solution
Data entry (not previously required)

document.xls Costs 9 of 30
Implementation CostsThis worksheet estimates all costs needed to implement the initiative, including hardware, software, IT labor/services, and user labor costs.
End-User Training
Total Comments
% of Employees trained 10% 20% 40%
Employees trained 500 1,000 2,000
Hours of training per employee 4 3 8
Labor Cost per Hour $ 45 $ 45 $ 45
Training time (labor cost) $ 181 $ 136 $ 362
$ 100 $ 60 $ 3
Cost per Employee Trained $ 281 $ 196 $ 365
Total Cost $ 140,530 $ 195,795 $ 729,238 $ 1,065,562
Summary Organization Total Per PC
One Time 3-Year Total One Time Annual Recurring 3-Year TotalHardware
Client Hardware $ 3,000,000 $ 450,000 $ 4,350,000 $ 600 $ 90 $ 870
Server Hardware $ 30,000 $ 4,500 $ 43,500 $ 6 $ 1 $ 9
Sub-Total $ 3,030,000 $ 454,500 $ 4,393,500 $ 606 $ 91 $ 879 Software
Client Software $ 715,000 $ 164,450 $ 1,208,350 $ 143 $ 33 $ 242
Server Software $ 33,333 $ 7,667 $ 56,333 $ 7 $ 2 $ 11
Sub-Total $ 748,333 $ 172,117 $ 1,264,683 $ 150 $ 34 $ 253 IT Labor, Services, & Training
One-time Implementation Labor/Servic $ 752,689 $ - $ 752,689 $ 151 $ - $ 151 Annual On-Going Labor/Services $ - $ 90,860 $ 272,581 $ - $ 18 $ 55 Incremental Help Desk Calls $ 53,781 $ 53,781 $ 11 $ - $ 11
IT Training $ 260,966 $ 260,966 $ 52 $ - $ 52
Sub-Total $ 1,067,435 $ 90,860 $ 1,340,016 $ 213 $ 18 $ 268 End-User Labor & Training
End-User Labor $ 298,748 $ 117,689 $ 651,814 $ 60 $ 24 $ 130
End-User Training $ 1,065,562 $ 1,065,562 $ 213 $ - $ 213
Sub-Total $ 1,364,310 $ 117,689 $ 1,717,376 $ 273 $ 24 $ 343
Total $ 6,210,079 $ 835,166 $ 8,715,576 $ 1,242 $ 167 $ 1,743
External Classroom Training
Internal Training
Independent Learning (Self-
Study)
Class and Additional Fee Cost per trainee
Annual Recurring

document.xls Costs 10 of 30
Implementation CostsThis worksheet estimates all costs needed to implement the initiative, including hardware, software, IT labor/services, and user labor costs. One Time 3-Year Total One Time Annual Recurring 3-Year Total
Hardware $ 3,030,000 $ 454,500 $ 4,393,500 $ 606 $ 91 $ 879 Software $ 748,333 $ 172,117 $ 1,264,683 $ 150 $ 34 $ 253 IT Labor, Services, & Training $ 1,067,435 $ 90,860 $ 1,340,016 $ 213 $ 18 $ 268
End-User Labor & Training $ 1,364,310 $ 117,689 $ 1,717,376 $ 273 $ 24 $ 343
Total $ 6,210,079 $ 835,166 $ 8,715,576 $ 1,242 $ 167 $ 1,743
© Copyright, 2006-2008, Hall Consulting & Research LLC, All Rights Reserved. www.hallcr.com
Annual Recurring
3-Year Total$0
$200
$400
$600
$800
$1,000
$1,200
$1,400
$1,600
$1,800
$2,000
$879
$253
$268
$343
Total Implementation Costs (Per PC)
End-User Labor & Train-ing
IT Labor, Services, & Training
Software
Hardware
Cost
s ($
per P
C)
3-Year Total$0
$1,000,000
$2,000,000
$3,000,000
$4,000,000
$5,000,000
$6,000,000
$7,000,000
$8,000,000
$9,000,000
$10,000,000
$4,393,500
$1,264,683
$1,340,016
$1,717,376
Total Implementation Costs
End-User Labor & Training
IT Labor, Services, & Training
Software
Hardware
Tota
l Cos
ts
3-Year Total$0
$200
$400
$600
$800
$1,000
$1,200
$1,400
$1,600
$1,800
$2,000
$870
$9 $242 $11
$151 $55 $11 $52
$130
$213
Total Implementation Costs (Per PC)
End-User Training
End-User Labor
IT Training
Incremental Help Desk Calls
Annual On-Going Labor/Services
One-time Implementation Labor/Services
Server Software
Client Software
Server Hardware
Client Hardware
Tota
l Cos
ts ($
per
PC)
3-Year Total$0
$1,000,000
$2,000,000
$3,000,000
$4,000,000
$5,000,000
$6,000,000
$7,000,000
$8,000,000
$9,000,000
$10,000,000
$4,350,000
$43,500 $1,208,350
$56,333 $752,689 $272,581 $53,781 $260,966 $651,814
$1,065,562
Total Implementation Costs
End-User Training
End-User Labor
IT Training
Incremental Help Desk Calls
Annual On-Going Labor/Services
One-time Implementa-tion Labor/Services
Server Software
Client Software
Server Hardware
Client Hardware
Tota
l Cos
ts

document.xls IT Labor 11 of 30
IT Labor TCO and TCO Savings
IT Labor TCO by General FunctionTotal IT Employees (IT Staff) FTEs 157.8 IT Employees as % of Total PC Users 3.2%Ratio of PC Users to IT Staff 31.7 Source of User to IT staff ratios is based on analysis of U.S. Department of Labor, Bureau of Labor Statistics data and is industry-dependent
FTEs* Comments
PC Management Services 17% 27 $116,488 $ 625 $ 3,124,482
Help Desk (Tech Support) 16% 25 $ 78,477 $ 396 $ 1,981,118
Server & Network Mgmt Services 21% 33 $116,488 $ 772 $ 3,859,654
Application Development 30% 47 $120,844 $ 1,144 $ 5,719,992
Administration & Other 16% 25 $110,803 $ 559 $ 2,797,190
Total IT FTEs 100% 158 $ 3,496 $ 17,482,436 * include management, except senior management; which is included in "Administration"
** Base compensation plus bonuses X burden rate. Defaults are from "IT Staff Labor Rates" on the Profile worksheet.
Detailed IT Labor TCO and Savings
Description FTE's Savings Comments
PC Management Services
PC HW / SW Evaluation 5% 1.4 18.0% $ 33 $ 27 $ 5.92
PC Image Management Design, test, certify, and update images 7% 1.9 36.0% $ 44 $ 28 $ 15.75
User Admin & Provisioning User adds, moves and changes. 9% 2.4 45.0% $ 56 $ 31 $ 25.31
Application Management 16% 4.2 36.0% $ 99 $ 63 $ 35.52
Software Deployment 11% 2.8 63.0% $ 66 $ 24 $ 41.44
Security Assessm't & Planning 9% 2.4 18.0% $ 56 $ 46 $ 10.12
Security Patch Management 4% 1.1 27.0% $ 25 $ 18 $ 6.75
Security Incident Remediation 2% 0.5 63.0% $ 12 $ 5 $ 7.87
Data Mgmt, Backup & Restore 5% 1.3 36.0% $ 31 $ 20 $ 11.25
Tools/GPO Management 13% 3.5 36.0% $ 82 $ 53 $ 29.60
3rd Level Support 19% 5.2 36.0% $ 120 $ 77 $ 43.33
Total ($ per PC) 27 $ 232.87 $ 625 $ 392 $ 232.87
Total (% of Total TCO) 100% 37.3%
% of Total*
Average Burdened
Cost**As-Is
TCO / PCTotal IT Labor TCO /
Year
PC/User administration, security, sw/hw deployment, data backup
Service Desk / Technical Support. Call center (remote), and deskside (on-site) support of user computing
Management and administration of servers, data storage, and the network
Application development, testing, troubleshooting, and support.
Finance, purchasing, training, planning, administration, senior management overhead, other
% of Total
% Re-duction
As-Is TCO To-Be TCO
PC hardware and software planning & evaluation
Configuration, packaging, compatibility testing, inventory, piloting
Software deployment, changes, and removal
Security policy setting, assessment and planning.
Management and distribution of security patches
Handling of security breaches, unauthorized access, theft, etc.
PC-based information and data management (file shares) & backup
Directory services, group policy objects, sw distribution, & other tools
Advanced diagnostics/troubleshooting - escalated from help desk
PC HW / SW Evaluation
PC Image Management
User Admin & Provisioning
Application Management
Software Deployment
Security Assessm't & Planning
Security Patch Management
Security Incident Remediation
Data Mgmt, Backup & Restore
Tools/GPO Management
3rd Level Support
$0 $20 $40 $60 $80 $100 $120 $140
PC Management TCOTo-Be TCOAs-Is TCO TCO ($/PC)
This worksheet estimates IT Labor TCO by estimating/allocating labor effort across common IT staff activities (as a % of total by category). The number of FTEs (full-time equivalents) the calculated. Then the likely % reduction in effort (for existing activities only) enabled by the solution is estimated. All increases in labor (required to implement/support the new solution) should be included in the "Costs" worksheet. As-is (current) and To-be (after the solution is fully implemented) TCO is calculated on displayed in bar charts to the right. The benefit (summarized at the bottom) is any annual on-going TCO savings enabled by the initiative.

document.xls IT Labor 12 of 30
IT Labor TCO and TCO SavingsThis worksheet estimates IT Labor TCO by estimating/allocating labor effort across common IT staff activities (as a % of total by category). The number of FTEs (full-time equivalents) the calculated. Then the likely % reduction in effort (for existing activities only) enabled by the solution is estimated. All increases in labor (required to implement/support the new solution) should be included in the "Costs" worksheet. As-is (current) and To-be (after the solution is fully implemented) TCO is calculated on displayed in bar charts to the right. The benefit (summarized at the bottom) is any annual on-going TCO savings enabled by the initiative.Help Desk (Tech Support)
Proprietary Applications Custom developed application support 30% 7.5 40.0% $ 118 $ 71 $ 47.04
Standard Desktop Software Commercial off-the-shelf applications 15% 3.8 40.0% $ 59 $ 35 $ 23.66
Operating Systems Operating system-related issues 15% 3.7 40.0% $ 58 $ 35 $ 23.14
Hardware (except printers) Hardware troubleshooting/repair 12% 3.1 30.0% $ 49 $ 34 $ 14.68
Data Comm./Network Networking 10% 2.5 30.0% $ 39 $ 27 $ 11.57
Password Resets Reset user passwords 5% 1.2 70.0% $ 19 $ 6 $ 13.65
Databases Database troubleshooting 5% 1.1 20.0% $ 18 $ 14 $ 3.60
Service Requests Forward requests for other services 4% 1.1 20.0% $ 17 $ 13 $ 3.31
Voice Communications Telecommunications 3% 0.7 20.0% $ 10 $ 8 $ 2.07
Printers Printer troubleshooting/repair 2% 0.6 30.0% $ 10 $ 7 $ 2.93
Others 0% - 30.0% $ - $ - $ -
Total ($ per PC) 25 $ 146 $ 396 $ 251 $ 145.64
Total (% of Total TCO) 100% 36.8%
Server & Network Mgmt Services
Network management 12% 4.0 15.0% $ 93 $ 79 $ 13.89
Hardware management 11% 3.6 15.0% $ 85 $ 72 $ 12.74
Operating system support 16% 5.3 30.0% $ 124 $ 86 $ 37.05
Server application mgmt 24% 8.0 30.0% $ 185 $ 130 $ 55.58
Security 14% 4.7 25.0% $ 110 $ 83 $ 27.57
Storage management Storage capacity planning and management 11% 3.6 15.0% $ 85 $ 72 $ 12.74
Database Mgmt & Admin 12% 4.0 15.0% $ 93 $ 79 $ 13.89
Other 0% - 15.0% $ - $ - $ -
Total ($ per PC) 33 $ 173 $ 774 $ 601 $ 173.46
Total (% of Total TCO) 100% 22.4%
Application DevelopmentDesign Needs assessment, conceptual design 6% 2.8 9.0% $ 69 $ 62 $ 6.18
Development Detailed engineering, development 42% 19.9 12.0% $ 480 $ 423 $ 57.66
Testing Test and pilot 22% 10.4 9.0% $ 252 $ 229 $ 22.65
Support 30% 14.2 12.0% $ 343 $ 302 $ 41.18
Other 0% - 9.0% $ - $ - $ -
Total ($ per PC) 47 $ 128 $ 1,144 $ 1,016 $ 127.67
Total (% of Total TCO) 100% 11.2%
Administration & Other
Planning 19% 4.8 7.0% $ 106 $ 99 $ 7.44
Purchasing 14% 3.5 21.0% $ 78 $ 62 $ 16.45
Finance Budgeting and chargeback tasks 18% 4.5 28.0% $ 101 $ 73 $ 28.20
Training IT and end-user training 16% 4.0 7.0% $ 90 $ 83 $ 6.27
Senior management Senior IT management overhead 28% 7.1 7.0% $ 157 $ 146 $ 10.96
Other Administration and other 5% 1.3 7.0% $ 28 $ 26 $ 1.96
Total ($ per PC) 25 $ 71 $ 559 $ 488 $ 71.27
Total (% of Total TCO) 100% 12.7%
Manage network communication infrastructure
Deployment, configuration, administration, support
Deployment, configuration, administration, support
Deployment, configuration, administration, support
Planning, assessment, patching, issue remediation
Index management, replication, log administration, data recovery, optimization
Advanced support and troubleshooting (escalated from help desk)
Needs assessment, standards development, evaluation, business case development, project planning
Purchasing, procurement, and vendor management
Proprietary ApplicationsStandard Desktop Software
Operating SystemsHardware (except printers)
Data Comm./NetworkPassword Resets
DatabasesService Requests
Voice CommunicationsPrintersOthers
$0 $20 $40 $60 $80 $100 $120 $140
Help Desk TCOTo-Be TCOAs-Is TCO TCO ($/PC)
Network management
Hardware management
Operating system support
Server application mgmt
Security
Storage management
Database Mgmt & Admin
Other
$0 $20 $40 $60 $80 $100 $120 $140 $160 $180 $200
Server & Network Mgmt TCOTo-Be TCOAs-Is TCO TCO ($/PC)
Design
Development
Testing
Support
Other
$0 $100 $200 $300 $400 $500 $600
Application Development TCOTo-Be TCOAs-Is TCO TCO ($/PC)
Planning
Purchasing
Finance
Training
Senior management
Other
$0 $20 $40 $60 $80 $100 $120 $140 $160 $180
Administration & Other TCOTo-Be TCOAs-Is TCO TCO ($/PC)

document.xls IT Labor 13 of 30
IT Labor TCO and TCO SavingsThis worksheet estimates IT Labor TCO by estimating/allocating labor effort across common IT staff activities (as a % of total by category). The number of FTEs (full-time equivalents) the calculated. Then the likely % reduction in effort (for existing activities only) enabled by the solution is estimated. All increases in labor (required to implement/support the new solution) should be included in the "Costs" worksheet. As-is (current) and To-be (after the solution is fully implemented) TCO is calculated on displayed in bar charts to the right. The benefit (summarized at the bottom) is any annual on-going TCO savings enabled by the initiative.
SummaryIT Labor TCO / PC / Year Full-Time Equivalents
Savings As-Is FTEs Savings
PC Management Services $ 625 $ 392 $ 232.87 37% 26.8 19.5 7.3
Help Desk (Tech Support) $ 396 $ 251 $ 145.64 37% 25.2 18.5 6.8
Server & Network Mgmt Services $ 774 $ 601 $ 173.46 22% 33.2 27.1 6.1
Application Development $1,144 $ 1,016 $ 127.67 11% 47.3 42.6 4.8
Administration & Other $ 559 $ 488 $ 71.27 13% 25.2 22.4 2.9
Total $3,499 $ 2,748 $ 751 21% 157.9 130.1 27.8
Key SoftGrid Benefits
© Copyright, 2006-2008, Hall Consulting & Research LLC, All Rights Reserved. www.hallcr.com
As-Is TCO
To-Be TCO
Savings %
To-Be FTEs
As-Is TCO To-Be TCO $-
$500
$1,000
$1,500
$2,000
$2,500
$3,000
$3,500
$4,000
$625 $392
$396
$251
$774
$601
$1,144
$1,016
$559
$488
IT Labor TCO Comparison
Administration & Other
Application Devel-opment
Server & Network Mgmt Services
Help Desk (Tech Support)
PC Management Services
TC
O p
er
PC
pe
r Y
ea
r
PC Management Services
Help Desk (Tech Support)
Server & Network Mgmt Services
Application De-velopment
Administration & Other
$-
$200
$400
$600
$800
$1,000
$1,200
$1,400
0
5
10
15
20
25
30
35
40
45
50
$625 $396 $774 $1,144 $559 $392 $251 $601 $1,016 $488
26.8 25.2
33.2
47.3
25.2
19.5 18.5
27.1
42.6
22.4
IT Labor Comparison
As-Is TCO To-Be TCO As-Is FTEs To-Be FTEs
TC
O p
er
PC
pe
r Y
ea
r
FT
Es
(F
ull
Tim
e E
qu
iva
len
ts)
document.xls Direct Savings 14 of 30
Direct Cost Savings
Direct Cost Savings - ITReduce/Avoid Software Costs - PCs
Capabilities/features included in the proposed solution that can reduce the need for (planned) or current costs of 3rd party software.
% of PCs 3-Year Total Comments
Application A 25% $ 100 $ 20 $ 200,000
Application B 15% $ 200 $ 40 $ 240,000
Imaging tools 50% $ 10 $ - $ 25,000
Encryption tools 30% $ 20 $ 90,000
OS virtualization 20% $ 20 $ 60,000
Security Utilities 100% $ 20 $ 300,000 Total $ 300,000 $ 205,000 $ 915,000
Reduce/Avoid Software Costs - ServersCapabilities/features included in the proposed solution that can reduce the need for current or expected costs of 3rd party software.
100
Quantity 3-Year Total Comments
Business Applications 6 $ 6,000 $ 900 $ 52,200
Back-Up / Recovery 6 $ 200 $ 30 $ 1,740
OS virtualization 4 $ 200 $ 30 $ 1,160
Security Utilities 4 $ 200 $ 30 $ 1,160
Other 2 $ 500 $ 75 $ 1,450 Total $ 39,800 $ 5,970 $ 57,710
Reduce/Avoid Hardware Costs
Quantity 3-Year Total Comments
4 $ 6,000 $ 900 $ 34,800
Virtualization 2 $ 6,000 $ 900 $ 17,400
Peripherals $ - $ - $ -
Replacement $ - $ - $ -
Other $ - $ - $ - Total $ 36,000 $ 5,400 $ 52,200
Reduce/Avoid IT Service Costs
Quantity 3-Year Total Comments
Consulting Services (Hours) 80 $ - $ 150 $ 36,000
Outsourcing (Hours) 80 $ - $ 150 $ 36,000
Other - $ - $ - $ -
Other - $ - $ - $ -
Other - $ - $ - $ - Total $ - $ 24,000 $ 72,000
One-Time Costs Avoided
Annual Costs Avoided
Approximate Total Number of Existing Servers
One-Time Costs Avoided
Annual Costs Avoided
One-Time Costs Avoided
Annual Costs Avoided
Server Consolidation - avoid purchasing new servers
One-Time Costs Avoided
Annual Costs Avoided
This workbook estimates various direct IT and business cost savings enabled by the solution.

document.xls Direct Savings 15 of 30
Direct Cost SavingsReduce Power/Electricity Usage Costs
PCs Servers Ann'l Total 3-Year Total Comments
Average Watts per PC/Server 140 800
60 10
Total 200 810 kW-hours per day 3.36 19.20
Electricity cost per kW-hour $ 0.09 $ 0.09 Electricity cost per PC/Server per year $ 110 $ 631
Number of PCs/Servers 5,000 100
50% 100%
14 24
100% 100%
Total Benefit per PC/Server $ 32 $ 631 Total $ 160,965 $ 63,072 $ 224,037 $ 672,111
Other IT Cost Avoidance/Reductions
Quantity 3-Year Total Comments
Reduce Bandwidth Costs 10 $ - $ 150 $ 4,500
Reduce Heating, Cooling Costs 2 $ - $ 1,200 $ 7,200
Reduce Other Facilities Costs 10 $ - $ - $ -
Other 10 $ - $ - $ - Total $ - $ 3,900 $ 11,700
Direct Cost Savings - Business
Reduce/Avoid Travel Expenses Comments
445
5
3%
Trips avoided 67
Cost of average trip $ 1,100 Total Annual Benefit $ 73,355 3-Year Total $ 220,066
Reduce Business Services
Quantity 3-Year Total Comments
Consulting Services (Hours) - $ - $ 150 $ -
Outsourcing - $ - $ 150 $ -
Other - $ - $ - $ -
Other - $ - $ - $ - Total $ - $ - $ -
Reduce Other Business Expenses
Quantity 3-Year Total Comments
Supply costs - $ - $ 70 $ -
Raw Material Costs - $ - $ 90 $ -
Inventory carrying costs - $ - $ 30 $ -
Operations - $ - $ 60 $ -
Other - $ - $ 60 $ -
Other - $ - $ - $ -
Other - $ - $ - $ -
Other - $ - $ - $ -
Average Watts per monitor (CRT/LCD mix)
% PCs/Servers likely to be impacted by power saving measures
Average time per day (hours) that power will be reduced for impacted PCs/Servers
% reduction in power usage during this time
One-Time Costs Avoided
Annual Costs Avoided
# of employees impacted (travel regularly and are likely to benefit from the proposed solution)
Average number of trips per year currently per impacted employee
% of trips that could be avoided due to the proposed solution
One-Time Costs Avoided
Annual Costs Avoided
One-Time Costs Avoided
Annual Costs Avoided

document.xls Direct Savings 16 of 30
Direct Cost SavingsTotal $ - $ - $ -
Summary
Organization Total Per PC
IT Savings One Time 3-Year Total One Time Annual Recurring 3-Year TotalSoftware - Clients $ 300,000 $ 205,000 $ 915,000 $ 60 $ 41 $ 183 Software - Servers $ 39,800 $ 5,970 $ 57,710 $ 8 $ 1 $ 12 Hardware $ 36,000 $ 5,400 $ 52,200 $ 7 $ 1 $ 10 IT Services $ - $ 24,000 $ 72,000 $ - $ 5 $ 14 Power/Electricity Usage $ 224,037 $ 672,111 $ - $ 45 $ 134 Other IT Costs $ - $ 3,900 $ 11,700 $ - $ 1 $ 2 Total $ 375,800 $ 468,307 $ 1,780,721 $ 75 $ 94 $ 356
Business SavingsTravel Expenses $ 73,355 $ 220,066 $ - $ 15 $ 44 Business Services $ - $ - $ - $ - $ - $ - Other Business Expenses $ - $ - $ - $ - $ - $ - Total $ - $ 73,355 $ 220,066 $ - $ 15 $ 44
Total $ 375,800 $ 541,662 $ 2,000,787 $ 75 $ 108 $ 400
© Copyright, 2006-2008, Hall Consulting & Research LLC, All Rights Reserved. www.hallcr.com
Annual Recurring
3-Year Total $-
$50
$100
$150
$200
$250
$300
$350
$400
$450
$183
$12 $10 $14
$134
$2 $44 $- $-
Direct Cost Savings
Other Business Expenses
Business Services
Travel Expenses
Other IT Costs
Power/Electricity Usage
IT Services
Hardware
Software - Servers
Software - Clients
Bene
fit ($
per
PC)

document.xls Productivity 17 of 30
User Productivity Benefits Assessment
On This Worksheet:Allocation of Time Across Business Activity CategoriesAllocation of Time Across Detailed Activities and Efficiency ImprovementsSummary of Productivity Improvements (Time Saved)Business Value of Time Saved
Allocation of Time Across Business Activity Categories
Time Allocation Hrs / Wk
Info Wrkr Comments
Activity Category TotalsIndividual Computing 32% 30% 11.2 10.5
Collaborative Computing 21% 3% 7.4 1.1
PC Systems Management 4% 2% 1.4 0.7
Non-Computing-Related Activities 43% 65% 15.1 22.8
Total (Must sum to 100%) 100% 100% 35.1 35.1
Activity Sub-CategoriesIndividual Computing
Document Creation 25% 28% 2.8 2.9
Data & Information Access/Analysis 10% 5% 1.1 0.5
Email, Calendar, Contact, & Task Mgmt 24% 8% 2.7 0.8
LOB Application-Related Activities 31% 52% 3.5 5.5
Other 10% 7% 1.1 0.7
Total (Must sum to 100%) 100% 100% 11.2 10.5Collaborative Computing
Document Collaboration 60% 47% 4.4 0.5
Workflow (routing) 15% 28% 1.1 0.3
Coordination / Project Mgmt 16% 15% 1.2 0.2
Other 9% 10% 0.7 0.1
Total (Must sum to 100%) 100% 100% 7.4 1.1PC Systems Management
Support, Self-Help, & Learning 35% 40% 0.5 0.3
Performance 25% 25% 0.4 0.2
Mobility & Remote Connectivity 17% 6% 0.2 0.0
Security & Privacy 13% 15% 0.2 0.1
System UI Navigation 6% 8% 0.1 0.1
Availability & Reliability 4% 6% 0.1 0.0
Total (Must sum to 100%) 100% 100% 1.4 0.7
Non-Computing-Related Activities 15.1 22.8
Total 35.1 35.1
Task Wrkr
Info Wrkr
Task Wrkr
Info Wrkr Task Wrkr0.0
5.0
10.0
15.0
20.0
25.0
30.0
35.0
40.0
11.2 10.5
7.4
1.1
1.4
0.7
15.1
22.8
Time by Business Activity - Summary
Non-Computing-Re-lated Activities
PC Systems Management
Collaborative Computing
Individual Comput-ing
Hour
s per
Wee
k
This worksheet estimates the business user productivity benefits enabled by the initiative. These benefits are calculated based on time savings of conducting common business activities. Although these benefits are "Indirect" (not part of the IT budget), they do typically improve profitability. The method below tends to be more conservative (yet more comprehensive) than other methods of estimating business user impacts. This productivity analysis only estimates efficiency improvements, not effectiveness (agility, decision-making) improvements. A "conversion factor" is applied because not all saved time may be used to conduct other value-added activities.
Info Wrkr Task Wrkr0.0
2.0
4.0
6.0
8.0
10.0
12.0
2.8 2.9
1.1 0.5
2.7
0.8
3.5
5.5
1.10.7
Time by Business Activity - Individual Computing
Other
LOB Application-Re-lated Activities
Email, Calendar, Contact, & Task Mgmt
Data & Information Access/Analysis
Document Creation
Hour
s per
Wee
k
Review/modify how much time (as a portion % of total work time) users typically spend conducting the common business activities below. Allocate time for the activity categories then the activity sub-categories. This is done for both information workers and structured task workers. The resulting hours per week is calculated.

document.xls Productivity 18 of 30
User Productivity Benefits Assessment
Allocation of Time Across Detailed Activities and Efficiency Improvements
Individual Computing Time % Hours / Week Time Saved
Activity Info Wrkr Comments
Document CreationDocument general layout/set-up 5% 5% 0.14 0.15 1% 0.00 0.00
Formatting documents 20% 15% 0.56 0.44 3% 0.02 0.02
Searching for functionality "how do I…" 10% 5% 0.28 0.15 3% 0.01 0.00
Creating graphics 10% 10% 0.28 0.29 3% 0.01 0.01
Typing, thinking 55% 65% 1.54 1.92 0% 0.00 0.01
Total (Time % must sum to 100%) 100% 100% 2.81 2.95 1% 0.04 0.04
Data & Information Access/AnalysisInternet browsing/viewing 40% 45% 0.45 0.24 3% 0.01 0.01
Searching for documents & folders 20% 15% 0.22 0.08 9% 0.02 0.01
Collecting/combining information 20% 20% 0.22 0.11 8% 0.02 0.01
Finding/accessing/combining data 10% 10% 0.11 0.05 9% 0.01 0.00
Data analysis & reporting 10% 10% 0.11 0.05 9% 0.01 0.00
Total (Time % must sum to 100%) 100% 100% 1.12 0.53 6% 0.07 0.03
Email, Calendar, Contact, & Task MgmtProcessing email 75% 75% 2.02 0.63 0% 0.00 0.00
Managing calendar, contacts, and tasks 15% 15% 0.40 0.13 0% 0.00 0.00
Note-taking, management 10% 10% 0.27 0.08 0% 0.00 0.00
Total (Time % must sum to 100%) 100% 100% 2.69 0.84 0% 0.00 0.00
LOB Application-Related Activities
20% 40% 0.70 2.19 10% 0.07 0.22
80% 60% 2.78 3.28 5% 0.14 0.16
Total (Time % must sum to 100%) 100% 100% 3.48 5.47 3% 0.07 0.22
OtherDevelopment time (macros, VBA, Access) 4% 4% 0.04 0.03 0% 0.00 0.00
Reading, thinking, etc. 96% 96% 1.08 0.71 0% 0.00 0.00
Other 0% 0% 0.00 0.00 0% 0.00 0.00
Total (Time % must sum to 100%) 100% 100% 1.12 0.74 0% 0.00 0.00
Total 11.22 10.52 2% 0.18 0.29
Efficiency Improve-
mentTask Wrkr
Info Wrkr
Task Wrkr
Info Wrkr
Task Wrkr
Data entry into LOB (line-of-business) applications
Using LOB applications (or the predecessor activity)
Info Wrkr Task Wrkr0.0
1.0
2.0
3.0
4.0
5.0
6.0
7.0
8.0
4.4
0.5
1.1
0.3
1.2
0.2
0.7
0.1
Time by Business Activity - Collaborative Computing
Other
Coordination / Project Mgmt
Workflow (routing)
Document Collab-oration
Hour
s per
Wee
k
Info Wrkr Task Wrkr0.0
0.2
0.4
0.6
0.8
1.0
1.2
1.4
1.6
0.50.3
0.4
0.2
0.2
0.0
0.2
0.1
0.1
0.1
0.1
0.0
Time by Business Activity - PC Systems Management
Availability & Reli-ability
System UI Navigation
Security & Privacy
Mobility & Remote Connectivity
Performance
Support, Self-Help, & Learning
Hour
s per
Wee
k
Allocate user time across each of the detailed activities below. Hours per week is calculated/displayed. Then estimate the percent improvement in activity efficiency enabled by the initiative. Hours saved per week is calculated/displayed. For example, if a user spends 1 hour per week conducting an activity, a 10% efficiency improvement should free up 6 minutes per week for other value-adding work. Note that a 10% efficiency improvement does not imply that the user will spend 10% less time conducting that activity (they may do more of that activity if they are more efficient at it); it does imply that the user is expected to complete that activity 10% more efficiently.

document.xls Productivity 19 of 30
User Productivity Benefits AssessmentCollaborative Computing Time % Hours / Week Time Saved
Activity Info Wrkr Comments
Document Collaboration
60% 60% 2.65 0.30 0% 0.00 0.00
Meetings (document-collaboration-focused) 35% 35% 1.55 0.17 0% 0.00 0.00
Document management 5% 5% 0.22 0.02 0% 0.00 0.00
Total (Time % must sum to 100%) 100% 100% 4.42 0.49 0% 0.00 0.00
Workflow (routing)
50% 50% 0.55 0.15 0% 0.00 0.00
Workflow activities - electronic 50% 50% 0.55 0.15 0% 0.00 0.00
Total (Time % must sum to 100%) 100% 100% 1.10 0.29 0% 0.00 0.00
Coordination / Project Mgmt
70% 70% 0.83 0.11 0% 0.00 0.00
Coordination of other business activities 30% 30% 0.35 0.05 0% 0.00 0.00
Total (Time % must sum to 100%) 100% 100% 1.18 0.16 0% 0.00 0.00
Other
70% 90% 0.46 0.09 0% 0.00 0.00
30% 10% 0.20 0.01 0% 0.00 0.00
Other 0% 0% 0.00 0.00 0% 0.00 0.00
Total (Time % must sum to 100%) 100% 100% 0.66 0.11 0% 0.00 0.00
Total 7.37 1.05 0% 0.00 0.00
PC Systems Management Time % Mins / Week
Activity Info Wrkr Comments
Support, Self-Help, & LearningSupport time (helpdesk) 20% 20% 5.9 3.4 15% 0.9 0.5
Unproductive resolution lag time (downtime) 15% 15% 4.4 2.5 15% 0.7 0.4
PC upgrade; OS re-install 5% 5% 1.5 0.8 23% 0.3 0.2
Install SW, patches, peripherals, drivers 20% 20% 5.9 3.4 25% 1.5 0.8
40% 40% 11.8 6.7 6% 0.7 0.4
Total (Time % must sum to 100%) 100% 100% 29.46 16.84 14% 4.06 2.32
PerformanceProcessor/HDD response time 30% 30% 6.3 3.2 50% 3.2 1.6
Network/Server response time 30% 30% 6.3 3.2 50% 3.2 1.6
PC start-up, shut-down, resume 40% 40% 8.4 4.2 20% 1.7 0.8
Total (Time % must sum to 100%) 100% 100% 21.05 10.52 38% 8.00 4.00
Mobility & Remote Connectivity
Remote & wireless connectivity, Network issues 20% 20% 2.9 0.5 10% 0.3 0.1
Lost productivity due to dead laptop battery 15% 15% 2.1 0.4 12% 0.3 0.0
Laptop shut-down, start-up, wake/resume 45% 45% 6.4 1.1 12% 0.8 0.1
Time managing/accessing files for off-line use 20% 20% 2.9 0.5 9% 0.3 0.0
Total (Time % must sum to 100%) 100% 100% 14.31 2.53 11% 1.57 0.28
Security & PrivacySecurity pre-cautions 90% 90% 9.8 5.7 18% 1.7 1.0
Virus, adware and other security issues 5% 5% 0.5 0.3 24% 0.1 0.1
Intrusion, unauthorized use, data loss 5% 5% 0.5 0.3 24% 0.1 0.1
Total (Time % must sum to 100%) 100% 100% 10.94 6.31 18% 1.99 1.15
System UI NavigationUser Interface navigation 75% 75% 3.8 2.5 18% 0.7 0.4
Change system settings, preferences 25% 25% 1.3 0.8 18% 0.2 0.1
Total (Time % must sum to 100%) 100% 100% 5.05 3.37 18% 0.88 0.59
Availability & ReliabilityRecovering from crashes/conflicts 70% 70% 2.4 1.8 35% 0.8 0.6
Rework due to lost work 30% 30% 1.0 0.8 35% 0.4 0.3
Total (Time % must sum to 100%) 100% 100% 3.37 2.53 35% 1.18 0.88
Total (Hours per Week) 1.40 0.70 21% 0.29 0.15
Non-Computing-Related Activities 15.08 22.80 0% 0.00 0.00
Total 35.1 35.1 1% 0.5 0.4
Efficiency Improve-
mentTask Wrkr
Info Wrkr
Task Wrkr
Info Wrkr
Task Wrkr
Document collaboration (collaborative authoring, sharing, reviewing, debating, mark-up, change consolidation)
Workflow activities – paper-based (review, approval, routing, signature collection)
Document-creation-intensive project coordination/management (issue tracking, task management, document status)
Reporting - Disseminating and managing documentation/reports
Social networking (connecting people, sharing re-usable knowledge)
Efficiency Improve-
ment
Time Saved (Mins)
Task Wrkr
Info Wrkr
Task Wrkr
Info Wrkr
Task Wrkr
Self-help - system "how-to" questions; Peer support

document.xls Productivity 20 of 30
User Productivity Benefits AssessmentSummary of Productivity Improvements (Time Saved)
Info Workers Task Workers Total (Weighted Average)
As-Is To-Be Saved As-Is To-Be Saved As-Is To-Be SavedIndividual Computing
Document Creation 2.8 2.8 0.04 1% 2.9 2.9 0.04 1% 2.9 2.8 0.0 1%Data & Information Access/Analysis 1.1 1.1 0.07 6% 0.5 0.5 0.03 6% 0.8 0.7 0.0 6%Email, Calendar, Contact, & Task Mgmt 2.7 2.7 0.00 0% 0.8 0.8 0.00 0% 1.7 1.7 0.0 0%LOB Application-Related Activities 3.5 3.4 0.07 2% 5.5 5.3 0.22 4% 4.6 4.4 0.2 3%Other 1.1 1.1 0.00 0% 0.7 0.7 0.00 0% 0.9 0.9 0.0 0%Total 11.2 11.0 0.18 2% 10.5 10.2 0.29 3% 10.8 10.6 0.24 2%
Collaborative ComputingDocument Collaboration 4.4 4.4 0.00 0% 0.5 0.5 0.00 0% 2.2 2.2 0.0 0%Workflow (routing) 1.1 1.1 0.00 0% 0.3 0.3 0.00 0% 0.7 0.7 0.0 0%Coordination / Project Mgmt 1.2 1.2 0.00 0% 0.2 0.2 0.00 0% 0.6 0.6 0.0 0%Other 0.7 0.7 0.00 0% 0.1 0.1 0.00 0% 0.4 0.4 0.0 0%Total 7.4 7.4 0.00 0% 1.1 1.1 0.00 0% 3.9 3.9 0.00 0%
PC Systems ManagementSupport, Self-Help, & Learning 0.5 0.4 0.07 14% 0.3 0.2 0.04 14% 0.4 0.3 0.1 14%Performance 0.4 0.2 0.13 38% 0.2 0.1 0.07 38% 0.3 0.2 0.1 38%Mobility & Remote Connectivity 0.2 0.2 0.03 11% 0.0 0.0 0.00 11% 0.1 0.1 0.0 11%Security & Privacy 0.2 0.1 0.03 18% 0.1 0.1 0.02 18% 0.1 0.1 0.0 18%System UI Navigation 0.1 0.1 0.01 18% 0.1 0.0 0.01 18% 0.1 0.1 0.0 17%Availability & Reliability 0.1 0.0 0.02 35% 0.0 0.0 0.01 35% 0.0 0.0 0.0 35%Total 1.4 1.1 0.29 21% 0.7 0.5 0.15 22% 1.0 0.8 0.22 21%
Non-Computing-Related Activities 15.1 15.1 0 0% 22.8 22.8 0 0% 19.4 19.4 0.0 0%
Total 35.1 34.6 0.5 1.4% 35.1 34.6 0.4 1.3% 35.1 34.6 0.5 1.3%
SummaryIndividual Computing 11.2 11.0 0.18 2% 10.5 10.2 0.29 3% 10.8 10.6 0.2 2%Collaborative Computing 7.4 7.4 0.00 0% 1.1 1.1 0.00 0% 3.9 3.9 0.0 0%PC Systems Management 1.4 1.1 0.29 21% 0.7 0.5 0.15 22% 1.0 0.8 0.2 21%Non-Computing-Related Activities 15.1 15.1 0.00 0% 22.8 22.8 0.00 0% 19.4 19.4 0.0 0%Total 35.1 34.6 0.5 1.4% 35.1 34.6 0.4 1.3% 35.1 34.6 0.5 1.3%
% Savings
% Savings
% Savings
The table below summarizes time saved by business activity category.
Individual Computing
Collaborative Computing
PC Systems Management
Non-Computing-Related Activi-ties
0 5 10 15 20 25
10.8
3.9
1.0
19.4
10.6
3.9
0.8
19.4
Summary
To-BeAs-Is
Time (Hours / Week)
Document Creation
Data & Information Access/Analysis
Email, Calendar, Contact, & Task Mgmt
LOB Application-Related Activities
Other
0 1 2 3 4 5
2.9
0.8
1.7
4.6
0.9
2.8
0.7
1.7
4.4
0.9
Individual Computing
To-BeAs-Is
Time (Hours / Week)
Support, Self-Help, & Learning
Performance
Mobility & Remote Connectivity
Security & Privacy
System UI Navigation
Availability & Reliability
0.0 0.1 0.2 0.3 0.4
0.4
0.3
0.1
0.1
0.1
0.0
0.3
0.2
0.1
0.1
0.1
0.0
PC Systems Management
To-BeAs-Is
Time (Hours / Week)
Document Collaboration
Workflow (routing)
Coordination / Project Mgmt
Other
0 1 2 3
2.2
0.7
0.6
0.4
2.2
0.7
0.6
0.4
Collaborative Computing
To-BeAs-Is
Time (Hours / Week)

document.xls Productivity 21 of 30
User Productivity Benefits AssessmentBusiness Value of Time Saved
Productivity Conversion Factor* (0%-100%) 50%
Value per User per Year
Info Wrkr
Individual ComputingDocument Creation $ 110 $ 74 $ 90 $ 45 $ 45 Data & Information Access/Analysis $ 189 $ 66 $ 121 $ 60 $ 60 Email, Calendar, Contact, & Task Mgmt $ - $ - $ - $ - $ - LOB Application-Related Activities $ 186 $ 460 $ 338 $ 169 $ 169 Other $ - $ - $ - $ - $ - Total $ 484 $ 600 $ 549 $ 274 $ 274
Collaborative ComputingDocument Collaboration $ - $ - $ - $ - $ - Workflow (routing) $ - $ - $ - $ - $ - Coordination / Project Mgmt $ - $ - $ - $ - $ - Other $ - $ - $ - $ - $ - Total $ - $ - $ - $ - $ -
PC Systems ManagementSupport, Self-Help, & Learning $ 181 $ 81 $ 125 $ 63 $ 63 Performance $ 356 $ 140 $ 236 $ 118 $ 118 Mobility & Remote Connectivity $ 70 $ 10 $ 36 $ 18 $ 18 Security & Privacy $ 89 $ 40 $ 62 $ 31 $ 31 System UI Navigation $ 39 $ 21 $ 29 $ 14 $ 14 Availability & Reliability $ 52 $ 31 $ 41 $ 20 $ 20 Total $ 787 $ 323 $ 529 $ 265 $ 265
Non-Computing-Related Activities $ - $ - $ - $ - $ -
Total $ 1,271 $ 923 $ 1,078 $ 539 $ 539
SummaryIndividual Computing $ 484 $ 600 $ 549 $ 274 $ 274 Collaborative Computing $ - $ - $ - $ - $ - PC Systems Management $ 787 $ 323 $ 529 $ 265 $ 265 Non-Computing-Related Activities $ - $ - $ - $ - $ - Total $ 1,271 $ 923 $ 1,078 $ 539 $ 539
© Copyright, 2006-2008, Hall Consulting & Research LLC, All Rights Reserved. www.hallcr.com
Task Wrkr
Weighted Avg
*Total Adjusted
Adjusted (Per PC)
The table below calculates the value of time saved. Annual value is calculated by multiplying the hours saved per year times fully burdened hourly rate. The adjusted value is discounted by the "Productivity Conversion Factor". The adjusted value is the productivity benefit value used elsewhere in the workbook.
*Not all saved time will necessarily be used to conduct other value-adding activities. For example, if an employee completes assigned work more quickly and simply goes home earlier, no added business value will result. However, organizations typically do find ways to convert most time saved into real business value (even without laying off employees). For example: avoid hiring as the organization grows; redistributing work; re-deploying employees; conducting other activities; or simply filling in the saved time with more work that wouldn't otherwise get done. The "Productivity Conversion Factor" discounts the value of the time saved to account for inefficiencies/delays in converting the time saved into real business value. Since estimating time savings cannot easily be done accurately, it is also used to provide more conservative $ values. A 100% Productivity Converstion Factor applies no discount.
$-
$100
$200
$300
$400
$500
$600
$274
$-
$265
Business Value of Produc-tivity Benefits
PC Systems Management
Collaborative Computing
Individual Computing
An
nu
al P
rod
ucti
vity
Be
ne
fits
($
/PC
)

document.xls Revenue 22 of 30
Revenue Increase Enabled by the Solution
Segment Revenue Revenue Increase Driver %
Revenue ($000) Oth
er
Comments
Segment A1 3.0% $ 117,744 10.3% 1.5% 0.0% 0.5% 0.0% 0.0% 0.0% 0.0% $ 243
Segment A2 3.0% $ 117,744 10.3% 1.5% 0.0% 0.5% 0.0% 0.0% 0.0% 0.0% $ 243
Segment A3 3.0% $ 117,744 10.3% 1.5% 0.0% 0.5% 0.0% 0.0% 0.0% 0.0% $ 243
Segment A4 2.0% $ 78,496 10.3% 1.5% 0.0% 0.5% 0.0% 0.0% 0.0% 0.0% $ 162
Segment B1 2.0% $ 78,496 10.3% 1.5% 0.0% 0.5% 0.0% 0.0% 0.0% 0.0% $ 162
Segment B2 2.0% $ 78,496 10.3% 1.5% 0.0% 0.5% 0.0% 0.0% 0.0% 0.0% $ 162
Segment B3 2.0% $ 78,496 10.3% 1.5% 0.0% 0.5% 0.0% 0.0% 0.0% 0.0% $ 162
Segment B4 1.0% $ 39,248 10.3% 1.5% 0.0% 0.5% 0.0% 0.0% 0.0% 0.0% $ 81
Segment C1 1.0% $ 39,248 10.3% 1.5% 0.0% 0.5% 0.0% 0.0% 0.0% 0.0% $ 81
Segment C2 1.0% $ 39,248 10.3% 1.5% 0.0% 0.5% 0.0% 0.0% 0.0% 0.0% $ 81
Segment C3 1.0% $ 39,248 10.3% 1.5% 0.0% 0.5% 0.0% 0.0% 0.0% 0.0% $ 81
Segment C4 1.0% $ 39,248 10.3% 1.5% 0.0% 0.5% 0.0% 0.0% 0.0% 0.0% $ 81
All Other (Not Impacted) 78.0% $ 3,061,348 0.0% 0.0% 0.0% 0.0% 0.0% 0.0% 0.0% 0.0% $ -
Total 100% $ 3,924,805 2.3% $ 1,784
Summary
Revenue ($000) Margin ($000)Improved Sales Effectiveness $ 12,952 $ 1,338 $ 268 Improved Marketing Effectiveness $ - $ - $ - Improved Customer Service $ 4,317 $ 446 $ 89
New/Expanded Channels/Geographies $ - $ - $ -
New/Enhanced Products/Services $ - $ - $ -
Improved Product Availability (fill rate, up-time) $ - $ - $ -
Other $ - $ - $ - Total (Annual) $ 17,269 $ 1,784 $ 357 Total (3-Year) $ 51,807 $ 5,351 $ 1,070
© Copyright, 2006-2008, Hall Consulting & Research LLC, All Rights Reserved. www.hallcr.com
Addressed Segments (products, channels, geographies, business
unit, and/or markets)
Revenue (% of Total)
Profit Margin (% of Sales) Im
pro
ved S
ale
s Eff
ect
iveness
Impro
ved
Mark
eti
ng
Eff
ect
iveness
Impro
ved
Cust
om
er
Serv
ice
New
/Expanded
Channels
/Geogra
ph
ies
New
/Enhance
d
Pro
duct
s/Serv
ices
Impro
ved P
roduct
A
vaila
bili
ty (
fill
rate
, up-t
ime)
Annual Benefit ($000)
Benefit ($ per PC)
This worksheet estimates incremental revenue enabled by the solution. Not all projects will have credibly quantifiable revenue impacts. Revenue impacts can be difficult to accurately assess. Research, analysis, and supplemental modeling is likely needed to credibly estimate true revenue impacts. One key is to target (at a detailed level) precisely what portion of revenue is likely to be impacted (the segment) and how the solution is enabling the revenue increase (the driver). This model assumes the initiative will enable a one-time revenue increase (the same annual revenue benefit throughout the life of the solution).Note that the benefit is the marginal profit on the incremental revenue, not the revenue itself. We recommend using net operating profit, not gross margin: in the long run, on average, fixed costs tend to increase at the same rate as revenue growth.
Benefit ($ per PC)
$0
$50
$100
$150
$200
$250
$300
$350
$400
$268
$-
$89
$- $- $- $-
Revenue Growth (Margin)
Other
Improved Product Availability (fill rate, up-time)New/Enhanced Products/Services
New/Expanded Chan-nels/Geographies
Improved Customer Service
Improved Marketing Effec-tiveness
Improved Sales Effec-tiveness
Ann
ual B
enefi
t pe
r PC
The table and graph below summarize the annual revenue gain and margin on the revenue gain (the benefit).

document.xls KPIs 23 of 30
Key Performance Indicator (KPI) Assessment (Optional)
Organization Performance Percentile KPI Value
Business Objective KPI / Metric Laggard As-Is To-Be As-Is To-Be Comments
Sales/Marketing PerformanceCustomer Acquisition 15% 19% 30% 30% 16% 16% 0%
Customer Retention Customer annual turnover (%) 12% 10% 30% 30% 11% 11% 0%
Customer Satisfaction 30% 95% 40% 40% 56% 56% 0%
Time to respond to RFP (days) 10.0 5.0 30% 30% 8.5 8.5 0%
Business Management Effectiveness
10.0 5.0 30% 30% 8.5 8.5 0%
Business Visibility 15% 75% 30% 30% 33% 33% 0%
Business Alignment 15% 75% 30% 30% 33% 33% 0%
Decision success rate % 65% 75% 30% 30% 68% 68% 0%
Information Availability % of desired information readily available 30% 60% 30% 30% 39% 39% 0%
Information Quality 30% 75% 30% 30% 44% 44% 0%
5.0 3.0 50% 50% 4.0 4.0 0%
Supply/Operations Performance
30% 70% 30% 30% 42% 42% 0%
Defect rate 45.0 2.0 50% 50% 23.5 23.5 0%
Forecast Accuracy Avg forecast error % 25% 13% 30% 30% 21% 21% 0%
On-time delivery 90% 95% 30% 30% 91% 91% 0%
Cash Cycle Time Days 30.0 24.0 30% 30% 28.2 28.2 0%
50% 70% 30% 30% 56% 56% 0%
Technology Effectiveness
30% 99% 30% 50% 51% 65% 27%
SLA achievement % 10% 90% 40% 70% 42% 66% 57%
Maturity Level Best practice adoption % 10% 90% 40% 70% 42% 66% 57%
System response time 3.0 0.2 50% 80% 1.6 0.8 52%
Application delivery agility 120.0 35.0 50% 80% 77.5 52.0 33%
30% 95% 40% 60% 56% 69% 23%
Security # of vulnerabilities (reduce attack surface) 50.0 20.0 40% 70% 38.0 29.0 24%
Industry KPI Values
World Class
Improve-ment %
Close rate (% of qualified sales opportunities)
% of customers that are highly satisfied when surveyed
Sales-based document collaboration Efficiency
Decision-Making Speed / Reaction Time to Market Event/Opportunity
Days to accumulate information, analyze, collaborate, decide, plan (for information-intensive decisions)
% of analytical data easily accessible to authorized decision-makers
% of org. with auto-updated KPIs linked to corporate objectives
Decision-Making Effectiveness
% of analytical data with single trusted access point
Mergers & Acquisition Analysis Speed
Months to complete analysis, workflows, due diligence, regulatory approvals, legal docs, etc.
Quality of Products/Services
Customer preference vs. competitive products % (e.g. blind taste test)
# of process/product/service defects/errors per 1000
Supply Chain Effectiveness
Project management effectiveness
% of document-intensive projects that complete on-time / on-budget
Records Compliance (centralized content control)
% of electronic content (shared documents, reports, web content, email) that is controlled (retention, security, reuse, storage) centrally
Service Level Agreement Performance
Average system (local/LAN/WAN) response delay (Seconds)
Time (days) to deliver applications; time to start delivery
User computing experience satisfaction
% of users that are highly satisfied when surveyed
Not all benefits can credibly be translated into financial ($) benefit terms. These are sometimes referred to as intangible benefits. This worksheet provides a structure (one of many) to estimate how the initiative may impact non-financial KPIs.
The percentiles shown are how the organization's KPI performance compares to others in the industry. 0% represents worst performance in the industry (laggard); 50% is average performance; 100% is best in the industry (world class performance). For example, being at the 20th percentile implies that 80% of the other organizations in the industry perform better. The "Improvement" indicates how much the organization is expected to improve KPI performance due to the solution. The model assumes a linear relationship between KPI performance and industry percentile -- a simplifying assumption.
Select "Business Objectives" and KPIs that are important to your business and are expected to be significantly impacted by the solution. Estimate "Laggard" and "World Class" KPI values in your industry. Next determine what percentile your organization is currently performing at (the as-is KPI value is calculated). Next determine to what percentile you expect the initiative will take you to. The to-be KPI value (and % improvement) are calculated.

document.xls KPIs 24 of 30
Key Performance Indicator (KPI) Assessment (Optional)Summary
PercentileAs-Is To-Be Imp.
Sales/Marketing Performance 33% 33% 0%Business Management Effectiveness 33% 33% 0%Supply/Operations Performance 33% 33% 0%Technology Effectiveness 41% 69% 27%Average 35% 42% 7%
© Copyright, 2006-2008, Hall Consulting & Research LLC, All Rights Reserved. www.hallcr.com
Sales/Marketing Performance
Business Man-agement Effec-
tiveness
Supply/Operations Performance
Technology Effec-tiveness
0%
20%
40%
60%
80%
100%
33% 33% 33%
41%
33% 33% 33%
69%
KPI Performance Comparison As-IsTo-Be
Performance Percentile
World Class
Laggard
The category as-is, to-be, and improvement average percentiles are summarized below. Note: the improvement (Imp.) is not the KPI value % improvement, it shows the percentile point improvement.

document.xls ROI 25 of 30
Financial Analysis
Summary of Results
Per PCCosts (3-Yr) $ 1,743 $ 8,716 Benefits (3-Yr) $ 5,339 $ 26,697 Net Benefits $ 3,596 $ 17,982 NPV (Net Present Value) $ 2,782 $ 13,908
206%
IRR (Internal Rate of Return) 124%Payback Period 9 MonthsNumber of PCs 5000
Costs & Benefits ($ per PC) Costs & Benefits ($000)
One-Time One-Time 3-Year TotalCosts $ 1,242 $ 167 $ 1,743 $ 6,210 $ 835 $ 8,716 Benefits $ 75 $ 1,755 $ 5,339 $ 376 $ 8,774 $ 26,697
Cost Summary
Costs ($ per PC) Costs ($000)
One-Time One-Time 3-Year TotalHardware $ 606 $ 91 $ 879 $ 3,030 $ 455 $ 4,394 Software $ 150 $ 34 $ 253 $ 748 $ 172 $ 1,265 IT Labor, Services, & Training $ 213 $ 18 $ 268 $ 1,067 $ 91 $ 1,340 End-User Labor & Training $ 273 $ 24 $ 343 $ 1,364 $ 118 $ 1,717
Total $ 1,242 $ 167 $ 1,743 $ 6,210 $ 835 $ 8,716
Organization Total ($000)
ROI (Return on Investment) - [Total Net Benefits / Total Costs]
Annual On-Going
3-Year Total
Annual On-Going
Annual On-Going
3-Year Total
Annual On-Going
Costs (3-Yr) Benefits (3-Yr)$0
$1,000
$2,000
$3,000
$4,000
$5,000
$6,000
$1,743
$5,339
Total Costs Vs Benefits
Co
sts
& B
en
efi
ts (
$/P
C)The tables and graphs summarize the costs and benefits and calculates ROI, NPV, IRR, and payback period. The results are shown average per PC
and the total for the organization.
Below are the initial design/development/deployment and added annual on-going costs required to fully deploy, adopt and support the initiative. Additional details can be found below and on the "Cost" worksheet.
This model simulates the costs and benefits of the initiative. The tables and charts below summarize the tool results.
3-Year Total $-
$200
$400
$600
$800
$1,000
$1,200
$1,400
$1,600
$1,800
$2,000
$879
$253
$268
$343
Initiative Cost Summary (per PC)
End-User Labor & Training
IT Labor, Services, & Training
Software
Hardware
Cost
s ($
per P
C)
3-Year Total $-
$1,000
$2,000
$3,000
$4,000
$5,000
$6,000
$2,253
$400
$1,616
$1,070
Initiative Benefit Summary (per PC)
Revenue Growth
User Productivity Benefits
Other Direct Cost Sav-ings
IT Labor/Services TCO Savings
Bene
fits (
$ pe
r PC)

document.xls ROI 26 of 30
Financial AnalysisThis model simulates the costs and benefits of the initiative. The tables and charts below summarize the tool results.
Benefits Summary
Benefits ($ per PC) Benefits ($000)
Benefit Summary One-Time One-Time 3-Year TotalIT Labor/Services TCO Savings $ - $ 751 $ 2,253 $ - $ 3,755 $ 11,264 Other Direct Cost Savings $ 75 $ 108 $ 400 $ 376 $ 542 $ 2,001 User Productivity Benefits $ - $ 539 $ 1,616 $ - $ 2,694 $ 8,082 Revenue Growth $ - $ 357 $ 1,070 $ - $ 1,784 $ 5,351
Total $ 75 $ 1,755 $ 5,339 $ 376 $ 8,774 $ 26,697
Benefit Sub-CategoriesIT Labor/Services TCO Savings $ - $ 751 $ 2,253 $ - $ 3,755 $ 11,264 Other Direct Cost Savings
IT Savings $ 75 $ 94 $ 356 $ 376 $ 468 $ 1,781 Business Savings $ - $ 15 $ 44 $ - $ 73 $ 220 Total $ 75 $ 108 $ 400 $ 376 $ 542 $ 2,001
User Productivity BenefitsIndividual Computing $ - $ 274 $ 823 $ - $ 1,372 $ 4,115 Collaborative Computing $ - $ - $ - $ - $ - $ - PC Systems Management $ - $ 265 $ 794 $ - $ 1,323 $ 3,968 Total $ - $ 539 $ 1,616 $ - $ 2,694 $ 8,082
Revenue Growth $ - $ 357 $ 1,070 $ - $ 1,784 $ 5,351
Total $ 75 $ 1,755 $ 5,339 $ 376 $ 8,774 $ 26,697
Cash Flow
Initial Year 1 Year 2 Year 3 Year 4 Year 5 Total NPVCosts $ 1,242 $ 167 $ 167 $ 167 $ - $ - $ 1,743 $ 1,657 Benefits $ 75 $ 1,755 $ 1,755 $ 1,755 $ - $ - $ 5,339 $ 4,439 Net Benefits $ (1,167) $ 1,588 $ 1,588 $ 1,588 $ - $ - $ 3,596 $ 2,782 Cumulative Cash Flow $ (1,167) $ 421 $ 2,009 $ 3,596 $ 3,596 $ 3,596 Payback Period (Months) 9
Annual On-Going
3-Year Total
Annual On-Going
0 1 2 3 4 5-$2,000
-$1,000
$0
$1,000
$2,000
$3,000
$4,000Cumulative Cash Flow
Year
Cu
mu
lati
ve
Cash
Flo
w (
$/P
C)
Below are the benefits enabled by the initiative. The detailed calculations are below and on the green benefit tabs.
Shown below are the costs and benefits by year, the net benefits (benefits-costs), and the cumulative cash flow. This is used to calculate payback period, IRR, and NPV.
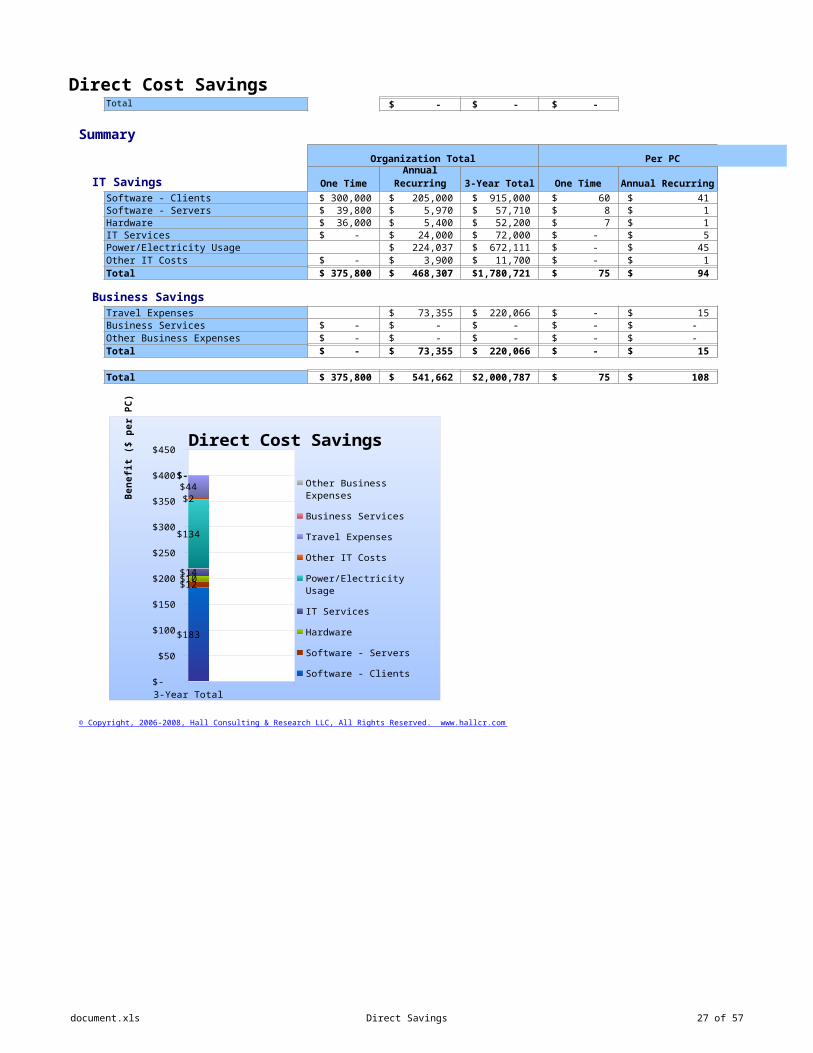
document.xls ROI 27 of 30
Financial AnalysisThis model simulates the costs and benefits of the initiative. The tables and charts below summarize the tool results.
Cost Details
Costs ($ per PC) Costs ($000)
Cost / Benefit Category One-Time One-Time 3-Year TotalHardware
Client Hardware $ 600 $ 90 $ 870 $ 3,000 $ 450 $ 4,350 Server Hardware $ 6 $ 1 $ 9 $ 30 $ 5 $ 44
Total $ 606 $ 91 $ 879 $ 3,030 $ 455 $ 4,394 Software
Client Software $ 143 $ 33 $ 242 $ 715 $ 164 $ 1,208 Server Software $ 7 $ 2 $ 11 $ 33 $ 8 $ 56
Total $ 150 $ 34 $ 253 $ 748 $ 172 $ 1,265 IT Labor, Services, & Training
One-time Implementation Labor/Services $ 151 $ - $ 151 $ 753 $ - $ 753 Annual On-Going Labor/Services $ - $ 18 $ 55 $ - $ 91 $ 273 Incremental Help Desk Calls $ 11 $ - $ 11 $ 54 $ - $ 54 IT Training $ 52 $ - $ 52 $ 261 $ - $ 261
Total $ 213 $ 18 $ 268 $ 1,067 $ 91 $ 1,340 End-User Labor & Training
End-User Labor $ 60 $ 24 $ 130 $ 299 $ 118 $ 652 End-User Training $ 213 $ - $ 213 $ 1,066 $ - $ 1,066
Total $ 273 $ 24 $ 343 $ 1,364 $ 118 $ 1,717
Total Costs $ 1,242 $ 167 $ 1,743 $ 6,210 $ 835 $ 8,716
Annual On-Going
3-Year Total
Annual On-Going
3-Year Total$0
$200
$400
$600
$800
$1,000
$1,200
$1,400
$1,600
$1,800
$2,000
$870
$9 $242 $11
$151 $55 $11 $52
$130
$213
Total Implementation Costs (Per PC)
End-User Training
End-User Labor
IT Training
Incremental Help Desk Calls
Annual On-Going Labor/Services
One-time Implementation Labor/Services
Server Software
Client Software
Server Hardware
Client Hardware
Tota
l Cos
ts ($
per
PC)
The table/chart below provide additional cost details.

document.xls ROI 28 of 30
Financial AnalysisThis model simulates the costs and benefits of the initiative. The tables and charts below summarize the tool results.
Benefit Details
IT Labor/Services TCO SavingsBenefits ($ per PC) Benefits ($000)
One-Time One-Time 3-Year TotalPC Management Services $ - $ 233 $ 699 $ - $ 1,164 $ 3,493 Help Desk (Tech Support) $ - $ 146 $ 437 $ - $ 728 $ 2,185 Server & Network Mgmt Services $ - $ 173 $ 520 $ - $ 867 $ 2,602 Application Development $ - $ 128 $ 383 $ - $ 638 $ 1,915 Administration & Other $ - $ 71 $ 214 $ - $ 356 $ 1,069
Total $ - $ 751 $ 2,253 $ - $ 3,755 $ 11,264
Other Direct Cost SavingsBenefits ($ per PC) Benefits ($000)
One-Time One-Time 3-Year Total
IT SavingsSoftware - Clients $ 60 $ 41 $ 183 $ 300 $ 205 $ 915 Software - Servers $ 8 $ 1 $ 12 $ 40 $ 6 $ 58 Hardware $ 7 $ 1 $ 10 $ 36 $ 5 $ 52 IT Services $ - $ 5 $ 14 $ - $ 24 $ 72 Power/Electricity Usage $ - $ 45 $ 134 $ - $ 224 $ 672 Other IT Costs $ - $ 1 $ 2 $ - $ 4 $ 12
Total $ 75 $ 94 $ 356 $ 376 $ 468 $ 1,781 Business Savings
Travel Expenses $ - $ 15 $ 44 $ - $ 73 $ 220 Business Services $ - $ - $ - $ - $ - $ - Other Business Expenses $ - $ - $ - $ - $ - $ -
Total $ - $ 15 $ 44 $ - $ 73 $ 220
Total Other Direct Cost Savings $ 75 $ 108 $ 400 $ 376 $ 542 $ 2,001
Annual On-Going
3-Year Total
Annual On-Going
Annual On-Going
3-Year Total
Annual On-Going
As-Is TCO To-Be TCO
$-
$500
$1,000
$1,500
$2,000
$2,500
$3,000
$3,500
$4,000
$625 $392
$396
$251
$774
$601
$1,144
$1,016
$559
$488
IT Labor TCO Comparison
Administration & Other
Application Devel-opment
Server & Network Mgmt Services
Help Desk (Tech Support)
PC Management Services
TC
O p
er
PC
pe
r Y
ea
r
PC Management Services
Help Desk (Tech Support)
Server & Network Mgmt Services
Application De-velopment
Administration & Other
$-
$200
$400
$600
$800
$1,000
$1,200
$1,400
0
5
10
15
20
25
30
35
40
45
50
$625 $396 $774 $1,144 $559 $392 $251 $601 $1,016 $488
26.8 25.2
33.2
47.3
25.2
19.5 18.5
27.1
42.6
22.4
IT Labor Comparison
As-Is TCO To-Be TCO As-Is FTEs To-Be FTEs
TC
O p
er
PC
pe
r Y
ea
r
FT
Es
(F
ull
Tim
e E
qu
iva
len
ts)
The tables/charts below provide additional details regarding each of the four quantified benefit types.

document.xls ROI 29 of 30
Financial AnalysisThis model simulates the costs and benefits of the initiative. The tables and charts below summarize the tool results.
User Productivity BenefitsBenefits ($ per PC) Benefits ($000)
One-Time One-Time 3-Year Total
Individual ComputingDocument Creation $ 45 $ 135 $ - $ 225 $ 674 Data & Information Access/Analysis $ 60 $ 181 $ - $ 302 $ 906 Email, Calendar, Contact, & Task Mgmt $ - $ - $ - $ - $ - LOB Application-Related Activities $ 169 $ 507 $ - $ 845 $ 2,535 Other $ - $ - $ - $ - $ -
Total $ - $ 274 $ 823 $ - $ 1,372 $ 4,115 Collaborative Computing
Document Collaboration $ - $ - $ - $ - $ - Workflow (routing) $ - $ - $ - $ - $ - Coordination / Project Mgmt $ - $ - $ - $ - $ - Other $ - $ - $ - $ - $ -
Total $ - $ - $ - $ - $ - $ - PC Systems Management
Support, Self-Help, & Learning $ 63 $ 188 $ - $ 314 $ 941 Performance $ 118 $ 354 $ - $ 590 $ 1,770 Mobility & Remote Connectivity $ 18 $ 55 $ - $ 91 $ 273 Security & Privacy $ 31 $ 93 $ - $ 154 $ 463 System UI Navigation $ 14 $ 43 $ - $ 72 $ 217 Availability & Reliability $ 20 $ 61 $ - $ 101 $ 304
Total $ - $ 265 $ 794 $ - $ 1,323 $ 3,968
Total User Productivity Benefits $ - $ 383 $ 1,148 $ - $ 1,913 $ 5,738
Annual On-Going
3-Year Total
Annual On-Going
3-Year Total $-
$50
$100
$150
$200
$250
$300
$350
$400
$450
$183
$12 $10 $14
$134
$2 $44 $- $-
Direct Cost Savings
Other Business Expenses
Business Services
Travel Expenses
Other IT Costs
Power/Electricity Usage
IT Services
Hardware
Software - Servers
Software - Clients
Bene
fit ($
per
PC)
Individual Computing
Collaborative Computing
PC Systems Management
Non-Computing-Related Activi-ties
0 5 10 15 20 25
10.8
3.9
1.0
19.4
10.6
3.9
0.8
19.4
Time per Activity
To-BeAs-Is
Time (Hours / Week)
$-
$100
$200
$300
$400
$500
$600
$274
$-
$265
Business Value of Productiv-ity Benefits
PC Systems Management
Collaborative Computing
Individual Comput-ing
An
nu
al P
rod
ucti
vity
Be
ne
fits
($
/PC
)

document.xls ROI 30 of 30
Financial AnalysisThis model simulates the costs and benefits of the initiative. The tables and charts below summarize the tool results. Revenue Growth
Benefits ($ per PC) Benefits ($000)
One-Time One-Time 3-Year TotalImproved Sales Effectiveness $ 268 $ 803 $ - $ 1,338 $ 4,013 Improved Marketing Effectiveness $ - $ - $ - $ - $ - Improved Customer Service $ 89 $ 268 $ - $ 446 $ 1,338 New/Expanded Channels/Geographies $ - $ - $ - $ - $ - New/Enhanced Products/Services $ - $ - $ - $ - $ -
$ - $ - $ - $ - $ -
Other $ - $ - $ - $ - $ - Total $ - $ 357 $ 1,070 $ - $ 1,784 $ 5,351
Summary of Non-Financial Key Performance Indicator Changes
Percentile
As-Is To-BeSales/Marketing Performance 32.5% 32.5% 0.0%Business Management Effectiveness 32.9% 32.9% 0.0%Supply/Operations Performance 33.3% 33.3% 0.0%Technology Effectiveness 41.4% 68.6% 27.1%Average 35.0% 41.8% 6.8%
Annual On-Going
3-Year Total
Annual On-Going
Improved Product Availability (fill rate, up-time)
Improve-ment
© Copyright, 2006-2008, Hall Consulting & Research LLC, All Rights Reserved. www.hallcr.com
Benefit ($ per PC)
$0
$50
$100
$150
$200
$250
$300
$350
$400
$268
$-
$89
$- $- $- $-
Annual Revenue Growth (Margin)
Other
Improved Product Availability (fill rate, up-time)
New/Enhanced Products/Services
New/Expanded Channels/Ge-ographies
Improved Customer Service
Improved Marketing Effectiveness
Improved Sales Effectiveness
Ann
ual B
enefi
t pe
r PC
Sales/Marketing Performance
Business Man-agement Effec-
tiveness
Supply/Operations Performance
Technology Effec-tiveness
0%
20%
40%
60%
80%
100%
33% 33% 33%
41%
33% 33% 33%
69%
KPI Performance Comparison As-IsTo-Be
Performance Percentile
World Class
Laggard
The table/chart below provides a summary of the 4 categories of non-financial KPIs. There are 4 to 10 specific KPIs in each category. The percentiles shown are how the organization compares to others in the industry. 0% represents worst performance in the industry (laggard); 50% is average performance; 100% is best in the industry (world class performance). The "Improvement" indicates how much the organization is expected to improve KPI performance due to the solution. Additional details can be found in the "KPIs" worksheet.