7 steps to quantify a roi from a pricing initiative
TRANSCRIPT

7 Steps to quantify a ROI from a pricing initiativeExamples from pricing excellence assessments
Page 2
COPYRIGHT © SYNCRON INTERNATIONAL AB 2015
Syncron is the global leader in aftermarket service
optimization
• Dealer Management and
Aftermarket Specialist
– Inventory management
– Price management
– Analytics
• Customers are multinational
companies
– Active users in more than 100
countries
– R&D intensive, investing >20% of
revenue
Meet the Presenter:
• 7+ years providing pricing
consulting services to
manufacturing companies
in several industry sectors
• Ph.D. Aftermarket
Solutions, Institute of
Technology at Linköping
University
Johan ÖstlinPricing Presales
Consultant at Syncron

Page 3
COPYRIGHT © SYNCRON INTERNATIONAL AB 2015
Pricing solutions create ROI with better pricing
and increased customer satisfaction
Main sources of ROI
• Better prices that drive revenue and profit
• Better pricing process that drives operational excellence
• Better customer satisfaction trough logical and explainable pricing
Steps to identify and quantify the potential gains from a pricing solution
• Evaluate current pricing strategies
and pricing methods
• Review current processes for pricing operation
• Perform fact-based data analysis

Page 4
COPYRIGHT © SYNCRON INTERNATIONAL AB 2015
Step 1 – As is Analysis
Gather the basic data for price strategy analysis
• Item master data (product groups, cost data)
• Sales transaction data (sales orders, rebates, bonuses)
• Current pricing rules
– Segments
– Markets
– Discounts
– Rebates
• Current list prices
Page 5
COPYRIGHT © SYNCRON INTERNATIONAL AB 2015
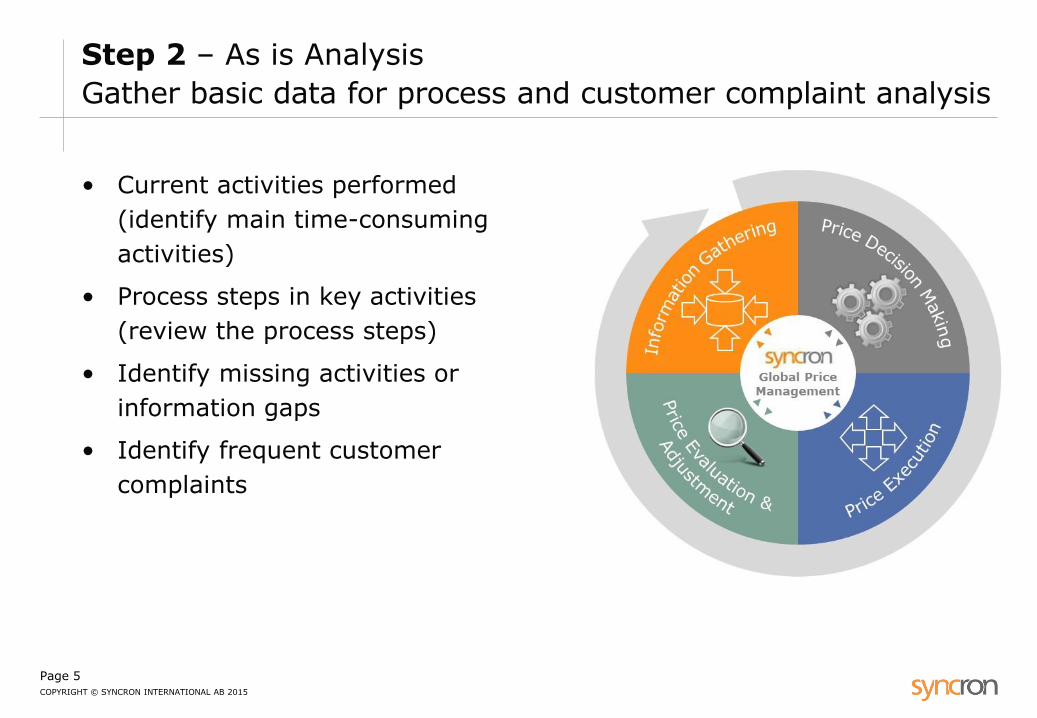
Step 2 – As is Analysis
Gather basic data for process and customer complaint analysis
• Current activities performed
(identify main time-consuming
activities)
• Process steps in key activities
(review the process steps)
• Identify missing activities or
information gaps
• Identify frequent customer
complaints

Page 6
COPYRIGHT © SYNCRON INTERNATIONAL AB 2015
Step 3 – Strategic Assessment on Current List Price Setting
How are the segments formulated today?
Can you redefine:
• What segmentation logics
are applied?
• How are different product
groups formulated?
• What pricing methods are
used?

Page 7
COPYRIGHT © SYNCRON INTERNATIONAL AB 2015
Step 3 – Strategic Assessment on Current List Price Setting
Select a subscope of segments to review
Accumulated Sales Value
100%
Segmentation Analysis
Main SegmentsSales
Value % MarginItem
NumbersAverage
Sale/Item Value Driver
DefinitionValue Driver
Access Cost
Quality
Potential Method
Inverters 5,2 Good 60 8 667 Good Good Good Value
Feed Screws 4,6 Good 45 10 222 Good Good Good Value
Hydraulic Motors 4,3 Mid. 10 43 000 List prices Good Poor Market
Impellers 3,8 Mid. 80 4 750 Good Good Good Value
Bearings 3,6 Low 200 1 800 List Prices Good Good Market
Filters 3,4 Low 150 2 267 Complex Poor Poor Value
Shafts 3,2 Good 100 3 200 Good Drawing Good Value
PC Boards 3,1 Good 400 775 Complex Poor Good Cost+
Sealing 3 Low 150 2 000 Good Description Poor Value
Segment
• Utilize different KPIs to select what segments to focus on
• Select the pricing method to use
– Evaluation of resources and risk to generate new prices

Page 8
COPYRIGHT © SYNCRON INTERNATIONAL AB 2015
Sa
les V
alu
e
Step 4 – Strategic Assessment on Current List Price Setting
Develop a new price suggestion
Price Logic
Potential
Price
Diameter
Price
Cost
• Increase Price Quality
Sales
• Identify logical value drivers
• Apply new value drivers on current situation

Page 9
COPYRIGHT © SYNCRON INTERNATIONAL AB 2015
Price Logic
Potential
Price
Diameter
Price
Cost
• Increase Price Quality
Target
Sales
Sa
les V
alu
e
Step 4 – Strategic Assessment on Current List Price Setting
Develop a new price suggestion
• Identify logical value drivers
• Apply new value drivers on current situation
• Create a new price target

Page 10
COPYRIGHT © SYNCRON INTERNATIONAL AB 2015
Price Logic
Potential
Price
Diameter
Price
Cost
• Increase Price Quality
Target
Competitor Price
Competitor Prices
Sales
Sa
les V
alu
e
Step 4 – Strategic Assessment on Current List Price Setting
Develop a new price suggestion
• Identify logical value drivers
• Apply new value drivers on current situation
• Create a new price target
• Identify potential target level
Relation to product value
Relation to competitors
− Independent market
− Competitor OEM
Relation to target margin
Market accepted level
Negotiated sales level

Page 11
COPYRIGHT © SYNCRON INTERNATIONAL AB 2015
Price Logic
Potential
Price
Diameter
• Increase Price Quality
Price
Cost
Target
Competitor Price
Sales
Sa
les V
alu
e
Step 4 – Strategic Assessment on Current List Price Setting
Develop a new price suggestion
• Identify logical value drivers
• Apply new value drivers on current situation
• Create a new price target
• Identify potential target level
Relation to product value
Relation to competitors
− Independent market
− Competitor OEM
Relation to target margin
Market accepted level
Negotiated sales level
• Adjust target level

Page 12
COPYRIGHT © SYNCRON INTERNATIONAL AB 2015
Price Logic
• Identify logical value drivers
• Apply new value drivers on current situation
• Create a new price target
• Identify potential target level
Relation to product value
Relation to competitors
− Independent market
− Competitor OEM
Relation to target margin
Market accepted level
Negotiated sales level
• Adjust target level
• Adjust current prices
Dampened over time
Potential
Price
Diameter
• Increase Price Quality
• Capture Price Potential
Price
Cost
Target
Competitor Price
Sales
Sa
les V
alu
e
Step 4 – Strategic Assessment on Current List Price Setting
Develop a new price suggestion
Page 13
COPYRIGHT © SYNCRON INTERNATIONAL AB 2015
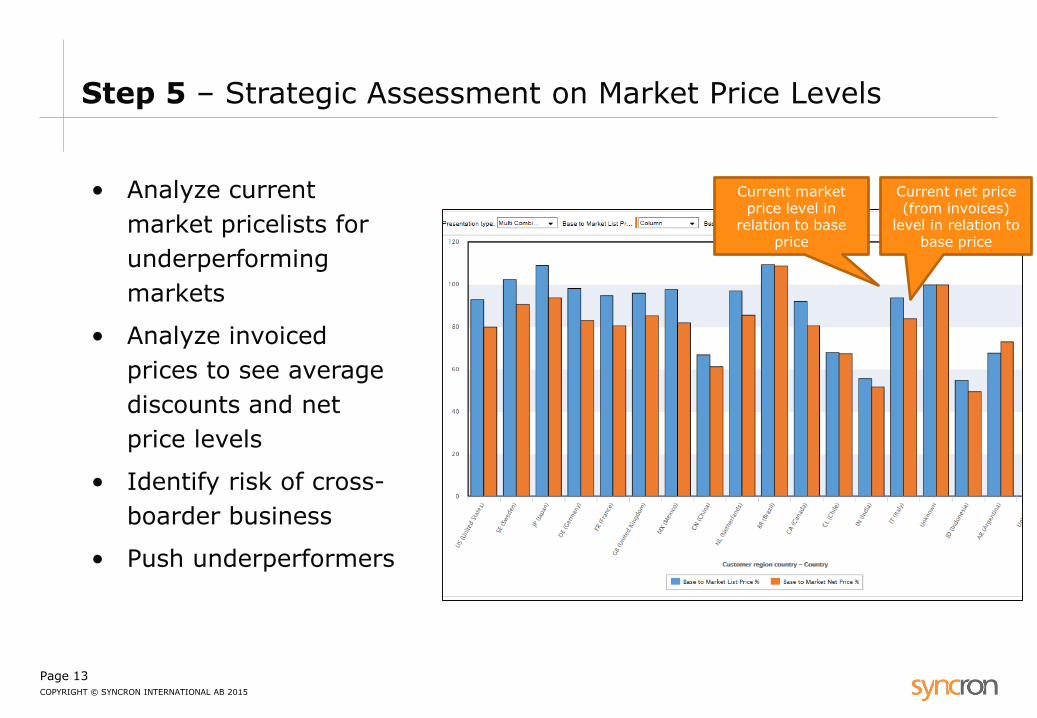
Step 5 – Strategic Assessment on Market Price Levels
Current market price level in
relation to base price
Current net price (from invoices)
level in relation to base price
• Analyze current
market pricelists for
underperforming
markets
• Analyze invoiced
prices to see average
discounts and net
price levels
• Identify risk of cross-
boarder business
• Push underperformers

Page 14
COPYRIGHT © SYNCRON INTERNATIONAL AB 2015
Step 6 – Strategic Assessment of Customer Segmentation
for One Market
• Take in key customer data
– Size (of installed base), industry, loyalty, purchasing capabilities,
operational capabilities, order types, number of subsidiaries,
channel type, strategic accounts
– Cost to serve (purchase frequency, average order size, service
need)
• Evaluate key dimensions and develop a customer segmentation
framework
– Statistical significance of customer variables
– Salesforce experience in a heuristic approach

Page 15
COPYRIGHT © SYNCRON INTERNATIONAL AB 2015
Step 6 – Strategic Assessment of Customer Segmentation
for One Market – Develop a new segmentation
• Customer segmentation needs to be clear and manageable
• Analyze current discount and purchase patterns in the segment
– Discounts in-between customer segments
– Discount spreads in a segment
– Discounts for product groups
Customer Base
End Customers
Food and Processing
Manufacturing
Small Installed
Base
MediumInstalled
Base
LargeInstalled
Base
Buyer is: Professional
Buyers
Buyer is: Service
Technicians
Buyer is:Production Manager
Aerospace
Dealers DistributorsStrategic Accounts
Company A Company B
Page 16
COPYRIGHT © SYNCRON INTERNATIONAL AB 2015
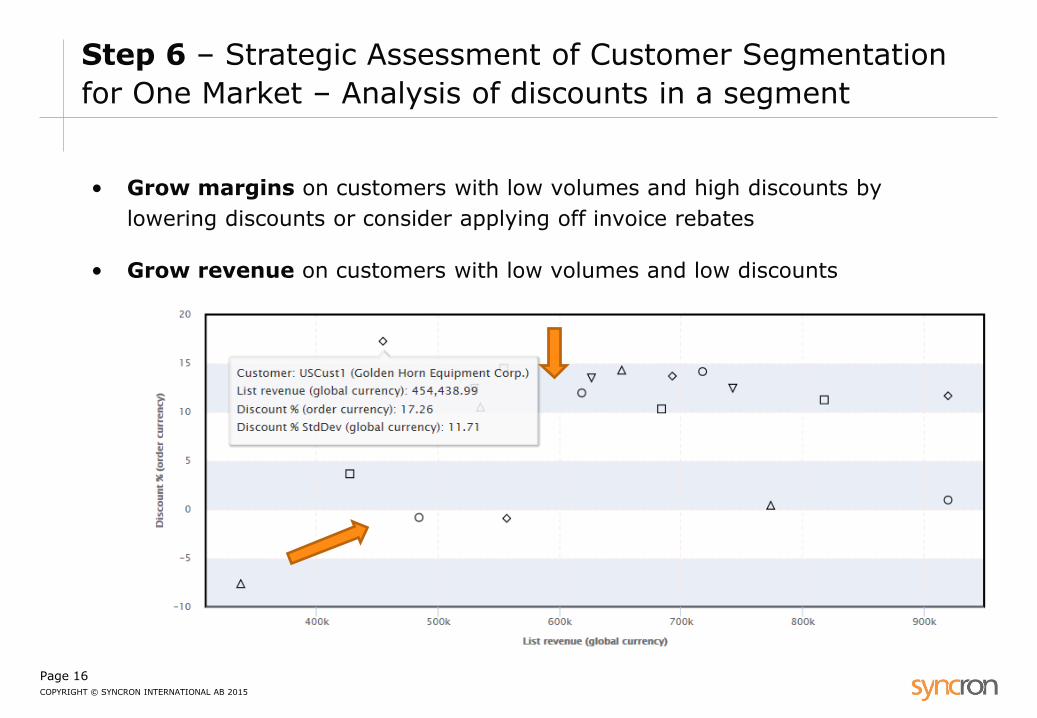
Step 6 – Strategic Assessment of Customer Segmentation
for One Market – Analysis of discounts in a segment
• Grow margins on customers with low volumes and high discounts by
lowering discounts or consider applying off invoice rebates
• Grow revenue on customers with low volumes and low discounts

Page 17
COPYRIGHT © SYNCRON INTERNATIONAL AB 2015
Step 7 – Summarize a Business Case
Base on better prices
Business Potential –Revenue Increase
Without Price Elasticity
Low PriceElasticity
Medium Price
Elasticity
High Price
Elasticity
Value-Based Pricing 5% 4.5% 3% 2%
Market-Based Pricing 2% 1.5% 0.5% -0.5%
BoM/KIT Pricing 7% 6.5% 6% 5.5%
German Price Level 3% 2.5% 1.5% 1%
Spain Price Level 2% 1.5% 0.5% 0%
Swiss Price Level -1% 0% 1% 2%
New Customer Segmentation 2.5% 2% 1.5% 1%
Grand Total 7.5% 6% 4% 3%
• For estimations – use simulations on price elasticity sensitivity to rate the
possible benefit in a range
• Extrapolate % figures on to the potential scope to a full project
List
Market
Net

Page 18
COPYRIGHT © SYNCRON INTERNATIONAL AB 2015
Central Processes
Distribution of Time
Spent
Process Enhancement
Process Improvement
Potential
Estimation on New Time
Requirement
New Item Pricing 25% Automation based on new pricing rules
-50% 12%
Price Revisions 15% Price simulations in analytics
-30% 10%
DiscountNegotiations
10% Guided negotiation support
-20% 8%
Reacting to Cost Changes
8% Automatic notifications with priority order
-50% 4%
Regional Processes
New Item Pricing 15% Central pricing guidance with markup factors
-100% 0%
DiscountNegotiations
60% Price corridors and approval workflow
-25% 45%
• For estimations – summarize current process efforts and process
enhancement possibilities, quantify by FTE gain or new process steps
Step 7 – Summarize a Business Case
Base on better prices

Page 19
COPYRIGHT © SYNCRON INTERNATIONAL AB 2015
Step 7 – Summarize a Business Case
Base on better customer satisfaction
Customer Complaints
Distribution of
Complaints
Resolutions Improvement Potential
Estimation on New Customer
Complaints
Similar Items Priced Differently
25% Value-based pricing methodology
-50% 15%
Item Priced Significantly over Market Level
15% Market-based pricing and competitor
feedback process
-25% 11%
Lack of Transparency in Net Price Setting
10% Logical and explainable discount setting, price
corridor negotiation support
-50% 5%
Price Differences in Local Markets
7% Central guidance, market price
comparisons, price corridors
-30% 5%
Grand Total 100% -30% 70%
• For estimations – summarize current most frequent customer complaints and
the resolutions to estimate reduction in complaints
Page 20
COPYRIGHT © SYNCRON INTERNATIONAL AB 2015
Summary
We have learned the key elements in establishing a ROI from a pricing
initiative trough a stepwise approach:
• Better pricing through price optimization methods
(3% to 7.5% revenue increase)
• Better pricing processes through efficient automation
(23% less time spent)
• Better customer satisfaction through logical and explainable
pricing methods
(30% less price complaints)
Page 21
COPYRIGHT © SYNCRON INTERNATIONAL AB 2015
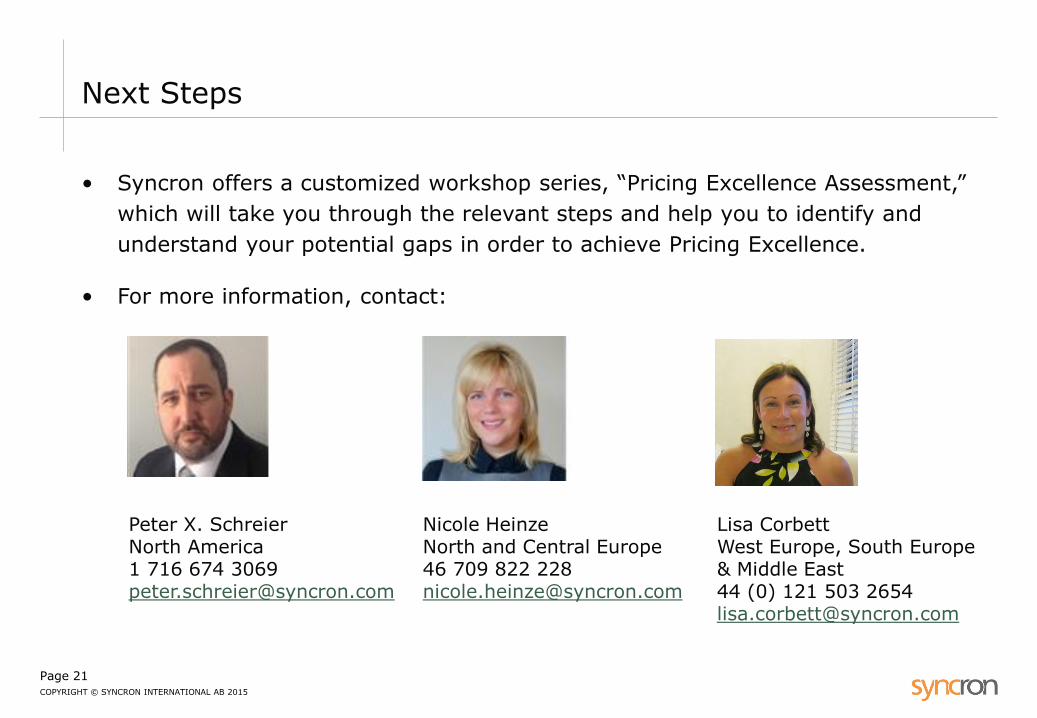
Next Steps
• Syncron offers a customized workshop series, “Pricing Excellence Assessment,”
which will take you through the relevant steps and help you to identify and
understand your potential gaps in order to achieve Pricing Excellence.
• For more information, contact:
Peter X. SchreierNorth America1 716 674 [email protected]
Nicole HeinzeNorth and Central Europe46 709 822 [email protected]
Lisa CorbettWest Europe, South Europe & Middle East44 (0) 121 503 [email protected]