investor presentation november 2016 · 2015 2005 (2) cagr% revenue (1) 311,589 78,932 15% ... a...
TRANSCRIPT

Investor Presentation – November 2016

2
Safe Harbor Statement
During this presentation management may discuss certain forward-looking statementsconcerning FEMSA’s future performance that should be considered as good faith estimates madeby the Company. These forward-looking statements reflect management expectations and arebased upon currently available data. Actual results are subject to future events anduncertainties, which could materially impact FEMSA’s actual performance.

3
Overview
Market leader and fastest growing retail
chain in Mexico
The world’s most international brewer
Ownership
Coca-Cola’s largest franchise bottler in
the world by volume
48%(1) 100% 20%
(1) Represents 63% of shares with voting rights.

FEMSA ComercioCoca-Cola
FEMSALogistics/
RefrigerationRetail
DivisionHealth
DivisionFuel
Division
Mexico
Brazil
Colombia
Argentina
Venezuela
Chile
Panama
Costa Rica
Philippines
Guatemala
Nicaragua
4
Leading Consumer Company in Latin America
Internal company data, YTD.

5
Creating Economic Value in the Last Decade
Source: Bloomberg, as of November 23, 2016.
FEMSA Market Cap Evolution (US$ MM)
CAGR 05 – Nov 16: 11%
1 Amounts expressed in millions of Mexican Pesos2 Figures for 2005 are the arithmetical sum of Coca Cola FEMSA and FEMSA Comercio, therefore figures exclude sold businesses.
• Consistently strengthening our competitive position.
• Ability to operate in a rapidly changing economicenvironment.
• Strong brand portfolio and exceptional operationalcapabilities.
Financial Highlights
2015 2005 (2) CAGR%
Revenue(1) 311,589 78,932 15%
EBIT(1) 33,735 9,942 13%
EBIT Margin 10.8% 12.6%
EBITDA(1) 46,626 13,073 14%
EBITDA Margin 15.0% 16.6%
CAPEX(1) 18,885 3,477 18%
8,643
28,081
2005 Nov-16

6
Increasing Cash to Shareholders Over Time…
660986
1,485 1,620 1,620
2,600
4,600
6,2006,684 6,684
7,350
8,355
2005 2006 2007 2008 2009 2010 2011 2012 2013 2014 2015 2016
Ordinary Dividend(Millions of Mexican Pesos)
Note: Dividend figures are in Mexican pesos. Payout ratio figures are the division of the dividend between previous year net majority income. 2010 net majority income does not include Heineken transaction effect. 2011 and thereafter figures are under International Financial Reporting Standards (“IFRS”).
…while retaining strategic and financial flexibility
2.0 xNet Debt /
EBITDA
11%PayoutRatio
18%22% 19% 24%
26%
34%
40%32% 42%
44%
47%
1.3 x 1.1 x 1.1 x 0.7 x -0.1 x 0.0 x 0.0 x 1.2 x 1.1 x 1.2 x
CAGR 26%

68%
32%
50% 50%
7
An Increasingly Balanced Core Portfolio
64%
36%
86%
14%
Revenue Contribution EBITDA Contribution
2005
2015
2005
2015
Coca-Cola FEMSA
FEMSA Comercio


9
FEMSA Comercio Overview
Includes drugstores and related operations
in Mexico and South America
Operates the OXXO GASchain of retail service
stations in Mexico
Retail Division
Health Division
Fuel Division
Operates OXXO, the
largest C-store chain in the Americas by units

10
• Third largest retailer in terms of
Revenues in Mexico.
• Benchmark for SSS and sales
density in Mexico.
• Best-in-class margins and returns.
• We open one new store every 8
hours on average.
• Every day, more than 10 million
people make a purchase at an
OXXO Store.
OXXO: A Format that Fits our Consumer’s Needs

11
4,1414,847
5,5636,374
7,3298,409
9,53810,567
11,68312,812
14,015
0.0%
0.2%
0.4%
0.6%
0.8%
1.0%
1.2%
1.4%
1.6%
2005 2006 2007 2008 2009 2010 2011 2012 2013 2014 2015
# OXXO stores in Mexico
% mom & pops in Mexico
(1)
OXXO Stores as a Percentage of Mom & Pops in Mexico
Largest Store Chain in the Americas by Units
14,416
3,332
1 2
Mexico The Americas
Note: For The Americas Section: Alimentation Couche-Tard includes US, Canada and Mexico operations as of July 2016 (includes transactions subject to regulatory approvals Source: Company Information. 7-Eleven: US, Canada and Mexico Operations as of Dec 2015. Source: Company Information. Rest of the companies: Source: CS News "Top 100 US Convenience Store Companies”, Published July 2016. Mom & pops: Company and INEGI information.
(1) OXXO stores as of December 31, 2015 in Mexico. (2) OXXO stores as of September 30, 2016 in Mexico. (3)Total OXXO stores, (includes Mexico, Colombia and Big John Chile) as of Sep 30, 2016.
Other C-Storesin Mexico
Others
Mexico
(2)
Number of Stores(3)
14,640

12
Horizontal Growth: Plenty of Runway Ahead
14,640 stores in Mexico and counting
OXXO Penetration Level by Population
17 Distribution Centers
Penetration Population / OXXO
Medium <10,000 per store
Moderate 10,000-30,000 per store
Low >30,000 per store
Nuevo Leon(1)
Population: 5.1 mmOXXO Stores: 1,2454,112 people/store
Note: INEGI 2015 Inter Population Consensus Survey . FEMSA information as of September 30, 2016.(1) OXXO stores as of September 30, 2016.
Valley of Mexico(1)
Population: 25.1 mmOXXO Stores: 2,144
11,710 people/store
FEMSA Comercio has developed proprietary models to assist in identifying optimal
store locations, store formats and product categories

13
THIRSTQuench your thirst immediately
TIME OPTIMIZATIONAcquire one-stop products and services in a simple and fast way
DAILYTake home your everyday grocery needs
BREAKFASTStart your day with a practical breakfast
REPLENISHMENTReplenish your depleted grocery and non-food products
LUNCHSatisfy your hunger with an on-the-go meal
CRAVINGSatisfy your sudden craving for a snack, a meal or drink
GATHERINGStop by for your party needs
Differentiated Approach to Fill Consumer Needs

14
Fine-tuning Strategies to Drive Same-Store Sales and Profitability
SegmentationCategory Development -Prepared Food
Category Development -Services
+1,000 services offered in the store

590
603
635
609
15
FEMSA Comercio – Health Division Mexico
• FEMSA Comercio now operates more than 1,000 drugstores in Mexico, or approximately 3% of industry units
• Current expected organic revenue growth of 15-20% in the Mexican operations
• Oxxo´s operational and logistics expertise will facilitate national expansion
• Standardizing business model across different regional brands
Aspiring to consolidate fragmented industry following OXXO game plan
2Q15 2Q16 3Q15 3Q16
Same Store Sales1
(Thousands of Mexican Pesos)
7.7% 1.1%SSS
Growth
1 Monthly average information per store, considering same stores with more than twelve months of operations in Mexico for FEMSA Comercio - Health Division.Note: Numbers as of September 30, 2016.

16
FEMSA Comercio – Health Division South America
• We operate approximately 680 drugstores and 160 beauty stores in Chile, as well as 180 pharmacies in Colombia
• Strong brand recognition and industryleadership in Chile
• Operational expertise will serve as a driver of profitability
Providing a solid platform for continued growth across the region
• Region presents opportunities for further international and cross-format growth
Note: Numbers as of September 30, 2016.

A Growing Footprint
17
FEMSA Comercio’s Health Division is gradually becoming a key drugstore operator inLatin America
1 1 1 13 13 2 3
Source: (1) 3Q16 Company Reports. FEMSA Comercio – Health Division includes drugstores and beauty stores.(2) Company own operations in Mexico and Chile as of 31 August 2016. (3) LatAm Retail Pharma Map, ILACAD World Retail, points of sale as of March, 2015.
LatAm Comparable Players by Number of Stores
HealthDivision

Footprint
FEMSA is participating in the rapid transformation of Mexico’s Fuel industry
18
Gas Stations (OXXO GAS)
• New changes to Mexican regulatory framework now allow FEMSA to participate directly in the Energy sector, particularly through petrol stations
• We concentrate mainly in the northern part of the country, but with a growing presence in 14 Mexican States
+
-
Note: Numbers as of September 30, 2016.
Number of Stations(End of Quarter)

19
• High-growth, low asset-intensity, high-return business
• As of September 30, 2016 there were 348 OXXO GAS stations, representing less than 3% of a highly-fragmented industry
Gas Stations (OXXO GAS)
1 Volume in million of liters considering same stations with more than twelve months of operations.2 1Q15 and 1Q16 comprise the one-month period of March 2015 and 2016 respectively.3 Average price per liter in Mexican Pesos.
138
425467
141
456501
1Q 2Q 3Q
Same Station Volume1,2
1Q152 1Q162
2.4%
2Q15 2Q16
7.1%
3Q15 3Q16
7.3%
2
Priceper
Liter3
Revenue(Billions of Mexican Pesos)

20
FEMSA Comercio is finding growth in adjacent formats
Note: Numbers as of September 30, 2016.
Contribution for the First 9 Months of 2016
Revenue EBITDA

$-
$2,000
$4,000
$6,000
$8,000
$10,000
$12,000
$14,000
$16,000
2005 2006 2007 2008 2009 2010 2011 2012 2013 2014 2015
21
FEMSA Comercio EBITDA ($Millions of Pesos) and Business Evolution
FEMSA Comercio Business Evolution
CAGR(1)
23%
CAGR(1)
16%(1): Total Annual EBITDA CAGR.
4,000 OXXO store
mark 5,000 OXXO store
mark
Surpass 1,000openings per
year
10,000 OXXO store
mark


Largest Coca-Cola Franchise Bottler in the World by Volume, Operating in Attractive Regions
23
47.9%(2) 28.1% 24.0%
Volume Mix
(1) KOF Figures reflect FY 2015. Philippines in a proforma basis.(2) Represents 63% of shares with voting rights.
Ownership:
Mexico
Guatemala
Colombia
Venezuela
BrazilNicaragua
Costa Rica
Panama
Argentina
Philippines
• 4 Billion Unit Cases (1)
• +US$ 10 Billion in Revenues (1)
• +358 Million consumers (1)
• Close to 2.8 Million points of sale (1)
• ~ 83,000 employees
• Strategic partner to the Coca-Cola system
representing about 13% of Global Volume

Creating Economic Value During the Last Decade
24
Source: Bloomberg, as of November 23, 2016.
KOF Market Cap Evolution (US$ MM)
• Consolidate as a Multi-category Leader.
• Reach Full Operating Potential.
• Growth Through Innovation.
• Growth Through Acquisitions.
• Proactive Environment Management.CAGR 05 – Nov 16: 9%
1 Amounts expressed in millions of Mexican Pesos
Financial Highlights
2015 2005 CAGR%
Revenue(1) 152,360 50,198 12%
EBIT(1) 22,645 8,683 10%
EBIT Margin 14.9% 17.3%
EBITDA(1) 31,233 11,210 11%
EBITDA Margin 20.5% 22.3%
CAPEX(1) 11,484 2,062 19%
5,066
13,264
2005 Nov-16

Strategic partner to the Coca-Cola System towards fulfilling its 2020 vision
25
1994Go Abroad
2003Triple the size
of the Company
2007Envision a 50-50 model
2010Go into
Dairy
2013Cross
the Pacific
20152010200520001995
30+ years as a Coke bottler through steady & bold investments
1993
4,049
246
16x
Consumers 40.1 181.4 200.7 357.6
Plants 14 30 31 63
Distribution Centers 68 228 204 327

26
KOF industry faces short term challenges that are being addressed
Accelerate performance with distinctive capabilities•Focus on Analytics and a streamlined RTM.•Compensate incidence increase throughpricing and CoE initiatives
Turnaround focus
•Improve POS execution and exploit Coolersas a driver for growth•Vonpar Integration & Leao Transformation
Create basis for sustainable andprofitable growth
•Adjust cost structure & recover margins
•Continue developing affordable CSD’s portfolio •Keep improving our RTM capabilities
Ensure operational stabilityto exploit market leadership
•Tackle current labor challenges•Sustain margins despite the economic environment
Capture transformationalopportunities•Turnaround in Panama•Structural changes in Guatemala•Costa Rica’s volume growth into profit growth•Improve capacity in Nicaragua to maintaingrowth
Ensure business continuity
•Rescale business to continue operating•Maintain labor stability
Accelerate turnaround
•Leverage volume growth to offset cost
Strategic Imperatives
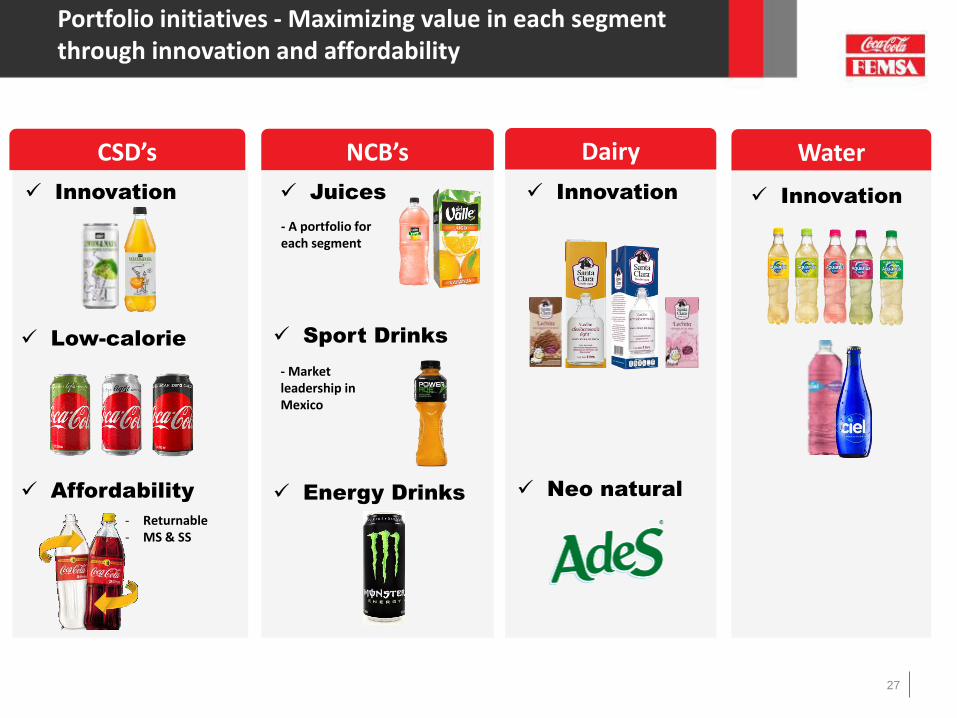
Portfolio initiatives - Maximizing value in each segment through innovation and affordability
27
CSD’s NCB’s Dairy Water
Innovation
Low-calorie
Affordability
Juices
Energy Drinks
Innovation
Sport Drinks
- A portfolio for each segment
- Market leadership in Mexico
Neo natural
Innovation
- Returnable- MS & SS

KOF consolidates its geographic footprint and evolves to meet its consumer’s ever-changing needs
Volume: 190 MM UC Sales: R$ 2,026 mEBITDA: R$335 m
Vonpar
KOF Brazil
Vonpar
KOF is evolving and preparing for the next wave of growth
• Through its Brazilian subsidiary, KOF reached an agreement to acquire Vonparfor an EV of R$3,578 million
Expanding its footprint in Brazil to serve 88 million
consumers and ~50% of the Coca-Cola system’s volume
• AdeS works as a platform to enter the Neo Natural Nutrition category
• Latam’s leading soy-based beverage
Diversifying its portfolio, providing its consumers with
a wider range of choices
• KOF and KO have reached an understanding to assess, on a preferred basis, the acquisition of specific territories in Latin America, the United States and other regions
Expanding its footprint, monitoring other
opportunities within TCCC System


Sustainability Strategy: Structure
30
We are committed to developing the capabilities needed to generate the economic, social, and environmental conditions required to operate today—and to grow in the future—in harmony with our environment. That is how we understand sustainability.
We contribute to create economic and social value through our Strategic Sustainability Framework:

Selected Sustainability Achievements 2015
31
We are aware of the fact that our communities face challenges that are increasingly more complex. Consequently, we know we need to evolve and strengthen our decision-making processes based on criteria that simultaneously creates economic and social value, as defined by our mission.
• Coca-Cola FEMSA has been for four consecutive years part of the Dow Jones Sustainability Index for Emerging Markets.
• FEMSA and Coca-Cola FEMSA have been part of the Mexican Stock Exchange Sustainability Index for five consecutive years.
• We participated in the Carbon Disclosure Project in the Climate Change and Water versions.

2010 2011 2012 2013 2014 2015
USD
Mill
ion
Total Spending on Sustainability (by Pillar)
Our People
Our Community
Our Planet
Our Investment in Sustainability
32
• At FEMSA we invest ~ 1% of our total consolidated revenue in sustainability every year.
Note: In MXN terms the investment made on Sustainability during 2015 grew compared to 2014 and during 2014 compared to 2013, but when translated to USD it decreases due to the depreciation of the MXN against the USD.

33
Going Forward
Sustained organic growth at OXXO in Mexico, with compelling growth in newcomplementary drugstore and fuel operations, as well as medium-term objectivesto test additional international markets.
Focus on disciplined capital deployment to take advantage of balance sheetflexibility, targeting assets consistent with our business platform and set ofcapabilities.
Continue to drive organic revenue growth across markets, working in tandem withThe Coca-Cola Company to enhance our portfolio by addressing evolving consumerpreferences, and continue to pursue incremental territories that are structurallywell suited to our skill set.

Financial Summary (Amounts in millions of Mexican Pesos)
34

35
Other Currencies
Euros
Mexican Pesos
Currency Average Rate
7.40%
Weighted Average
Rate
Variable Rate
FixedRate
Maturity2016 2017 2018 2019 2020 2021 +
US Dollars
As of September 30, 2016.
12.7%
1.8%
4.7%
6.1%
35.9%
18.2%
19.9%
26.0%
Debt Profile – September 30, 2016

Contact Information
[email protected]: (52) 818328-6167
Stock Information
Bolsa Mexicana de Valores (BMV): FEMSAUBDNew York Stock Exchange, Inc (NYSE): FMXADR 10:1