q4 fy18 investor update - lichousing.com update q4fy18.pdf · income (rs. cr) cagr 13% profit after...
TRANSCRIPT
Q4 FY18 Investor Update
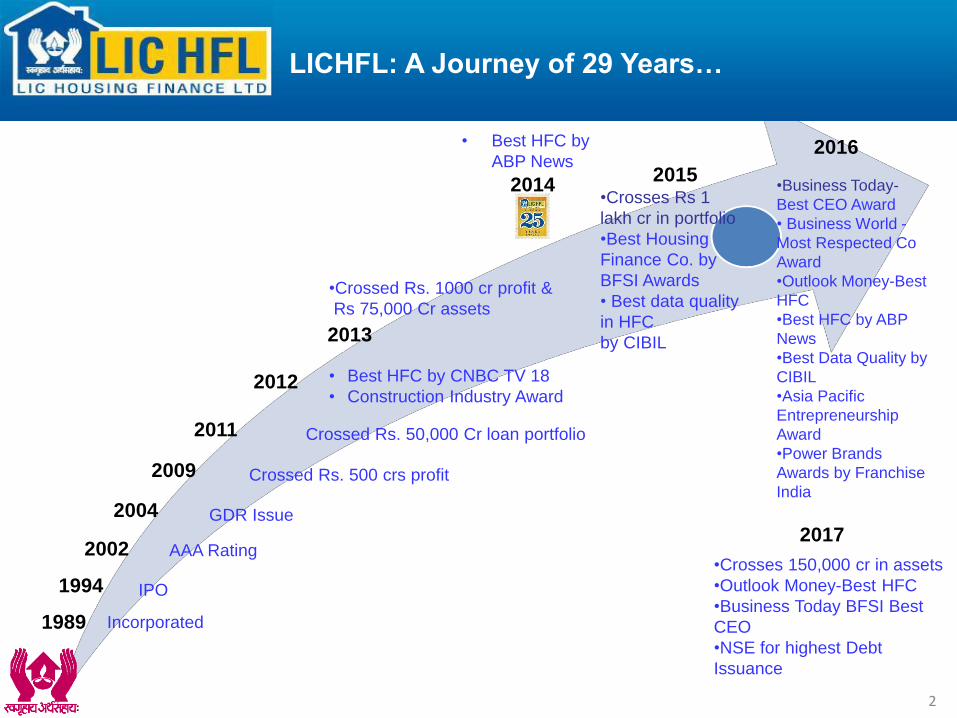
1989
1994
2002
2004
2009
2011
2012
2013
Incorporated
IPO
AAA Rating
GDR Issue
Crossed Rs. 500 crs profit
Crossed Rs. 50,000 Cr loan portfolio
• Best HFC by CNBC TV 18
• Construction Industry Award
•Crossed Rs. 1000 cr profit &
Rs 75,000 Cr assets
20152014
• Best HFC by
ABP News
•Crosses Rs 1
lakh cr in portfolio
•Best Housing
Finance Co. by
BFSI Awards
• Best data quality
in HFC
by CIBIL
LICHFL: A Journey of 29 Years…
•Business Today-
Best CEO Award
• Business World -
Most Respected Co
Award
•Outlook Money-Best
HFC
•Best HFC by ABP
News
•Best Data Quality by
CIBIL
•Asia Pacific
Entrepreneurship
Award
•Power Brands
Awards by Franchise
India
2016
2017
•Crosses 150,000 cr in assets
•Outlook Money-Best HFC
•Business Today BFSI Best
CEO
•NSE for highest Debt
Issuance
2
3
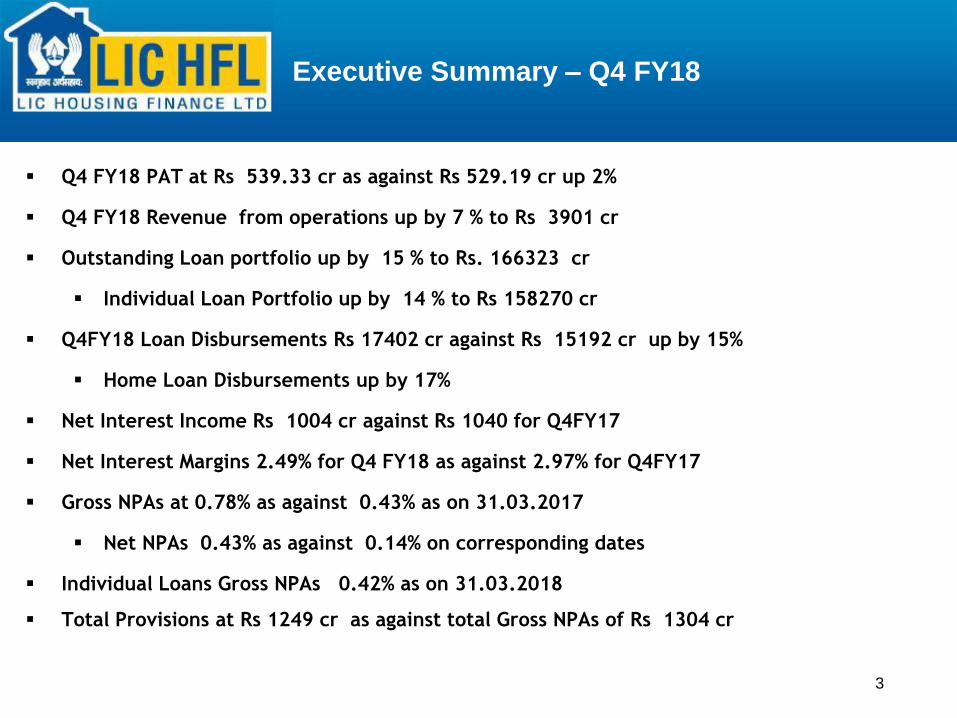
Q4 FY18 PAT at Rs 539.33 cr as against Rs 529.19 cr up 2%
Q4 FY18 Revenue from operations up by 7 % to Rs 3901 cr
Outstanding Loan portfolio up by 15 % to Rs. 166323 cr
Individual Loan Portfolio up by 14 % to Rs 158270 cr
Q4FY18 Loan Disbursements Rs 17402 cr against Rs 15192 cr up by 15%
Home Loan Disbursements up by 17%
Net Interest Income Rs 1004 cr against Rs 1040 for Q4FY17
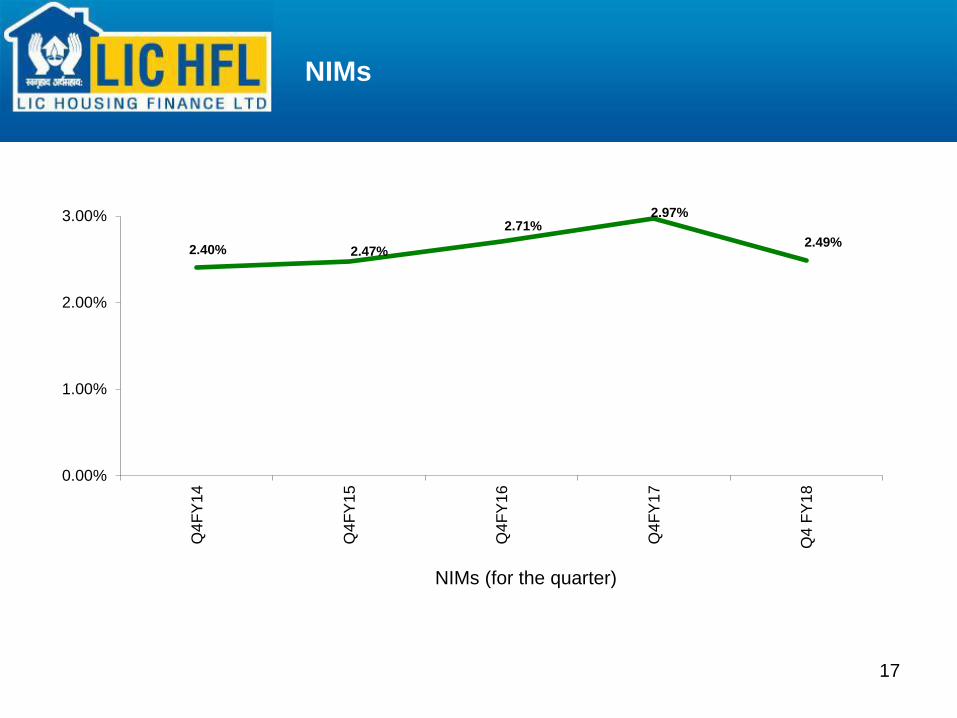
Net Interest Margins 2.49% for Q4 FY18 as against 2.97% for Q4FY17
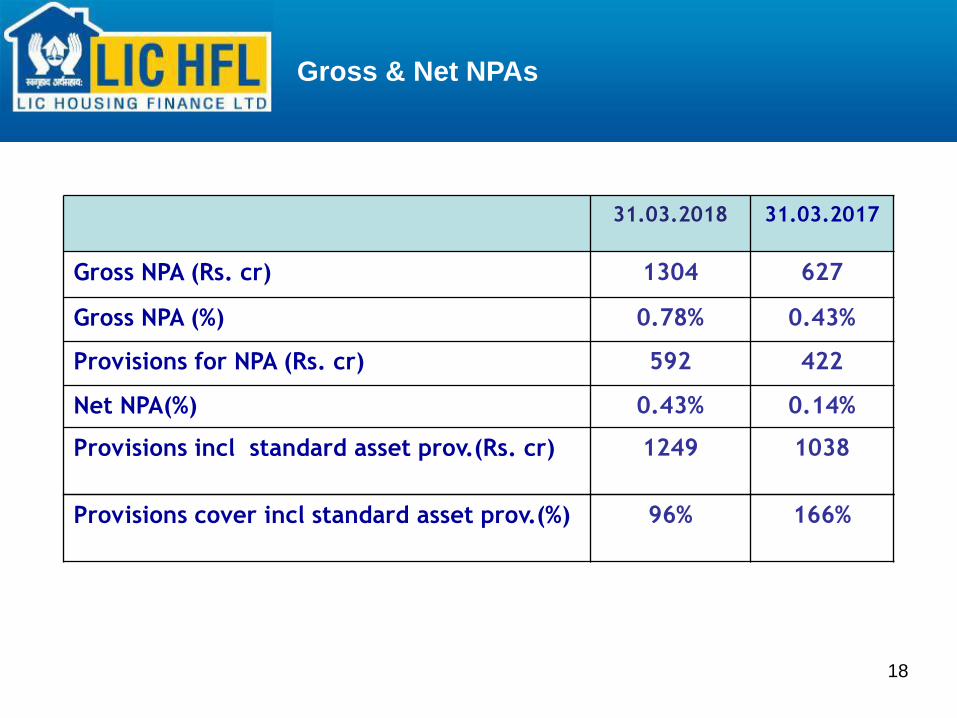
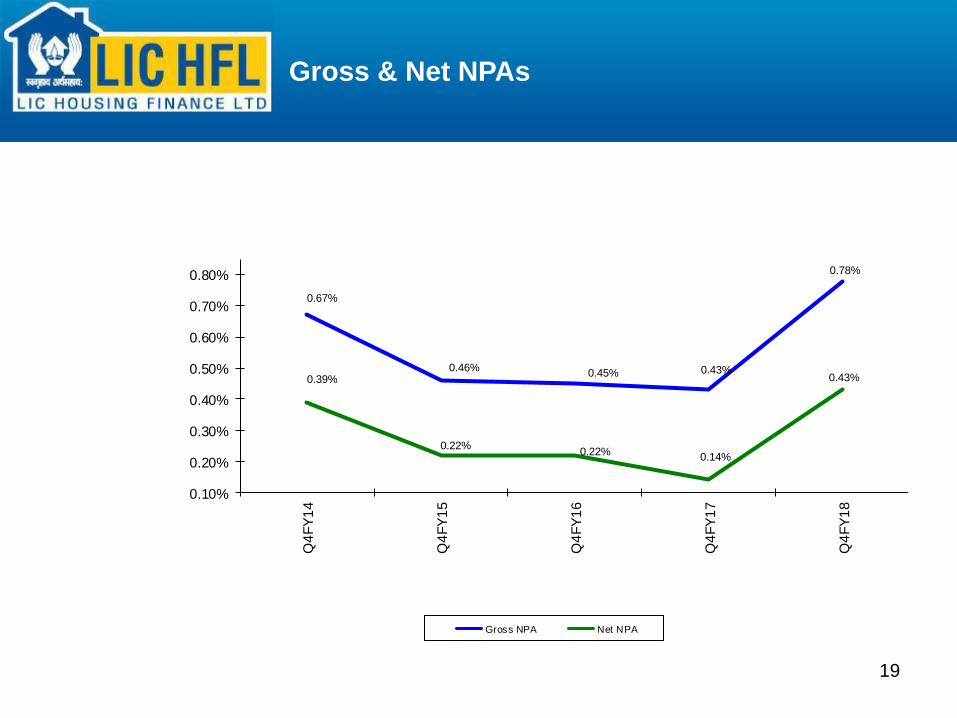
Gross NPAs at 0.78% as against 0.43% as on 31.03.2017
Net NPAs 0.43% as against 0.14% on corresponding dates
Individual Loans Gross NPAs 0.42% as on 31.03.2018
Total Provisions at Rs 1249 cr as against total Gross NPAs of Rs 1304 cr
Executive Summary – Q4 FY18
4
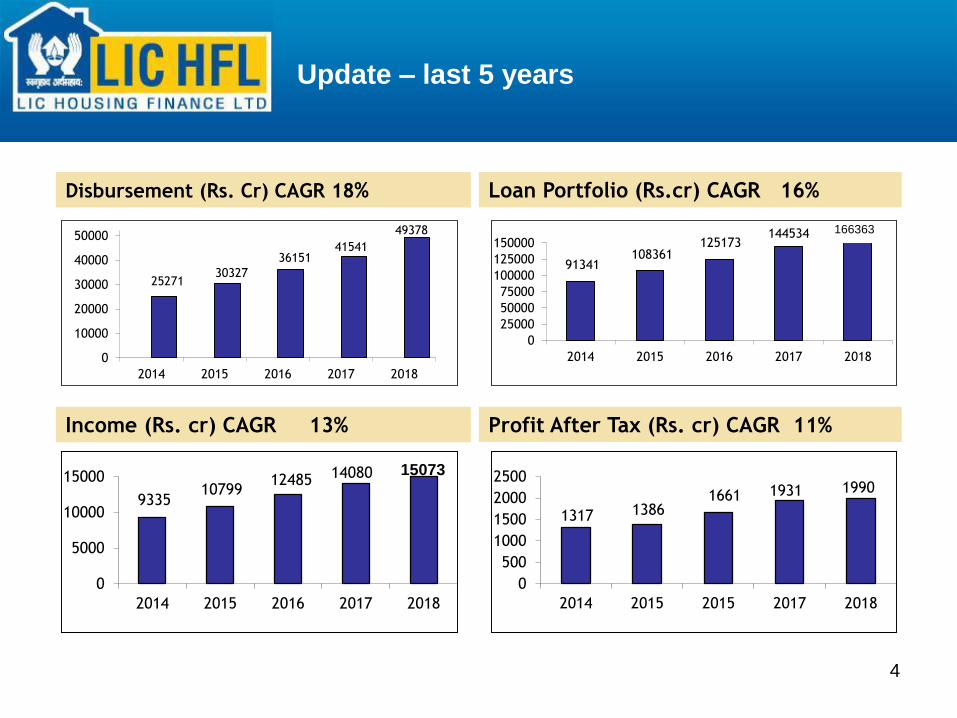
Disbursement (Rs. Cr) CAGR 18%
Profit After Tax (Rs. cr) CAGR 11%Income (Rs. cr) CAGR 13%
Loan Portfolio (Rs.cr) CAGR 16%
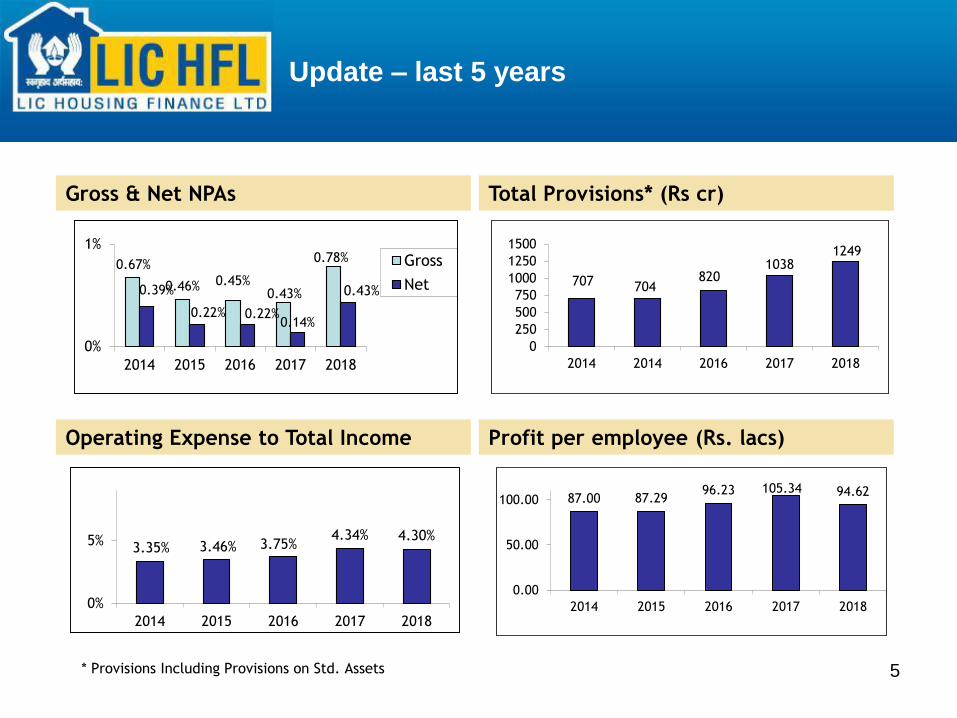
Update – last 5 years
2527130327
3615141541
49378
0
10000
20000
30000
40000
50000
2014 2015 2016 2017 2018
91341108361
125173144534
0
25000
50000
75000
100000
125000
150000
2014 2015 2016 2017 2018
933510799
12485 14080
0
5000
10000
15000
2014 2015 2016 2017 2018
1317 13861661 1931 1990
0
500
1000
1500
2000
2500
2014 2015 2015 2017 2018
166363
15073
5
Gross & Net NPAs
Operating Expense to Total Income
Total Provisions* (Rs cr)
Profit per employee (Rs. lacs)
* Provisions Including Provisions on Std. Assets
Update – last 5 years
0.67%
0.46% 0.45%0.43%
0.78%
0.39%
0.22% 0.22%0.14%
0.43%
0%
1%
2014 2015 2016 2017 2018
Gross
Net 707 704820
10381249
0
250
500
750
1000
1250
1500
2014 2014 2016 2017 2018
87.00 87.2996.23 105.34 94.62
0.00
50.00
100.00
2014 2015 2016 2017 2018
3.35% 3.46% 3.75%4.34% 4.30%
0%
5%
2014 2015 2016 2017 2018
6
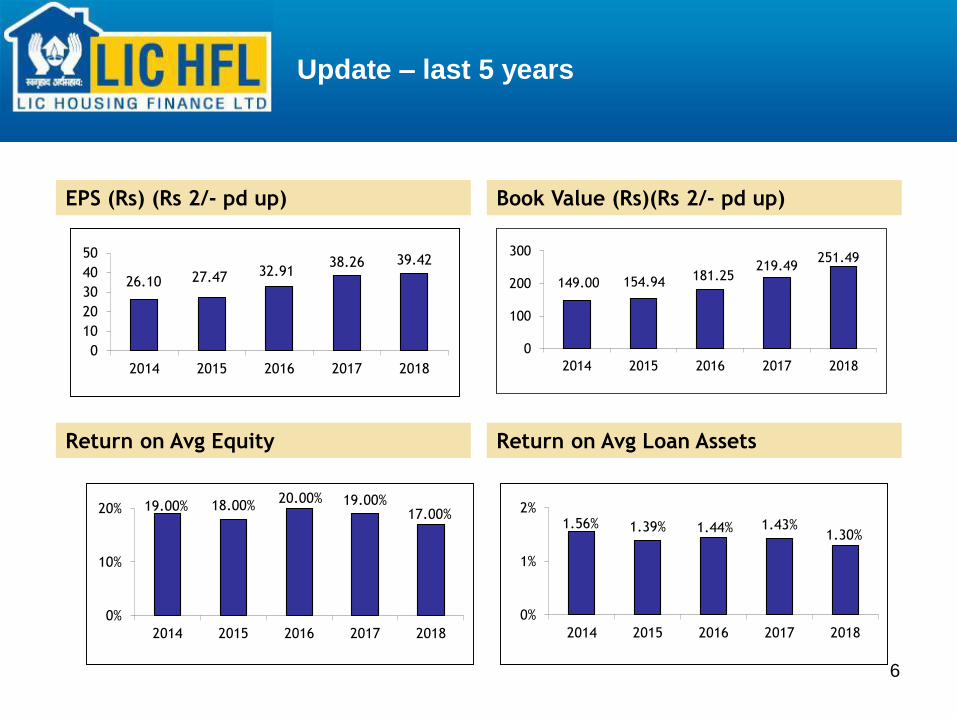
EPS (Rs) (Rs 2/- pd up)
Return on Avg Equity
Book Value (Rs)(Rs 2/- pd up)
Return on Avg Loan Assets
Update – last 5 years
26.10 27.47 32.9138.26 39.42
0
10
20
30
40
50
2014 2015 2016 2017 2018
149.00 154.94 181.25219.49
251.49
0
100
200
300
2014 2015 2016 2017 2018
1.56% 1.39% 1.44% 1.43%1.30%
0%
1%
2%
2014 2015 2016 2017 2018
19.00% 18.00%20.00% 19.00%
17.00%
0%
10%
20%
2014 2015 2016 2017 2018
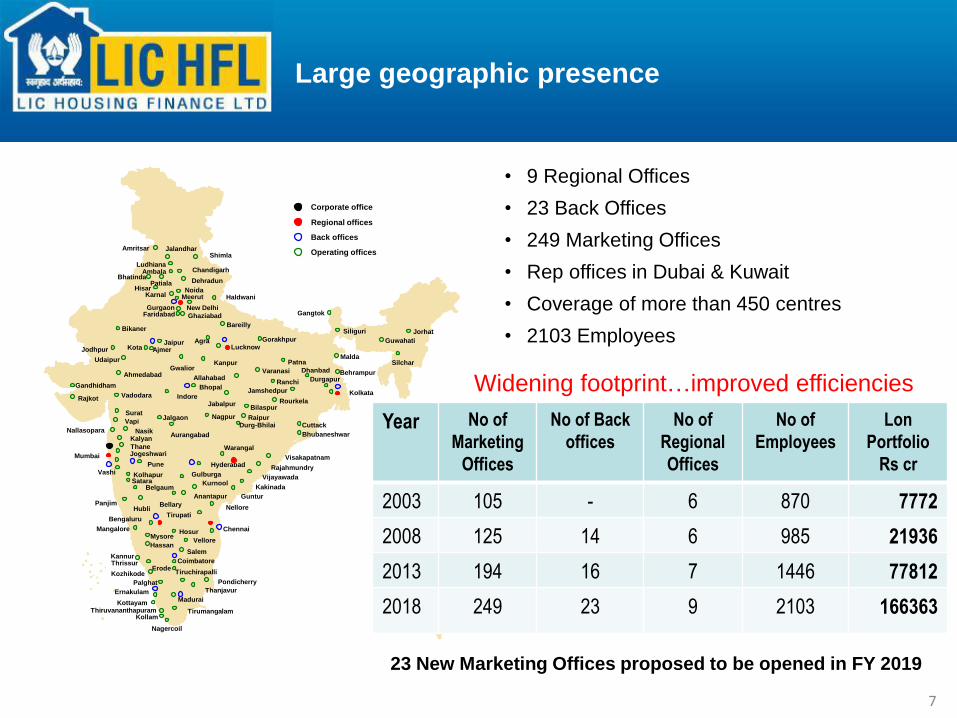
23 New Marketing Offices proposed to be opened in FY 2019
• 9 Regional Offices
• 23 Back Offices
• 249 Marketing Offices
• Rep offices in Dubai & Kuwait
• Coverage of more than 450 centres
• 2103 Employees
Back offices
Operating offices
Regional offices
Corporate office
Nagercoil
ThiruvananthapuramKottayam
Ernakulam
Kozhikode
Thrissur
Tirumangalam
Madurai
Thanjavur
Pondicherry
Tiruchirapalli
Coimbatore
Salem
Vellore
ChennaiHosurMysore
Mangalore
Bengaluru
Panjim
Vashi
Mumbai
NelloreHubliTirupati
Bellary
Anantapur
Kurnool
Guntur
Kakinada
Vijayawada
Hyderabad Rajahmundry
Visakapatnam
Warangal
Bhubaneshwar
Kolkata
Silchar
Guwahati
Siliguri
Gangtok
Patna
ShimlaJalandharAmritsar
LudhianaChandigarh
Dehradun
HaldwaniKarnal
Bareilly
Ghaziabad
New Delhi
AgraLucknow
Kanpur
JaipurAjmer
Gwalior
Bikaner
Jodhpur
Rajkot
Udaipur
Ahmedabad
Vadodara Indore
Bhopal
Allahabad
Jabalpur
Varanasi
Ranchi
Jamshedpur
RourkelaBilaspur
RaipurNagpurJalgaonSurat
Vapi
AurangabadNasik
Kalyan
ThaneJogeshwari
Pune
Kolhapur
Belgaum
Gulburga
Nallasopara
Kota
Hassan
Erode
Kannur
Kollam
Palghat
Gandhidham
Satara
Durg-Bhilai
Gorakhpur
Meerut
Behrampur
Cuttack
Dhanbad
Durgapur
Jorhat
Malda
GurgaonFaridabad
Noida
AmbalaBhatinda
HisarPatiala
Large geographic presence
Year No of
Marketing
Offices
No of Back
offices
No of
Regional
Offices
No of
Employees
Lon
Portfolio
Rs cr
2003 105 - 6 870 7772
2008 125 14 6 985 21936
2013 194 16 7 1446 77812
2018 249 23 9 2103 166363
Widening footprint…improved efficiencies
7
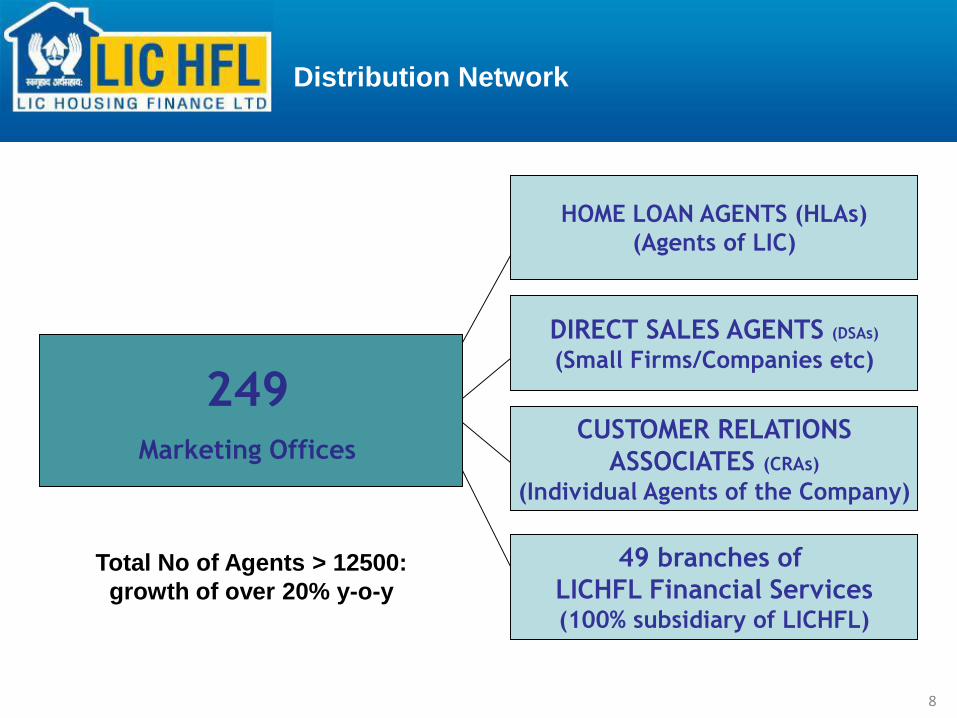
HOME LOAN AGENTS (HLAs)
(Agents of LIC)
DIRECT SALES AGENTS (DSAs)
(Small Firms/Companies etc)
CUSTOMER RELATIONS
ASSOCIATES (CRAs)
(Individual Agents of the Company)
249Marketing Offices
49 branches of
LICHFL Financial Services(100% subsidiary of LICHFL)
Distribution Network
Total No of Agents > 12500:
growth of over 20% y-o-y
8
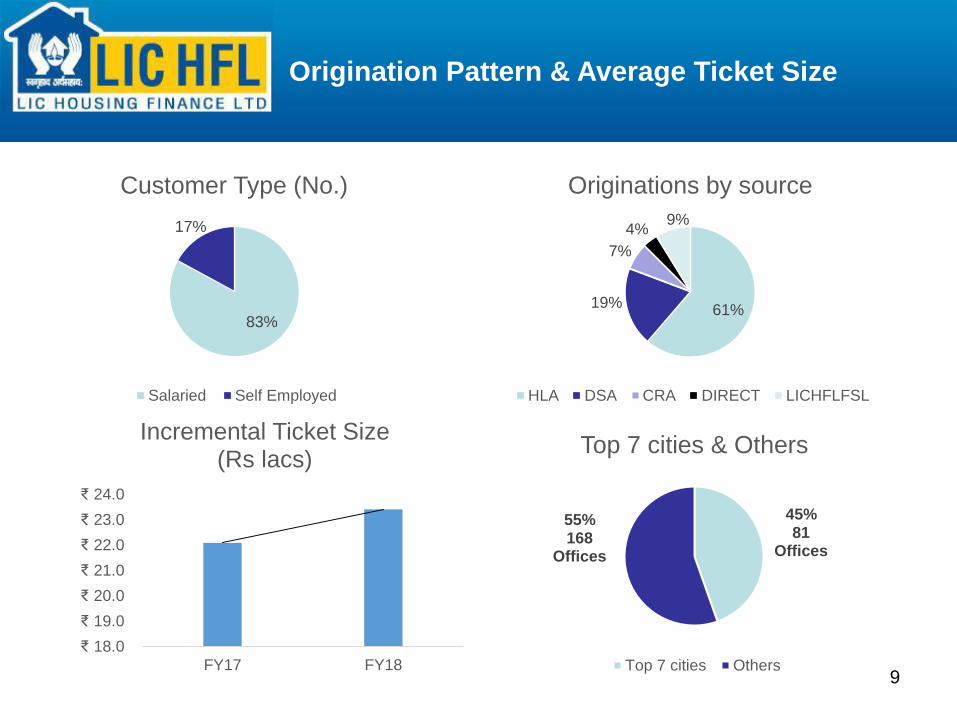
83%
17%
Customer Type (No.)
Salaried Self Employed
61%19%
7%
4%9%
Originations by source
HLA DSA CRA DIRECT LICHFLFSL
₹ 18.0
₹ 19.0
₹ 20.0
₹ 21.0
₹ 22.0
₹ 23.0
₹ 24.0
FY17 FY18
Incremental Ticket Size(Rs lacs)
45%81
Offices
55%168
Offices
Top 7 cities & Others
Top 7 cities Others9
Origination Pattern & Average Ticket Size
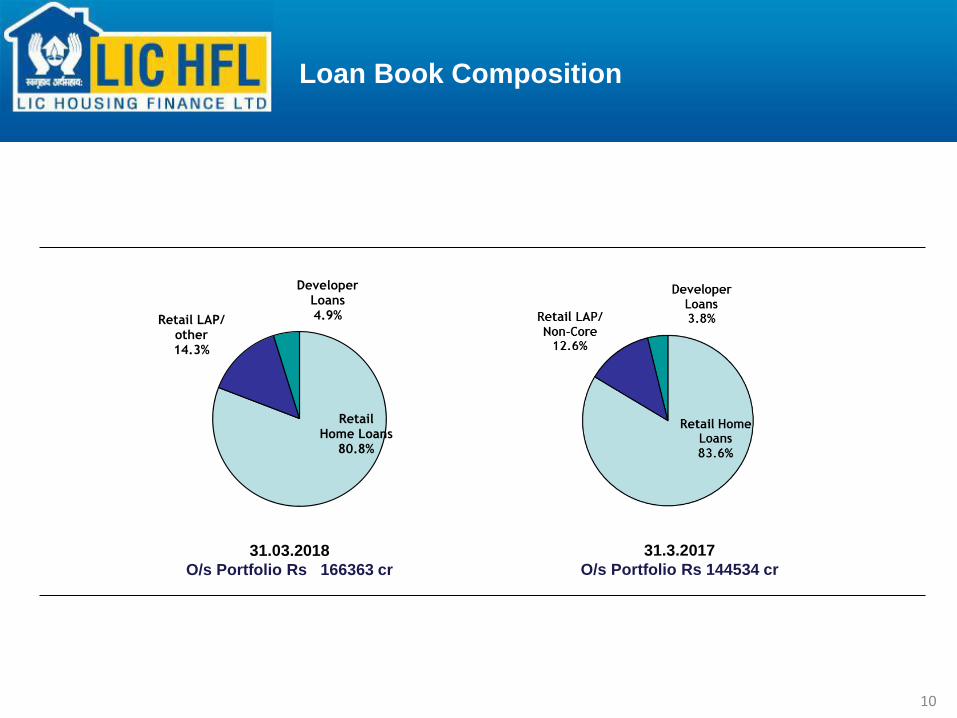
Loan Book Composition
31.03.2018
O/s Portfolio Rs 166363 cr
Retail Home Loans
80.8%
Retail LAP/ other14.3%
Developer Loans4.9%
31.3.2017
O/s Portfolio Rs 144534 cr
10
11
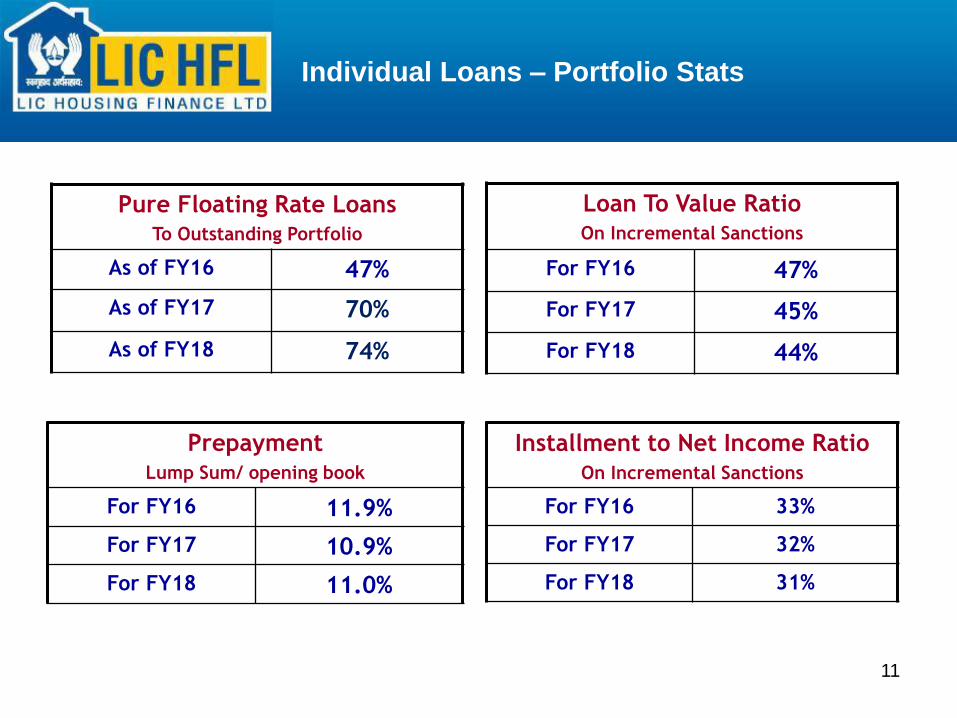
Installment to Net Income RatioOn Incremental Sanctions
For FY16 33%
For FY17 32%
For FY18 31%
Loan To Value RatioOn Incremental Sanctions
For FY16 47%
For FY17 45%
For FY18 44%
Pure Floating Rate LoansTo Outstanding Portfolio
As of FY16 47%
As of FY17 70%
As of FY18 74%
PrepaymentLump Sum/ opening book
For FY16 11.9%
For FY17 10.9%
For FY18 11.0%
Individual Loans – Portfolio Stats
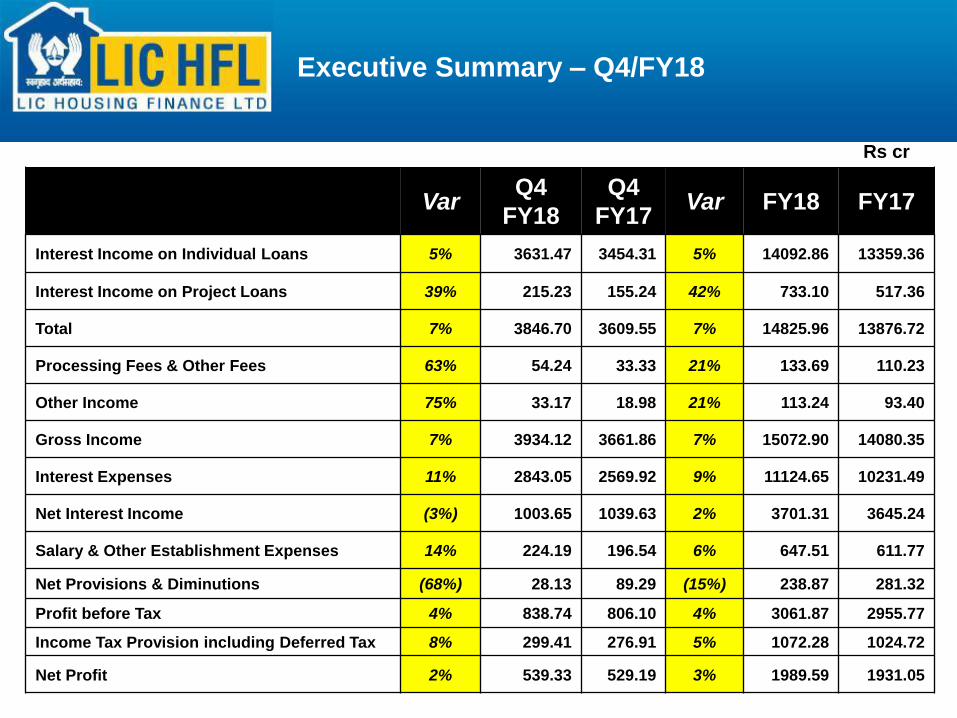
Executive Summary – Q4/FY18
VarQ4
FY18
Q4
FY17Var FY18 FY17
Interest Income on Individual Loans 5% 3631.47 3454.31 5% 14092.86 13359.36
Interest Income on Project Loans 39% 215.23 155.24 42% 733.10 517.36
Total 7% 3846.70 3609.55 7% 14825.96 13876.72
Processing Fees & Other Fees 63% 54.24 33.33 21% 133.69 110.23
Other Income 75% 33.17 18.98 21% 113.24 93.40
Gross Income 7% 3934.12 3661.86 7% 15072.90 14080.35
Interest Expenses 11% 2843.05 2569.92 9% 11124.65 10231.49
Net Interest Income (3%) 1003.65 1039.63 2% 3701.31 3645.24
Salary & Other Establishment Expenses 14% 224.19 196.54 6% 647.51 611.77
Net Provisions & Diminutions (68%) 28.13 89.29 (15%) 238.87 281.32
Profit before Tax 4% 838.74 806.10 4% 3061.87 2955.77
Income Tax Provision including Deferred Tax 8% 299.41 276.91 5% 1072.28 1024.72
Net Profit 2% 539.33 529.19 3% 1989.59 1931.05
Rs cr
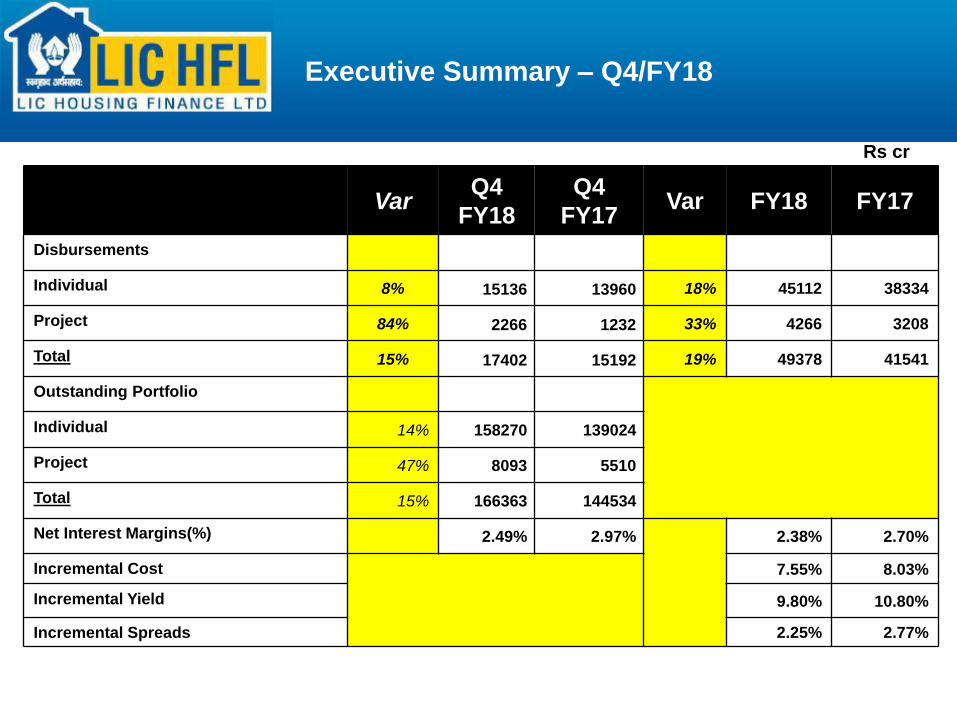
Executive Summary – Q4/FY18
VarQ4
FY18
Q4
FY17Var FY18 FY17
Disbursements
Individual 8% 15136 13960 18% 45112 38334
Project 84% 2266 1232 33% 4266 3208
Total 15% 17402 15192 19% 49378 41541
Outstanding Portfolio
Individual 14% 158270 139024
Project 47% 8093 5510
Total 15% 166363 144534
Net Interest Margins(%) 2.49% 2.97% 2.38% 2.70%
Incremental Cost 7.55% 8.03%
Incremental Yield 9.80% 10.80%
Incremental Spreads 2.25% 2.77%
Rs cr
14
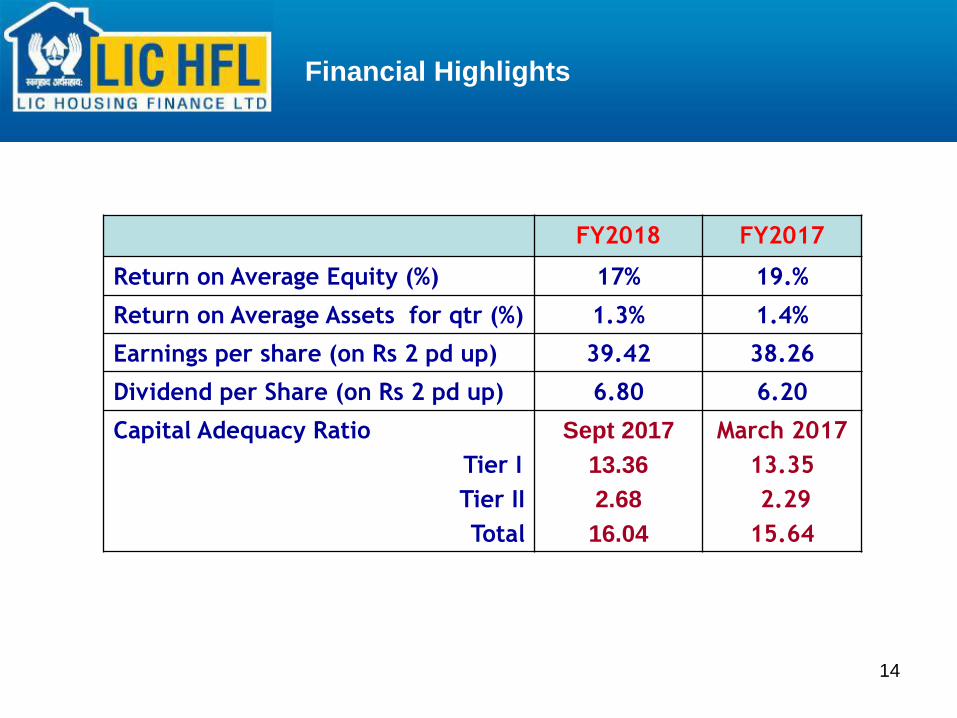
Financial Highlights
FY2018 FY2017
Return on Average Equity (%) 17% 19.%
Return on Average Assets for qtr (%) 1.3% 1.4%
Earnings per share (on Rs 2 pd up) 39.42 38.26
Dividend per Share (on Rs 2 pd up) 6.80 6.20
Capital Adequacy Ratio
Tier I
Tier II
Total
Sept 2017
13.36
2.68
16.04
March 2017
13.35
2.29
15.64
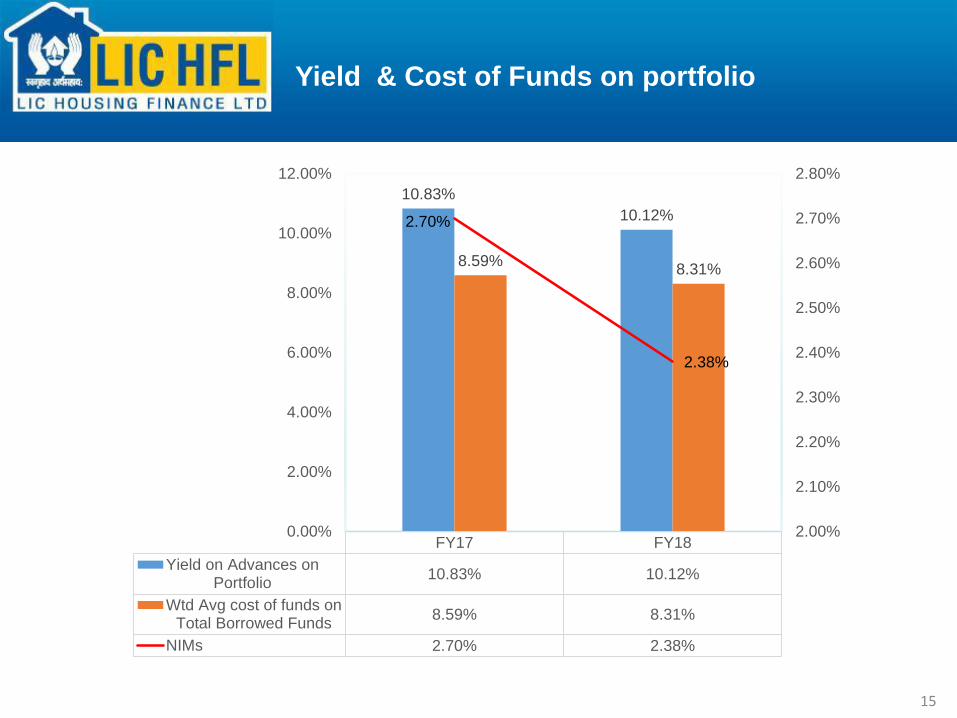
Yield & Cost of Funds on portfolio
FY17 FY18
Yield on Advances onPortfolio
10.83% 10.12%
Wtd Avg cost of funds onTotal Borrowed Funds
8.59% 8.31%
NIMs 2.70% 2.38%
10.83%
10.12%
8.59%8.31%
2.70%
2.38%
2.00%
2.10%
2.20%
2.30%
2.40%
2.50%
2.60%
2.70%
2.80%
0.00%
2.00%
4.00%
6.00%
8.00%
10.00%
12.00%
15
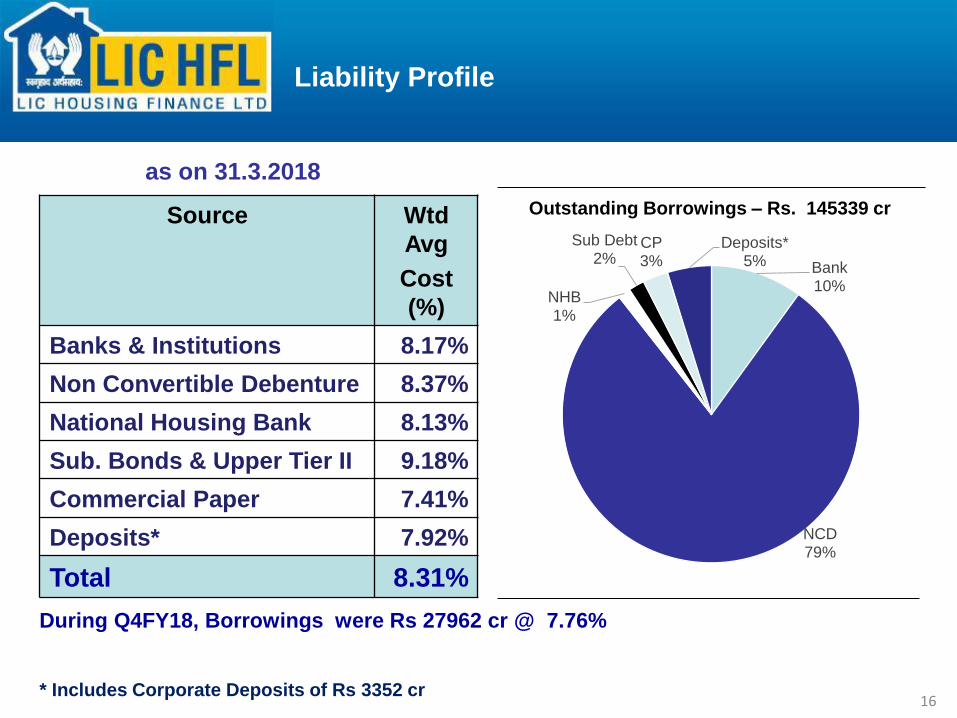
Outstanding Borrowings – Rs. 145339 crSource Wtd
Avg
Cost
(%)
Banks & Institutions 8.17%
Non Convertible Debenture 8.37%
National Housing Bank 8.13%
Sub. Bonds & Upper Tier II 9.18%
Commercial Paper 7.41%
Deposits* 7.92%
Total 8.31%
as on 31.3.2018
Liability Profile
During Q4FY18, Borrowings were Rs 27962 cr @ 7.76%
Bank10%
NCD79%
NHB1%
Sub Debt2%
CP3%
Deposits*5%
* Includes Corporate Deposits of Rs 3352 cr16
17
NIMs
2.40% 2.47%
2.71%2.97%
2.49%
0.00%
1.00%
2.00%
3.00%
Q4
FY
14
Q4
FY
15
Q4
FY
16
Q4
FY
17
Q4
FY
18
NIMs (for the quarter)
18
31.03.2018 31.03.2017
Gross NPA (Rs. cr) 1304 627
Gross NPA (%) 0.78% 0.43%
Provisions for NPA (Rs. cr) 592 422
Net NPA(%) 0.43% 0.14%
Provisions incl standard asset prov.(Rs. cr) 1249 1038
Gross & Net NPAs
Provisions cover incl standard asset prov.(%) 96% 166%
19
Gross & Net NPAs
0.67%
0.46%0.45% 0.43%
0.78%
0.39%
0.22%0.22%
0.14%
0.43%
0.10%
0.20%
0.30%
0.40%
0.50%
0.60%
0.70%
0.80%
Q4
FY
14
Q4
FY
15
Q4
FY
16
Q4
FY
17
Q4
FY
18
Gross NPA Net NPA
20
DISCLAIMER
This presentation is made purely for information. We have attempted to provide relevantinformation which we believe will help in knowing the Company. The users may use their ownjudgment and are advised to make their own calculations before deciding on any matter basedon the information given herein.
While every care is taken to verify the accuracy of the information given in this presentation,neither the Company nor its officials would in any way be liable for any action taken or nottaken by the viewers or the users of this presentation or for any claims, losses etc.
Thank you