berlin, 18 june 2015 - shw automotive · 1.9%% 5.0 4.2 2014 2017 5.2 3.8 2016 2018 cagr cagr cagr...
TRANSCRIPT
dbAccess German, Swiss & Austrian Conference
Berlin, 18 June 2015
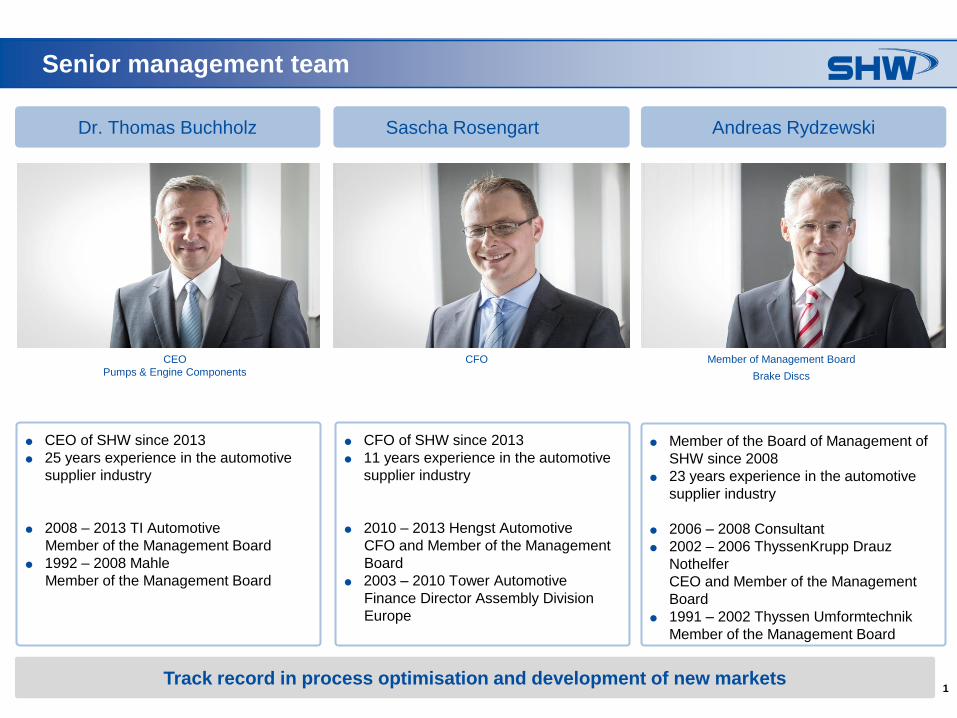
1Track record in process optimisation and development of new markets
Senior management team
Andreas Rydzewski
Member of the Board of Management of
SHW since 2008
23 years experience in the automotive
supplier industry
2006 – 2008 Consultant
2002 – 2006 ThyssenKrupp Drauz
Nothelfer
CEO and Member of the Management
Board
1991 – 2002 Thyssen Umformtechnik
Member of the Management Board
Member of Management Board
Brake Discs
Sascha Rosengart
CFO
Dr. Thomas Buchholz
CEO of SHW since 2013
25 years experience in the automotive
supplier industry
2008 – 2013 TI Automotive
Member of the Management Board
1992 – 2008 Mahle
Member of the Management Board
CEO
Pumps & Engine Components
CFO of SHW since 2013
11 years experience in the automotive
supplier industry
2010 – 2013 Hengst Automotive
CFO and Member of the Management
Board
2003 – 2010 Tower Automotive
Finance Director Assembly Division
Europe
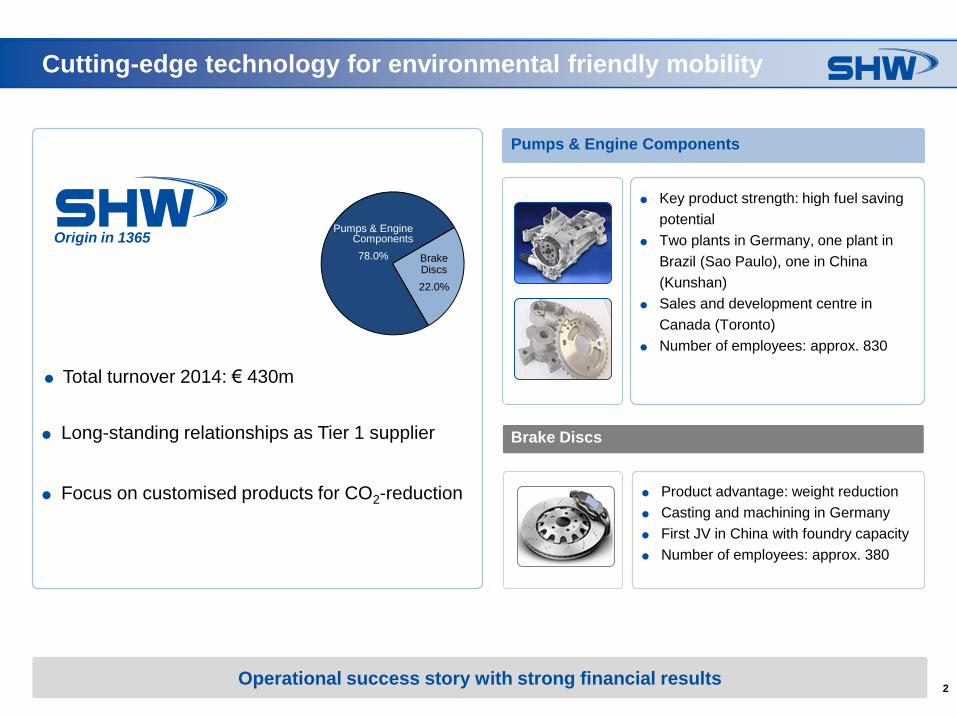
2Operational success story with strong financial results
Pumps & Engine Components
Brake Discs
Key product strength: high fuel saving
potential
Two plants in Germany, one plant in
Brazil (Sao Paulo), one in China
(Kunshan)
Sales and development centre in
Canada (Toronto)
Number of employees: approx. 830
Product advantage: weight reduction
Casting and machining in Germany
First JV in China with foundry capacity
Number of employees: approx. 380
Long-standing relationships as Tier 1 supplier
Focus on customised products for CO2-reduction
Origin in 1365
Cutting-edge technology for environmental friendly mobility
Total turnover 2014: € 430m
Pumps & Engine Components
78.0% Brake Discs
22.0%
3
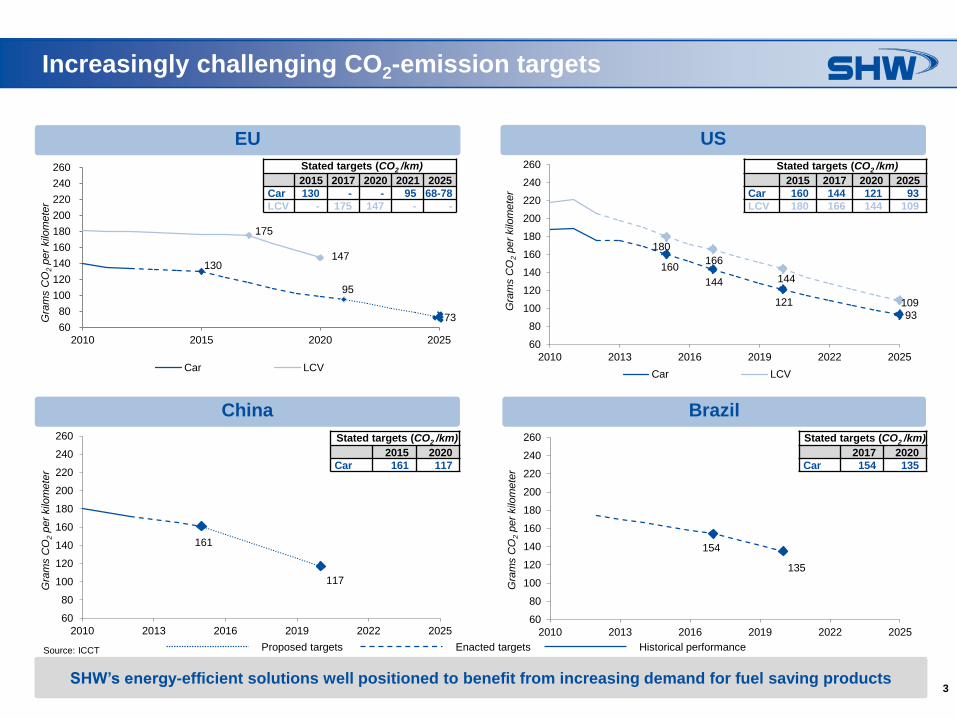
Increasingly challenging CO2-emission targets
USEU
China Brazil
SHW’s energy-efficient solutions well positioned to benefit from increasing demand for fuel saving products
Proposed targets Historical performanceEnacted targets
154
135
60
80
100
120
140
160
180
200
220
240
260
2010 2013 2016 2019 2022 2025
Gra
ms C
O2
per
kilo
mete
r
161
117
60
80
100
120
140
160
180
200
220
240
260
2010 2013 2016 2019 2022 2025
Gra
ms C
O2
per
kilo
mete
r
Stated targets (CO2 /km)
2015 2020
Car 161 117
Stated targets (CO2 /km)
2017 2020
Car 154 135
Source: ICCT
160
144
121
93
180
166
144
109
60
80
100
120
140
160
180
200
220
240
260
2010 2013 2016 2019 2022 2025
Gra
ms C
O2
per
kilo
mete
r
Car LCV
Stated targets (CO2 /km)
2015 2017 2020 2021 2025
Car 130 - - 95 68-78
LCV - 175 147 - -
Stated targets (CO2 /km)
2015 2017 2020 2025
Car 160 144 121 93
LCV 180 166 144 109
130
95
73
175
147
60
80
100
120
140
160
180
200
220
240
260
2010 2015 2020 2025
Gra
ms C
O2
per
kilo
mete
r
Car LCV
4
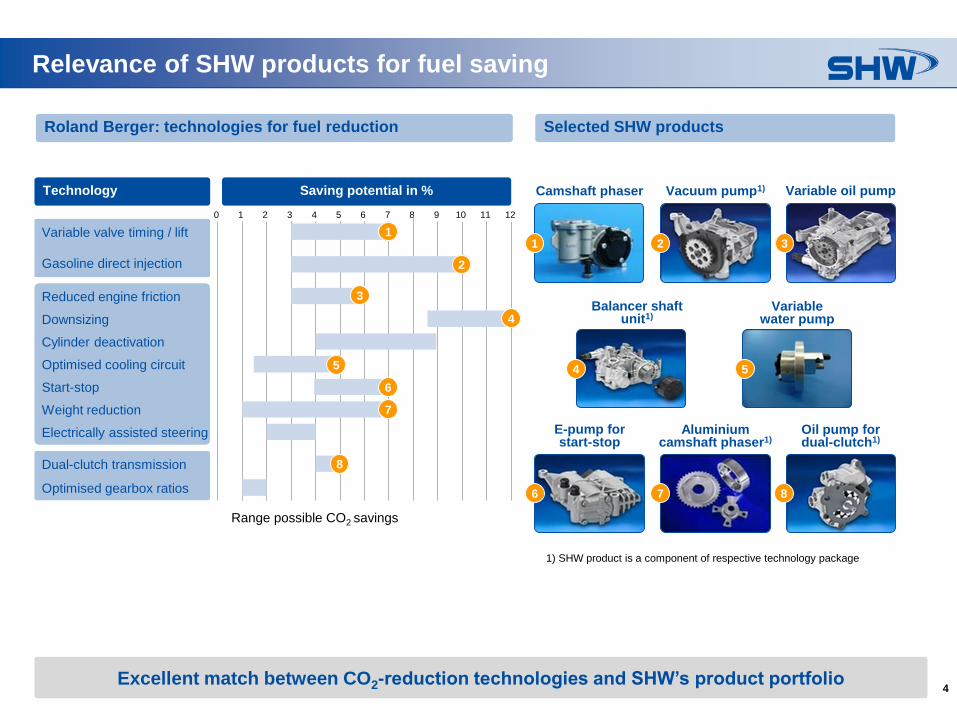
Relevance of SHW products for fuel saving
Excellent match between CO2-reduction technologies and SHW’s product portfolio
1) SHW product is a component of respective technology package
Roland Berger: technologies for fuel reduction
Range possible CO2 savings
Technology
12
Saving potential in %
0 6 7 8 94 51 2 3 10 11
Camshaft phaser
1
Vacuum pump1)
2
Variable oil pump
Balancer shaftunit1)
3
4
Variablewater pump
E-pump forstart-stop
5
6
Aluminiumcamshaft phaser1)
Oil pump fordual-clutch1)
7 8
Variable valve timing / lift
Gasoline direct injection
1
2
Reduced engine friction
Downsizing
Cylinder deactivation
Start-stop
Optimised cooling circuit
Weight reduction
Electrically assisted steering
3
4
5
6
7
Dual-clutch transmission
Optimised gearbox ratios
8
Selected SHW products
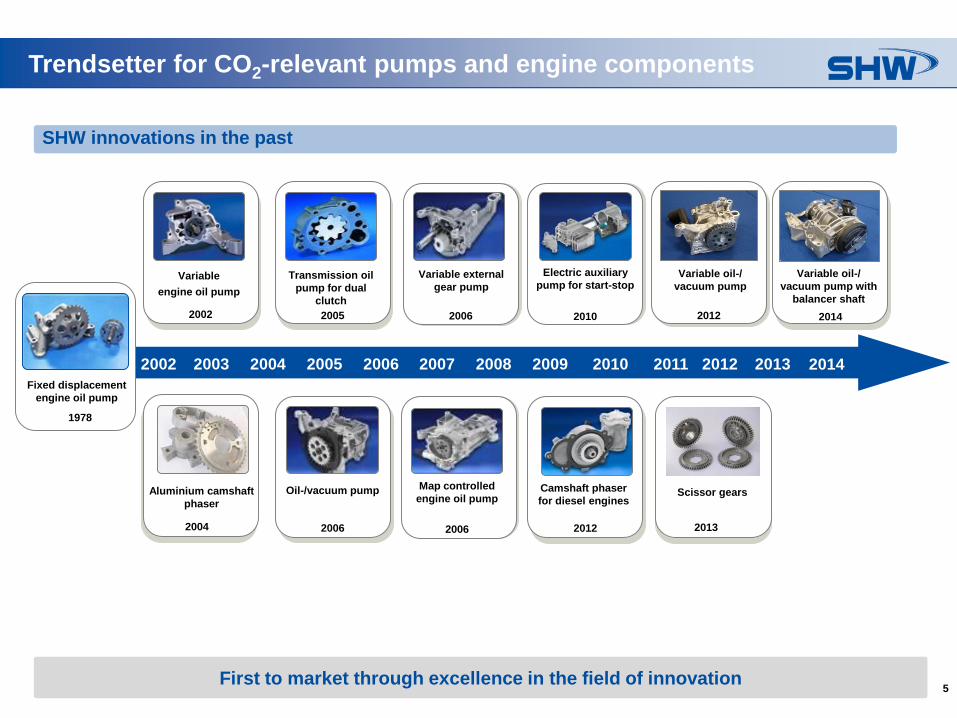
5
Trendsetter for CO2-relevant pumps and engine components
SHW innovations in the past
2010
Electric auxiliary
pump for start-stop
2006
Oil-/vacuum pump
2006
Map controlled
engine oil pump
2006
Variable external
gear pump
2002
Variable
engine oil pump
2002 2003 2004 2005 2006 2007 2008 2009 2010 2011 2012 2013
Fixed displacement
engine oil pump
First to market through excellence in the field of innovation
2004
Aluminium camshaft
phaser
2005
Transmission oil
pump for dual
clutch
2012
Camshaft phaser
for diesel engines
2012
Variable oil-/
vacuum pump
2013
Scissor gears
2014
Variable oil-/
vacuum pump with
balancer shaft
1978
2014
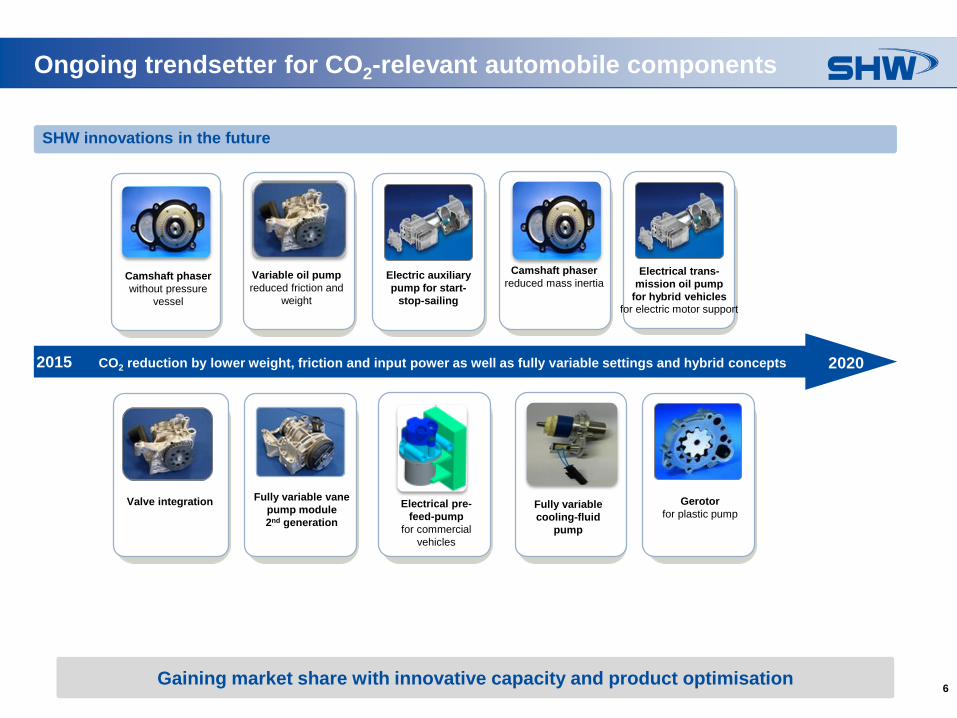
6Gaining market share with innovative capacity and product optimisation
Ongoing trendsetter for CO2-relevant automobile components
SHW innovations in the future
2015 CO2 reduction by lower weight, friction and input power as well as fully variable settings and hybrid concepts 2020
Gerotor
for plastic pump
2014
Fully variable vane
pump module
2nd generation
Valve integration Fully variable
cooling-fluid
pump
2014
Electrical pre-
feed-pump
for commercial
vehicles
Camshaft phaser
without pressure
vessel
2014
Variable oil pump
reduced friction and
weight
2014
Camshaft phaser
reduced mass inertiaElectrical trans-
mission oil pump
for hybrid vehicles for electric motor support
Electric auxiliary
pump for start-
stop-sailing
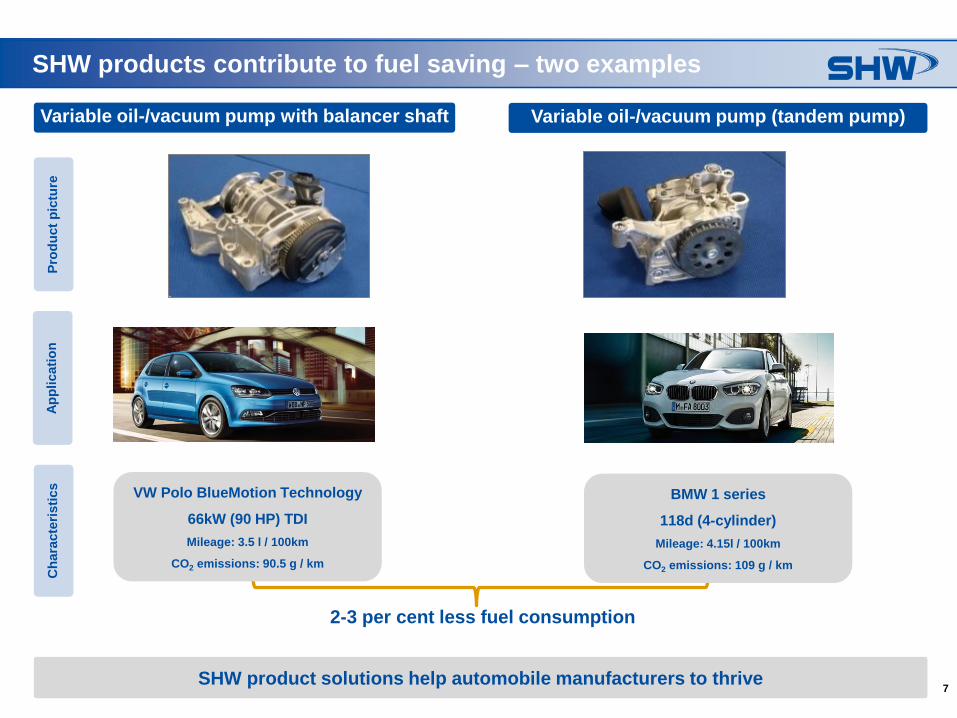
7SHW product solutions help automobile manufacturers to thrive
SHW products contribute to fuel saving – two examplesP
rod
uct
pic
ture
Variable oil-/vacuum pump (tandem pump)Variable oil-/vacuum pump with balancer shaft
Ap
plicati
on
Ch
ara
cte
risti
cs
2-3 per cent less fuel consumption
VW Polo BlueMotion Technology
66kW (90 HP) TDI
Mileage: 3.5 l / 100km
CO2 emissions: 90.5 g / km
BMW 1 series
118d (4-cylinder)
Mileage: 4.15l / 100km
CO2 emissions: 109 g / km
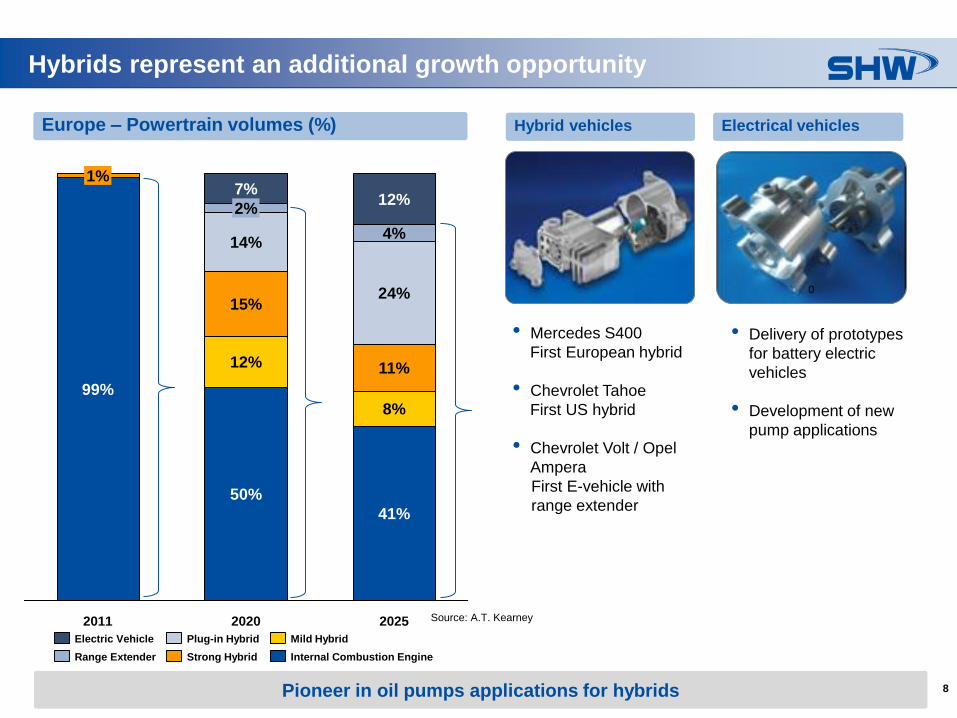
8Pioneer in oil pumps applications for hybrids
Hybrids represent an additional growth opportunity
Europe – Powertrain volumes (%)
2025
41%
8%
11%
24%
4%
12%
2020
50%
12%
15%
14%
2%
7%
2011
99%
1%
Internal Combustion Engine
Mild Hybrid
Strong Hybrid
Plug-in Hybrid
Range Extender
Electric Vehicle
Source: A.T. Kearney
Hybrid vehicles Electrical vehicles
0
• Mercedes S400
First European hybrid
• Chevrolet Tahoe
First US hybrid
• Chevrolet Volt / Opel
Ampera
First E-vehicle with
range extender
• Delivery of prototypes
for battery electric
vehicles
• Development of new
pump applications
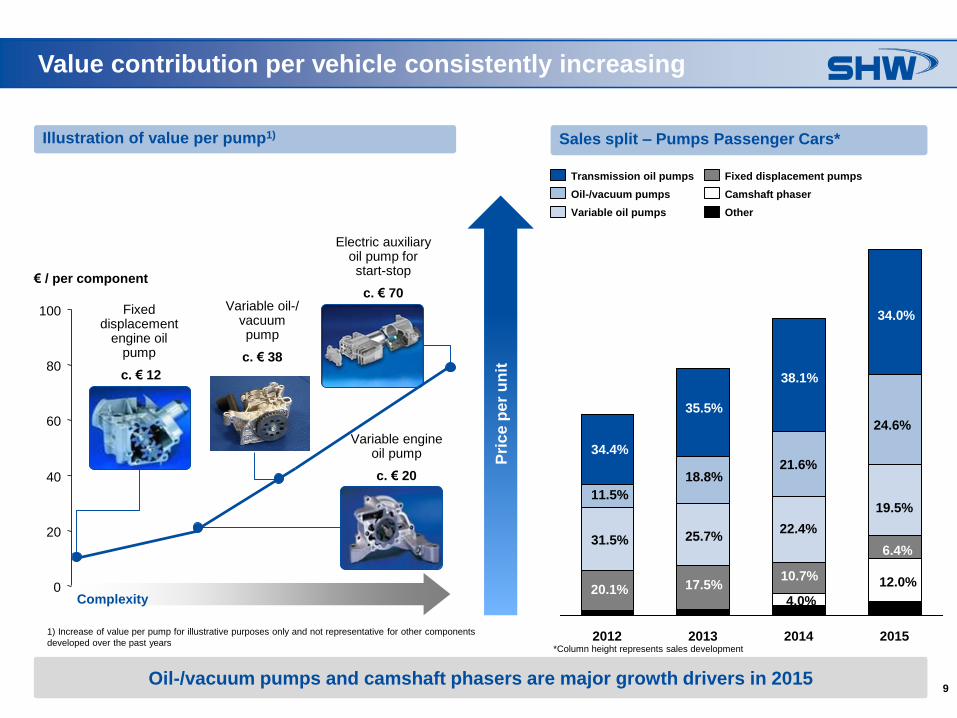
9Oil-/vacuum pumps and camshaft phasers are major growth drivers in 2015
Value contribution per vehicle consistently increasing
1) Increase of value per pump for illustrative purposes only and not representative for other components
developed over the past years
Illustration of value per pump1)
0
20
40
60
80
100
Complexity
€ / per component
Fixed displacement
engine oil pump
c. € 12
Variable engine oil pump
c. € 20
Electric auxiliary oil pump for start-stop
c. € 70Variable oil-/
vacuum pump
c. € 38
Sales split – Pumps Passenger Cars*
Pri
ce
pe
r u
nit
2015201420132012
Camshaft phaser
Variable oil pumps
Fixed displacement pumps
Oil-/vacuum pumps
Transmission oil pumps
Other
34.0%
38.1%
13.9%
12.6%
24.6%
21.6%
35.5%
34.4%
19.5%
22.4%
18.8%
11.5%
11.8%10.7%
17.5%20.1%
31.5% 25.7%
12.0%
*Column height represents sales development
6.4%
4.0%
10
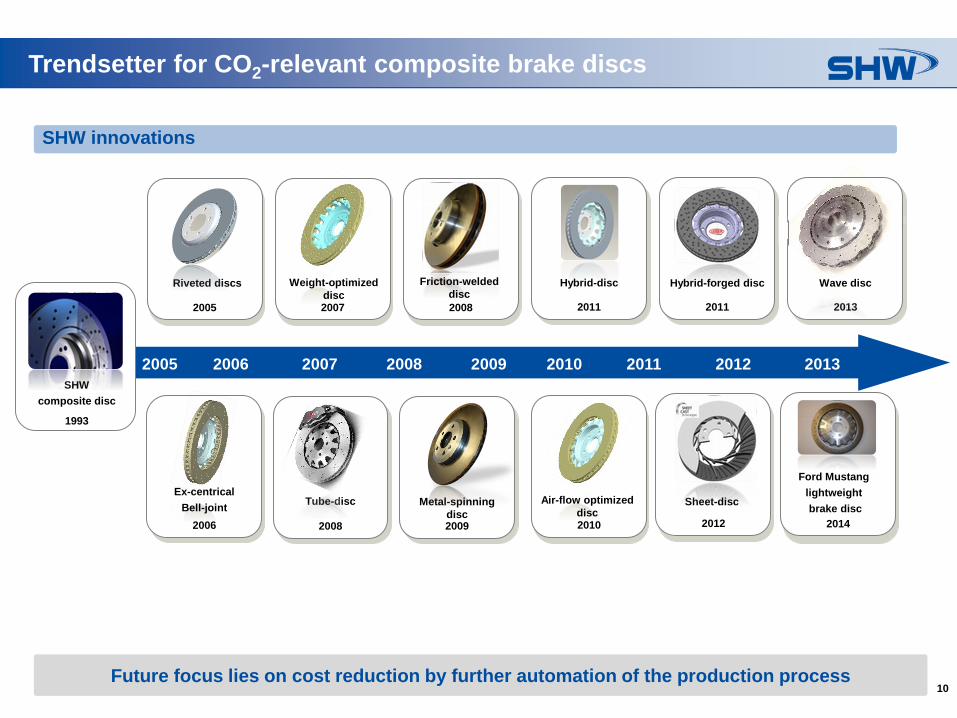
2008
Tube-disc
Trendsetter for CO2-relevant composite brake discs
SHW innovations
2005 2006 2007 2008 2009 2010 2011 2012 2013
SHW
composite disc
1993
Future focus lies on cost reduction by further automation of the production process
2007
Weight-optimized
disc
2010
Air-flow optimized
disc
2005
Riveted discs
2008
Friction-welded
disc
2012
Sheet-disc
2011
Hybrid-forged disc
2006
Ex-centrical
Bell-joint
2011
Hybrid-disc
2013
Wave disc
2014
Ford Mustang
lightweight
brake disc
2009
Metal-spinning
disc
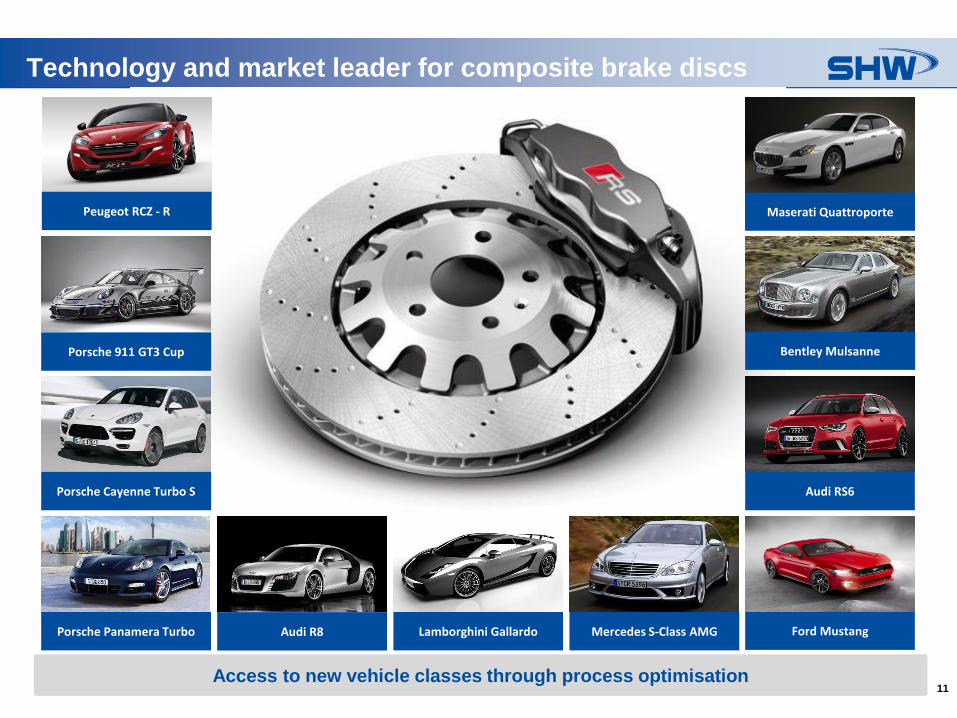
11Access to new vehicle classes through process optimisation
Technology and market leader for composite brake discs
Porsche 911 GT3 Cup
Porsche Cayenne Turbo S Audi RS6
Porsche Panamera Turbo Audi R8 Ford Mustang
Bentley Mulsanne
Mercedes S-Class AMGLamborghini Gallardo
Peugeot RCZ - R Maserati Quattroporte
12Improved profitability and product mix
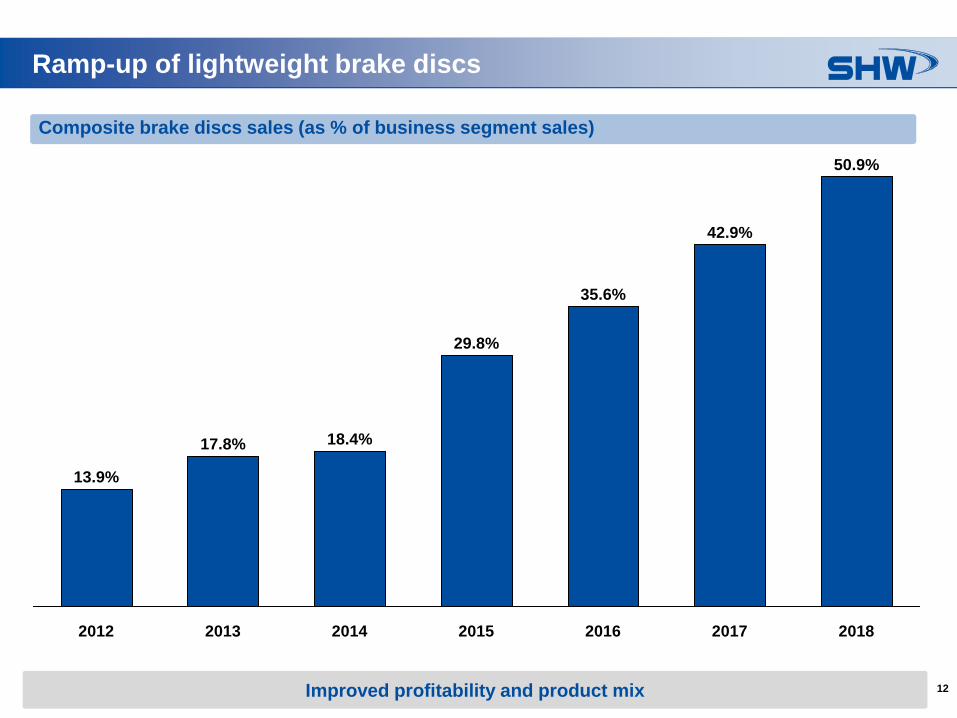
Ramp-up of lightweight brake discs
Composite brake discs sales (as % of business segment sales)
17.8% 18.4%
29.8%
2017 20182016
50.9%
42.9%
2015
35.6%
20142012
13.9%
2013
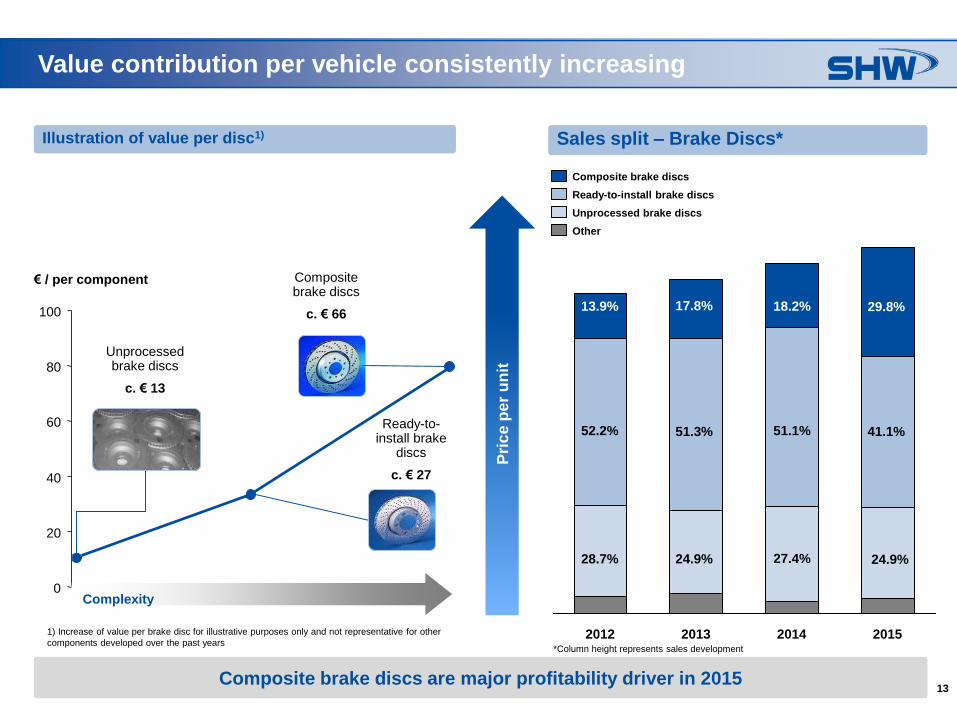
13Composite brake discs are major profitability driver in 2015
Value contribution per vehicle consistently increasing
Illustration of value per disc1)
0
20
40
60
80
100
€ / per component
Unprocessed brake discs
c. € 13
Ready-to-install brake
discs
c. € 27
Composite brake discs
c. € 66
Complexity
Sales split – Brake Discs*
Pri
ce
pe
r u
nit
2015201420132012
Other
Ready-to-install brake discs
Unprocessed brake discs
Composite brake discs
29.8%18.2%17.8%13.9%
41.1%51.1%51.3%52.2%
24.9%27.4%24.9%28.7%
1) Increase of value per brake disc for illustrative purposes only and not representative for other
components developed over the past years*Column height represents sales development
14
Internationalisation
15
16.0
20172016 2018
17.7
19.3 19.4
20192013
16.7
18.6
2015
3.2%
2014
17.7
Source: PwC Autofacts – January 2015
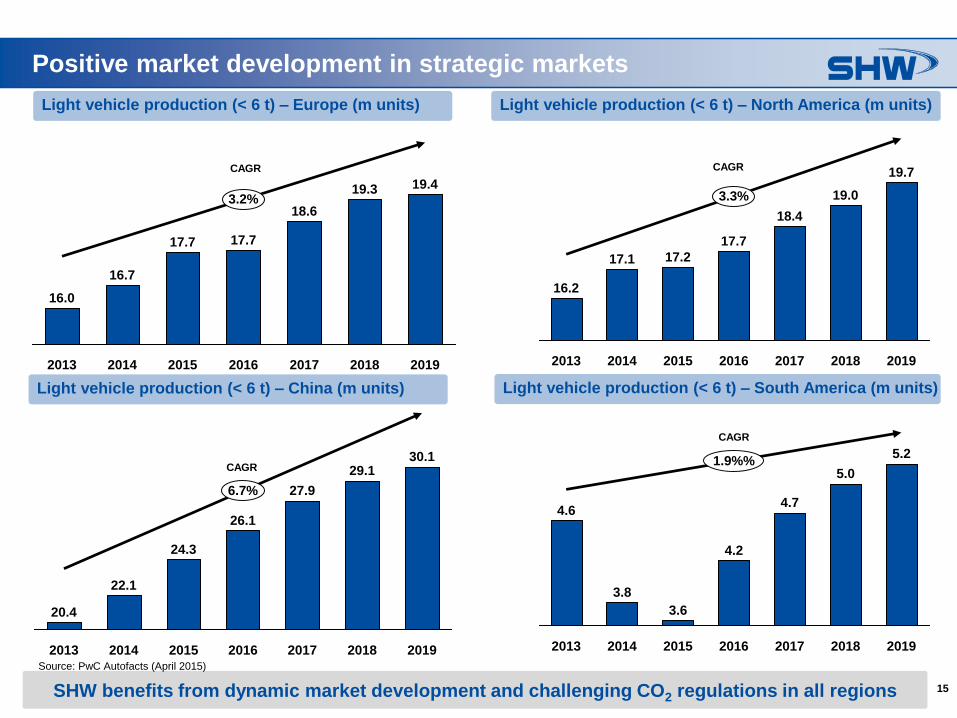
Positive market development in strategic markets
Light vehicle production (< 6 t) – Europe (m units) Light vehicle production (< 6 t) – North America (m units)
18.4
16.2
17.2
2019
3.3%
19.7
17.7
17.1
2017
19.0
2013 2014 20182015 2016
2019
30.1
24.3
6.7%
22.1
2013 2014
26.1
2015 2018
29.1
20172016
20.4
27.94.7
3.6
20192013 2015
4.6
1.9%%5.0
4.2
2014 2017
5.2
3.8
20182016
CAGR CAGR
CAGR
CAGR
Light vehicle production (< 6 t) – China (m units) Light vehicle production (< 6 t) – South America (m units)
SHW benefits from dynamic market development and challenging CO2 regulations in all regions
Source: PwC Autofacts (April 2015)
16
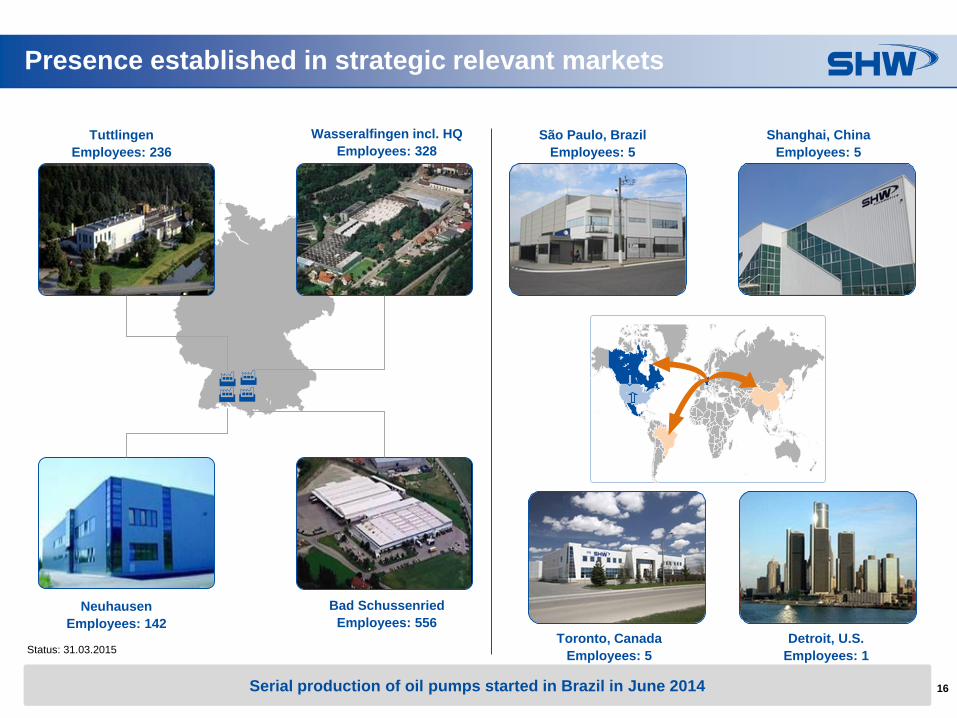
Presence established in strategic relevant markets
Serial production of oil pumps started in Brazil in June 2014
Bad Schussenried
Employees: 556
Wasseralfingen incl. HQ
Employees: 328
Neuhausen
Employees: 142
Tuttlingen
Employees: 236
Shanghai, China
Employees: 5
São Paulo, Brazil
Employees: 5
Detroit, U.S.
Employees: 1
Toronto, Canada
Employees: 5Status: 31.03.2015
17
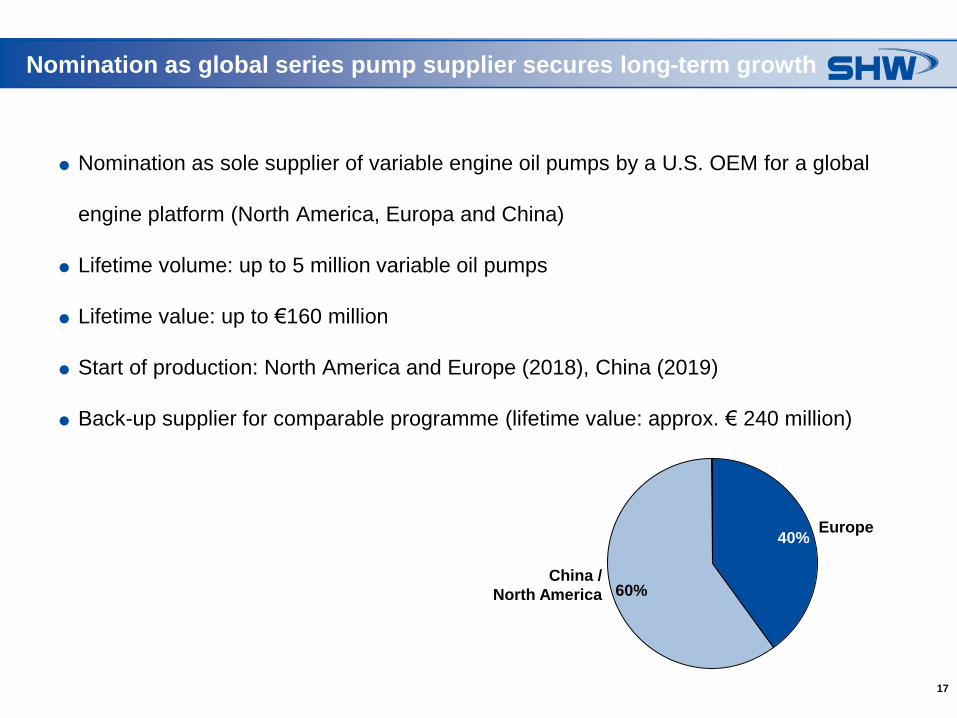
Nomination as global series pump supplier secures long-term growth
Nomination as sole supplier of variable engine oil pumps by a U.S. OEM for a global
engine platform (North America, Europa and China)
Lifetime volume: up to 5 million variable oil pumps
Lifetime value: up to €160 million
Start of production: North America and Europe (2018), China (2019)
Back-up supplier for comparable programme (lifetime value: approx. € 240 million)
40%
60%
Europe
China /
North America
18
Status internationalisation: Pumps and Engine Components
China:
Successful delivery of prototypes of electric auxiliary pumps for start-stop function
as well as transmission oil pumps for dual-clutch
Nomination as serial supplier shortly before completion
Active preparation for the start of serial production in the second half of 2015
Positive results expected promptly
Brazil:
In 2014 successful start of operation; 2015 seems to be characterised by a
challenging market environment
Europe:
• Intensified search for best cost country locations in South-Eastern and Eastern
Europe for capacity expansion
19
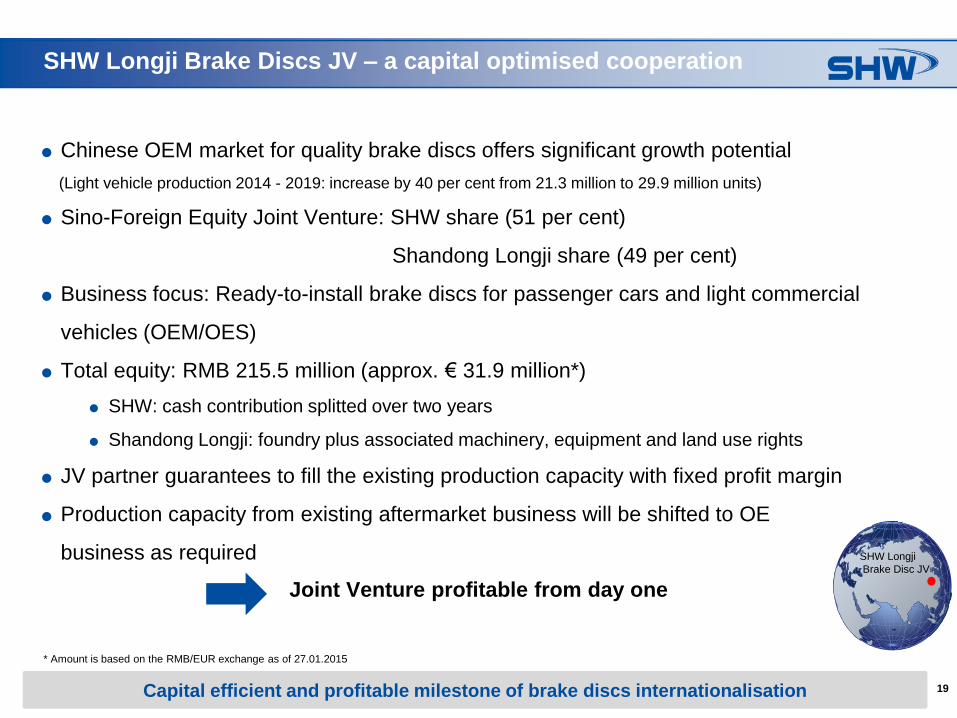
SHW Longji Brake Discs JV – a capital optimised cooperation
* Amount is based on the RMB/EUR exchange as of 27.01.2015
Chinese OEM market for quality brake discs offers significant growth potential
(Light vehicle production 2014 - 2019: increase by 40 per cent from 21.3 million to 29.9 million units)
Sino-Foreign Equity Joint Venture: SHW share (51 per cent)
Shandong Longji share (49 per cent)
Business focus: Ready-to-install brake discs for passenger cars and light commercial
vehicles (OEM/OES)
Total equity: RMB 215.5 million (approx. € 31.9 million*)
SHW: cash contribution splitted over two years
Shandong Longji: foundry plus associated machinery, equipment and land use rights
JV partner guarantees to fill the existing production capacity with fixed profit margin
Production capacity from existing aftermarket business will be shifted to OE
business as required SHW Longji
Brake Disc JV
Joint Venture profitable from day one
Capital efficient and profitable milestone of brake discs internationalisation
20
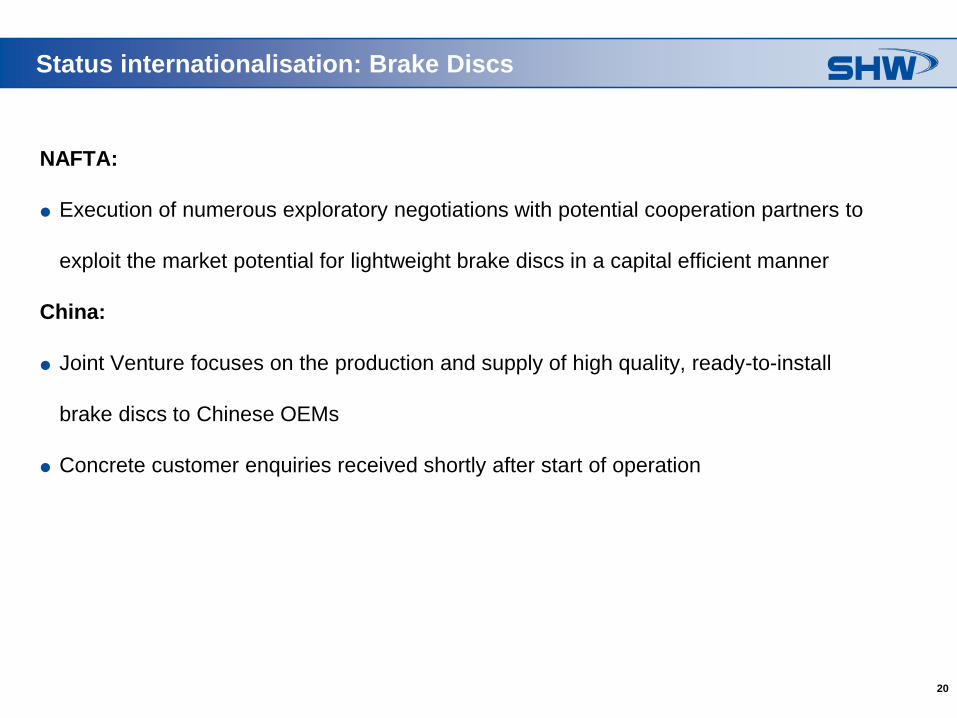
NAFTA:
Execution of numerous exploratory negotiations with potential cooperation partners to
exploit the market potential for lightweight brake discs in a capital efficient manner
China:
Joint Venture focuses on the production and supply of high quality, ready-to-install
brake discs to Chinese OEMs
Concrete customer enquiries received shortly after start of operation
Status internationalisation: Brake Discs
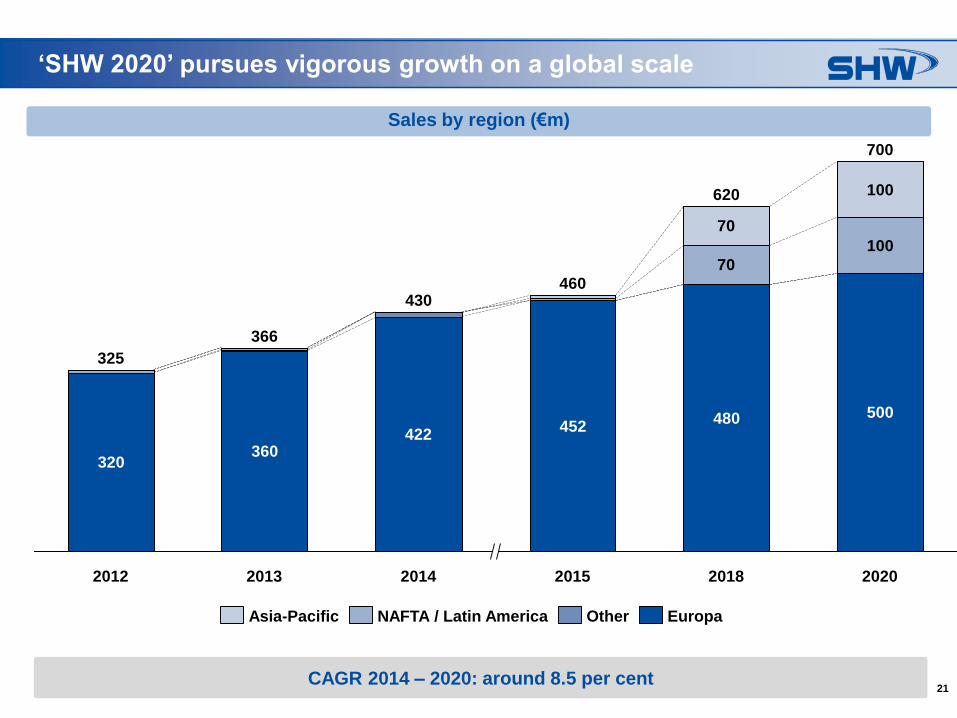
21CAGR 2014 – 2020: around 8.5 per cent
‘SHW 2020’ pursues vigorous growth on a global scale
320360
422452
480 500
100
70
100
70
366
2012
325
2018
620
2015
460
2014
430
700
2013 2020
NAFTA / Latin America OtherAsia-Pacific Europa
Sales by region (€m)
22
Financials
23
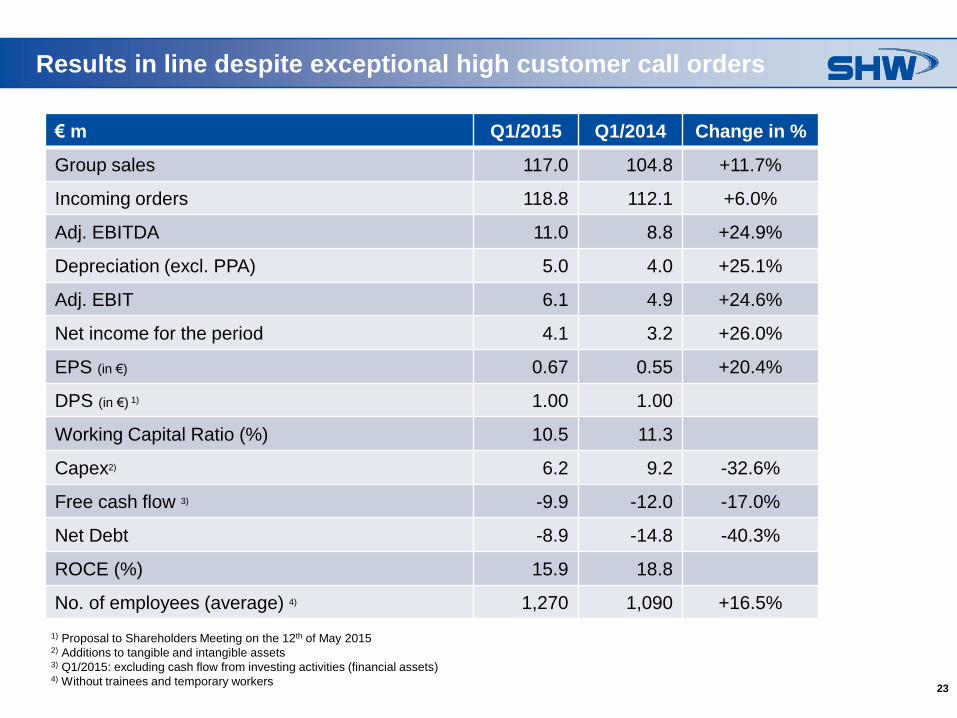
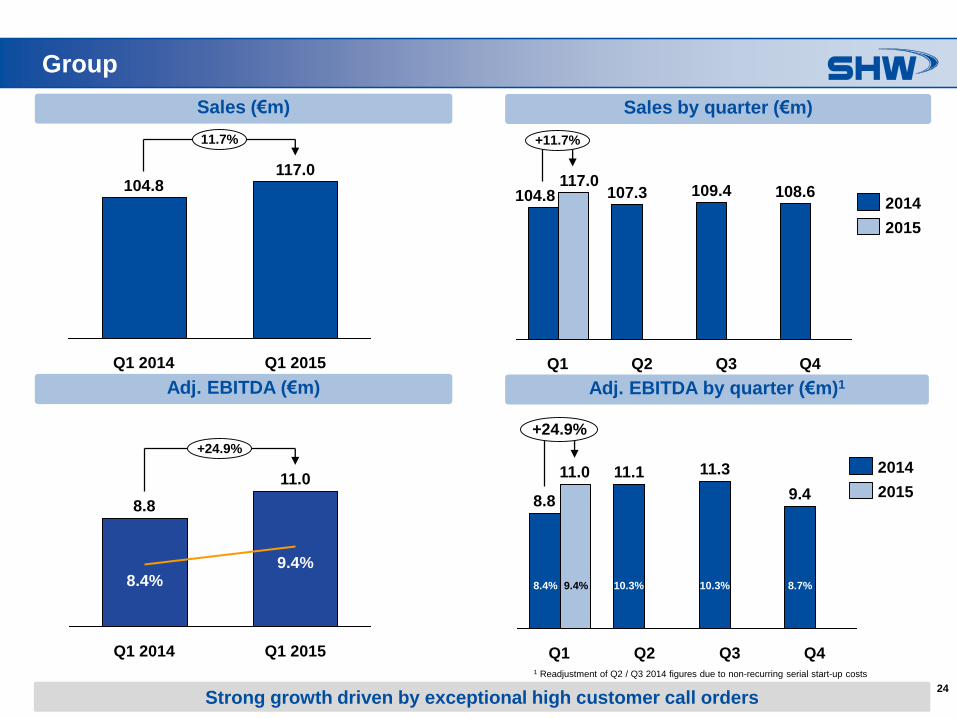
Results in line despite exceptional high customer call orders
€ m Q1/2015 Q1/2014 Change in %
Group sales 117.0 104.8 +11.7%
Incoming orders 118.8 112.1 +6.0%
Adj. EBITDA 11.0 8.8 +24.9%
Depreciation (excl. PPA) 5.0 4.0 +25.1%
Adj. EBIT 6.1 4.9 +24.6%
Net income for the period 4.1 3.2 +26.0%
EPS (in €) 0.67 0.55 +20.4%
DPS (in €) 1) 1.00 1.00
Working Capital Ratio (%) 10.5 11.3
Capex2) 6.2 9.2 -32.6%
Free cash flow 3) -9.9 -12.0 -17.0%
Net Debt -8.9 -14.8 -40.3%
ROCE (%) 15.9 18.8
No. of employees (average) 4) 1,270 1,090 +16.5%
1) Proposal to Shareholders Meeting on the 12th of May 20152) Additions to tangible and intangible assets3) Q1/2015: excluding cash flow from investing activities (financial assets)4) Without trainees and temporary workers
24
Group
Sales by quarter (€m)
+11.7%
Q4
108.6
Q3
109.4
Q2
107.3
Q1
117.0104.8
2015
2014
11.7%
Q1 2015
117.0
Q1 2014
104.8
Sales (€m)
Strong growth driven by exceptional high customer call orders
Q3
11.3
Q2
11.1
Q1
11.0
8.8
Q4
9.4
+24.9%
2015
2014
Adj. EBITDA (€m) Adj. EBITDA by quarter (€m)1
11.0
9.4%
Q1 2014
8.8
8.4%
+24.9%
Q1 20151 Readjustment of Q2 / Q3 2014 figures due to non-recurring serial start-up costs
8.4% 10.3% 10.3% 8.7%9.4%
25
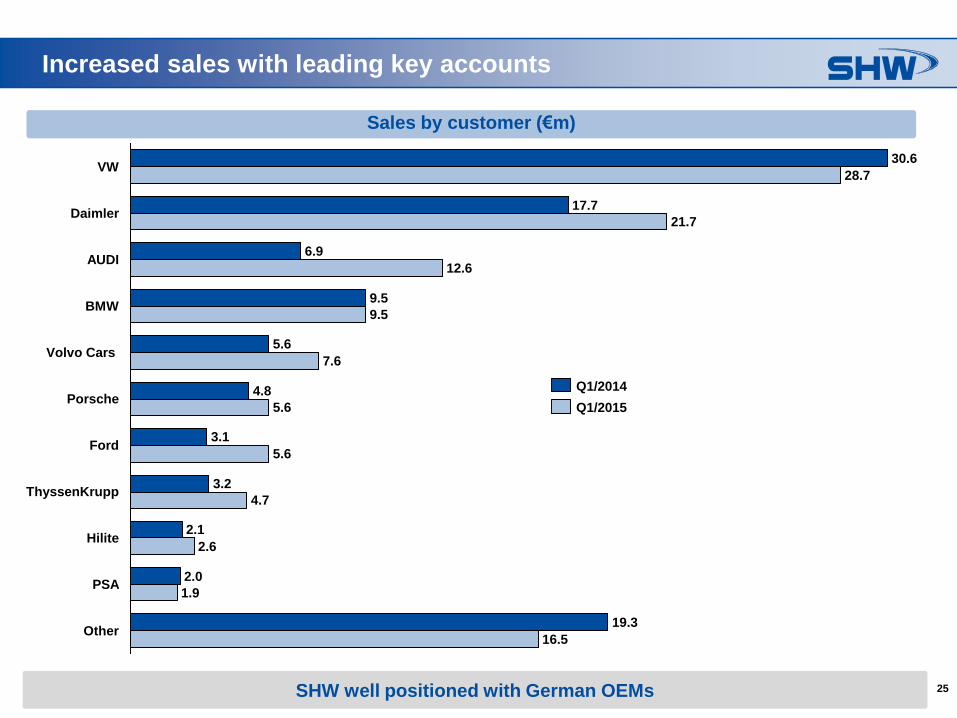
Increased sales with leading key accounts
14.7
1.9
14.7
2.2
14.7 17.5
2.3
2.2
14.7 17.5
2.3
Sales by customer (€m)
SHW well positioned with German OEMs
12.6
Porsche
3.1
5.6
16.5Other
19.3
PSA1.9
2.0
Hilite2.6
2.1
ThyssenKrupp4.7
3.2
6.9
5.6
4.8
Volvo Cars7.6
5.6
BMW9.5
9.5
Daimler21.7
17.7
VW28.7
30.6
Ford
AUDI
Q1/2015
Q1/2014
26
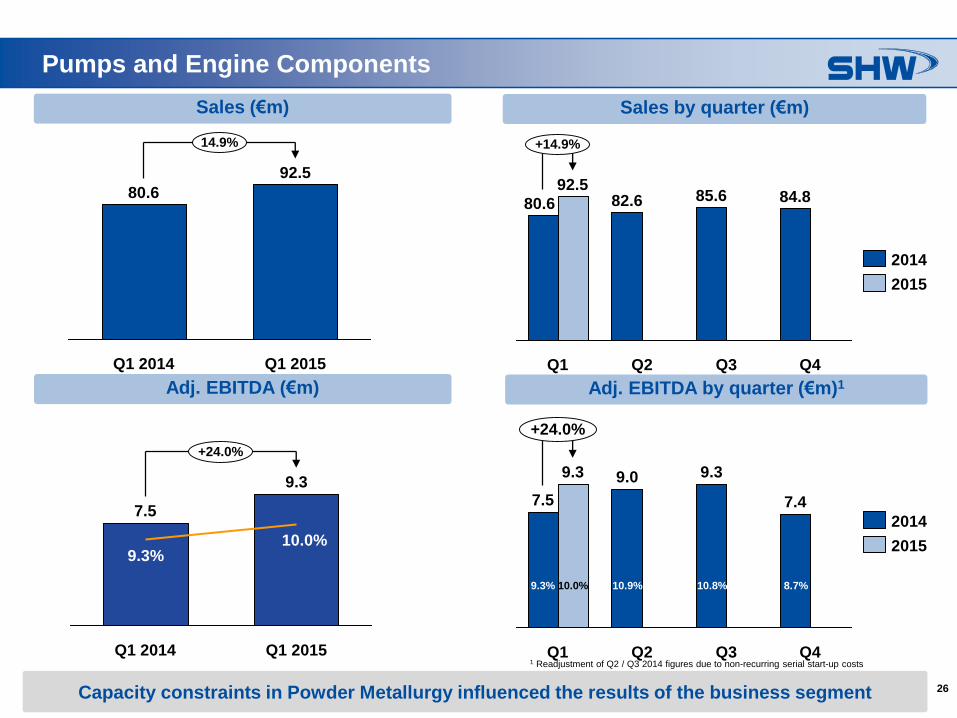
Pumps and Engine Components
Sales by quarter (€m)
+14.9%
Q4
84.8
Q1
80.6
92.582.6
Q3
85.6
Q2
2014
2015
Sales (€m)
9.3 9.0
7.4
9.3
Q2
7.5
Q3 Q4Q1
+24.0%
2014
2015
Adj. EBITDA (€m) Adj. EBITDA by quarter (€m)1
7.5
9.3
Q1 2014
9.3%
+24.0%
10.0%
Q1 2015
14.9%
Q1 2015
92.5
Q1 2014
80.6
Capacity constraints in Powder Metallurgy influenced the results of the business segment
1 Readjustment of Q2 / Q3 2014 figures due to non-recurring serial start-up costs
9.3% 10.9% 10.8% 8.7%10.0%
27
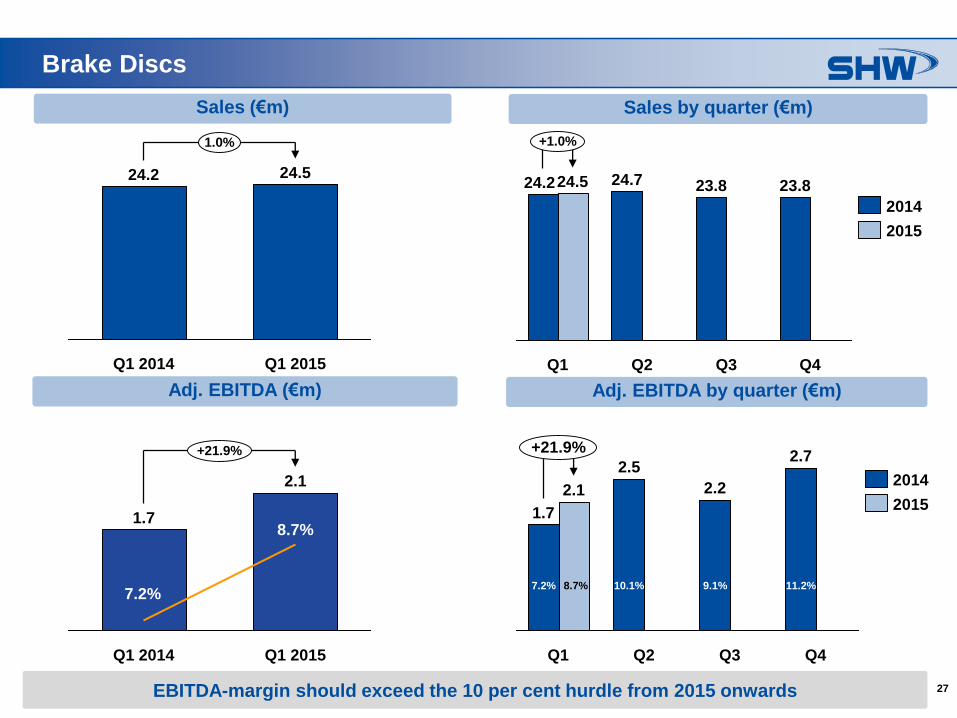
Brake Discs
Sales by quarter (€m)
23.8
Q4
+1.0%
Q3
24.7
Q1
24.5
Q2
23.824.2
Sales (€m)
2.1
1.7
Q4Q2
2.5
Q1
2.2
Q3
2.7+21.9%
Adj. EBITDA (€m) Adj. EBITDA by quarter (€m)
2014
2015
2015
2014
7.2%
1.7
Q1 2014
8.7%
2.1
Q1 2015
+21.9%
24.2
Q1 2014 Q1 2015
1.0%
24.5
EBITDA-margin should exceed the 10 per cent hurdle from 2015 onwards
7.2% 10.1% 9.1% 11.2%8.7%
28
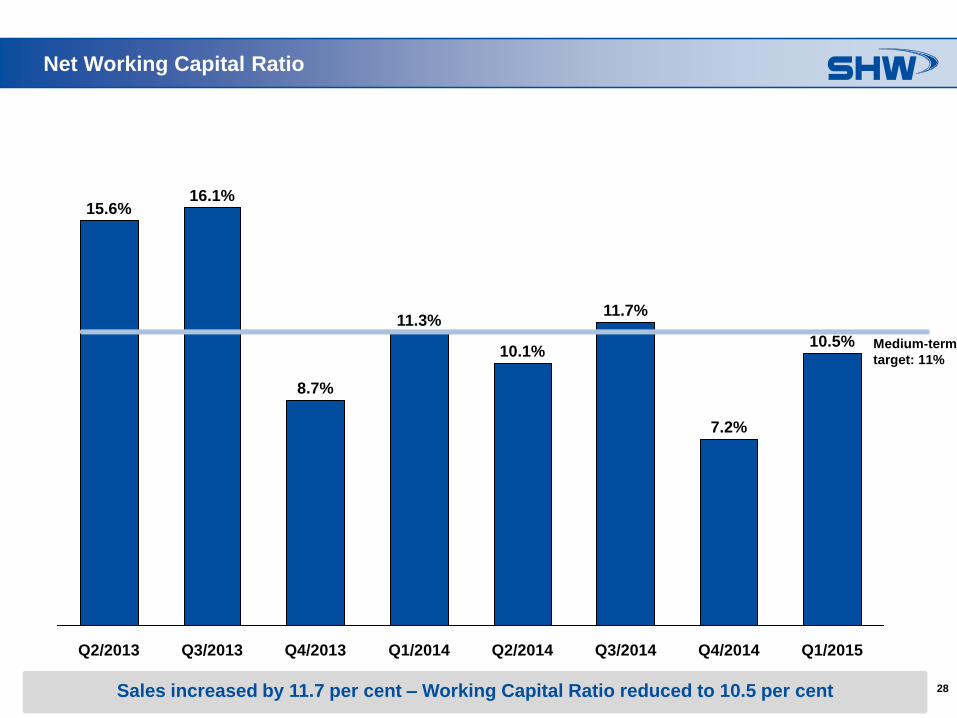
Net Working Capital Ratio
Q3/2013
11.3%
10.1%
7.2%
11.7%
15.6%
Q2/2013
8.7%
Q1/2014 Q4/2014 Q1/2015Q3/2014Q2/2014
16.1%
Q4/2013
10.5%
Sales increased by 11.7 per cent – Working Capital Ratio reduced to 10.5 per cent
Medium-term
target: 11%
29
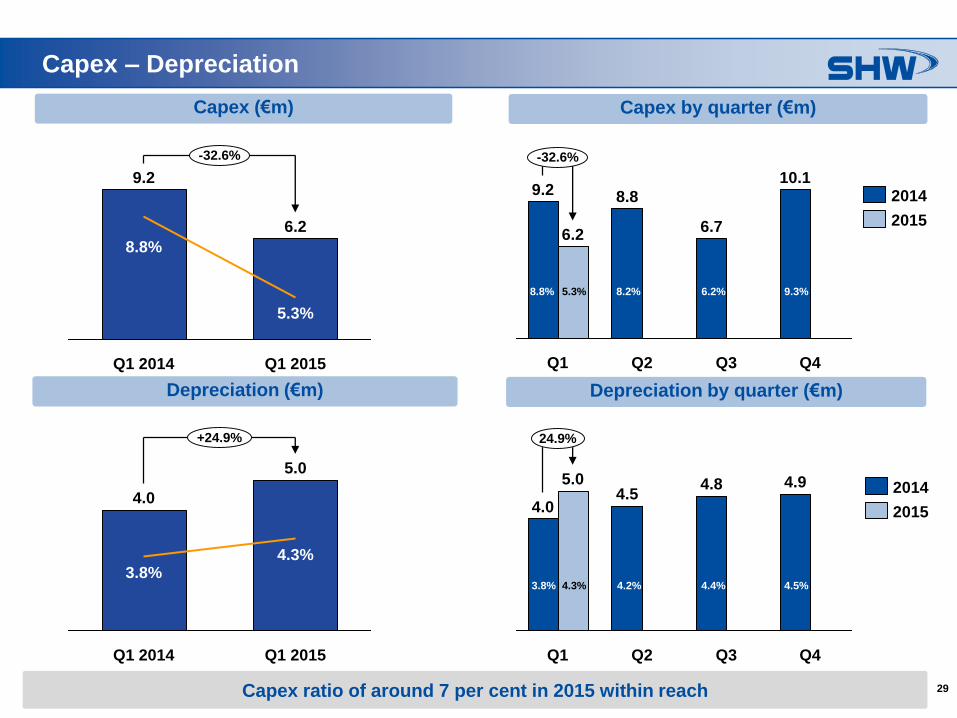
Capex – Depreciation
14.714.7
Capex by quarter (€m)
Q3
6.2
8.8
Q1
-32.6%
9.2
6.7
10.1
Q2 Q4
2014
2015
Capex (€m)
4.0
5.0
Q3
4.9
Q4
24.9%
Q1 Q2
4.84.5
Depreciation (€m) Depreciation by quarter (€m)
2014
2015
8.8%
5.3%
-32.6%
Q1 2015
6.2
Q1 2014
9.2
Q1 2014
4.3%
5.0
+24.9%
4.0
Q1 2015
3.8%
Capex ratio of around 7 per cent in 2015 within reach
3.8% 4.2% 4.4% 4.5%4.3%
8.8% 8.2% 6.2% 9.3%5.3%
30
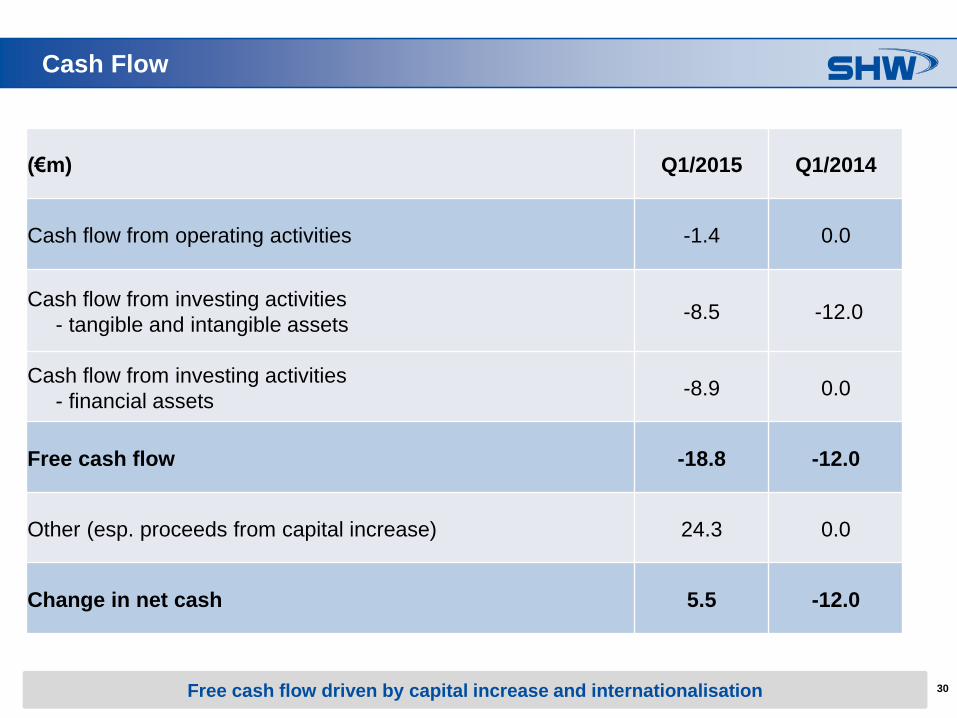
Cash Flow
5.(€m) Q1/2015 Q1/2014
Cash flow from operating activities -1.4 0.0
Cash flow from investing activities
- tangible and intangible assets-8.5 -12.0
Cash flow from investing activities
- financial assets-8.9 0.0
Free cash flow -18.8 -12.0
Other (esp. proceeds from capital increase) 24.3 0.0
Change in net cash 5.5 -12.0
Free cash flow driven by capital increase and internationalisation
31
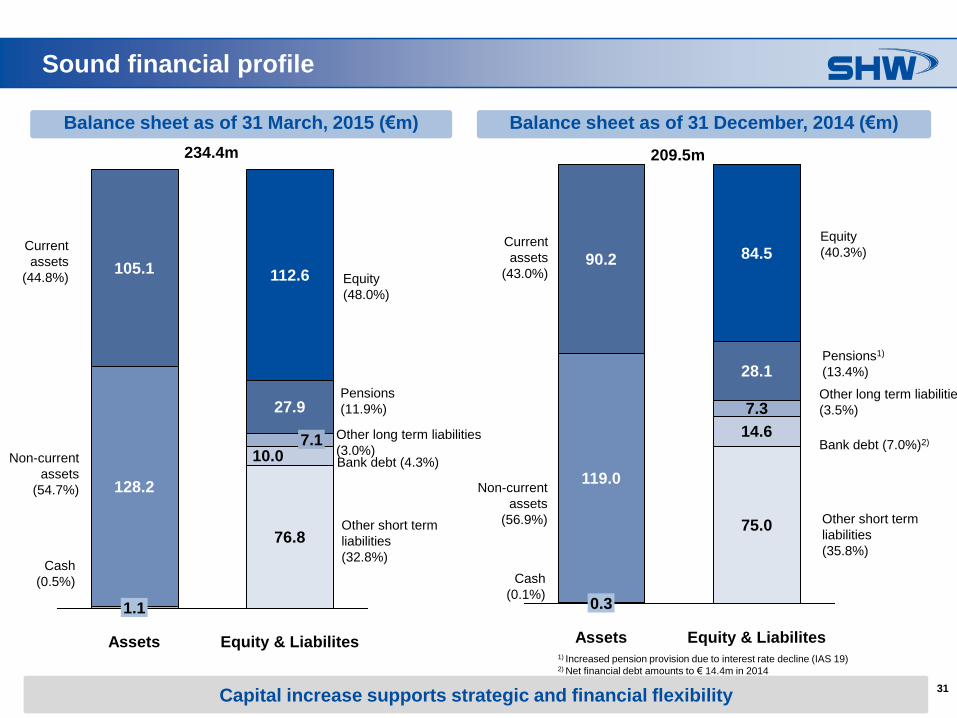
Sound financial profile
Balance sheet as of 31 March, 2015 (€m) Balance sheet as of 31 December, 2014 (€m)
Other short term
liabilities
(35.8%)
Pensions1)
(13.4%)
Current
assets
(43.0%)
Non-current
assets
(56.9%)
Equity
(40.3%)
37.9
209.5m
Equity & Liabilites
75.0
14.6
7.3
28.1
84.5
Assets
0.3
119.0
90.2
Cash
(0.1%)
Other long term liabilities
(3.5%)
Bank debt (7.0%)2)
Capital increase supports strategic and financial flexibility
1) Increased pension provision due to interest rate decline (IAS 19)2) Net financial debt amounts to € 14.4m in 2014
Equity & Liabilites
76.8
10.07.1
27.9
112.6
Assets
1.1
128.2
105.1
Current
assets
(44.8%)
Non-current
assets
(54.7%)
Cash
(0.5%)
Equity
(48.0%)
Pensions
(11.9%)
Other long term liabilities
(3.0%)Bank debt (4.3%)
Other short term
liabilities
(32.8%)
234.4m
32
Outlook – forward going with vigour and consistency
33
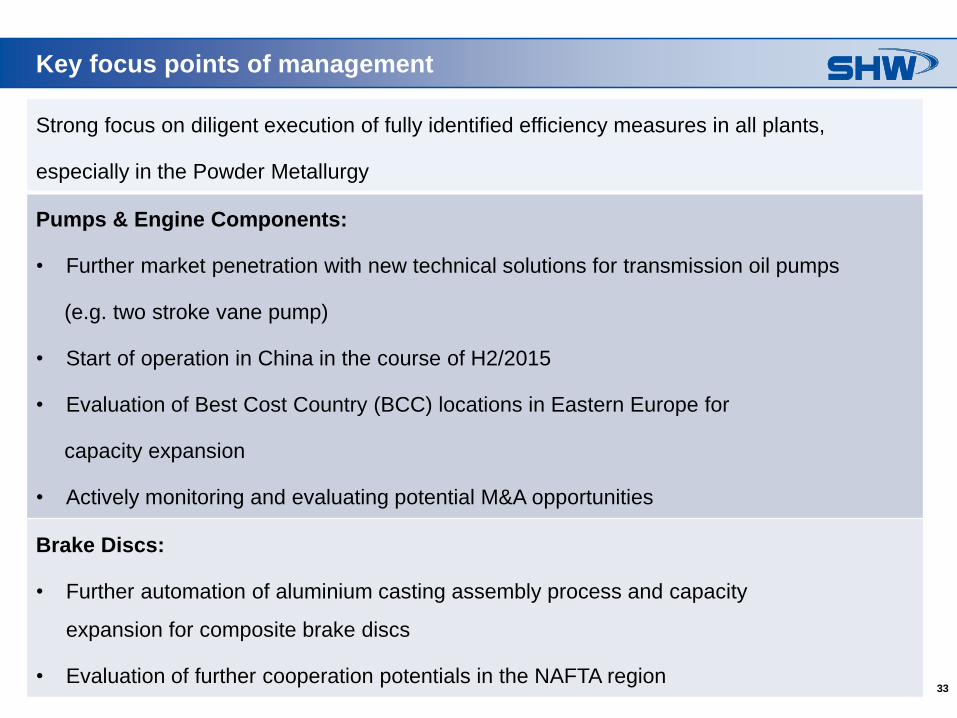
Key focus points of management
Strong focus on diligent execution of fully identified efficiency measures in all plants,
especially in the Powder Metallurgy
Pumps & Engine Components:
• Further market penetration with new technical solutions for transmission oil pumps
(e.g. two stroke vane pump)
• Start of operation in China in the course of H2/2015
• Evaluation of Best Cost Country (BCC) locations in Eastern Europe for
capacity expansion
• Actively monitoring and evaluating potential M&A opportunities
Brake Discs:
• Further automation of aluminium casting assembly process and capacity
expansion for composite brake discs
• Evaluation of further cooperation potentials in the NAFTA region
34
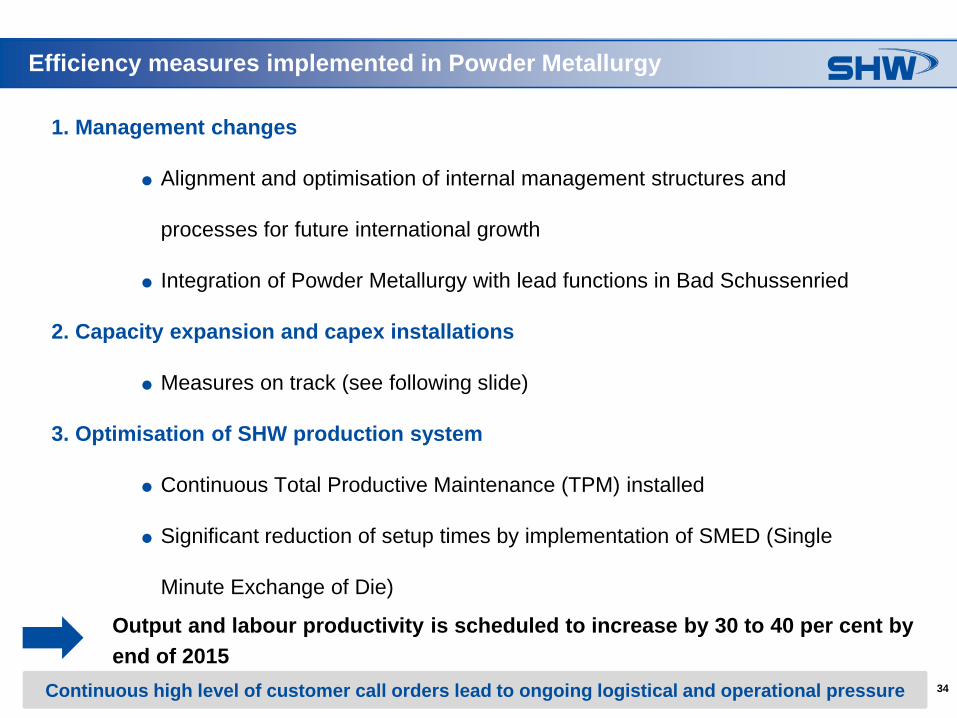
Efficiency measures implemented in Powder Metallurgy
1. Management changes
Alignment and optimisation of internal management structures and
processes for future international growth
Integration of Powder Metallurgy with lead functions in Bad Schussenried
2. Capacity expansion and capex installations
Measures on track (see following slide)
3. Optimisation of SHW production system
Continuous Total Productive Maintenance (TPM) installed
Significant reduction of setup times by implementation of SMED (Single
Minute Exchange of Die)
Output and labour productivity is scheduled to increase by 30 to 40 per cent by
end of 2015
Continuous high level of customer call orders lead to ongoing logistical and operational pressure
35
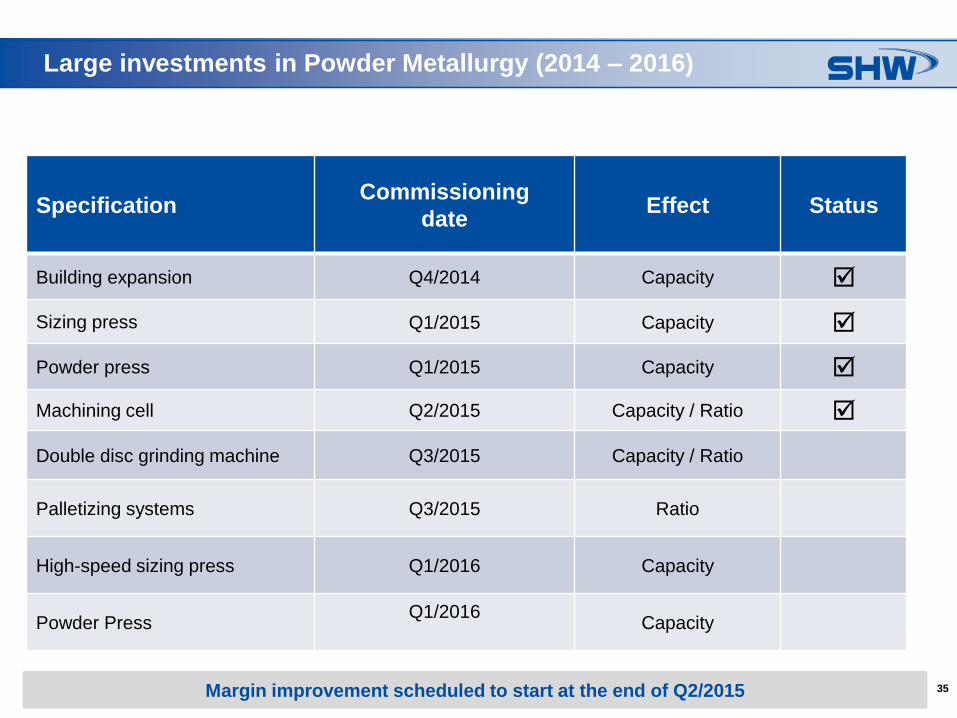
Large investments in Powder Metallurgy (2014 – 2016)
SpecificationCommissioning
dateEffect Status
Building expansion Q4/2014 Capacity
Sizing press Q1/2015 Capacity
Powder press Q1/2015 Capacity
Machining cell Q2/2015 Capacity / Ratio
Double disc grinding machine Q3/2015 Capacity / Ratio
Palletizing systems Q3/2015 Ratio
High-speed sizing press Q1/2016 Capacity
Powder PressQ1/2016
Capacity
Margin improvement scheduled to start at the end of Q2/2015
36
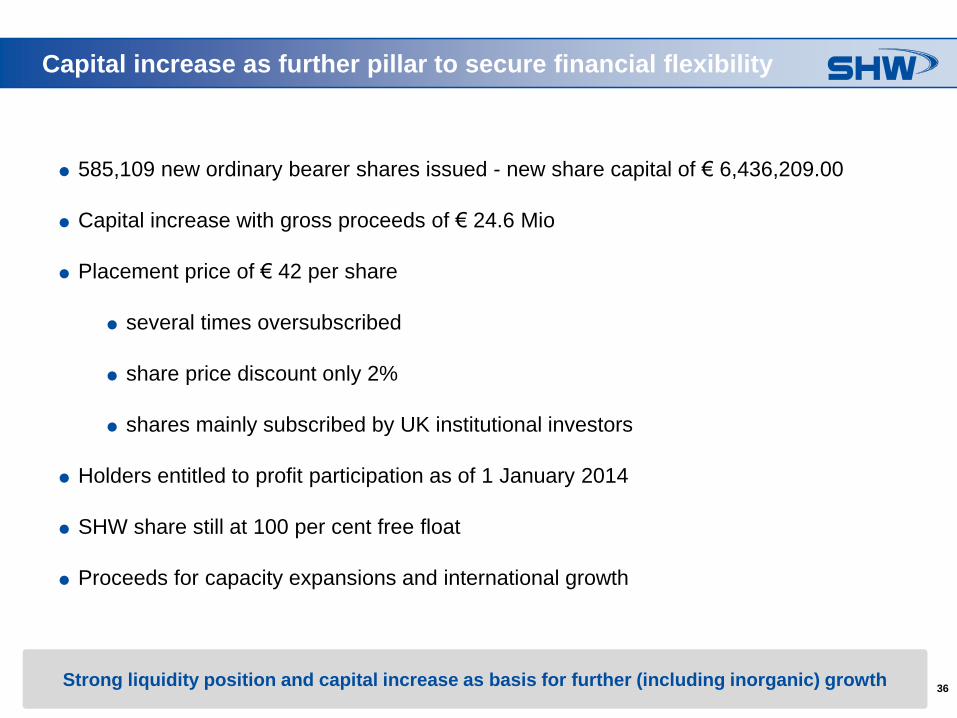
Capital increase as further pillar to secure financial flexibility
585,109 new ordinary bearer shares issued - new share capital of € 6,436,209.00
Capital increase with gross proceeds of € 24.6 Mio
Placement price of € 42 per share
several times oversubscribed
share price discount only 2%
shares mainly subscribed by UK institutional investors
Holders entitled to profit participation as of 1 January 2014
SHW share still at 100 per cent free float
Proceeds for capacity expansions and international growth
Strong liquidity position and capital increase as basis for further (including inorganic) growth
37
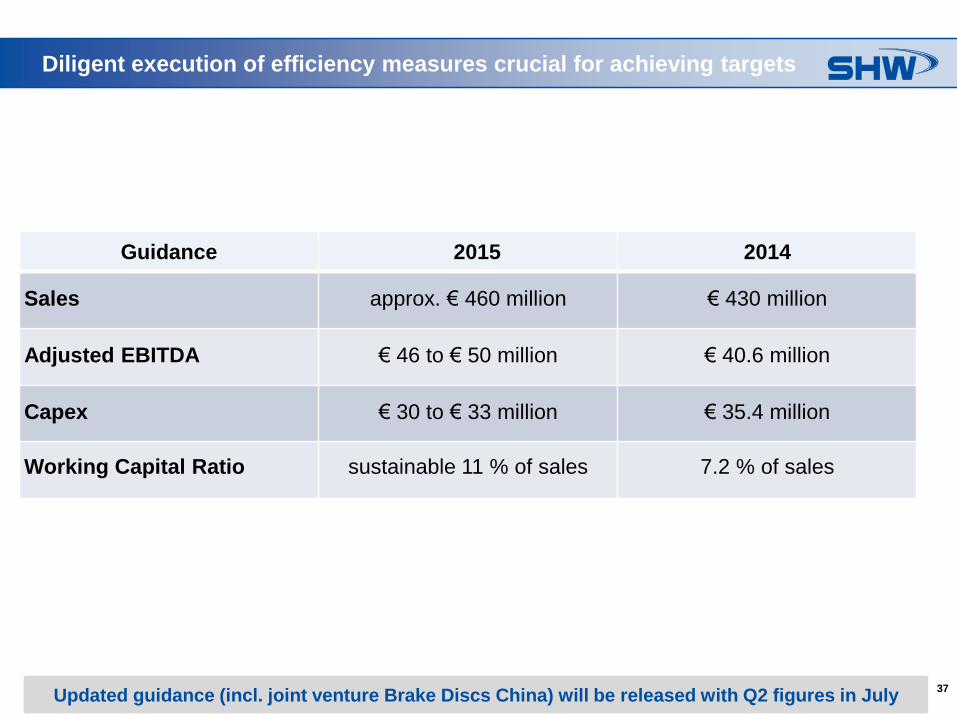
Diligent execution of efficiency measures crucial for achieving targets
Guidance 2015 2014
Sales approx. € 460 million € 430 million
Adjusted EBITDA € 46 to € 50 million € 40.6 million
Capex € 30 to € 33 million € 35.4 million
Working Capital Ratio sustainable 11 % of sales 7.2 % of sales
Updated guidance (incl. joint venture Brake Discs China) will be released with Q2 figures in July
38
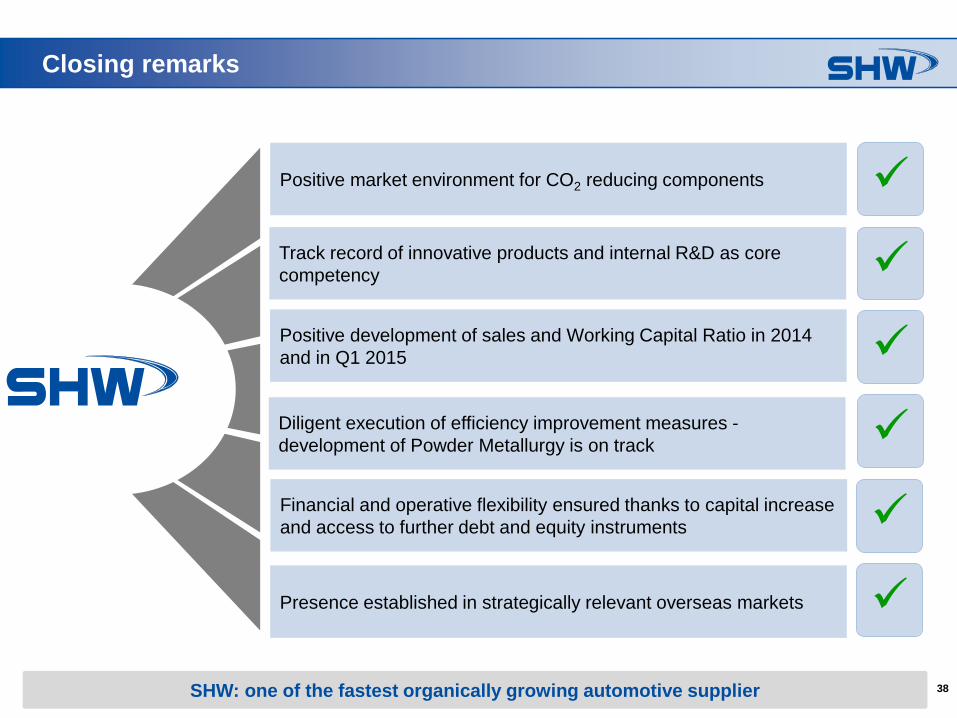
Closing remarks
Positive market environment for CO2 reducing components
Track record of innovative products and internal R&D as core
competency
Positive development of sales and Working Capital Ratio in 2014
and in Q1 2015
Diligent execution of efficiency improvement measures -
development of Powder Metallurgy is on track
Financial and operative flexibility ensured thanks to capital increase
and access to further debt and equity instruments
Presence established in strategically relevant overseas markets
SHW: one of the fastest organically growing automotive supplier
39
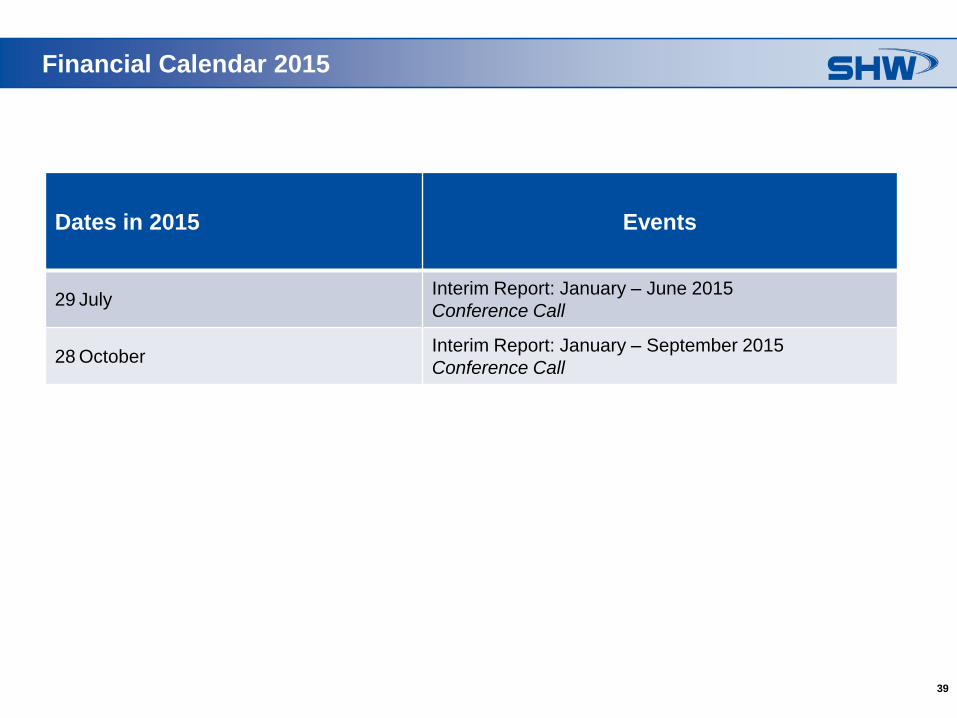
Financial Calendar 2015
Dates in 2015 Events
29 JulyInterim Report: January – June 2015
Conference Call
28 October Interim Report: January – September 2015
Conference Call
40
Michael SchicklingHead of Investor Relations & Corporate Communications
Telephone: +49 (0) 7361 502-462
E-Mail: [email protected]
Anja K. SiehlerSenior Manager Investor Relations & Corporate
Communications
Telephone: +49 (0) 7361 502-469
E-Mail: [email protected]
Contact Investor Relations

41
Back-up
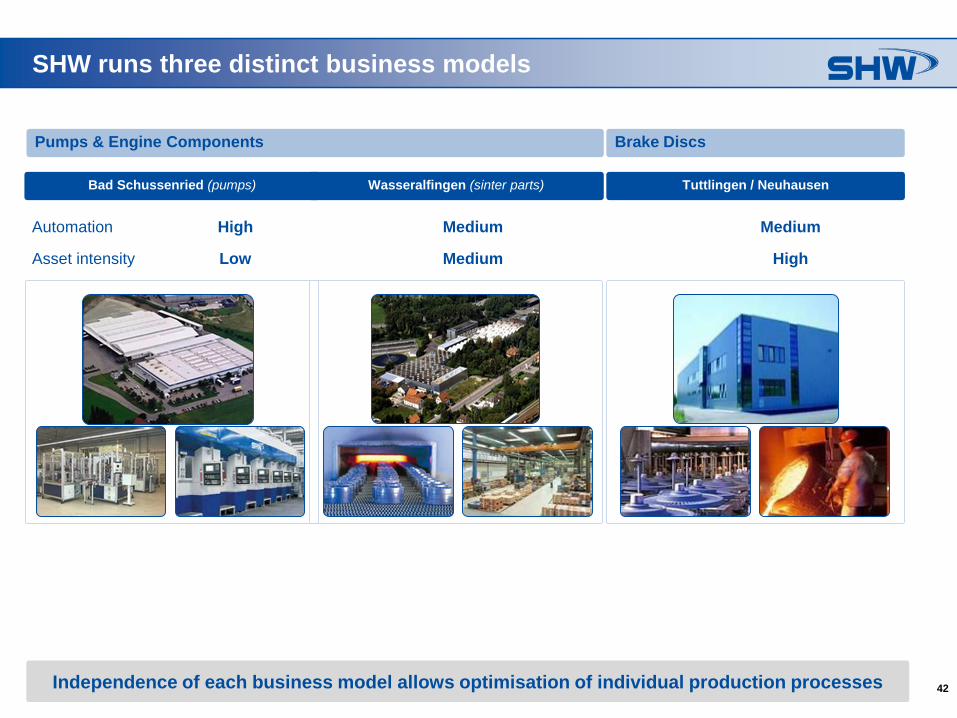
42Independence of each business model allows optimisation of individual production processes
SHW runs three distinct business models
Brake DiscsPumps & Engine Components
Asset intensity MediumLow High
Bad Schussenried (pumps) Wasseralfingen (sinter parts) Tuttlingen / Neuhausen
Automation High Medium Medium
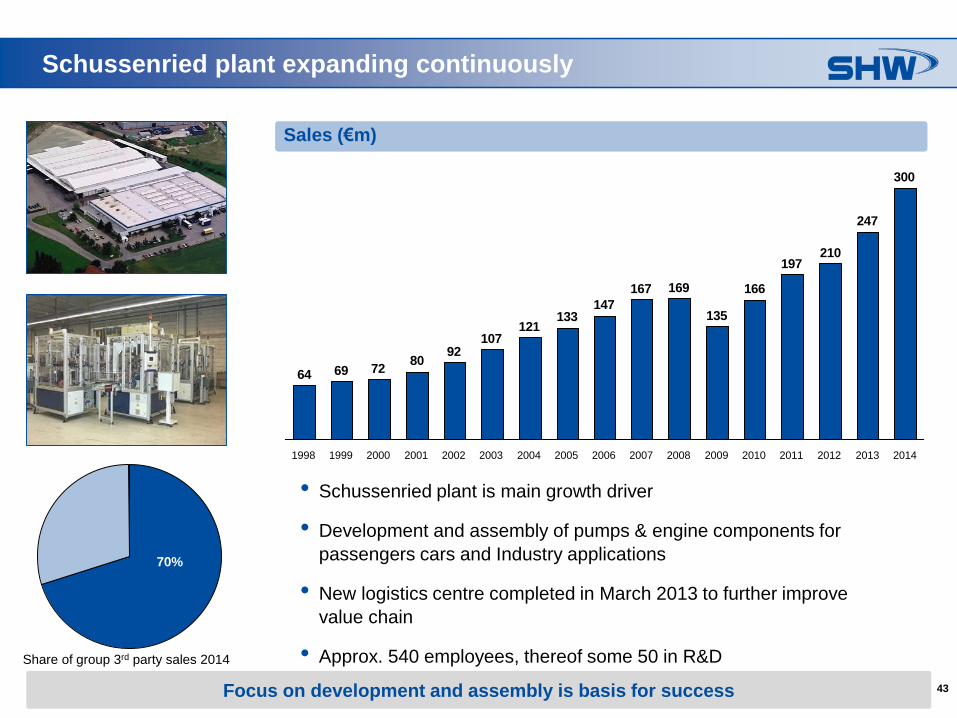
43Focus on development and assembly is basis for success
Schussenried plant expanding continuously
• Schussenried plant is main growth driver
• Development and assembly of pumps & engine components for
passengers cars and Industry applications
• New logistics centre completed in March 2013 to further improve
value chain
• Approx. 540 employees, thereof some 50 in R&D
300
247
210197
166
135
169167
147133
121107
9280
726964
2004200320022001200019991998 201320122011201020092008200720062005 2014
Sales (€m)
Share of group 3rd party sales 2014
70%
44
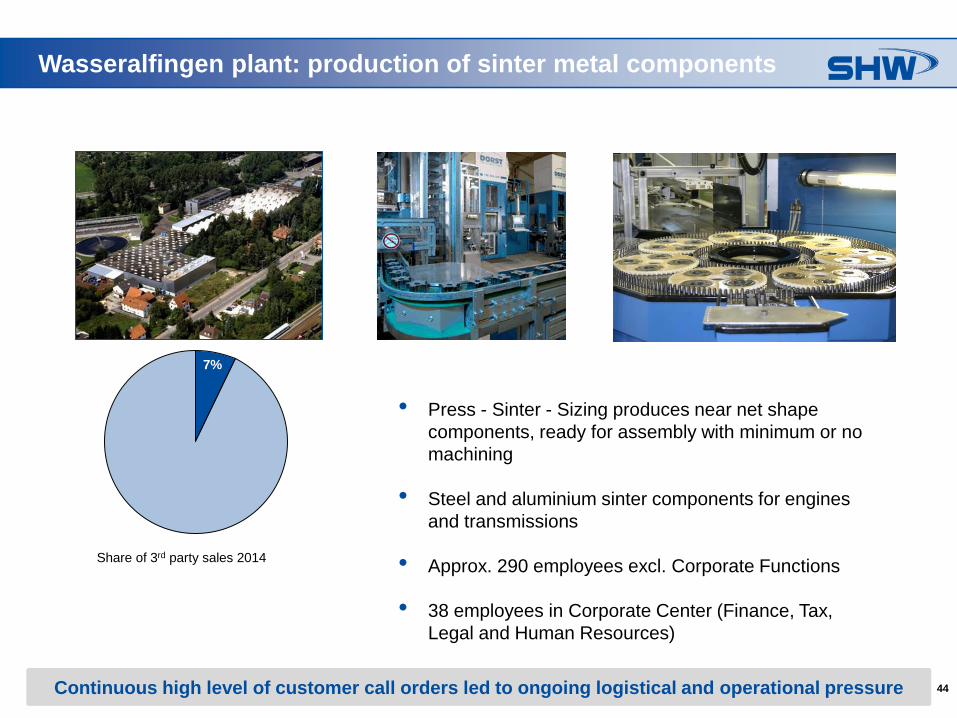
Wasseralfingen plant: production of sinter metal components
• Press - Sinter - Sizing produces near net shape
components, ready for assembly with minimum or no
machining
• Steel and aluminium sinter components for engines
and transmissions
• Approx. 290 employees excl. Corporate Functions
• 38 employees in Corporate Center (Finance, Tax,
Legal and Human Resources)
7%
Continuous high level of customer call orders led to ongoing logistical and operational pressure
Share of 3rd party sales 2014
45
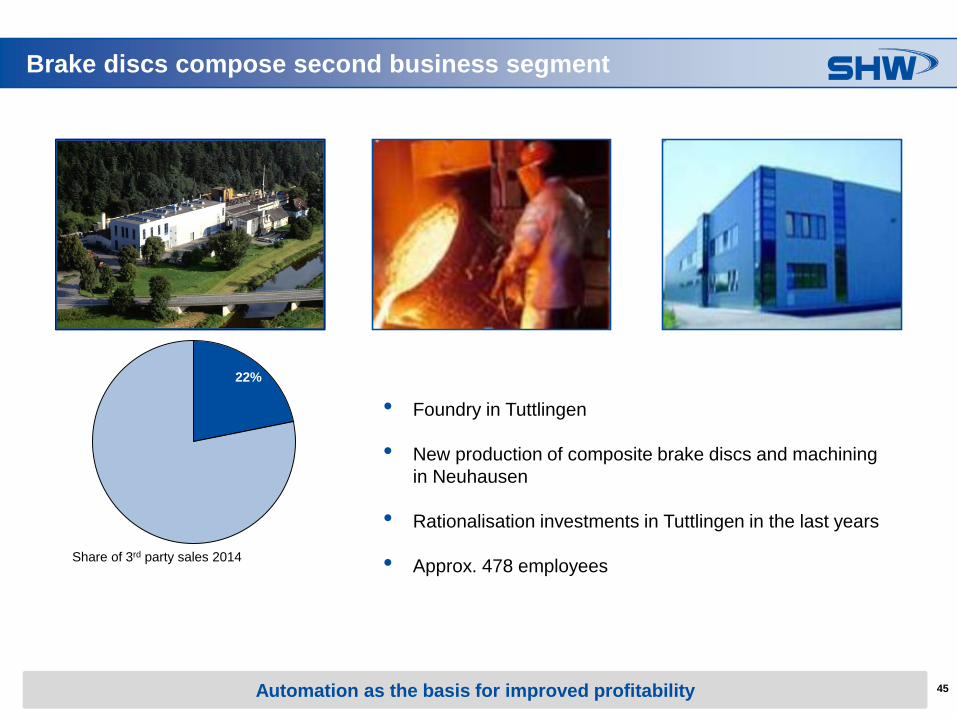
Brake discs compose second business segment
• Foundry in Tuttlingen
• New production of composite brake discs and machining
in Neuhausen
• Rationalisation investments in Tuttlingen in the last years
• Approx. 478 employees
22%
Automation as the basis for improved profitability
Share of 3rd party sales 2014
46
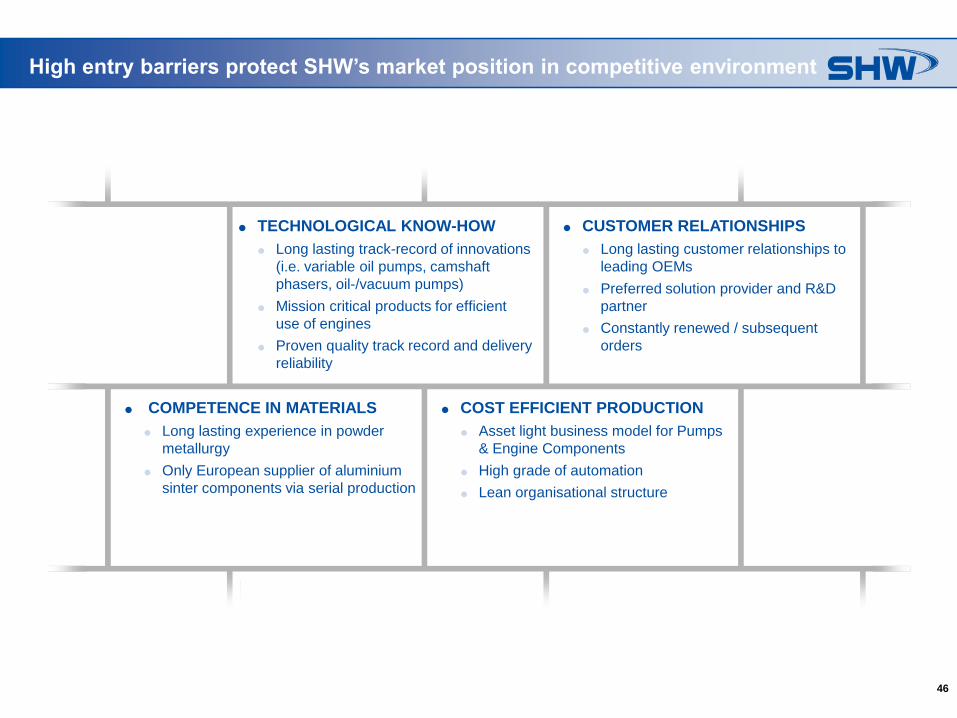
CUSTOMER RELATIONSHIPS
Long lasting customer relationships to
leading OEMs
Preferred solution provider and R&D
partner
Constantly renewed / subsequent
orders
TECHNOLOGICAL KNOW-HOW
Long lasting track-record of innovations
(i.e. variable oil pumps, camshaft
phasers, oil-/vacuum pumps)
Mission critical products for efficient
use of engines
Proven quality track record and delivery
reliability
COST EFFICIENT PRODUCTION
Asset light business model for Pumps
& Engine Components
High grade of automation
Lean organisational structure
COMPETENCE IN MATERIALS
Long lasting experience in powder
metallurgy
Only European supplier of aluminium
sinter components via serial production
High entry barriers protect SHW’s market position in competitive environment
47
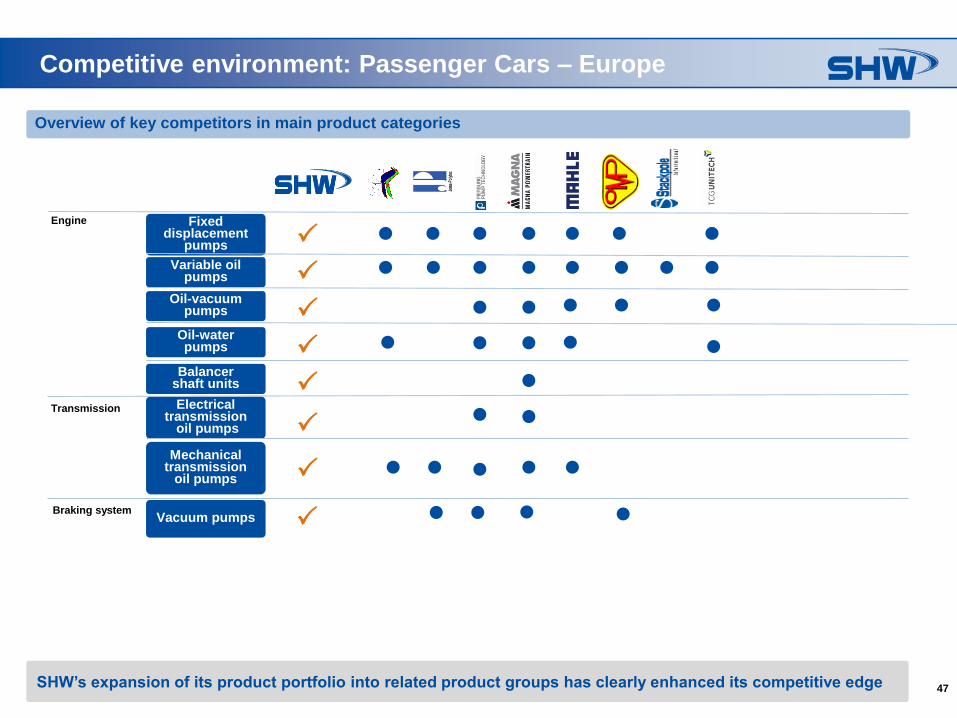
Competitive environment: Passenger Cars – Europe
Overview of key competitors in main product categories
Fixed displacement
pumps
Variable oil pumps
Oil-vacuum pumps
Oil-water pumps
Balancer shaft units
Electrical transmission
oil pumps
Mechanical transmission
oil pumps
SHW’s expansion of its product portfolio into related product groups has clearly enhanced its competitive edge
Sales (€m)
(Year)
290
(2010a)n/a n/a
4,693
(2009)n/a
213
(2009)
31
(2009)
12,117
(2009)
3,864
(2009)
312
(2009)
293
(2009)
150
(n/a)
26
(2008)
840
(2010e)n/a
826
(2009)n/a
405
(2009)
Variable oil
pump
Invariable oil
pump
Electrical oil
pump
Vacuum
pump
Balancer shaft
unit
Camshaft
phaser
Water pump
Sinter
products
Lightweight
brake discs
P
P
P
P
P
P
P
Vacuum pumps P
Engine
Transmission
Braking system
48
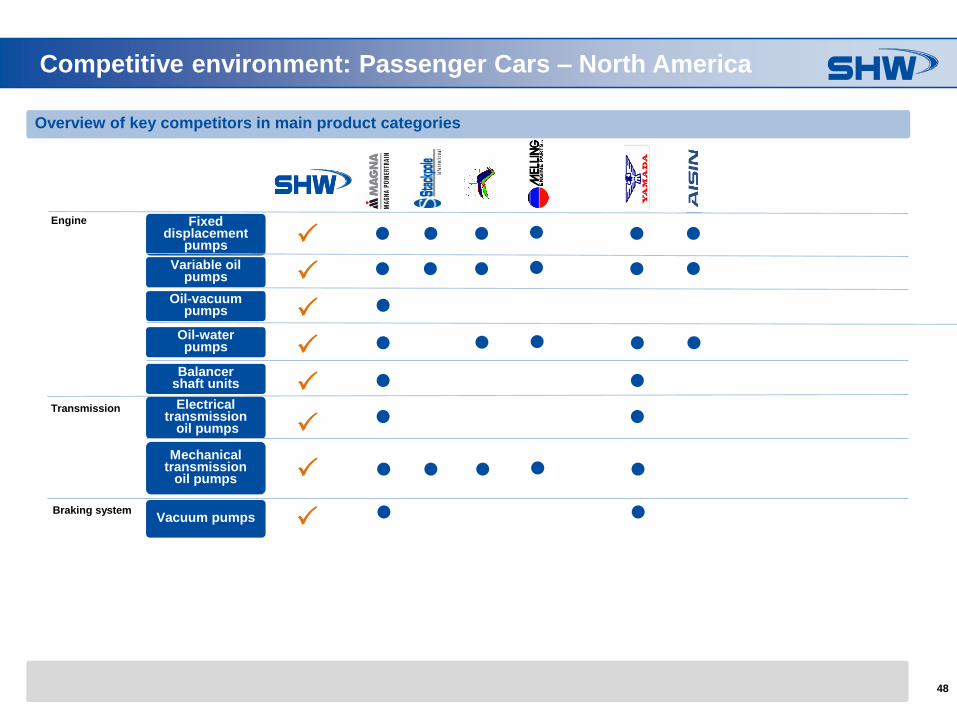
Competitive environment: Passenger Cars – North America
Overview of key competitors in main product categories
Fixed displacement
pumps
Variable oil pumps
Oil-vacuum pumps
Oil-water pumps
Balancer shaft units
Electrical transmission
oil pumps
Mechanical transmission
oil pumps
Sales (€m)
(Year)
290
(2010a)n/a n/a
4,693
(2009)n/a
213
(2009)
31
(2009)
12,117
(2009)
3,864
(2009)
312
(2009)
293
(2009)
150
(n/a)
26
(2008)
840
(2010e)n/a
826
(2009)n/a
405
(2009)
Variable oil
pump
Invariable oil
pump
Electrical oil
pump
Vacuum
pump
Balancer shaft
unit
Camshaft
phaser
Water pump
Sinter
products
Lightweight
brake discs
P
P
P
P
P
P
P
Vacuum pumps P
Engine
Transmission
Braking system
49
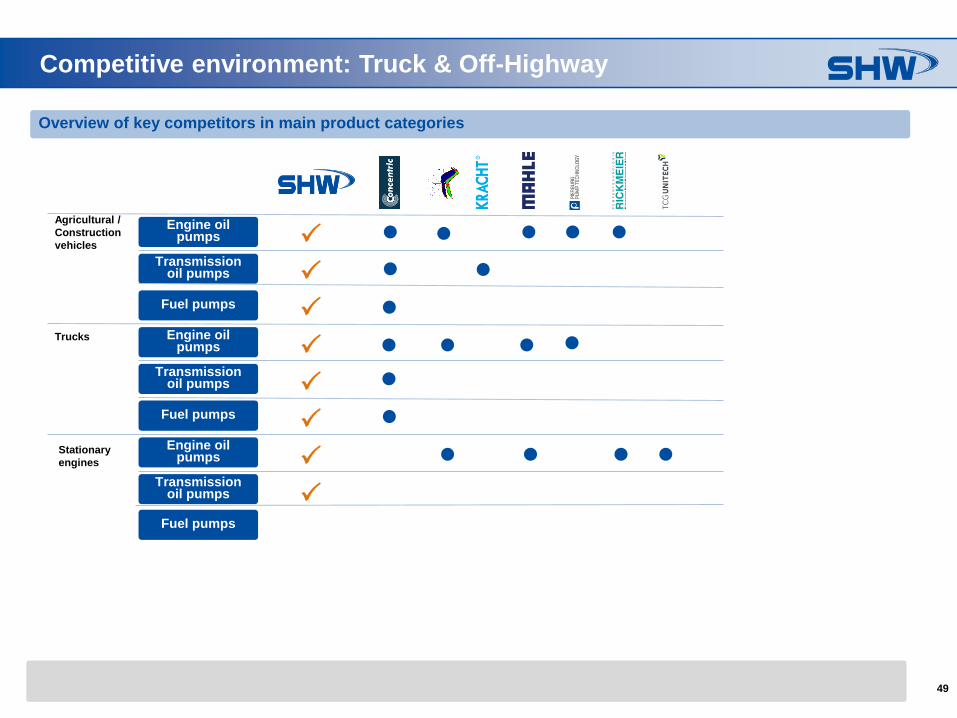
Competitive environment: Truck & Off-Highway
Overview of key competitors in main product categories
Engine oil pumps
Transmission oil pumps
Fuel pumps
Engine oil pumps
Transmission oil pumps
Fuel pumps
Engine oil pumps
Transmission oil pumps
Sales (€m)
(Year)
290
(2010a)n/a n/a
4,693
(2009)n/a
213
(2009)
31
(2009)
12,117
(2009)
3,864
(2009)
312
(2009)
293
(2009)
150
(n/a)
26
(2008)
840
(2010e)n/a
826
(2009)n/a
405
(2009)
Variable oil
pump
Invariable oil
pump
Electrical oil
pump
Vacuum
pump
Balancer shaft
unit
Camshaft
phaser
Water pump
Sinter
products
Lightweight
brake discs
P
P
P
P
P
P
P
Fuel pumps
Agricultural /
Construction
vehicles
Trucks
Stationary
engines
P
50
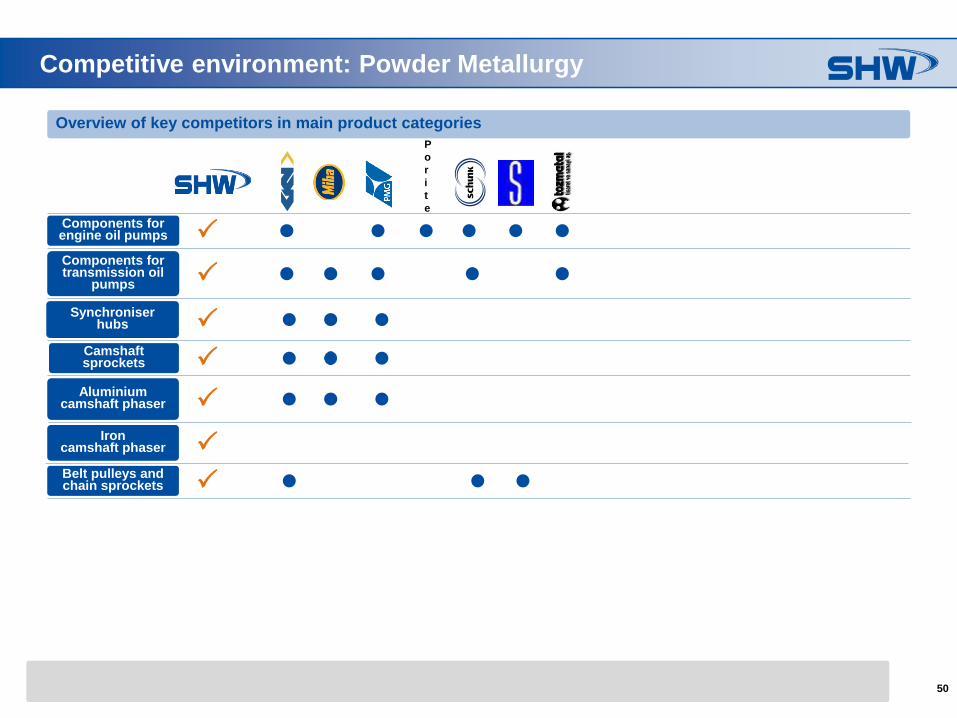
Competitive environment: Powder Metallurgy
Overview of key competitors in main product categories
Components for engine oil pumps
Components for transmission oil
pumps
Synchroniser hubs
Camshaftsprockets
Aluminium camshaft phaser
Iron camshaft phaser
Belt pulleys and chain sprockets
Sales (€m)
(Year)
290
(2010a)n/a n/a
4,693
(2009)n/a
213
(2009)
31
(2009)
12,117
(2009)
3,864
(2009)
312
(2009)
293
(2009)
150
(n/a)
26
(2008)
840
(2010e)n/a
826
(2009)n/a
405
(2009)
Variable oil
pump
Invariable oil
pump
Electrical oil
pump
Vacuum
pump
Balancer shaft
unit
Camshaft
phaser
Water pump
Sinter
products
Lightweight
brake discs
P
P
P
P
P
P
P
P
o
r
i
t
e
51
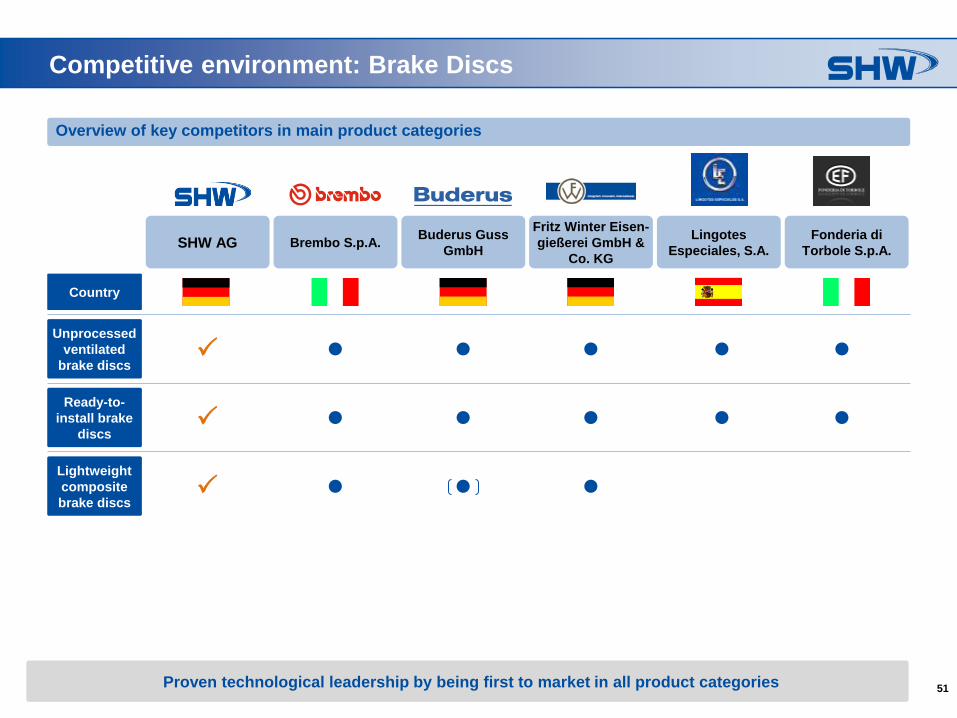
Competitive environment: Brake Discs
Overview of key competitors in main product categories
Proven technological leadership by being first to market in all product categories
P
P
P
Sale
s (€m
)
(Year)
290
(2010a)
n/a
n/a
4,6
93
(2009)
n/a
213
(2009)
31
(2009)
12,1
17
(2009)
3,8
64
(2009)
312
(2009)
293
(2009)
150
(n/a
)
26
(2008)
840
(2010e)
n/a
826
(2009)
n/a
405
(2009)
Varia
ble
oil
pum
p
Inva
riable
oil
pum
p
Ele
ctrical o
il
pum
p
Vacu
um
pum
p
Bala
nce
r shaft
unit
Cam
shaft
phase
r
Wate
r pum
p
Sin
ter
pro
ducts
Lig
htw
eig
ht
bra
ke d
iscs
Lightweight
composite
brake discs
Ready-to-
install brake
discs
Unprocessed
ventilated
brake discs
Country
SHW AG Brembo S.p.A.Buderus Guss
GmbH
Fritz Winter Eisen-
gießerei GmbH &
Co. KG
Lingotes
Especiales, S.A.
Fonderia di
Torbole S.p.A.
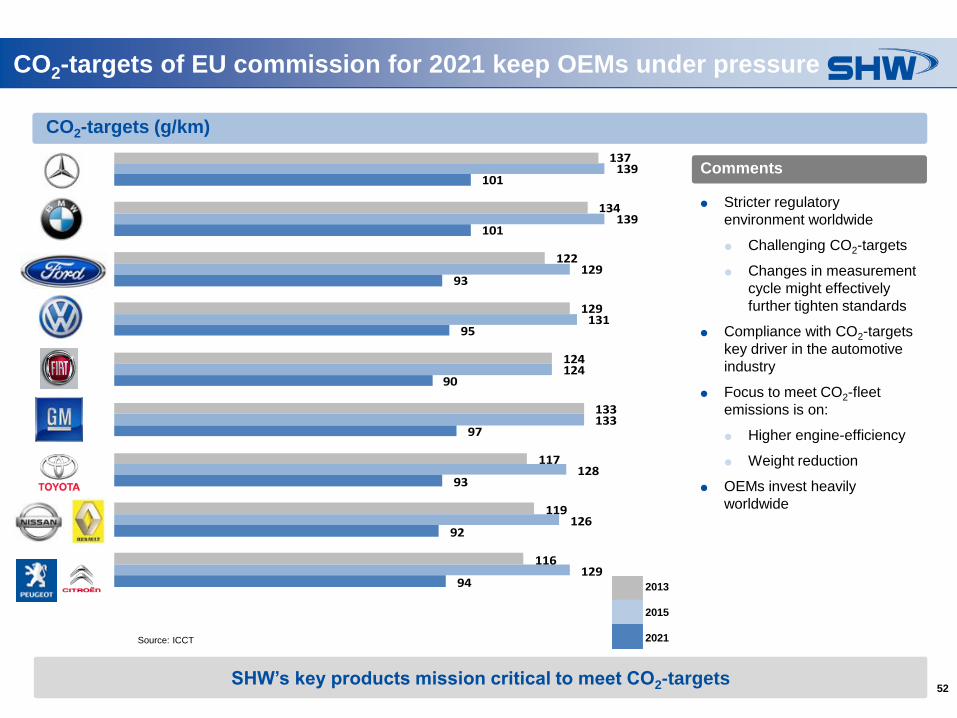
52SHW’s key products mission critical to meet CO2-targets
CO2-targets of EU commission for 2021 keep OEMs under pressure
CO2-targets (g/km)
Source: ICCT
2011
2015
2020
2013
2015
2021
137
134
122
129
124
133
117
119
116
139
139
129
131
124
133
128
126
129
101
101
93
95
90
97
93
92
94
Stricter regulatory
environment worldwide
Challenging CO2-targets
Changes in measurement
cycle might effectively
further tighten standards
Compliance with CO2-targets
key driver in the automotive
industry
Focus to meet CO2-fleet
emissions is on:
Higher engine-efficiency
Weight reduction
OEMs invest heavily
worldwide
Comments
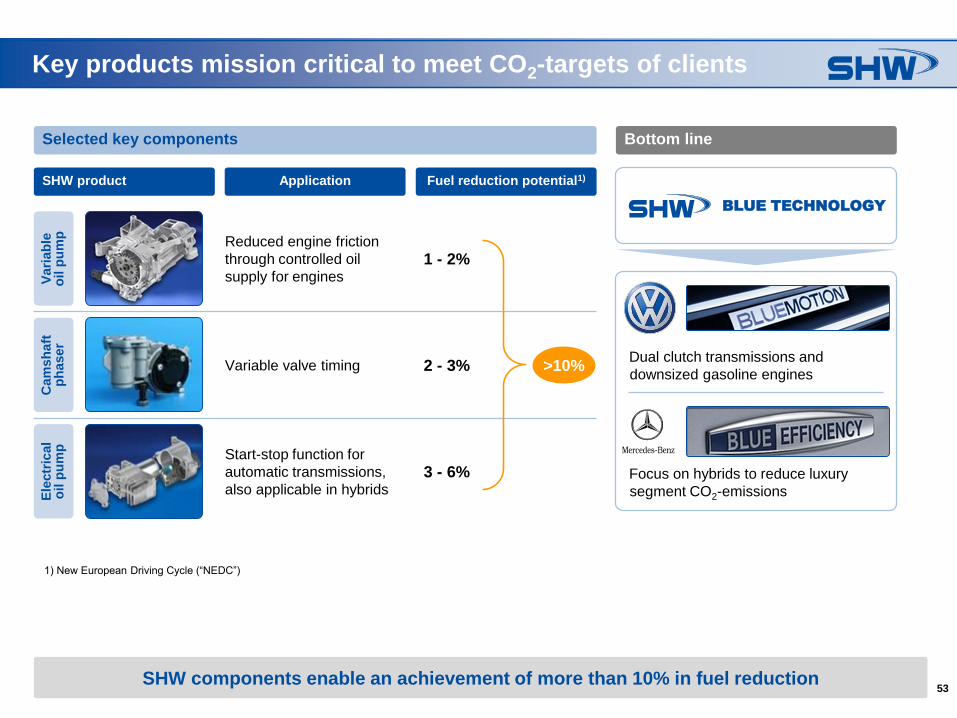
53SHW components enable an achievement of more than 10% in fuel reduction
Key products mission critical to meet CO2-targets of clients
Reduced engine friction
through controlled oil
supply for engines1 - 2%
Variable valve timing 2 - 3%
Start-stop function for
automatic transmissions,
also applicable in hybrids3 - 6%
Selected key components Bottom line
1) New European Driving Cycle (“NEDC”)
Vari
ab
le
oil p
um
p
Fuel reduction potential1)ApplicationSHW product
Cam
sh
aft
p
haser
Ele
ctr
ical
oil p
um
p
BLUE TECHNOLOGY
Focus on hybrids to reduce luxury
segment CO2-emissions
Dual clutch transmissions and
downsized gasoline engines>10%
54
Financials 2014
55
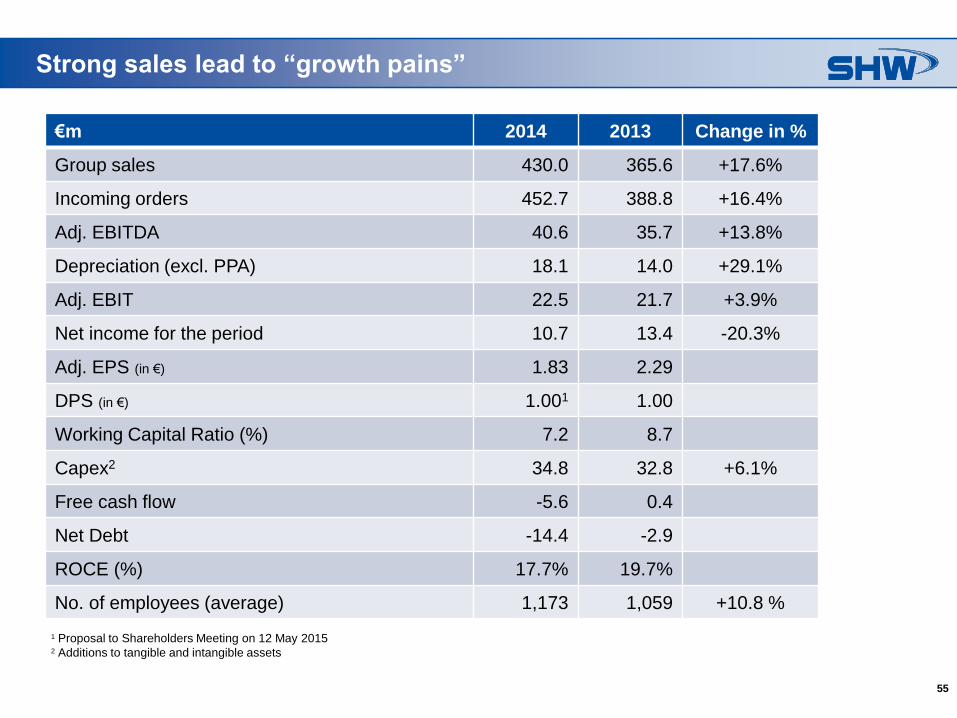
Strong sales lead to “growth pains”
€m 2014 2013 Change in %
Group sales 430.0 365.6 +17.6%
Incoming orders 452.7 388.8 +16.4%
Adj. EBITDA 40.6 35.7 +13.8%
Depreciation (excl. PPA) 18.1 14.0 +29.1%
Adj. EBIT 22.5 21.7 +3.9%
Net income for the period 10.7 13.4 -20.3%
Adj. EPS (in €) 1.83 2.29
DPS (in €) 1.001 1.00
Working Capital Ratio (%) 7.2 8.7
Capex2 34.8 32.8 +6.1%
Free cash flow -5.6 0.4
Net Debt -14.4 -2.9
ROCE (%) 17.7% 19.7%
No. of employees (average) 1,173 1,059 +10.8 %
1 Proposal to Shareholders Meeting on 12 May 20152 Additions to tangible and intangible assets
56
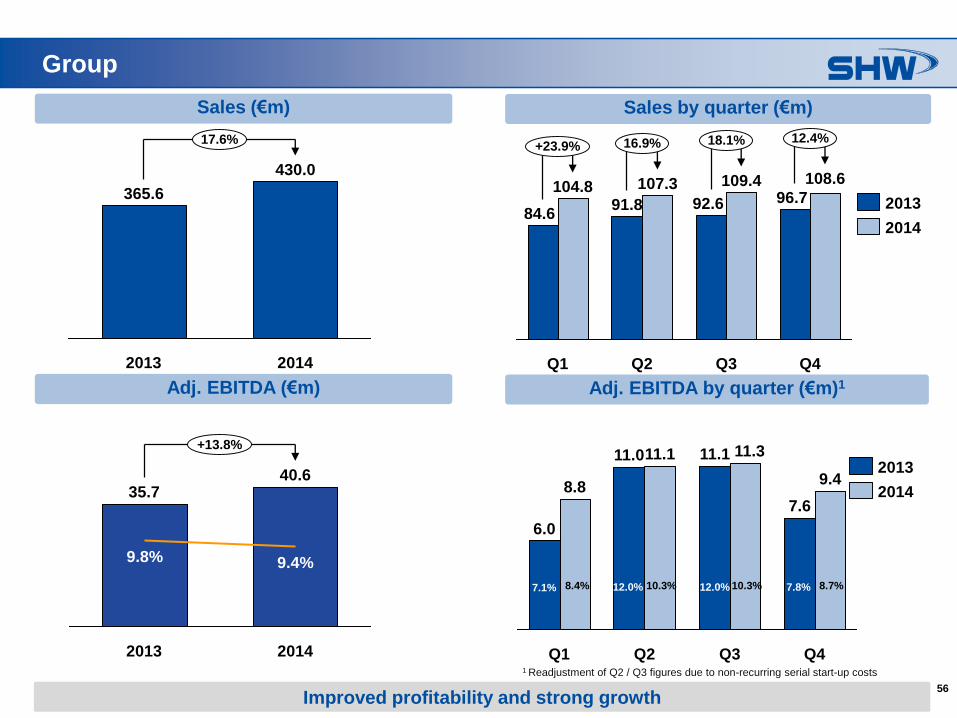
Group
Sales by quarter (€m)
12.4%18.1%16.9%+23.9%
Q4
108.6
96.7
Q3
109.4
92.6
Q2
107.3
91.8
Q1
104.8
84.62014
2013365.6
17.6%
430.0
2013 2014
Sales (€m)
Improved profitability and strong growth
Q1
11.111.0
6.0
Q2
8.89.4
7.6
Q3
11.1 11.3
Q4
2014
2013
Adj. EBITDA (€m) Adj. EBITDA by quarter (€m)1
7.1% 8.4% 12.0% 10.3% 12.0% 10.3% 7.8%
1 Readjustment of Q2 / Q3 figures due to non-recurring serial start-up costs
8.7%
2014
40.635.7
9.8%
2013
+13.8%
9.4%
57
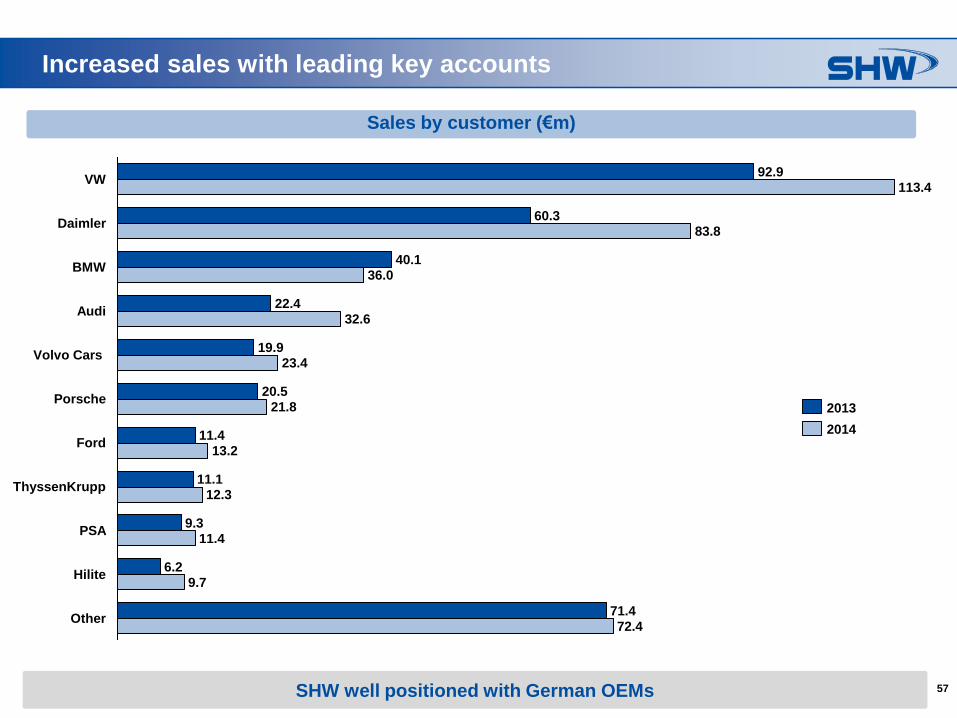
Increased sales with leading key accounts
14.7
1.9
14.7
2.2
14.7 17.5
2.3
2.2
14.7 17.5
2.3
ThyssenKrupp11.1
Ford11.4
Audi22.4
BMW40.1
Daimler60.3
VW92.9
19.9Volvo Cars
72.4
PSA
32.6
23.4
12.3
6.2Hilite
Other71.4
36.0
13.2
83.8
9.7
113.4
11.49.3
Porsche21.8
20.5
2013
2014
Sales by customer (€m)
SHW well positioned with German OEMs
58
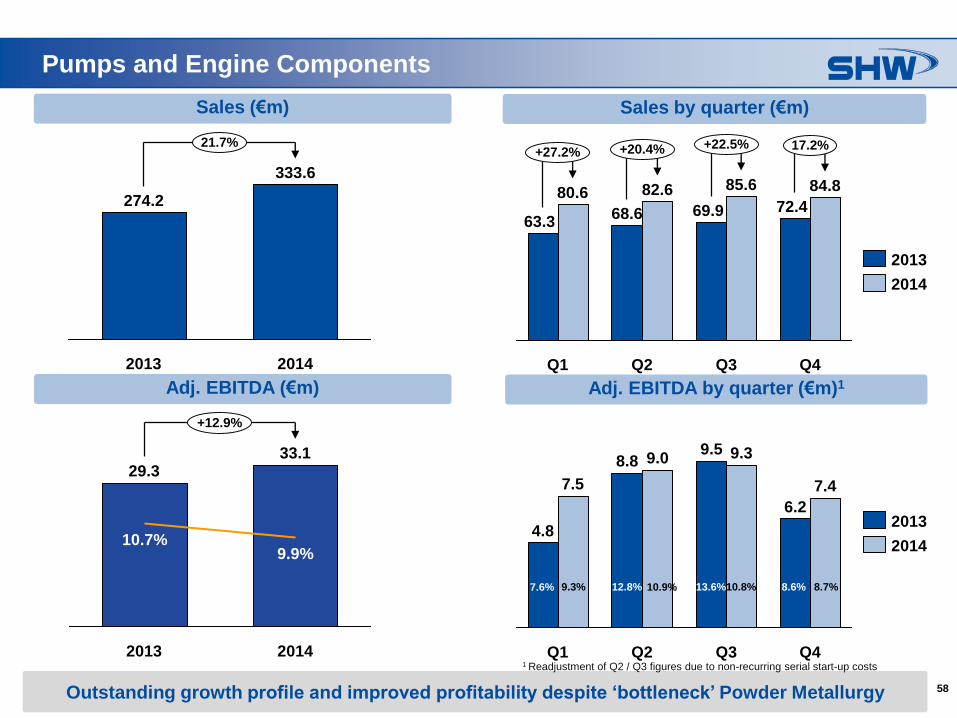
Pumps and Engine Components
Sales by quarter (€m)
+20.4%
72.4
Q4
+22.5%
68.6
Q2
+27.2%
80.669.9
Q3
17.2%
84.8
Q1
63.3
85.682.6
2013
2014
Sales (€m)
Q1
7.5
8.89.5
4.8
Q2
9.0
7.4
6.2
Q4
9.3
Q3
2014
2013
Adj. EBITDA (€m) Adj. EBITDA by quarter (€m)1
2014
33.129.3
10.7%
2013
+12.9%
9.9%
274.2
2013
21.7%
333.6
2014
7.6% 9.3% 12.8% 10.9% 13.6%10.8% 8.6% 8.7%
Outstanding growth profile and improved profitability despite ‘bottleneck’ Powder Metallurgy
1 Readjustment of Q2 / Q3 figures due to non-recurring serial start-up costs
59
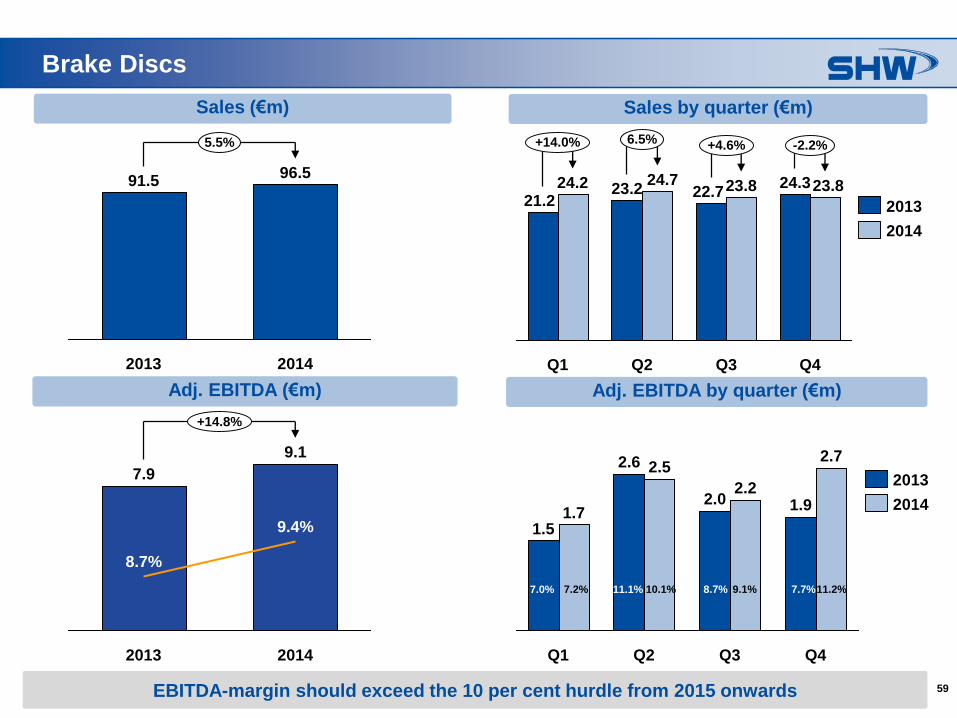
Brake Discs
Sales by quarter (€m)
23.8 24.3
Q3
22.7
-2.2%
21.224.2
Q1
23.2
Q2
24.7
+4.6%6.5%+14.0%
Q4
23.8
Sales (€m)
Q3
2.22.0
Q2
2.5
1.9
2.7
Q4
1.51.7
Q1
2.6
Adj. EBITDA (€m) Adj. EBITDA by quarter (€m)
2013
2014
2014
2013
9.1
2013
7.9
8.7%
9.4%
2014
+14.8%
96.5
5.5%
2014
91.5
2013
7.0% 7.2% 11.1% 10.1% 8.7% 9.1% 7.7%11.2%
EBITDA-margin should exceed the 10 per cent hurdle from 2015 onwards
60
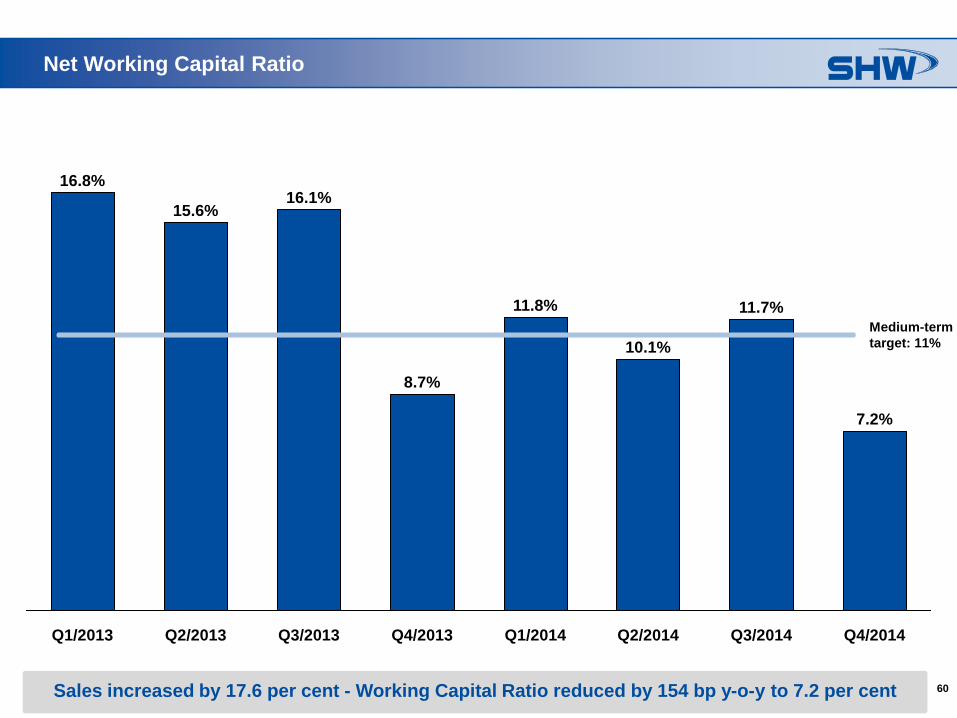
Net Working Capital Ratio
Medium-term
target: 11%
Q1/2014
11.8%
Q4/2013
8.7%
Q3/2013
16.1%
Q2/2014 Q3/2014
11.7%
10.1%
Q2/2013
15.6%
Q1/2013
16.8%
Q4/2014
7.2%
Sales increased by 17.6 per cent - Working Capital Ratio reduced by 154 bp y-o-y to 7.2 per cent
61
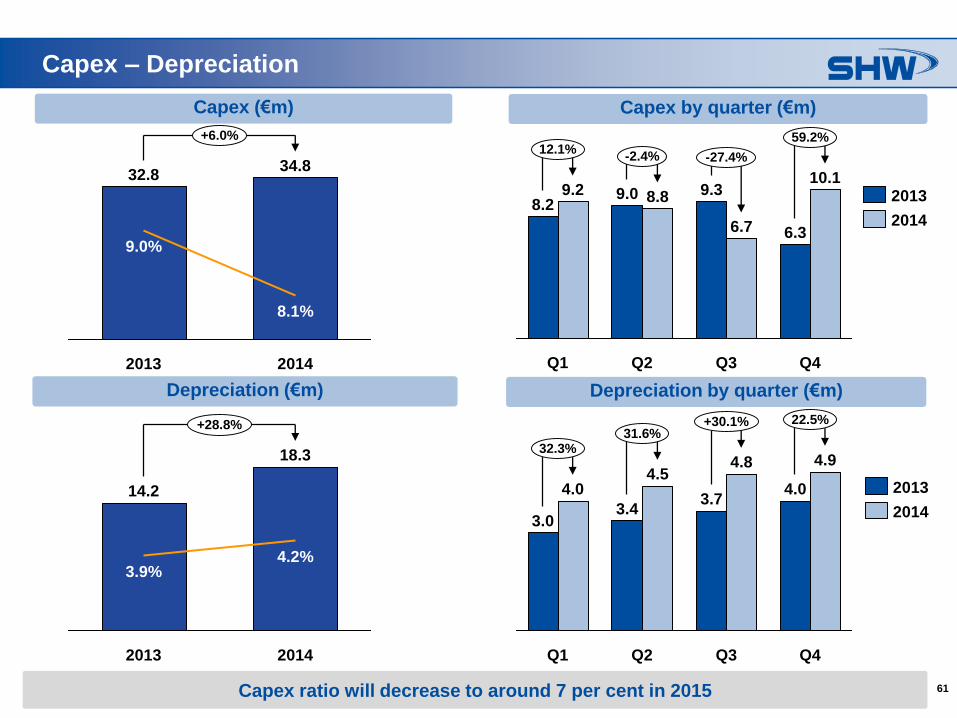
Capex – Depreciation
14.714.7
Capex by quarter (€m)
Q4
10.1
6.3
Q3
6.7
9.3
Q2
8.89.0
Q1
9.28.2
59.2%
-27.4%-2.4%12.1%
2014
2013
Capex (€m)
31.6%32.3%
Q4
4.0
Q3
4.8
22.5%+30.1%
4.9
3.7
Q2
4.5
3.4
Q1
4.0
3.0
Depreciation (€m) Depreciation by quarter (€m)
2014
2013
2013
32.8
9.0%
+6.0%
2014
34.8
8.1%
18.3
4.2%
2013
+28.8%
2014
14.2
3.9%
Capex ratio will decrease to around 7 per cent in 2015
62
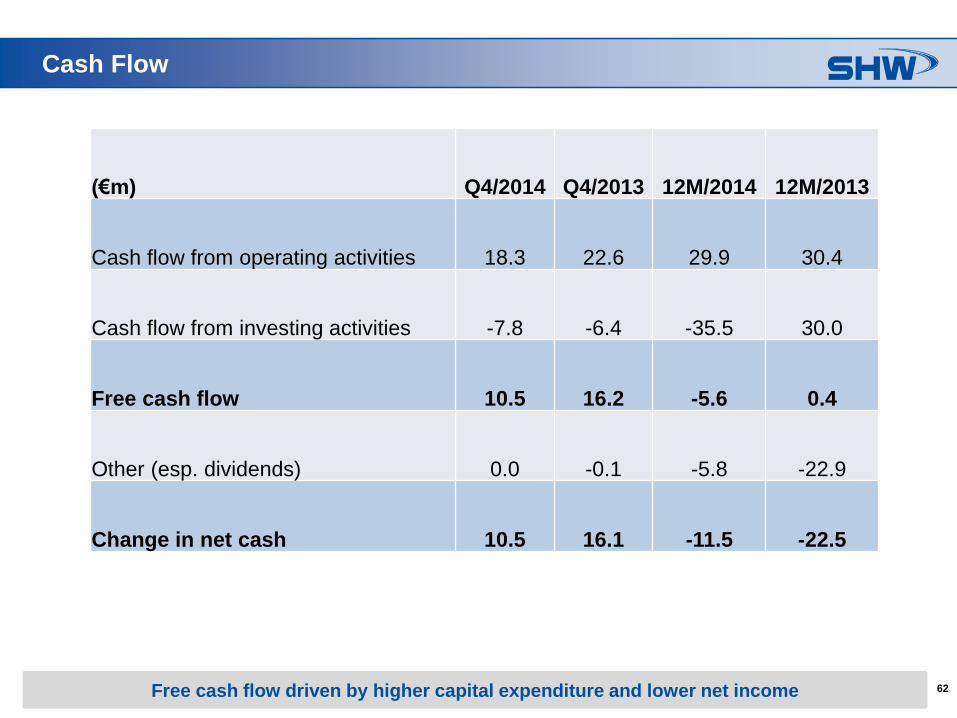
Cash Flow
5.
(€m) Q4/2014 Q4/2013 12M/2014 12M/2013
Cash flow from operating activities 18.3 22.6 29.9 30.4
Cash flow from investing activities -7.8 -6.4 -35.5 30.0
Free cash flow 10.5 16.2 -5.6 0.4
Other (esp. dividends) 0.0 -0.1 -5.8 -22.9
Change in net cash 10.5 16.1 -11.5 -22.5
Free cash flow driven by higher capital expenditure and lower net income
63
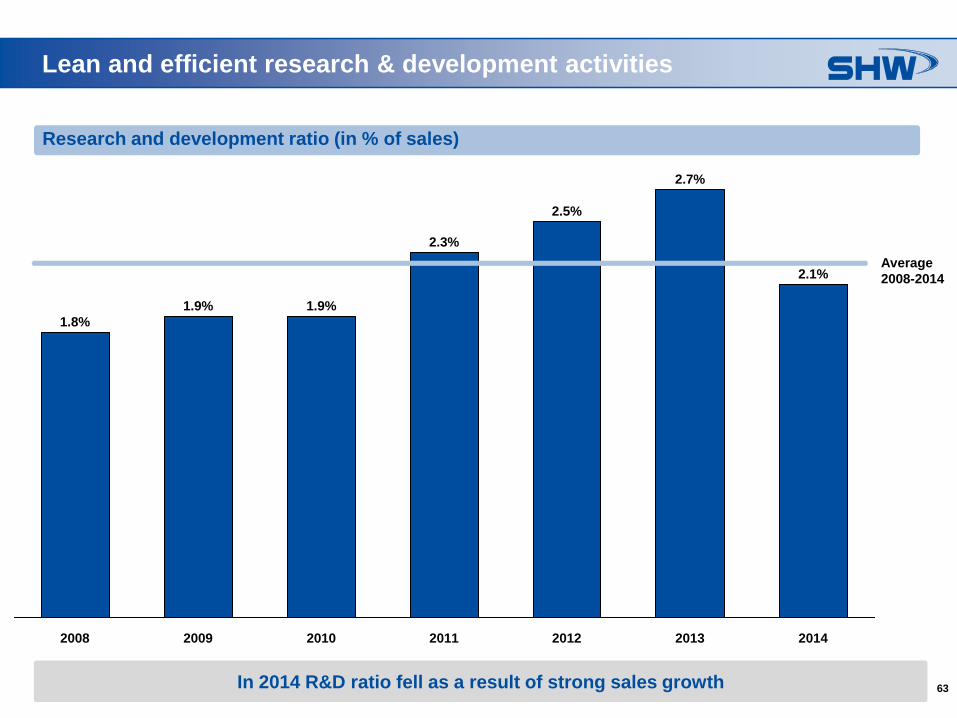
Lean and efficient research & development activities
2014
2.1%
2013
2.7%
2012
2.5%
2011
2.3%
2010
1.8%
2008
1.9%
2009
1.9%
Research and development ratio (in % of sales)
Average
2008-2014
In 2014 R&D ratio fell as a result of strong sales growth
64
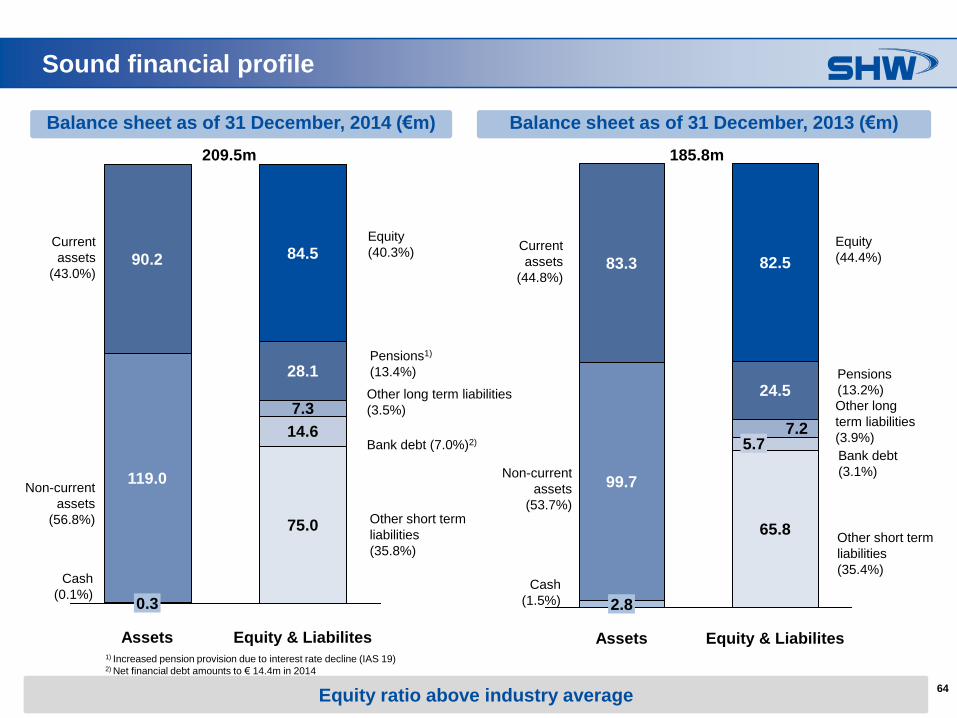
Sound financial profile
Balance sheet as of 31 December, 2014 (€m) Balance sheet as of 31 December, 2013 (€m)
Other short term
liabilities
(35.8%)
Pensions1)
(13.4%)
Current
assets
(43.0%)
Non-current
assets
(56.8%)
Equity
(40.3%)
37.9
209.5m
Equity & Liabilites
75.0
14.6
7.3
28.1
84.5
Assets
0.3
119.0
90.2
Cash
(0.1%)
Other short term
liabilities
(35.4%)
Pensions
(13.2%)
Current
assets
(44.8%)
Non-current
assets
(53.7%)
Equity
(44.4%)
37.9
185.8m
Equity & Liabilites
65.8
5.77.2
24.5
82.5
Assets
2.8
99.7
83.3
Other long
term liabilities
(3.9%)
Cash
(1.5%)
Other long term liabilities
(3.5%)
Bank debt (7.0%)2)
Bank debt
(3.1%)
Equity ratio above industry average
1) Increased pension provision due to interest rate decline (IAS 19)2) Net financial debt amounts to € 14.4m in 2014
65
Disclaimer
No offer or investment recommendation
This document, which has been issued by SHW AG (the “Company” or “SHW”), does not constitute an offer to sell, or the solicitation of an offer to subscribe for or
buy, any shares in the Company, nor shall it or any part of it nor the fact of its distribution form the basis of, or be relied on in connection with, any contract or
investment decision in relation thereto.
The contents of this presentation are may not be reproduced, redistributed or passed on, directly or indirectly, to any other person or published, in whole or in part,
for any purpose. Neither the Company nor any other party is under any duty to update or inform you of any changes to such information. In particular, it should be
noted that financial information relating to the Company contained in this document has not been audited and in some cases is based on management information
and estimates.
This material is given in conjunction with an oral presentation and should not be taken out of context.
Certain market data and financial and other figures (including percentages) in this document were rounded in accordance with commercial principles. Figures
rounded may not in all cases add up to the stated totals or the statements made in the underlying sources. For the calculation of percentages used in the text, the
actual figures, rather than the commercially rounded figures, were used. Accordingly, in some cases, the percentages provided in the text may deviate from
percentages based on rounded figures.
Future Oriented Statements
Certain statements in this presentation are forward-looking statements. By their nature, forward-looking statements involve a number of risks, uncertainties and
assumptions that could cause actual results or events to differ materially from those expressed or implied by the forward‐looking statements. These risks,
uncertainties and assumptions could adversely affect the outcome and financial consequences of the plans and events described herein.
No obligation to update the information
The Company does not undertake any obligation to update or revise any forward-looking statements, whether as a result of new information, future events or
otherwise, except as otherwise required by applicable laws and regulations. You should not place undue reliance on forward-looking statements, which speak as
only of the date of this presentation. Statements contained in this presentation regarding past trends or events should not be taken as a representation that such
trends or events will continue in the future.