investigation of soil amendments for use in golf …
TRANSCRIPT

INVESTIGATION OF SOIL AMENDMENTS FOR USE IN GOLF COURSE
PUTTING GREEN CONSTRUCTION
By
TRAVIS SHADDOX
A DISSERTATION PRESENTED TO THE GRADUATE SCHOOL OF THE UNIVERSITY OF FLORIDA IN PARTIAL FULFILLMENT
OF THE REQUIREMENTS FOR THE DEGREE OF DOCTOR OF PHILOSOPHY
UNIVERSITY OF FLORIDA
2004

Copyright 2004
by
Travis Shaddox

ACKNOWLEDGMENTS I give my sincere thanks and appreciation to the chairman of my supervisory
committee, Dr. Jerry Sartain. Without the opportunity and his support, achieving this
degree would not have been possible. I would also like to thank the other members of my
committee: Dr. James Bonczek for his expertise in surfactant chemistry, Dr. Donald
Graetz for his knowledge of soils and nitrogen transformations, Dr. Grady Miller for his
help in the area of turfgrass and soil amendments, and Dr. Peter Nkedi-Kizza for his
support during my leaching experiments.
Thanks go to the Florida Turf Grass Association who sponsored this research
project. I appreciate its continued support of turfgrass research at the University of
Florida. Special thanks go to lab personnel, Ed Hopwood Jr., Nahid Varshovi, Shawron
Weingarten, Martin Sandquist, and Brian Owens, who helped me throughout my
research. Finally, I would like to thank all the members of my family in Oklahoma and
in Florida for their ongoing support.
iii
TABLE OF CONTENTS page ACKNOWLEDGMENTS ................................................................................................. iii
LIST OF TABLES............................................................................................................ vii
LIST OF FIGURES ........................................................................................................... ix
ABSTRACT....................................................................................................................... xi
CHAPTER
1 INTRODUCTION ........................................................................................................1
Water Use Efficiency....................................................................................................1 Nutrient Leaching .........................................................................................................3
2 LITERATURE REVIEW .............................................................................................5
Soil Amendments..........................................................................................................5 Peats.......................................................................................................................6 Calcined Clays.......................................................................................................9 Zeolites ................................................................................................................11 Diatomaceous Earths ...........................................................................................14 Water Treatment Residuals .................................................................................16
Water-Use-Efficiency .................................................................................................17 Nitrogen in the Turfgrass Environment......................................................................19
N Transformations in Soil ...................................................................................20 Leached N............................................................................................................22
Phosphorous in the Turfgrass Environment ...............................................................23 P Reactions in Soil...............................................................................................23 Leached P ............................................................................................................23
Hexadecyltrimethyammonium ...................................................................................25 Bi-layer Formation ..............................................................................................26 Anion Sorption ....................................................................................................27 Stability................................................................................................................28
iv

3 MATERIALS AND METHODS ...............................................................................30
Characterization Studies .............................................................................................30 Cation Exchange Capacity ..................................................................................30 Moisture Retention ..............................................................................................30 Sorption Isotherms...............................................................................................31 Surfactant Loading ..............................................................................................32 Thermal Analysis.................................................................................................32 X-Ray Diffraction................................................................................................34 Nutrient Analysis.................................................................................................34
Sand Mixes .................................................................................................................34 Water Use Efficiency Calculations.............................................................................36 Glasshouse Studies .....................................................................................................36
Year 1 ..................................................................................................................36 Year 2 ..................................................................................................................38
Nutrient Leaching Study.............................................................................................40
4 RESULTS AND DISCUSSION.................................................................................45
Amendment Characterizations....................................................................................45 Surfactant Sorption..............................................................................................45 Mineral Composition...........................................................................................46 Nutrient Composition ..........................................................................................46
Nitrogen........................................................................................................47 Phosphorus ...................................................................................................47 Potassium .....................................................................................................50 Calcium ........................................................................................................50 pH and EC ....................................................................................................51
Moisture Retention ..............................................................................................51 Glasshouse 2002 .........................................................................................................59
Establishment ......................................................................................................59 Turf Quality .........................................................................................................61 Water Use Efficiency ..........................................................................................63
Glasshouse 2003 .........................................................................................................65 Establishment ......................................................................................................65 Turf Quality .........................................................................................................67 Days to Wilt.........................................................................................................73 Water Use Efficiency ..........................................................................................74
Nutrient Leaching Study.............................................................................................80 Nitrate ..................................................................................................................80 Ammonium..........................................................................................................84 Phosphorus ..........................................................................................................88
5 CONCLUSIONS ........................................................................................................92
Soil Amendments........................................................................................................92 Incorporation Method .................................................................................................92
v

Nutrient Leaching .......................................................................................................93
APPENDIX MISCELLANEOUS TABLES AND GRAPHS...........................................95
LIST OF REFERENCES.................................................................................................113
BIOGRAPHICAL SKETCH ...........................................................................................123
vi

LIST OF TABLES
Table page 3-1 Sand size analysis of amendments and sand mixes..................................................35
4-1 Ion exchange capacity and surfactant sorption as influenced by soil amendment...46
4-2 Chemical properties of amendments used in glasshouse and field studies. .............48
4-3 Chemical properties of 85:15 sand/amendment mixtures used in glasshouse and field studies. .............................................................................................................49
4-4 Physical analysis of amendment/sand mixture at 85:15 by volume.........................53
4-5 Visual quality rating of bermudagrass as influenced by 85:15 sand/amendment rootzone during 2002 glasshouse study. ..................................................................62
4-6 Tissue yield, applied water, and water-use-efficiency of Tifdwarf bermudagrass as influenced by soil amendments during glasshouse 2002 study. ..........................64
4-7 Analysis of variance of mean squares on turf quality during 2003 study as influenced by incorporation method and amendment type. .....................................68
4-8 Visual quality rating of bermudagrass as influenced by 85:15 sand/amendment rootzone during 2003 glasshouse study. ..................................................................69
4-9 Visual quality rating of Tifdwarf bermudagrass as influenced by 4 tine aerification during 2003 glasshouse study. ..............................................................71
4-10 Visual quality rating of Tifdwarf bermudagrass as influenced by 9 tine aerification during 2003 glasshouse study. ..............................................................72
4-11 Analysis of variance of mean squares on Tifdwarf days to wilt during 2003 study as influenced by incorporation method and amendment type. .......................73
4-12 Days to wilt of Tifdwarf bermudagrass as influenced by 85:15 sand/amendment rootzone during 2003 glasshouse study. ..................................................................74
4-13 Analysis of variance of mean squares on Tifdwarf water use efficiency during 2003 study as influenced by incorporation method and amendment type. ..............75
vii
4-14 Tissue yield, applied water, and water-use-efficiency of Tifdwarf bermudagrass as influenced by fully incorporated soil amendments during glasshouse 2003 study. ........................................................................................................................76
4-15 Tissue yield, applied water, and water-use-efficiency of Tifdwarf bermudagrass as influenced by soil amendments after 9 tine aerification during glasshouse 2003 study. ........................................................................................................................77
4-16 Tissue yield, applied water, and water-use-efficiency of Tifdwarf bermudagrass as influenced by soil amendments after 4 tine aerification during glasshouse 2003 study. ........................................................................................................................79
4-17 Water use efficiency of Tifdwarf bermudagrass as influenced by incorporation method. .....................................................................................................................80
4-18 Total NO3-N leached as influenced by filter zone media.........................................83
4-18 Total NH4-N leached as influenced by filter zone media.........................................87
4-19 Total phosphorous leached as influenced by filter zone media................................90
A-1 Chemical properties of irrigation water used in glasshouse and field studies. ......103
A-2 Phosphorous and ammonium leaching parameters for the 2-site model................112
viii

LIST OF FIGURES
Figure page 2-1 The nitrogen cycle ....................................................................................................21
2-2 The P cycle. ..............................................................................................................24
2-3 Hexadecyltrimethylammonium. ...............................................................................26
2-4 Schematic of HDTMA bi-layer formation. ..............................................................26
3-1 Schematic diagram of pot set-up used in glasshouse studies showing side and top view of amendment incorporation methods where A = 85:15 sand/amendment, B = 4 tine aerification with 50:50 sand/amendment, and C = 9 tine aerification with 50:50 sand amendment.............................................................................................39
3-2 Schematic diagram of lysimeter set-up used in leaching studies. ............................41
4-1 Moisture release curve for USGA sand amended with zeolites at 85:15 by volume. .....................................................................................................................54
4-2 Moisture release curve for USGA sand amended with diatomaceous earths at 85:15 by volume.......................................................................................................55
4-3 Moisture release curve for USGA sand amended with calcined clays at 85:15 by volume. .....................................................................................................................56
4-4 Moisture release curve for USGA sand amended with peat or Fe-Humate at 85:15 by volume or with smectite at 97.5:2.5 by volume. .......................................58
4-5 Establishment of Tifdwarf bermudagrass during summer 2002 as influenced by (A.) zeolites, (B.) diatomaceous earths, (C.) clay and organics, and (D.) calcined clays. Vertical bars denote standard error. ..............................................................60
4-6 Establishment of Tifdwarf bermudagrass during summer 2003 as influenced by (A.) zeolite, (B.) diatomaceous earths, (C.) clay and organics, and (D.) calcined clays. Vertical bars denote standard error. ..............................................................66
4-7 Nitrate breakthrough curves as influenced by filter zone media..............................81
4-8 Ammonium breakthrough curves as influenced by filter zone media......................85
ix

4-9 Phosphorus breakthrough curves as influenced filter zone media. ..........................89
A-1 Thermal gravimetry analysis of HDTMA................................................................96
A-2 Thermal gravimetry analysis of HDTMA coated calcined clay 1............................97
A-3 Thermal gravimetry analysis of HDTMA coated calcined clay 2............................98
A-4 Thermal gravimetry analysis of HDTMA coated clinoptilolite. ..............................99
A-5 X-ray diffractogram of diatomaceous earths in a side-packed powder mount. .....100
A-6 X-Ray diffractogram of calcined clays in a side-packed powder mount. ..............101
A-7 X-Ray diffractogram of zeolites in a side-packed powder mount. ........................102
A-8 Correlation between microporosity and plant available water of amendment/sand mixture at 85:15 by volume. ......................................................104
A-9 Nitrate sorption isotherm for surfactant-modified soil amendments......................105
A-10 Ammonium sorption isotherm for uncoated and HDTMA coated calcined clay 1.106
A-11 Ammonium sorption isotherm for uncoated and HDTMA coated calcined clay 2.107
A-12 Ammonium sorption isotherm for uncoated and HDTMA coated clinoptilolite. ..108
A-13 Phosporus sorption isotherm for uncoated and HDTMA coated calcined clay 1. .109
A-14 Phosphorus sorption isotherm for uncoated and HDTMA coated calcined clay 2.110
A-15 Phosporus sorption isotherm for uncoated and HDTMA coated clinoptilolite......111
x

Abstract of Dissertation Presented to the Graduate School of the University of Florida in Partial Fulfillment of the Requirements for the Degree of Doctor of Philosophy
INVESTIGATION OF SOIL AMENDMENTS FOR USE IN GOLF COURSE PUTTING GREEN CONSTRUCTION
By
Travis W. Shaddox
December 2004
Chair: Jerry Sartain Major Department: Soil and Water Science
Turfgrass, like all livings organisms, requires water for survival. Turfgrass
professionals, such as golf course superintendents, sports, and athletic field managers
often have a limited amount of water they can use due to consumptive use permits levied
by regional regulatory agencies. Therefore, they are required to find alternate means of
maintaining quality turf while using less water. Many turf professionals enlist the use of
soil amendments because of their ability to increase moisture and nutrient availability.
However, whether or not soil amendments actually influence the efficient use of water by
turfgrass is not known. An objective of this research was to determine the influence of
soil amendments and incorporation method of those amendments on water-use-efficiency
(WUE) of Tifdwarf bermudagrass [Cynodon dactylon (L.) Pers. × C. transvaalensis Burtt
Davy]. A further objective was to determine the influence of surfactant-modified soil
amendments (SMSAs) on nitrogen (N) and phosphorus (P) leaching. To determine the
influence of amendments on turfgrass WUE, Tifdwarf bermudagrass was established on
xi

pots in a glasshouse at the University of Florida turfgrass Envirotron. Treatments
consisted of sand, two zeolites, two calcined clays, two diatomaceous earths, Canadian
sphagnum peat, iron humate, and a smectite. Treatments were arranged in a randomized
complete block design with four replications. Pots were weighed, harvested, and rated
weekly for turf quality for twelve weeks. To determine the influence of SMSAs on N
and P leaching, soil columns were fabricated from 2.54 cm diam. polyvinyl chloride
tubes. Each column was packed with a rootzone layer (30 cm) consisting of sand/peat
(85:15) and a filter zone layer (5 cm) containing each treatment. Treatments were sand,
zeolite, and two calcined clays. Treatments either remained unchanged or were
surfactant-coated. Three replications were used for statistical analysis. In the glasshouse
study, incorporation of iron humate increased turf yield, quality, and WUE above all
other amendment regardless of incorporation method. This was attributed to an increase
in N, Ca, and Fe availability as well as a 13% increase in plant available water which
accompanied iron humate incorporation. Rootzone amended with calcined clays (CCs)
produced 40% more dry matter yield and increased WUE 30% above sand/peat.
However, calcined clays did not produce quality or WUE ratings above iron humate.
Sand and zeolite produced quality and WUE ratings equal to that of sand/peat mixtures.
Of the amendment investigated in this study, only iron humate and CCs consistently
produced quality and WUE ratings above that of sand/peat rootzones. Incorporation of
amendments following aerification reduced each amendment’s influence on yield,
quality, and WUE. Therefore, in order to maximize amendment influences on turf
quality and WUE, amendment should be fully incorporated into the rootzone. Surfactant-
modified amendments reduced NO3 levels in leachate to 0.0%, reduced NH4 to 4%, and
xii

reduced P levels to 3% of that applied. Unmodified amendments had no influence on
NO3 leached, reduced NH4 leaching, and retarded P leaching. Surfactant-modified
amendments may be a plausible option to reduce N and P leaching in USGA putting
greens.
xiii
CHAPTER 1 INTRODUCTION
Soil modification has been used for centuries to alter certain soil properties to
improve soil-plant relationships. Generally, this is achieved via the use of soil
amendments. Soil amendments may be organic or inorganic and are primarily used to
increase plant available water, cation exchange capacity, or nutrient availability.
However, ambiguity remains regarding their indirect influence on plant water use.
Furthermore, nutrient additions may lead to leaching which can cause a variety of
environmental problems. Compounding the situation, some amendments have the
capacity to retain potential contaminants while others may enhance leaching. Therefore,
this study investigates two primary influences of soil amendment incorporation: turfgrass
water-use-efficiency and nutrient retention in USGA putting greens.
Water Use Efficiency
Every living organism on earth is dependent upon water for survival. In plants,
water is the solvent in which vital nutrients are translocated to various plant parts. Water
is also the initial proton donor during the first steps of photosynthesis. Thus, without
water plants could not survive. Fortunately, the earth contains vast amounts of water in
oceans, lakes, rivers, and in the atmosphere. However, only 0.6% of all water on earth is
considered to be usable by plants and animals (Nace, 1967). With such a small portion of
usable water and such a large number of organisms requiring water, demand for water is
high.
1

2
Water used for recreational purposes is often scrutinized because it is not
considered essential to sustain life. Turfgrass water use is receiving attention due to the
overall quantity of water required to maintain acceptable quality turf. This attention has
prompted regional regulatory agencies to impose consumptive use permits on many golf
courses in many states including Florida. Superintendents are now faced with having to
maintain an acceptable quality turf while using less water. To become more efficient at
using water they are allotted, superintendents sometimes use soil amendments to alleviate
the inherent low water retention capacity of United States Golf Association (USGA)
putting greens.
Numerous soil amendments are commercially available in at least four distinctly
different classes. This study compared different soil amendments (organic, zeolite,
calcined clay, and diatomaceous earth) to identify materials capable of maximizing
water-use-efficiency (WUE) of Tifdwarf bermudagrass. Published reports reveal many
researchers have investigated the influence of soil amendments on turf establishment, soil
compaction and aeration, soil hydraulic properties, and turfgrass response (Biran et al.,
1981; Miller, 2000; McCoy 1992; Nus and Brauen 1991). Other studies have
investigated WUE of grass species as well as how WUE is influenced by fertilization
(Frank et al., 1987; Hatfield et al. 2001). However, studies to determine the influence of
different rootzone media on WUE of turfgrass are limited. A series of glasshouse and
field experiments were conducted in Gainesville, Florida, from 2001 to 2004 to
investigate WUE of Tifdwarf bermudagrass as influenced by soil amendments.
The objectives of this study were (1) to determine the influence of various soil
amendments (peat, Fe-humate, calcined clay, diatomaceous earth, zeolite, and smectite)

3
on WUE and quality Tifdwarf bermudagrass in a USGA putting green; (2) to determine
the influence of soil amendment incorporation method on WUE and quality of Tifdwarf
bermudagrass in a USGA putting green.
Nutrient Leaching
For many agronomically important crops, nitrogen (N) and phosphorous (P) are the
two most limiting nutrients. As such, they are typically applied via fertilizers in greater
quantities than many other nutrients. Most fertilizer applied N is in the form of nitrate
(NO3-) or is rapidly converted to nitrate via nitrification. Most fertilizer applied P is in
the form of phosphate (H2PO4-). Being anions, both nitrate and phosphate are susceptible
to leaching, the consequences of which are seen in the excessive algae growth in lakes
and the elevated levels of P currently being detected in estuaries and in Everglades
National Park (Malecki et al., 2004; White and Reddy, 2004). For this reason, N and P
applied to agronomic crops and turfgrass has been closely monitored. Golf courses are
often scrutinized due to their cultural practices and the unique fertilizer requirement of
turfgrass, which often demand higher fertilizer application rates than many agronomic
crops (Sartain, unpublished data, 1996).
This scrutiny has brought about best management practices (BMP), which allow a
turfgrass manager to minimize environmental impact while still being able to maintain a
quality playing surface. Generally, these practices include the use of controlled-released
fertilizers as well as the proper timing and rate of application. A number of studies have
shown the BMPs have been beneficial at reducing the potential impact golf courses have
on the environment (Rodriquez and Miller, 2000; Sartain and Gooding, 2000; Snyder et
al., 1984). However, leaching of N and P does still occur during unique periods such as
turf establishment or excessive rain events. During periods of high rainfall, leached N
4
can be as much as ten times higher as during normal rainfall periods (Morton et al.,
1988). This influence could be exacerbated on sand-based putting greens due to their
inherently low nutrient retention capacity.
Hexadecyltrimethylammonium (HDTMA) is a cationic surfactant that can be
electrostatically bound to the negatively charged surface of selected soil amendments and
has been shown to remove anionic compounds, such as nitrate and chromate, from
solution (Li, 1999). Due to its success, a surfactant modified soil amendment (SMSA)
has been used to create permeable barriers for groundwater remediation (Bowman et al.,
2001).
A series of lysimeters studies were conducted at the University of Florida between
2002 and 2003 to investigate the influence of SMSAs on anion leaching below the
turfgrass rootzone. The objective of this study was to determine the influence of SMSAs
on leached nitrate, phosphate, and ammonium in a simulated USGA putting green.

CHAPTER 2 LITERATURE REVIEW
Soil Amendments
The USGA has recommended putting greens be primarily sand-based (USGA,
1993). The high sand content of USGA putting greens allows greens to maintain
adequate aeration and drainage while minimizing compaction. Due to the high traffic
typically imposed on USGA greens, these characteristics are crucial to maintaining a
quality-playing surface. However, sand-based greens do have limitations, the most
important of which are low water and nutrient retention (Bigelow et al., 2000). Soil
amendments counteract the tendency of sand-based root zones to be nutrient deficient and
droughty (Crawley and Zabcik, 1985). The USGA recommends putting greens be
amended with peat moss at a rate of 85% sand and 15% peat by volume (Beard, 1982).
The addition of peat moss increases the cation exchange capacity (CEC) as well as the
water holding capacity of the growing media. However, peats are organic and are subject
to microbial degradation. Many years of peat decomposition may be detrimental to
putting green performance.
In recent years, superintendents have shown a growing interest in inorganic soil
amendments to use in place of peat. Inorganic amendments are not subject to biological
degradation, and thus are considered to be more stable than organic amendments, which
decompose with time. Many different types of inorganic soil amendments are currently
marketed for golf green construction. These include calcined clays, zeolites,
5

6
diatomaceous earths, and water treatment residuals. Characteristics between organic and
inorganic amendments differ greatly; thus each will be considered and discussed
individually.
Peats
The oldest and most widely used organic amendment used on golf courses is peat
(Beard, 2002). Peats are typically mined from deposits located in cool, flooded
environments. Low temperatures decrease microbial activity and can increase peat
accumulation. Flooded conditions further increase the likelihood of peat accumulation by
limiting oxygen availability. Peats can vary dramatically in their characteristics in large
part due to the environment and parent material from which they formed. Peats have
been classified into three types: 1) moss peat, which is from sphagnum, hypnum, and
other mosses; 2) reed-sedge peat, from reeds, sedges, and other swamp plants; and 3) peat
humus, peat of any form that has degraded to the point where no plant parts are
identifiable (Lucas et al., 1965). When investigating six different types of peat, Carlson
et al. (1998) found the pH of these peats varied from 2.9 to 6.2, water retention varied
from 33 to 60% by volume, and the organic matter content varied from 63 to 95%.
Despite these differences in laboratory-analyzed characteristics, no differences were
observed in turf quality when these peats were used to amend putting green root zones.
Benefits of adding peat to a turfgrass root zone include (a) release of soluble
nutrients and gradual release of nutrients through microbial degradation, (b) increase
CEC for nutrient retention and chemical buffering, and (c) increase moisture retention.
Peats provide a number of plant essential nutrients. Comer (1999) reported
Mehlich-I extractable P, Mg, and Ca increased by 575, 525, and 340%, respectively, by
adding peat to USGA sand. Correspondingly, plant uptake of P, Mg, and Ca were higher

7
in peat amended-sand than the control. These increased nutrients lead to an increase in
total dry matter production of 7%. No differences in extractable K were observed by
Comer, a trend that was also observed by Ok et al. (2003). Ok et al. investigated
creeping bentgrass performance as influenced by three amended root zones and reported
higher levels of P, Mg, and Ca in peat-amended root zones than the control.
Peats are composed of a variety of reactive, organic compounds. Polyphenols,
polyquinones, and polysaccharides are a few compounds found in peat, each of which
possesses hydroxyls, carboxyls, and phenolic groups that dissociate and give rise to a
CEC by weight that is often higher than most inorganic soil amendments (Carrow et al.,
2001). The charge associated with peat is pH dependent and, thus, changes in relation to
the pH of the soil solution. As pH increases, some H+ ions are neutralized by OH- ions
and the CEC of the peat increases. Conversely, as pH decreases, H+ ions in solution
become sufficient to saturate negative charges on organic matter and the CEC decreases.
Incorporating peat into a sand-based root zone can increase the root zone CEC by as
much as 425% (Bigelow et al., 2001a). This increase in CEC directly influences nutrient
retention. At 20% (by volume) incorporation, peat can decrease NH4-N leaching from
96% to 37% of applied N (Bigelow et al., 2001a). Ammoniacal-N may then become
available for plant uptake or be oxidized by nitrifying bacteria (Sylvia et al., 1997).
Leaching of cationic nutrients such as K, Ca, and Mg have also been shown to decrease
with peat incorporation (Snyder, 2003). However, additions of peat may increase
leaching of anionic nutrients. Brown and Sartain (2000) observed a 30% increase in
leached P by adding peat to uncoated sand, which may have been attributed to the soluble
P content of peat which effectively increases total soil P.

8
Due to their fibrous, porous nature, peats can increase total soil porosity and thus
increase soil moisture retention. Critical levels for optimum soil porosities have been
suggested and range from 0.10 to 0.20 (Baver, 1956; Flocker et al., 1959, and Wesseling
and van Wijk, 1957). Currently, the USGA specifies putting green root zones should
have an aeration porosity of 0.15 to 0.30 (USGA, 1993). However, aeration porosity is
typically not uniformly distributed throughout the 30 cm putting green root zone. Taylor
et al. (1997) reported the bottom 9 cm of a sand/peat mixture had 3 to 7% air-filled
porosity while the top 21 cm had 22 to 37%. Similar results were reported by Flury et al.
(1999) in which the lower boundaries of experimental lysimeters were found to remain
near saturation while the upper 80% of the soil columns exhibited a uniform moisture
distribution.
The influence peat has on porosity also affects bulk density. Bigelow et al. (2001b)
found incorporating peat (10% by volume) with sand decreased bulk density from 1.66 to
1.54 g cm-3, increased total porosity from 0.41 to 0.47, and increased air-filled porosity
from 0.24 to 0.28. This increase in porosity allows sand amended with peat to retain
more water than sand alone. Sphagnum peat moss has been found to hold 10-14 times its
own weight in water (Hummel, 2000). When incorporating peat, soil moisture contents
have been found to be higher than sand amended with zeolites and calcined clays
(Bigelow et al., 2001b). After saturation followed by drainage for 48 hours, sand/peat
mixtures were found to retain as much as 46% more water than sand alone (Taylor et al.,
1997).
The organic matter associated with peat incorporation also influences plant
available water (PAW). Hudson (1994) found the correlation between OM and PAW to

9
be significant (r2= 0.79), and that as OM content increased from 0.5 to 3%, PAW more
than doubled. However, peat incorporation may not always be beneficial to PAW.
McCoy (1992) found that Canadian sphagnum peat retained water within organic matter
pores beyond that available to the plant. He further suggested that much of the water
retained by organic amendments with fiber contents in excess of 45% is unavailable to
plants. In the same study, Canadian sphagnum peat had a fiber content of 54%.
Addition of peat to sand-based root zones increases plant growth and soil
productivity (Lucas et al., 1965). Incorporation of sphagnum peat to uncoated, coated,
and artificially coated sand shortened turf establishment by 14 days and increased yield
by 50% (Snyder, 2003). Following establishment, a 12-week maintenance study was
conducted in which peat-amended pots produced 24% more dry matter than sand alone.
These findings are in contrast to Smalley et al. (1962) who investigated the influence of
peat and calcined clay (10% by volume) on Tifgreen bermudagrass and reported neither
had any effect on dry matter yield. During this one-year study, 1022 and 484 kg of N and
K ha-1 were applied, respectively. At this fertilization rate, it is likely that turf on both the
control and treated plots received adequate nutrients, and the influence of peat and
calcined clay (CC) was minimized thus, no differences were observed. Other researchers
have reported different results. Cooper et al. (1998) investigated the influence of four
humic substances including peat on root mass and nutrient uptake of creeping bentgrass.
They reported little or no difference in root mass or N, K, Ca, Mg, or Fe uptake between
any humic compounds or the control.
Calcined Clays
Mined clays, typically smectites, are heated to 800 –900 oC to harden the
amendment and increase their stability (Bigelow et al., 1999). The clay is then sieved to
10
achieve a desired particle size and sold as calcined clays. Calcining the clay allows the
amendment to maintain its beneficial characteristics such as CEC and moisture retention
while eliminating shrinking and swelling, which can be detrimental to putting green
performance. Calcined clay has the advantages of withstanding compaction, providing
high infiltration, and allowing good aeration (Letey et al., 1966).
Cation exchange capacity of calcined clays arises from isomorphic substitution of
Al+3 for Mg+2 in the octahedral sheet and, thus much of the charge is independent of pH.
Reported CEC values of calcined clays vary from 24-34 cmol(+)/kg (Richardson and
Karcher, 2001; Carrow et al., 2001). Field plots modified with calcined clays have
shown increases in CEC as well as increases in nutrient retention. Li et al. (2000)
observed an 8% increase in CEC when comparing plots amended with calcined clays to a
control. They also observed a 100% and 30% increase in exchangeable K and Mg,
respectively. In the same study, exchangeable Ca decreased by 4%, a trend which was
also observed by McCoy and Stehouwer (1998). The increase in CEC reported by Li is
lower than results reported by Bigelow et al. (2001a). Exchange capacities in their study
increased from 0.8 in the control to 2.4 cmol(+) kg-1 in the calcined clay amended plot.
Calcined clay was further shown to increase CEC above a zeolite treatment which was
reported to be 1.6 cmol(+) kg-1.
Calcined clays are incorporated with sand not only to increase the CEC, but also to
aid in moisture retention. When sand is mixed with CCs (15% by volume), porosity has
been reported to increase by as much as 15% over sand alone (Waltz et al., 2003).
Correspondingly, total water retained after drainage also increased from 19.9 to 23.1 cm
in sand and CC plots, respectively. Li et al. (2000) reported sand modified with calcined

11
clay retained 13% more water than sand alone. Li theorized that calcined clay probably
provided for a more favorable ratio of macropores to micropores which equaled 3.77.
Macropores play a vital role in hydraulic conductivity while micropores are more
responsible for water retention (Rowell, 1994). Root zone modifications that alter pore
space distribution and improve aeration and water conditions can favor turfgrass growth
(Waddington, 1992).
Turf establishment and growth are generally increased by incorporating CCs into
a sand-based rootzone. Waltz and McCarty (2000) conducted an experiment involving
the incorporation of soil amendments and their influence on turf establishment. They
found plots containing sand and CC achieved 75% and 100% establishment, respectively,
at 9 months after seeding. Furthermore, calcined clay treatments produced a higher
visual rating of density and color than plots with sand alone. However, these findings
differ from those reported by Smalley et al. (1962). They investigated the influence of
CC on turf yield and quality and reported that incorporating CC decreased yield and
quality. They observed this effect was particularly evident during a droughty period, and
concluded the decrease in yield and quality likely resulted from excessive aeration and
consequent reduction in available moisture.
Zeolites
Zeolites are naturally occurring minerals that can form in a variety of
environments. The most common zeolite used for agricultural purposes is clinoptilolite
because it is the most common zeolite found in soil parent material (Boettinger and Ming,
2002). Like quartz, zeolites are tectosilicates, thus its structure prevents any shrinking or
swelling that sometimes occurs with other soil minerals. However, unlike some
tectosilicates, zeolites are porous, thus they tend to have low densities (1.9-2.2 g cm-3)

12
(Breck, 1974). Their porous nature also increases their surface area and its cation
exchange capacity. Clinoptilolite has been shown to have a void volume near 34% and a
CEC as high as 220 cmol(+) kg-1 which arises from isomorphic substitution of Al3+ for
Si4+ (Meier and Olson, 1988). The internal pores of clinoptilolite are small enough to
limit the adsorption of some larger ions, thus clinoptilolite is highly selective for K+ and
NH4+ relative to Na+ or divalent cations such as Ca2+ and Mg2+ (Ming and Mumpton,
1989). Goto and Ninaki (1980) determined the ion-exchange selectivity order of natural
zeolites to be K+ > NH4+ > H+ > Na+ > Sr2+ > Ca2+ > Mg2+ > Li+. The strong affinity
zeolites have for K+ and NH4+ has prompted municipalities to use zeolites for the removal
of NH4+ from sewage (Mercer et al., 1970).
Their high CEC is the primary reason zeolites have been used to amend putting
green root zones. Addition of zeolites to sand-based root zones has been shown to
increase the CEC by as much as 200 fold (Huang and Petrovic, 1994). This increase in
CEC helps to buffer the soil and increase retention of nutrients such as K, NH4, Ca, and
Mg. Ferguson et al. (1986) observed that zeolite amended soils produced higher turf
quality than non-amended soils. It was hypothesized that NH4+ produced from urea
applications was adsorbed by the clinoptilolite and was slowly released, which resulted in
a more healthy turf. In defense of this theory, an incubation study was conducted in
which NH4-N was mixed with clinoptilolite amended USGA sand. After 25 days of
incubation, NH4+ loss due to nitrification, denitrification, and/or volatilization was lower
in clinoptilolite-amended sand than vials containing sand alone. This was attributed to
the internally sorbed NH4+ being inaccessible to denitrifying bacteria (Ferguson and
Pepper, 1987).
13
Decreased NH4+ leaching from zeolite-amended soils has also been attributed to the
increased CEC that accompanies zeolite incorporation. When mixed at a rate of 50 g kg-
1, clinoptilolite has been shown to decrease NH4-N leached from 168 to 29 mg NH4-N
(Mackown and Tucker, 1985). A number of studies have reported reductions in NO3-
leaching with use of clinoptilolite. Huang and Petrovic (1994) not only reported that
NO3- and NH4
+ leaching was 86 and 99% lower, respectively, in zeolite-amended sand
than sand alone, they also observed the fertilizer use efficiency of creeping bentgrass
increased as much as 22%. Lewis et al. (1984) reported pots containing a loamy sand soil
amended with clinoptilolite reduced NO3- leaching by 33% compared to the control when
fertilized with ammonium sulfate. These reported reductions in NO3- leaching are likely
attributed to NH4+ release from clinoptilolite being limited by diffusion and cation
exchange reactions (Semmens, 1984; Allen et al., 1995).
The capacity zeolite has to retain cations may not always be beneficial. Some
research suggests that the energy at which NH4+ is held by zeolite may be enough to
render NH4+ inaccessible to plants. Ferguson et al. (1986) observed better bentgrass
establishment on 5% than on 10% clinoptilolite amended plots. While this observation
was attributed to high sodium content, more recent research suggests that high sodium
levels may not be solely responsible for the decreased establishment, but rather N
removal by NH4+ sorption which effectively reduces plant available N. Regardless, other
studies have shown that the influence of zeolite on creeping bentgrass establishment
compares favorably with peat (Nus and Brauen, 1991).
Zeolite incorporation typically increases turf establishment. Miller (2000) reported
that bermudagrass was found to establish more rapidly and had greater growth on
14
ZeoPro-amended plots than plots containing 100% sand and other rootzone mixtures.
The higher nutrient levels accompanying incorporation of zeolite have been associated
with more rapid establishment and high quality ratings of creeping bentgrass (Ok et al.,
2003). It should be mentioned that studies conducted by Miller (2000) and Ok et al.
(2003) involved the use of zeolite which contained as much as 0.1% N. Nitrogen loaded
zeolite may act as an N source instead of an N sink which may increase turf growth and
establishment. Natural zeolites do not contain N, thus turf grown on natural zeolite may
react differently than turf established on N-loaded zeolite. This concept was also
speculated by Ok et al. (2003). Nus and Braun (1991) investigated the incorporation of
sawdust, peat, zeolite on establishment of creeping bentgrass and reported peat and
zeolite were equally effective at increasing turf establishment.
Diatomaceous Earths
Algae, predominantly of marine origin, are responsible for the formation of
diatomaceous earths (DE). Diatoms are microscopic, single-cell plants, which join to
form sedimentary rock composed of fossilized skeletal remains of diatoms (Fresenberg,
1999). Chemically, DEs are like silica sand in that they are about 90 percent silica (SiO2)
with minor amounts of alumina (Al2O3) (Mannion, 1996). Some DEs are calcined during
manufacturing. Calcined DEs are 50 percent harder and suffer one-quarter the wet
attrition loss of uncalcined DEs (Mannion, 1996).
DEs are porous and, thus, have low bulk densities and can retain up to 150% its
weight in water. Sands amended with DEs have been reported to have higher total
porosity and overall water retention than sands amended with zeolite (Bigelow et al.,
2004). However, Bigelow also reported that DE amended sand possessed the same
porosity and water retention as peat and calcined clay amended sand. These findings

15
were similar to those reported by Waltz et al. (2003). Waltz investigated the hydraulic
properties of several soil amendments including DE. Waltz reported that water retained
at field capacity was greater in sand amended with peat than with DE. However, as plots
were allowed to dry, DE and peat amended sand held more water than CC amended sand.
Waltz further observed that DE and peat amended sand held more water in the top 15cm
of a 30 cm profile than CC amended sand. While turf growth was not investigated, Waltz
speculated that amendments that slow water movement and retain more water in the
upper portion of the rootzone would result in turf with less water stress than turf grown
on media that retained less water due to rapid drainage.
The influence of DEs on turf growth has been shown to be most pronounced during
times of drought. Wehtje et al. (2003) evaluated bermudagrass growth as influenced by
DE, zeolite, and calcined clays incorporated with sand at five rates. Their investigation
consisted of measuring turf yield under luxury water and nutrient application and under
drought conditions. When bermudagrass was supplied with adequate water and nutrients,
sand amended with DE only produced more dry matter than un-amended soil at the
highest incorporation rate (100% DE). However, under drought conditions DE increased
dry matter production which, in general, increased with increasing incorporation rate.
Experimental conditions during this study were variable. However, Wehjte et al.
concluded that improvement in bermudagrass performance in amended sand relative to
soil alone was most likely related to increased water-holding capacity. This theory was
not only based upon their findings, but also upon previous research conducted by Ralston
and Daniel (1973). During their research, Ralston and Daniel investigated the influence
of calcined clay and DE on creeping bentgrass. After two 15 day dry down periods, they

16
found plots containing DE maintained normal growth without additional water
applications while plots containing calcined clay required water after 5 days. More
recent research has also shown turf grown on DE amended sand produced better coverage
and more dry matter than CCs or peat during times of drought (Waltz and McCarty,
2000).
Water Treatment Residuals
Water treatment facilities use FeSO4 to remove humic substances from water for
human consumption. Water treatment residuals (WTRs) are products of this process.
WTRs contains humic and fulvic acids as well as iron, which is a plant essential element
(Salisbury and Ross, 1992).
In general, WTRs have a positive influence on soil moisture. Bugbee and Frink
(1985) observed increases in soil moisture retention and aeration from WTR
incorporation with soil. Increases in soil moisture retention were also observed by
Rengasamy et al. (1980) and were attributed, in part, to the increase in soil aggregate
stability which accompanied WTR incorporation. Increasing soil structure by adding
WTRs has also been shown to increase soil drainage (Scambilis, 1977) which is crucial to
putting green performance.
Applications of WTRs have been shown to increase plant growth. Basta et al.
(2000) investigated the influence of WTRs on dry matter yield of bermudagrass. They
reported bermudagrass grown on WTRs produced a yield of 26 g pot-1 while turf grown
on native soil only produced 15 g pot-1. WTRs used in the Basta study contained 140 and
130 ppm NO3-N and NH4-N, respectively. High N levels along with high levels of P, K,
Ca, Mg, and Fe were likely the cause of the observed increase in turf growth. A similar
explanation was given by Elliott and Singer (1988) when they studied the influence of

17
WTR on growth of tomato and observed an increase in yield following the incorporation
of WTR. Ippolito et al. (1999) investigated the influence of co-application of biosolids
with WTRs on biomass yield of two range grasses. They concluded that increasing the
rate of WTR incorporation increased biomass production for both turf species. However,
in general, turf grown on plots containing less than 150 g kg-1 WTR did not show yield
increases. Lower incorporation rates were used by Heil and Barbarick (1989) when
investigating WTR incorporation and its effect on the growth of sorghum-sudangrass. By
increasing WTR incorporation rate from 0 to 20 g kg-1, Heil and Barbarick increased turf
dry matter production from 6 to 20 g pot-1. They attributed this increase in yield to an
increase in plant available Fe which was not observed in the control pots, which exhibited
Fe-deficiency symptoms. Other researchers have observed limited influence of WTRs on
plant growth. Geertsema et al. (1994) applied WTR at three rates of 0, 36, and 52 dry Mg
ha-1 to loblolly pine (Pinus rigida Mill.) and reported no differences in plant growth
between amended and unamended plots after 30 months of growth.
Water-Use-Efficiency
Water-use-efficiency (WUE) is defined as the quantity of dry matter produced per
quantity evapotranspired water (g dry matter mL ET-1). WUE may be influenced by
plant species, nutrient availability, water availability, or cultural management practices.
Many studies have shown that water use is directly related to available soil
moisture, and, to a point, WUE increases as soil moisture decreases. Youngner et al.
(1981) investigated water use of two cool-season and two warm-season grasses. Soil
moisture was maintained according to tensiometer readings of 0.015, 0.035, and 0.055
MPa. Regardless of turf species, water use was maximized under the highest soil
moisture tension. Danielson et al. (1981) measured the water use of Kentucky bluegrass
18
under differing soil moisture levels including 100%, 80%, and 70% field capacity. They
reported irrigation of 80% field capacity reduced water consumption by 20% with only
minor reductions in turf quality. Similar results were reported by Meyer et al. (1985).
They also used varying irrigation rates from 100 to 60% ET estimated values and
reported that when irrigation rates were dropped to 80% ET, turf quality rates dropped
only 3% for cool-season and 5% for warm-season grasses. Stout et al. (1988)
investigated the influences of soil and N on WUE of tall fescue and concluded that based
upon the regression of WUE and soil variables, the influence of soil on WUE increases
during periods of limited water availability. This indicates that when water is limited,
differences in WUE between different rootzone media may be more pronounced.
Differences between WUE not only exist between different plant species, but also
between different cultivars or varieties within a species. C-4 plants are more efficient
users of water than C-3 plants during periods of high light and temperature (Black et al.,
1969). This is due to more efficient carbon assimilation in C-4 plants. C-4 plants are
able to take up more CO2 through their stomata, thus less water is lost for every CO2
molecule assimilated (Hull, 1992). WUE of C-4 grasses has been reported to be as much
as 2x higher than C-3 grasses (Schantz and Piemeisel, 1927). These results were similar
to Fu et al. (2003) who reported ‘Meyer’ zoysia to have a WUE more than 3x higher than
‘Falcon II’ tall fescue.
Cultural practices that influence WUE include: irrigation frequency, mowing
height, and fertility program. Minner (1988) observed an increase in water use rate when
irrigation frequency was increased. Minner also reported water use increased as mowing
height increased which was attributed to an increase in leaf area index. Biran et al.

19
(1981) increased cutting height from 3 to 6 cm and found similar results with Festuca
arundinacea and Lolium perenne. They reported a permanent increase in water
consumption and growth, as well as an increase in chlorophyll per unit weight in
clippings. However, Biran did not find any permanent increases in water consumption or
plant growth in C-4 turfgrasses.
In general, the greatest single factor influencing WUE is soil fertility. Stout et al.
(1988) studied the influence of 3 soils and 3 N rates on WUE of tall fescue. When N
rates increased from 45 to 90 kg ha-1 WUE increased by as much as 50%. Stout reported
during fall harvests, N fertility was always the major component influencing WUE of tall
fescue. Feldhake et al. (1983, 1984) used two N fertilization levels to determine the
influence of N on water use of Kentucky bluegrass. They reported higher ET levels from
turf supplied with 4 kg of N 1000 m-2 mo-1 than from turf supplied with 4 kg of N 1000
m-2 yr-1. A more recent study investigated the influence of 4 soils, 3 N rates, and 2 turf
species and concluded N fertilization increased WUE at all application rates with the
highest application rate having the greatest influence on WUE (Stout, 1992). The
influence of N fertility on WUE has been shown to be most pronounced when water is
limited. Stout and Schnabel (1997) investigated WUE of perennial ryegrass over a two-
year period. During year one, when rainfall and irrigation supplied water were
considered to be adequate for turf growth, N fertility increased WUE 154%. During year
two, when rainfall and irrigation were low, N fertility increased WUE 455%.
Nitrogen in the Turfgrass Environment
In order to limit N leaching and the environmental impact of N fertilization, one
must thoroughly understand the N cycle (Fig. 2-1) and the transformations that N

20
undergoes in a dynamic soil system. These processes include: plant uptake, soil retention
and microbial immobilization, runoff and leaching, or atmospheric loss (Petrovic, 1990).
N Transformations in Soil
Soil N exists primarily in two forms: organic and inorganic. Organic N is present
in a variety of compounds including proteins and amino acids. Forms of inorganic N
include NH4+ and NO3
- and are produced from the aerobic oxidation of organic N or from
fertilizer input. From the standpoint of environmental impact and leaching, NH4+ and
NO3- are the most important because it is these compounds that are mobile in the soil
solution (Follett, 1989).
Organic N is converted to NH4+ by heterotrophic microorganisms during
mineralization. N mineralization is strongly influenced by moisture and O2 content.
Maximum N mineralization occurs between 50 and 70% water-filled pore space (Havlin
et al., 1999). Once in inorganic form, NH4+ may take a variety of paths including plant
uptake, mineral fixation, volatilization, or nitrification. Nitrification is the conversion of
NH4+ to NO2
- and then to NO3-. Nitrification consists of two reactions. The first reaction
is mediated primarily by microorganisms belonging to the group Nitrosomonas.
2NH4+ + 3O2 2NO2
- + 2H2O + 4H+
The second reaction oxidizes nitrite to nitrate and is mediated primarily by organisms in
the Nitrobacter group.
2NO2- + O2 2 NO3
-
Both reactions require O2, thus each reaction is highly dependent upon aerification
and moisture content. In aerated soils, nitrification is normally a rapid process requiring
only days to convert the NH4+ to NO3
-. During a 53 week incubation study to investigate
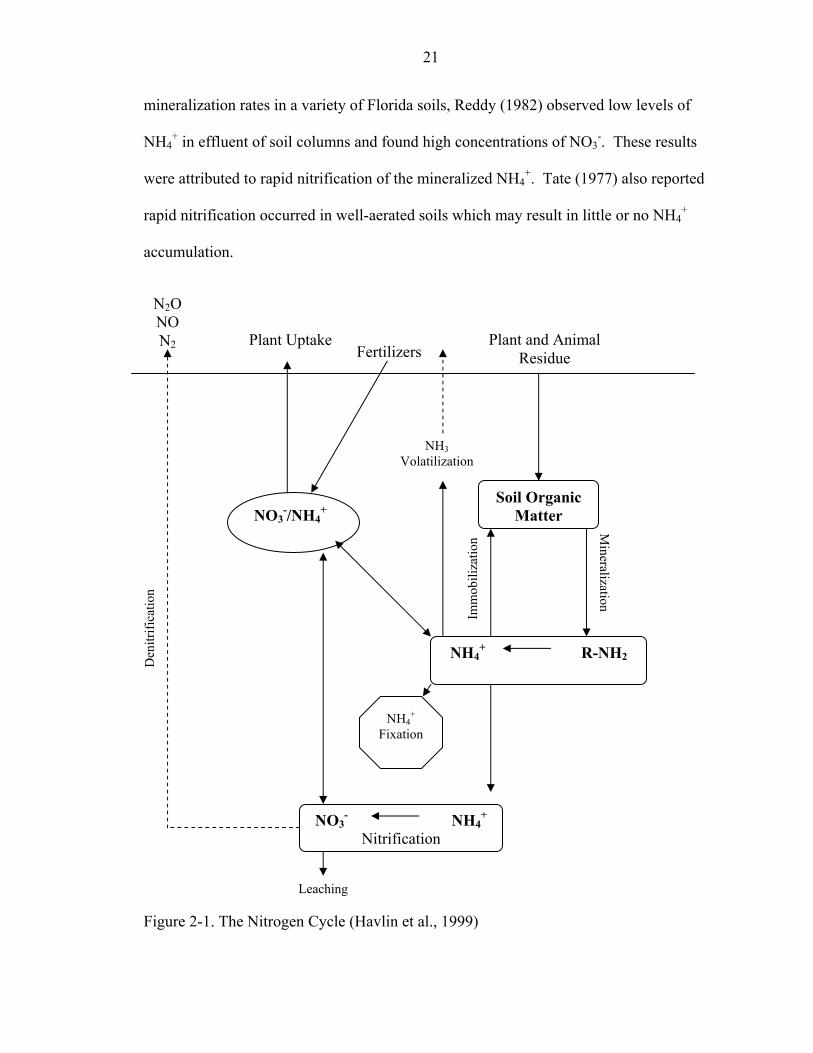
21
mineralization rates in a variety of Florida soils, Reddy (1982) observed low levels of
NH4+ in effluent of soil columns and found high concentrations of NO3
-. These results
were attributed to rapid nitrification of the mineralized NH4+. Tate (1977) also reported
rapid nitrification occurred in well-aerated soils which may result in little or no NH4+
accumulation.
Fertilizers
N2O NO N2
Den
itrifi
catio
n
NH4+
Fixation
Plant and Animal Residue
Plant Uptake
NO3-/NH4
+
Leaching
Imm
obili
zatio
n
Mineralization
NO3- NH4
+
Nitrification
NH4+ R-NH2
Soil Organic Matter
NH3 Volatilization
Figure 2-1. The Nitrogen Cycle (Havlin et al., 1999)

22
Leached N
The most common source of NO3- pollution of ground and surface water is
agriculture (Halberg, 1987; Pratt, 1984). While turfgrass is not often thought of as an
agricultural crop, golf courses and home lawns are maintained according to many of the
same practices and, thus they are also sources of nitrate leaching (DeRoo, 1980; Morton
et al., 1988).
Susceptibility of USGA putting greens to N leaching has been well documented.
Snyder et al. (1984) investigated the influence of moisture-sensor irrigation on N
leaching and reported 56% of applied N from ammonium nitrate was leached under a
daily irrigation schedule. They also observed 85 to 98% of leached N occurred as NO3-N
and that 75% of leached N occurred within 20 days of application. Bigelow et al. (2001a)
used several laboratory studies to monitor leaching losses of N from a sand-based
medium amended with 20% peat by volume and reported addition of peat decreased
NO3-N leached from 98 to 95% of that applied, which was statistically significant. Peat
had a greater influence on leached NH4-N dropping the percent NH4-N lost from 96 to
37% of that applied. Because of its positive charge, NH4-N can adsorb to soil particles
and, thus may not leach readily. However, Sartain (1990) applied (NH4)2SO4 to bare soil,
encouraged leaching, and found after 112 days, 80% of applied N leached with 68%
being NH4-N. In most agricultural soils, N leaching is primarily as NO3-N simply due to
the rapid oxidation of NH4-N to NO3-N.
Because all N leaching occurs in soil solution, soil water content plays a major role
in N movement through the soil profile. In general, N leaching potential increases as
water application increases (Morton et al., 1988). Starrett el al. (1995) investigated two

23
irrigation regimes on N leaching and found 30 times more N leached when irrigation
rates were increased by a factor of four.
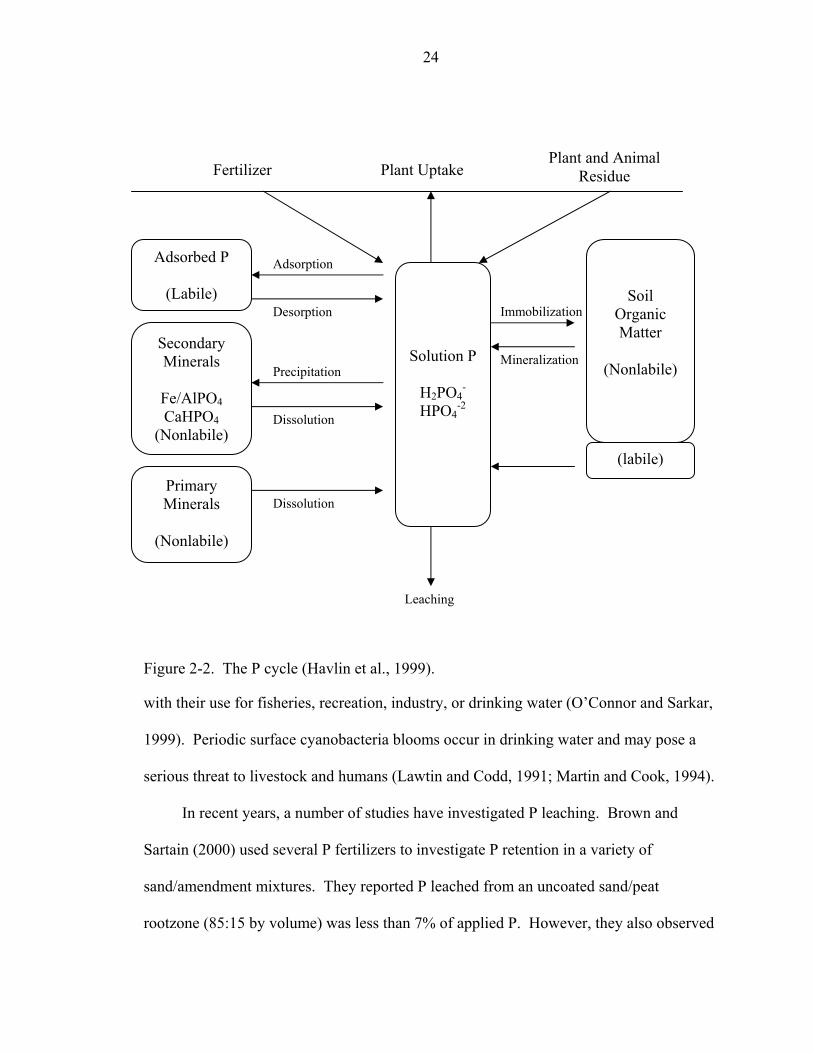
Phosphorous in the Turfgrass Environment
Phosphorus is a macro nutrient used by plants to produce ATP, which in turn is
used as an energy source which drives many metabolic processes. Phosphorus exists in
soil solution primarily in anionic form (Fig. 2-2). Additions of P to soil solution arrive
via desorption from soil exchange sites, dissolution of primary and secondary minerals,
and mineralization of organic matter. In most agronomic situations, plant uptake and
leaching are the only process whereby P is removed from the soil system.
P Reactions in Soil
Total P in most surface soils varies but is generally between 0.005 and 0.15%
(Havlin et al., 1999). Of the total P, only a small portion actually exists as solution P
which is that portion available for plant uptake. Solution P is maintained by dissolution
of primary and secondary mineral, mineralization from organic matter, and by desorption
from mineral and clay surfaces (Fig. 2-2). These processes are responsible for
replenishing the soil solution P that is taken up by the plant. When these processes
cannot adequately supply P, fertilizers must be used to artificially increase solution P
concentrations. However, when solution P exceeds the amount needed by the plant, the
potential for P leaching increases.
Leached P
Phosphorus is considered to be a critical nutrient responsible for eutrophication of
surface water bodies. Eutrophication of surface water has been identified by the USEPA
as a major cause for quality degradation of surface waters which may lead to problems
24
Plant and Animal Residue Fertilizer Plant Uptake
Mineralization
Immobilization
Adsorption
Desorption
Precipitation
Dissolution
Dissolution
Solution P
H2PO4-
HPO4-2
(labile)
Soil Organic Matter
(Nonlabile)
Adsorbed P
(Labile)
Secondary Minerals
Fe/AlPO4 CaHPO4
(Nonlabile)
Primary Minerals
(Nonlabile)
Leaching
Figure 2-2. The P cycle (Havlin et al., 1999).
with their use for fisheries, recreation, industry, or drinking water (O’Connor and Sarkar,
1999). Periodic surface cyanobacteria blooms occur in drinking water and may pose a
serious threat to livestock and humans (Lawtin and Codd, 1991; Martin and Cook, 1994).
In recent years, a number of studies have investigated P leaching. Brown and
Sartain (2000) used several P fertilizers to investigate P retention in a variety of
sand/amendment mixtures. They reported P leached from an uncoated sand/peat
rootzone (85:15 by volume) was less than 7% of applied P. However, they also observed
25
twice as much P leached from peat amended sand than from sand alone. These finding
are somewhat lower than that observed by Shuman (2001). Shuman investigated P
leaching from a simulated USGA putting green in an environmentally controlled
greenhouse and reported 27% of applied P was lost via leaching. Uncoated sands
typically retain less P than coated sands. Harris et al. (1996) investigated the P sorption
characteristics of coated and uncoated sands via a number of adsorption and desorption
experiments. They reported the presence of sand grain coatings enhanced P adsorption
and resistance to desorption.
Soil amendments have been used to reduce P concentrations in ground water.
Porter and Sanchez (1992) reported that P sorption in a Histosol was correlated with soil
ash and CaCO3 content. Coale et al. (1994) applied gypsum and WTR and investigated
their influence on P leaching. They reported decreased leachate P concentration from
both amendments with gypsum causing the greatest decrease in leached P.
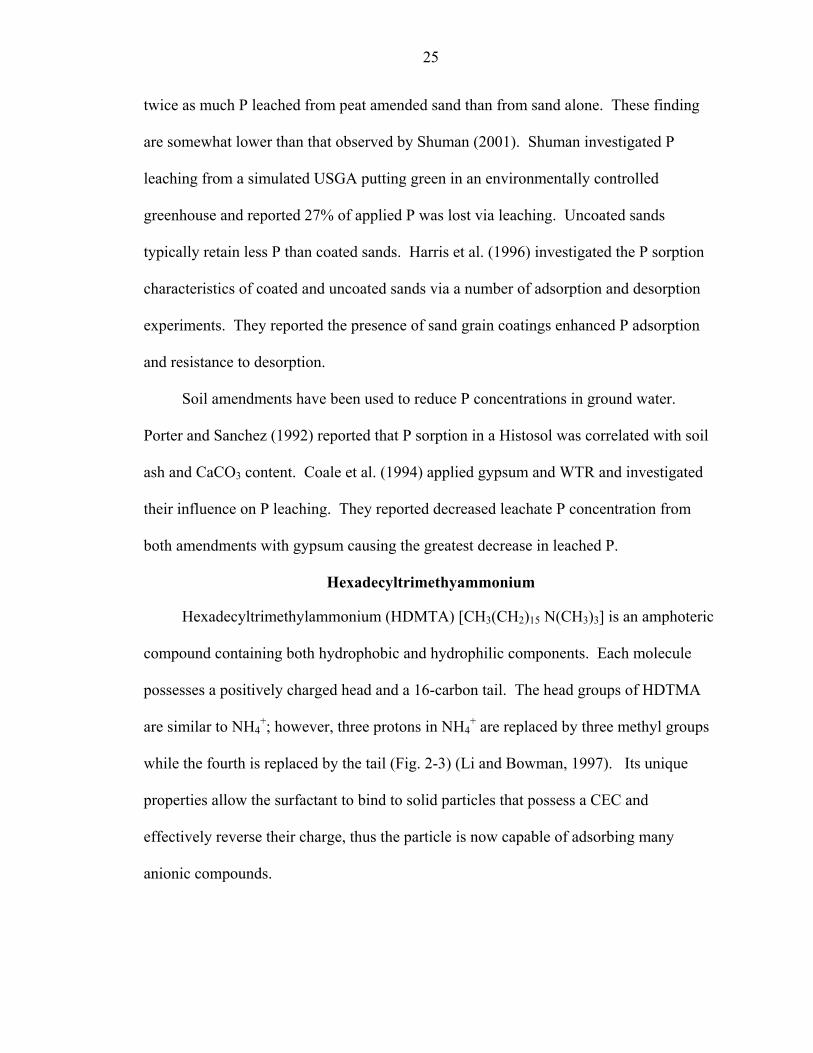
Hexadecyltrimethyammonium
Hexadecyltrimethylammonium (HDMTA) [CH3(CH2)15 N(CH3)3] is an amphoteric
compound containing both hydrophobic and hydrophilic components. Each molecule
possesses a positively charged head and a 16-carbon tail. The head groups of HDTMA
are similar to NH4+; however, three protons in NH4
+ are replaced by three methyl groups
while the fourth is replaced by the tail (Fig. 2-3) (Li and Bowman, 1997). Its unique
properties allow the surfactant to bind to solid particles that possess a CEC and
effectively reverse their charge, thus the particle is now capable of adsorbing many
anionic compounds.

26
H3 H3 C C
Figure 2-3. Hexadecyltrimethylammonium.
Bi-layer Formation
Bi-layer formation involves two steps. The first step involves direct attachment of
HDTMA micelles to the amendment surface via electrostatic bonding. The second step
involves HDTMA surface rearrangement, which is directly related to the initial surfactant
input in relation to the ECEC of the amendment. If the initial surfactant input is less than
the ECEC, each micelle will dissociate to form a monolayer. If surfactant input is greater
than the ECEC but less than twice the ECEC, an incomplete or ‘patching’ bi-layer forms.
Figure 2-4. Schematic of HDTMA bi-layer formation.
N H2 H2 H2 H2 H2 H2 H2 H3 C C C C C C C C
C H2
C H2
C H3
C H2
C H2
C H2
C H2
C H2
C H2
Positive Head Group + + ++
24-26 Å
++ + +
Amendment Surface
- - - -
27
If surfactant input is greater than twice the ECEC, a complete bi-layer will form (Fig. 2-
4). The initial step is relatively fast generally requiring less than one hour. The second
phase involves intraparticle diffusion, which can require as many as 48 h to achieve bi-
layer formation depending upon the ECEC of the solid phase (Li, 1999). Cation
exchange is responsible for retaining the lower layer while hydrophobic bonding causes
formation of the upper surfactant layer (Li and Bowman, 1997).
Anion Sorption
Recent literature indicates HDTMA-modified solids are effective sorbents for
multiple types of contaminants, such as chromate, naphthalene, perchloroethylene, and
nitrate (Li and Bowman, 1997; Nzengung et al., 1996). While investigating the HDTMA
counterion influence on chromate sorption, Li and Bowman (1997) observed sorption
isotherms were well described by the Langmuir equation. Chromate sorption maximum
was reported to be 16 mmol kg-1. More importantly, Li and Bowman found the exchange
ability of the counterion on HDTMA was more influential on chromate sorption than the
initial HDTMA loading concentration. Other studies investigating NO3- sorption have
found similar results. Li et al. (1998) investigated NO3- sorption isotherms, which like
CrO42-, were well described by the Langmuir equation. Sorption maximum for NO3
- was
100 mmol kg-1. The same study produced results that indicated NO3- is more suitably
sorbed than CrO42-, which seems unlikely since the divalent CrO4
2- has a higher charge
density than the monovalent NO3- and thus should be more selectively sorbed.
Investigators theorized that because sorbed HDTMA onto an amendment surface does
not form a rigid structure, the stability of the HDTMA-CrO4 ion pair might be lower than
the HDTMA-NO3 ion pair, which may explain why NO3- is more suitably sorbed than
CrO42-.
28
Stability
The resistance of surfactant-modified soil amendments (SMSA) to biological
degradation or physical weathering is crucial to their long-term effectiveness.
Investigations into the influence of aqueous quaternary ammonium cations (QACs) on
microbial growth have found aqueous QACs to be biocidal. Gilbert and Al-taae (1985)
investigated a number of QACs with varying chain lengths with 4-22 carbons and
reported bacteria strains were most sensitive to QACs containing 14 carbon tails while
yeast and fungi were most sensitive to QACs containing 16 carbon tails. Microbial
growth was least inhibited by QACs with shorter tails. In general, QACs with longer
tails are more biocidal than those with shorter tails (Korai and Takeichi, 1970). Although
QACs like HDTMA have been shown to be biocidal, they can be degraded microbially.
Dean-Raymond and Alexander (1977) investigated the biodegradation of 10 QACs
including HDTMA using sewage and soil as their sources for microorganisms. They
reported decyltrimethylammonium and HDTMA were both metabolized by
microorganisms from both sources. In the same study, Decyltrimethylammonium
bromide was observed to be the sole carbon source for a mixed population of two
bacteria from soil. Each of the preceding cases involved investigations on aqueous
QACs. The influence of sorbed QACs on microbial growth is quite different. A study
was conducted in New Mexico which involved microorganism growth on agar plates
after being inoculated with a mixture of surfactant-modified zeolite (SMZ) and activated
sewage sludge (Li et al., 1998). After 17 weeks of incubation, microorganism growth
remained essentially the same between treated plates and the control. Toxicity from
QACs is primarily from the alkyl chain (Korai and Takeichi, 1970). Surfactant-modified
soil amendments which have been modified to ensure bi-layer formation have very few

29
tails exposed to soil solution, thus toxicity of SMSA is very low or non-existent (Li et al.,
1998).
Investigations into the physical stability of SMSA are somewhat limited. However,
Li et al. (1998) used SMZ in a series of leaching experiments to determine the extent of
bi-layer removal. They used two types of water, Type I had an ionic strength of zero, and
type II used K2CrO4 to increase the ionic strength to 8mM. They reported HDTMA
desorption to be 0.34 mmol kg-1 pore volume-1 from type I water and 0.14 mmol kg-1 pore
volume-1 from type II water. Based on these observations, they predicted that 65% of
sorbed HDTMA would remain after 500 pore volumes of type II water. This hypothesis
was later verified in a laboratory column test.

CHAPTER 3 MATERIALS AND METHODS
This research consisted of a variety of amendment characterization studies and two
glasshouse studies.
Characterization Studies
Characterization studies were conducted in a number of soil laboratories at the
University of Florida from fall 2001 to fall 2004.
Cation Exchange Capacity
Cation exchange capacity for each amendment and sand/amendment mixture was
determined via the ammonium acetate pH 7.0 method (Soil Survey Laboratory Staff,
1996). Five grams of soil media were placed in leaching tubes and leached with 25 mL
of 1 M NH4OAc. Leaching tubes were then closed and an additional 25 mL 1 M
NH4OAc were applied and soil media remained in solution for 48 h. Leaching tubes
were then opened followed by two applications of 100 mL ethanol. A total of 60 mL 1 M
KCl were leached through each tube, collected, brought to 100 mL volume, and analyzed
for NH4+.
Moisture Retention
Moisture release curves were determined for each sand mixture according to the
process described by Klute (1986). Field plots were originally established with the
intention of mimicking the glasshouse studies. Each plot contained rootzones
corresponding to the rootzone of glasshouse pots. However, due to experimental
difficulties during the first 3 months of the study, establishment was delayed.
30

31
Furthermore, once data began to be collected from the plots, excessive rainfall from both
hurricanes Frances and Jeane heavily skewed the data. Thus, no results from field plots
were included in this study. However, since removing usable cores from glasshouse pots
was not possible due to the rootzone depth required, cores were taken from the field plots
using a brass ring (3 cm high × 5.56 cm diameter). The ring was placed on a half-bar
porous ceramic plate, which was then placed into a Model 1400 Tempe pressure cell
(Soil Moisture Equipment, Santa Barbara, CA). Tempe cells were placed in a water bath
until each cell achieved saturation. The cells were then placed on a rack and connected to
a hanging-water column pressure system. Pressures applied corresponded to 0, 3.5, 10,
15, 20, 25, 30, 35, 50, 100, and 345 cm water (1 bar per 1035 cm water). After the final
pressure of 15 bar (wilting point), the cell was opened, the brass ring was removed, and
the soil was weighed. In order to conduct statistical analysis, two soil cores were used as
replications.
Sorption Isotherms
All sorption isotherms followed procedures outlined by Li (1999). Nitrate-N, NH4-N,
and P sorption isotherms were conducted on HDTMA-coated and uncoated zeolite (Zeo
Inc., McKinney, Tx) and two calcined clays [Soil Master Plus (Sport Turf Supply, Inc.,
Midland City, Al.), Profile (Profile LLC)], which will be referred to hereafter as calcined
clay 1 and calcined clay 2, respectively. Nitrate isotherms were prepared by adding 0.5
grams of each amendment to 10 mL of solution containing 0, 10, 20, 100, 200, and 500
ppm NO3-N to achieve loading rates of 0.2, 0.4, 2.0, 4.0, and 10.0 g kg-1. Ammonium
isotherms were prepared by adding 0.25 grams of each amendment to 20 mL of solution
containing 50, 100, 200, 500, and 1000 ppm NH4-N to achieve loading rates of 0, 4, 8,
16, 40, and 80 g kg-1. Phosphorus isotherms were prepared by adding 1.0 g of each
32
amendment to 10 mL of solution containing 0, 10, 20, 100, 200, and 500 ppm P to
achieve loading rates of 0.1, 0.2, 1.0, 2.0, and 5.0 g kg-1. Samples for each isotherm were
shaken on a mechanical shaker for 48 hours to achieve equilibrium. Samples were then
centrifuged for 15 minutes at 4000 rpm to yield a clear supernatant. Nitrate and NH4-N
solutions were analyzed using an Alpkem RFA-300 auto analyzer (IRAMA Corporation,
Milwaukie,OR), and P solutions were analyzed colorimetrically.
Surfactant Loading
Surfactant loading followed procedures outlined by Li and Bowman (1997).
Previous analysis produced CEC values for each amendment, which were used to
determine the ratio of solid to solution. Due to financial and equipment restraints, final
solution concentration analysis of HDTMA was not possible, thus, the amount of
amendment added to solution was divided by 2 to ensure bi-layer formation. The
amounts of amendment used during surfactant loading were 71, 544, and 350g of zeolite,
CC1, CC2, respectively. These amounts were determined to be the maximum amount of
amendment, based upon each amendment’s CEC, that could be added to HDTMA
solution while assuring bi-layer formation. Amendments were placed in 2 L Erlenmeyer
flasks, which were then filled to volume with 2 L of 0.066 M HDTMA solution. Each
flask was stirred for 24 h by using a magnetic star bar and plate. Following equilibrium,
the supernatant was removed, amendments were washed with 5 pore volumes of
deionized water, and amendments were allowed to air-dry.
Thermal Analysis
Thermal gravimetry (TG) analysis cannot only be used to determine OM content,
but it can also be use as an indicator of particle stability. Compounds that lose little
weight when subjected to increasing heat are considered to be more thermally stable than

33
compounds that exhibit weight losses. It has been stated that the greatest strengths of
inorganic amendments are their resistance to degradation and breakdown (Waltz and
McCarty, 2000). Each amendment was subjected to TG on an Omnitherm Corporation
instrument (Arlington Heights, IL) with a nitrogen gas purge. Temperatures ranged from
25-600 °C with a ramping rate of 20 °C min-1 (Amonette, 2002).
HDTMA was subjected to thermal analysis to determine the temperature at which
oxidation occurred (Fig. A-1). This temperature was then used when analyzing SMSA to
determine the extent of surfactant coating. Surfactant coating was determined according
to eq. 3.3.
S = ( A / 0.85 ) × 10,000 mg kg-1 eq. 3.3.
Where: S = amount HDTMA sorbed (mg kg-1)
A = weight loss due to oxidized HDTMA (%)
B = amount of HDTMA that oxidizes (%)
From thermal analysis, effective anion exchange capacity (EAEC) was determined
according to eq. 3.4.
{ [ ( C × SHDTMA ) / 2 ] / MWN } × 100 = cmol kg-1 eq. 3.4.
Where: C = MWN / FWHDTMA – (MWBr)/2 ( %)
SHDTMA = HDMTA sorbed (g kg-1)
FWHDTMA = formula weight of HDTMA (g mole-1)
MWN = molecular weight of nitrogen (g mole-1)
MWBr = molecular weight of bromide (g mole-1)
Assumptions made during determination of EAEC included: 1.) percent HDTMA
oxidation from SMSA was equal to the percent oxidation of pure HDMTA, 2.) all

34
surfactant sorbed by amendments was in a bi-layer formation, and 3.) after bi-layer
formation, all anion exchange sites in solution equaled ½ the total exchange sites and
were occupied by Br-1.
X-Ray Diffraction
In order to determine mineral composition, each amendment was subjected to x-ray
diffraction using a computer-controlled x-ray diffractometer equipped with a stepping
motor and graphite crystal monochromator (Nicolet I2/L11 Polycrystalline X-Ray
Diffraction System, Madison, WI). Amendments were crushed using a mortar and pestle
then placed in a side-packed powder mount with an Al-glass holder. Samples were
scanned from 2 to 40° 2θ at 2° 2θ per minute using CuKα radiation (Amonette, 2002).
Nutrient Analysis
All amendments and sand mixes were analyzed for P, K, Ca, Mg, Fe, Mn, Zn, and
Cu. Analysis followed procedures outlined by Olsen and Sommers (1982). Five grams
of each amendment (3 g of peat) were extracted using 20 mL of Mehlich-I solution
(0.025 M HCl and 0.0125 M H2SO4), then shaken for five minutes on a mechanical
shaker. Samples were then filtered with a Whatman no. 42 filter paper and collected in
25 mL scintillation vials. Samples were analyzed at the University of Florida analytical
research laboratory using a model 61E Thermo Jarrell-Ash ICAP 9000 spectrophotometer
(Franklin, MA).
Sand Mixes
Rooting media for each glasshouse study, the field study, and the leaching study
were mixed by hand using 85% USGA sand and 15% amendment by volume with the
exception of smectite, which was incorporated at 97.5% USGA sand and 2.5%

35
Table 3-1. Sand size analysis of amendments and sand mixes. Sand
Very
coarse Coarse Medium Fine Very fine†
Silt + Clay
1.0 -
2.0 mm 0.5 -
1.0 mm 0.25 -
0.50 mm 0.10 -
0.25 mm 0.05 -
0.10 mm <0.05 mmAmendment ---------------------------------% by weight ------------------------------------ Clinoptilolite 1 45.4 48.0 6.8 0.0 0.0 0.0 Clinoptilolite 2 31.3 67.9 0.9 0.0 0.0 0.2 Calcined Clay 1 0.3 46.6 52.9 0.7 0.0 0.0 Calcined Clay 2 0.0 50.9 49.0 0.2 0.1 0.1 Diatomaceous Earth 1 27.7 56.5 15.3 0.4 0.1 0.2 Diatomaceous Earth 2 27.0 64.6 5.1 1.2 1.0 1.2 Peat 44.7 15.3 16.4 14.3 7.8 1.7 Montmorillonite 10.2 16.5 16.8 18.2 32.5 4.8 Iron Humate 11.8 17.2 31.5 32.9 5.4 1.1 Sand Mixture‡ Sand 7.2 41.2 35.7 15.9 0.9 0.0 Clinoptilolite 1 11.9 39.9 31.2 16.7 0.3 0.2 Clinoptilolite 2 10.1 42.6 30.3 16.2 0.5 0.1 Calcined Clay 1 7.1 40.1 35.3 16.7 0.3 0.0 Calcined Clay 2 6.0 37.8 35.0 20.2 0.8 0.1 Diatomaceous Earth 1 7.1 36.7 33.9 21.4 0.7 0.0 Diatomaceous Earth 2 7.6 38.3 33.1 19.8 0.6 0.4 Peat 4.0 22.9 54.5 17.6 0.4 0.2 Montmorillonite § 7.4 39.3 35.0 17.5 0.4 0.1 Iron Humate 8.8 37.0 33.1 19.3 1.1 0.3 ------ ----------------------- ------ ------ ------ USGA ¶ Specifications ≤ 10% ≥ 60% ≤ 20% ≤ 5% ≤ 8% † Based on USGA range of 0.25 - .015 mm. ‡ 85% USGA uncoated sand plus 15% amendment by volume § 2.5% by volume ¶ United States Golf Association
smectite. Particle size analysis was determined for each amendment and
sand/amendment mixture according to procedures described by Day (1965) (Table 3-1).
Sand used in each study was found to be slightly coated. According to the United States
Department of Agriculture, sands are considered to be slightly coated if they contain <
5% sand plus silt, but contain clay coatings. Harris et al. (1996) concluded the presence
or absence of clay coatings can be discrete and readily observable. Upon visual

36
inspection, coatings can be seen via their color, opacity, and rough surface texture. Sand
grain coating can include Fe & Al hydroxides, kaolinite, gibbsite, or goethite.
Water Use Efficiency Calculations
Water-use-efficiency was determined for each glasshouse study and the field study
according to eq. 3.5 as stated by Gregory et al. (2000). Dry matter yield for each week
was compared to the amount of water lost during that week as determined by weighing
each pot before and after each harvest.
WUE = dry matter yield (mg) / evapotranspired water (g) Eq. 3.5.
Estimations of water use assumed the density of water was 1 g cm-3 for each treatment,
and all water not evaporated was used by the turf.
Glasshouse Studies
Glasshouse studies were conducted from August to December 2002 and 2003 at the
University of Florida Turfgrass Envirotron in Gainesville, FL. The objectives of each
study were:
1. To determine the influence of soil amendments on WUE and quality of Tifdwarf bermudagrass
2. To determine the influence of incorporation method on WUE and quality of Tifdwarf bermudagrass
Year 1
The objective of this study was to determine the influence of soil amendments on
WUE, turf quality, and dry matter yield of Tifdwarf bermudagrass. Tifdwarf
bermudagrass [Cynodon dactylon (L.) Pers. × C. transvaalensis Burtt Davy] was
established during spring 2002 in a glasshouse on pots (203 mm wide at top, tapering to
175 mm at bottom, and 203 mm deep) using USGA-specified greens sand. Treatments

37
consisted of an amendment/sand mixture and incorporation method and were arranged in
a split plot design with 4 replications. Amendments included two zeolites [Ecosand (Zeo
Inc., McKinney, Tx.) (clinoptilolite 1); Ecolite (Ecolite Mfg Co., Spokane, WA)
(clinoptilolite 2)] which were determined to be clinoptilolite via X-ray diffraction, two
calcined clays [Soil Master Plus (Sport Turf Supply, Inc., Midland City, AL) (calcined
clay 1); Profile (Profile LLC) (calcined clay 2)], one calcined diatomaceous earth [Axis
(Agro Tech 2000, Norristown, PA) (diatomaceous earth 1)], one diatomaceous earth
[PSA (Golf Ventures, Lakeland, FL) (diatomaceous earth 2)], Canadian sphagnum peat,
Fe-humate (Vigiron, Winter Haven, FL), clay (montmorillonite), and sand.
Prior to establishment, each pot was saturated and allowed to drain for 24 h. Pot
weight after drainage was recorded and labeled as ‘pot capacity’. An overhead mist-
irrigation system was used during establishment. Percent cover ratings were taken after
week one and were subsequently taken at one week intervals until full coverage was
achieved. Percent coverage was considered to be that portion of the pot surface that was
covered by turf. Following establishment, irrigation ceased and all further applications of
water were done by hand. The primary study lasted 18 weeks and began once all pots
achieved 100 percent coverage and were uniform. However, data was only collected
from week 3 to week 15 due to inaccuracies during the first three weeks and decreased
growth during the last 3 weeks when decreasing daylight reduced turf growth.
Following establishment, all pots were uniformly fertilized with NH4NO3,
concentrated super phosphate (CSP), and muriate of potash (KCl) at 5 g N m-2, 2.5 g P m-
2, and 2.5 g K m-2 at week one and six. Micronutrients and sulfur (as sulfate) were

38
applied together using a commercially available micronutrient solution at a rate of 11.2
kg Fe ha-1.
One primary function of soil amendments is nutrient retention which, in turn, may
increase turf quality. A turf quality rating is a subjective measurement of overall turf
health and appearance, which is crucial when assessing turf aesthetic value and
playability. During the 12 week study, visual quality ratings were recorded on a weekly
basis on a scale of 1 to 9, where 9 = ideal, 5.5 acceptable, and 1 = completely dead or
dormant.
Twice weekly, pots were weighed and water was applied to bring each pot back to
90% pot capacity. The amount of water was recorded and labeled ‘applied water’.
Weekly, clippings were harvested by hand at 3 cm height, dried at 100 °C for 24 h, and
weekly harvested weight was recorded and labeled as ‘dry matter yield’.
Upon completion of the 12 week study, overhead irrigation was used to bring all
pots back to uniformity. Water applied was then stopped and pots were allowed to dry to
determine number of days to wilt.
The null hypothesis for the 2002 glasshouse study was soil amendments do not
influence turf quality, dry matter yield, or WUE.
Year 2
All materials and methods for the 2003 glasshouse study were identical to the 2002
glasshouse study with two exceptions. First, a bacteriacide used to clean glasshouse
cooling pads was unintentionally applied to one replication of the full incorporation
method, thus this replication was removed, reducing the total number of pots from 120 to
110. Secondly, three incorporation methods were used (Fig. 3-1). Incorporation method
one involved mixing each amendment with sand (85:15 v:v) prior to turf establishment.

39
Incorporation method two involved incorporating each treatment into an 85:15 sand/peat
rootzone after turf establishment. This was accomplished by removing 9 or 4 aerification
cores (20 mm wide × 100 mm deep on 50 mm centers) and back-filling each core with a
50:50 sand/amendment mixture. All procedures and sample analysis followed
procedures and sample analysis from the 2002 study.
The null hypotheses used during the 2003 glasshouse study were: 1. Soil
amendments do not influence turf quality, dry matter yield, or WUE, and 2.
Incorporation method does not influence turf quality, dry matter yield, or WUE.
203 mm
100 mm
203 mm
175 mm
Dia. = 20 mm
50mm
B. C. A.
Figure 3-1. Schematic diagram of pot set-up used in glasshouse studies showing side and
ent, and C = 9 tine aerification with 50:50 sand amendment.
top view of amendment incorporation methods where A = 85:15 sand/amendment, B = 4 tine aerification with 50:50 sand/amendm

40
Nutrient Leaching Study
The objective of this study was to determine the influence of soil amendments and
SMSA on NO3-- N, NH4
+-N, PO42- leaching in a golf course putting green. Twenty-four
lysimeters (2.54 cm diam. by 35 cm length) were constructed using polyvinyl chloride
(PVC). The top 30 cm of each lysimeter contained a USGA sand:peat mixture (85:15 by
volume) packed to a density of 1.33 g cm-3. During a preliminary study, turf grown in a
mixture of SMSAs and sand did not establish which may be a result of the biocidal
influences of cationic surfactants (Gilbert and Al-taae, 1985). Therefore, treatments were
placed below the rootzone in the bottom 5 cm (Fig. 3-2) and included one zeolite
[Ecosand (Zeo Inc., McKinney, TX] which was determined to be clinoptilolite via X-ray
diffraction, two calcined clays [Profile (Profile LLC), Soil Master Plus (Sport Turf
Supply, Inc., Midland City, AL)] and two controls (control 1 = top 30 cm sand/peat,
bottom 5 cm sand; control 2 = top 30 cm sand, bottom 5 cm sand). Each amendment was
either coated with HDTMA or remained uncoated. Surfactant coating consisted of
mixing a given amount of solid phase (according to each amendments CEC) with a
solution of 67 mmol HDTMA. Previous research has determined bi-layer formation
occurs when HDTMA equilibrium concentration after addition of a solid phase is at least
twice the CEC of the solid phase (Li and Bowman, 1997). Sorbed HDTMA was
determined via thermal gravimetry (Table 4-1). Lysimeters were then capped at each end
with TyparTM landscape fabric (Reemay, Inc. Old Hickory, TN) and sealed with a domed,
PVC cap. A 1-cm threaded hole was installed in the middle of each cap to allow a
nutrient solution tube to be added to the top and a leachate collection tube to be added to
the bottom of each lysimeter. Each lysimeter was vertically secured to a stand. The

41
nutrient solution tube attached to the top of each lysimeter was connected to a Gilson
Model 302 steady-flow pump (Gilson Medical Electronics, Inc., Middleton, WI). The
pump was set to deliver 10.0 ml of deionized water per minute. A valve was installed
between the pump and lysimeter to which a 10 cm3 syringe was attached to inject nutrie
solution. Nutrient solution contained 2300 ppm NO3-- N, 2480 ppm NH4
+-N, and 4400
ppm PO42-. Leaching procedure consisted of first saturating the soil column with
deionized water, injecting 10 mL of nutrient solution, and collecting leachate using a
model 273 fraction collector (Instrumentation Specialties
nt
Figure 3-2. Schematic diagram of lysimeter set-up used in leaching studies.
PUMP
Treatment Layer
H2O
30 cm
5 cm
2.54 cm
Pump Tube
Solution injection valve
42
Co.) set to take a sample every 60 seconds until four pore volumes had been collected.
Each column was leached individually within each block. d for
NH4-N and NO3-N using an Alpkem RFA-300 auto analyzer. Phosphorous was
determined colorimetrically using a model 680 microplate reader (Bio-Rad Laboratories,
Hercules, CA). Treatments were arranged in randomized complete block design with
three replications, and statistical analyses were performed using SAS for analysis of
variance (SAS Institute, 1987).
The following transport models were used to simulate movement of NO3-N, NH4-
N and P through s ts. The convective-dispersive model (CD model) can be
written in dimensi ner, 1958).
A. The Convective -Dispersive (CD) Model:
R (MC*/Mp) = (1/P) (M2C*/MX2) - (MC*/MX) 3.6a
P = vL/D R = (1+ρKD/θ) 3.6b
X = x/L p = vt/L C* = C/C0 3.6c
T = Pulse applied in pore volumes 3.6d
All samples were analyze
oil amendmen
onless form (Bren
where C* is the solute concentration in the effluent (C, µg/ml) normalized to the
0
ation
D
initial solute concentration (C , µg/ml), x is the distance along the column (cm), t is the
time of flow (h), v (cm/h) is the pore water velocity, L (cm) is column length, D (cm2/h)
is the hydrodynamic dispersion coefficient, P is the Peclet number, R is the retard
factor, and p is the pore volume, K (ml/g) is the sorption coefficient, ρ is the soil bulk
density, and θ is the volumetric water content.
B. The Two Site Nonequilibrium (TSN) Model:

43
The T
S 3.7a
where he
adsor
that is wa and ckwa first order so rate
coeffi
n
S 3.8c
3.8e
Other parameters (p, P, R, C* and X) in eq. 3.8a have been defined for the CD-model.
The P
reside rt,
due to sorption in the instantaneous domain, ω is a number that gives the degree of
SN model can also be described according to (Nkedi-Kizza et al., 1989). With first
order kinetics, the sorption occurs in two domains, such that:
C : S1W S2
1 = FKDC
dS2/dt = k1S1-k2S2 3.7b
S1(µg/g) is the adsorbed concentration in the instantaneous domain, S2 (µg/g) is t
bed concentration in the time dependent sorption domain, F is fraction of sorbent
at equilibrium, k1 and k2 are the for rd ba rd rption
cients (1/h), respectively, other parameters have been defined for the CD-model.
For an adsorbing solute the one dimensional equation at steady state water flow ca
be written in dimensionless form:
MC*/Mp + (βR-1) MC*/Mp + (1-β)R MS*/Mp = (1/P) (M2C*/MX2) - (MC*/MX) 3.8a
(1-β)R MS*/Mp = ω (C*-S*) 3.8b
where:
* = S2/(1-F) KDC0
β = [1+ F (ρKD/θ)]/R 3.8d
ω = k2 (1-β)RL/v
eclet number (P) reflects the ratio of the residence time due to dispersion and the
nce time due to convection emphasizing the effect of dispersion on solute transpo
the retardation factor (R) is the ratio of pore water velocity and solute velocity which
represents the effect of sorption on solute transport, β is the fraction of total retardation

44
sorption nonequilibrium for the solute, it reflects the ratio of the time for solute sorptio
to the residence time for the solute due to convection.
n
through curves (BTCs) using the non-linear least-
squar
1981)
The p P was calculated by fitting the CD-model to the BTCs of NO3-N for a
given
TSN-
Parameters for the CD-model (R and P) and for the TSN-model (R, β, and ω) were
calculated from the measured break
es optimization technique in the curve fitting program CFITIM (Van Genuchten,
. The parameter (T) was measured and as such was not optimized for either model.
arameter
amendment. The obtained value of P from the CD-model was then used in the
model as a fixed parameter.
The null hypotheses used during the nutrient leaching study were: 1) Soil
amendments do not decrease NO3-, NH4
+, or PO4-2 leaching, and 2) SMSA do not
decrease NO3-, NH4
+, or PO4-2 leaching.

CHAPTER 4
t Characterizations
Surfactant Sorption
Via thermal analysis, greater weight loss was observed from HDTMA calcined clay
1 than from HDTMA calcined clay 2 (Fig. A-2, A-3). HDTMA clinoptilolite showed the
least weight loss and thus sorbed the least HDTMA (Fig A-4). For each amendment,
increased weight loss due to oxidation of HDTMA began at approximately 230 ºC, which
corresponded well with oxidation of pure HDTMA which began at 250 ºC. Oxidation of
HDTMA from coated amendments was nearly complete at 300 ºC, which also compares
favorably with oxidation of pure HDTMA. Impurities inherent within SMSA likely
caused the minor differences between oxidation of pure and sorbed HDTMA. These
findings indicate the extent of HDTMA coating can be well described by thermal
gravimetry analysis.
Surfactant sorption capacity of each amendment can be seen in table 4-1. Although
clinoptilolite had a CEC 4 times higher than either of the calcined clays, it retained the
least amount of HDTMA. Several studies have shown the majority of CEC on
clinoptilolite is internal and inaccessible to HDTMA (Li et al., 1999; Li, 1999; Li and
Bowman, 1997). Following surfactant sorption, calcined clays retained approximately
one-half of their original CEC. Of the SMSA, calcined clay 1 retained the greatest
amount of HDTMA followed by Calcined clay 2 and Clinoptilolite 1 (Table 4-1).
RESULTS AND DISCUSSION
Amendmen
45

46
Table 4-1. Ion exchange capacity and surfactant sorption as influenced by soil amendment.
Solid Phase HDTMA Sorbed CEC† ECEC‡ EAEC§ -- (g kg-1) -- ol (+) kg-1 --- cmol (-) kg-1 ---- cmClinoptilolite 2 93.3 4.1 Calcined Clay 1 7 9.6 11.3 Calcined Clay 2 6 9.7 † Cation exchange capacity
7.1 97.4 3.4 20.9 2.9 21.8 12.1
‡ Effective cation exchange capacity § Effective anion exchange capacity
alcined
quartz than calcined clay 2.
.
Mineral Composition
Neither DE contained any discernable minerals (Fig. A-5). While definitive
analysis of DE mineral composition via XRD is ambiguous, the broad peaks observed
from both DEs around a d-spacing of 4.0691 are indicative of amorphous silica. Silica
contents of DE have been reported to about 86 to 88% (Sylvia et al., 1997).
X-ray diffraction analysis of calcined clays can be seen in fig. A-6. Both clays
contain quartz, goethite, and small amounts of mica. The only significant difference
between calcined clays is the quartz peak (d= 3.35), which is likely evidence that c
clay 1 contains more
Zeolites used in this study were concluded to be clinoptilolite based upon XRD
analysis (Fig. A-7). No other minerals were apparent in either zeolite sample.
Nutrient Composition
Because soil nutrient status has been shown to positively influence WUE (Viets,
1962; Hatfield et al., 2001), the initial elemental content of each amendment and
sand/amendment mixture was determined via Mehlich I and KCl extraction.
Sand/amendment mixture samples were taken from before turf sprigs were applied

47
Nitrogen
Only peat and iron humate contained detectable levels of N (Table 4-2). Nitrogen
ontent of iron humate was lower than that ob
3) determined the N content of a commercially available hum be
N content d ined in this stu uld b du iffe ent hum
While peat contained more TKN prior to incorporation with sand, both peat and
ual amounts after incorporation (Table 4-3). Incorporation of
sand
t levels were
obser
y
was found to contain low levels of P.
While quartz sand is largely considered to be inert, sand grain coatings have been shown
to increase P retention (Harris et al., 1996) and may be responsible for the observed P
levels. After incorporation with sand, P levels were diluted for all amendments except
iron humate (Table 4-3). Because samples were taken from field plots which were
encouraged to settle by using daily irrigation for 10 days, P from irrigation water (Table
A-1) may have been responsible for the increased P in the iron humate treatment.
Smectite contained the highest level of extractable P before and after sand incorporation.
Diatomaceous earths were the only amendments that did not increase extractable P levels
above the sand/peat mixture.
c served by previous researchers. Varshovi
and Sartain (199 ate to
0.85%. Lower eterm dy co e e to d r ate
sources.
iron humate produced eq
likely diluted any treatment influence, thus, no differences were observed.
Phosphorus
Extractable P did not follow any clear trends across soil amendment class.
However, in general, highest P levels were found in smectite while the lowes
ved in iron humate (Table 4-2). Iron-based water treatment residuals have been
shown to be effective long-term P immobilizers. Furthermore, much of the P sorbed b
water treatment residuals is internal and considered to be irreversibly bound (Makris et
al., 2004). As expected, the control (USGA sand)

48
le 2. e l pe s mendmen s u i as us nd ld studim e C pH † N K‡ C Mg‡ ‡ M C ‡
Tab 4- Ch mica pro rtie of a t sed n gl sho e a fieA endm nt CE † EC TK P‡
es. a‡ Zn n‡ u‡ Fe
cm
(+) k 1 µS c -1 % --- ----- -----ol g- m --- --- -- --- --- - m g-1 --- --- --- --- ------- ----- ----- g k ---- ----- ----- ----- ----- ----
San 1) 0. 9 0.0 3.2 2.6 Peat ) 114. 3 7 0.5 3.9 3.4 Calc ed c y 1 ( 21 4 20 0.0 3.2 3.7 Calc ed c y 2 ( 21 6 4 0.0 8.2 1 9.9 Clin tilolite 1 (4 97 5 814 0.0 5.1 4.8 Clin tilolite 2 (4 35 3 7 0.0 7.1 1.5
ace s ea 1 ( 7. 9 97 0.0 4.2 2.1 ace s ea 2 ( 34 6 18 0.0 8.6 1.5
tite (6 20 0 215 0.0 2.7 5.9 uma (7) 41 8 30 0.4 1.5 2 6.7
st: 2 ** * N *** NS S st: ot rs ** * ** *** *** ** st: 3 ** * N *** NS ** st: 4 ** * ** *** NS ** st: 5 ** * ** *** NS ** st: 6 ** * ** *** *** S st: 7 ** * ** *** NS ** st: 5 N * ** NS NS ** st: 7 ** * ** *** NS **
) 15 3.4 5.6 43.1 .4
d ( 7 5. 8.3 0 2 2 2.5 0. 3.4 (2 5 7. 6.9 5 5 276 40 3.5 1 0. 21.1 in la 3) .7 5. 1.3 0 3 99 76 28 4.9 1 0. 124.0 in la 3) .5 5. 8.0 0 5 12 74 39 3.9 0. 102.6 op ) .8 5. 5.0 0 1 76 238 17 2.2 0. 9.1 op ) .1 6. 2.2 0 10 59 184 87 3.0 0. 6.7
Diatom ou rth 5) 8 7. 9.3 0 2 11 16 78 2.3 1. 233.9 Diatom ou rth 5) .1 4. 1.1 0 4 67 125 79 3.1 0. 32.5 Smec ) .4 6. 4.0 0 65 9 516 29 1.0 0. 0.1 Iron H te .2 4. 0.3 2 68 687 45 5.8 6 2. 30.0 Contra 1 vs. * ** S N * ** NS * N *** Contra 2 vs. he * ** * * * ** NS ** *** Contra 2 vs. * ** S * * ** NS * * *** Contra 2 vs. * ** * * * ** NS * * *** Contra 2 vs. * ** * * * ** NS * ** *** Contra 2 vs. * ** * N * ** NS * N *** Contra 2 vs. * ** * * * ** * * ** *** Contra 3 vs. S ** * * N ** * * ** *** Contra 3 vs. * ** * * * * NS * ** *** CV (% .5 1.9 4 9.1 14 31.3 1 .1 9. 3.0
3.9 .5 9.3 8 .3 6.5 5 .3 7.5 3 .2 6.7 1 .7 4.5 2 .1 6.0 .1 7.7 2 .6 5.3 11 .2 3.3 3 .1
** * ** * ** * ** * ** * ** * ** * S *
** *
.9
0.2 1 3.9 1 4.7 2 3.4 1 6.2 1 5.0 2 2.3 3 7.7 8 1.3 0 5.4 3
** S ** * ** * ** ** * ** S ** * ** * ** *
3 2
NS, *, ** ot ifi si ifican t t 0.05 01 pr b ls, resp ively. **, * N sign cant, gn t a he , 0. , and 0.001 oba ility leve ect† 2:1 d oni ed wat soi‡ Meh 1 act
ein z er: l lich- extr able

49
se and field studies. A C ‡
Table 4-3. Chemical properties of 85:15 sand/amendment mixtures used in glasshoumendment EC pH† EC† TKN P‡ K‡ Ca‡ Mg‡ Zn‡ Mn‡ Cu Fe‡
cm
ol (+) kg-1 µS cm-1 % ------------------------------------------ mg kg-1 ---------------------------------------------
Sand (1) 0. 9 2 2 2 5 0.2 .1 1 1 3 0.5 .0 7 3 0.4 .1
2 7 1 5 1.4 .1 25 4 6 1.0 .1 16 9 1 7 1.4 .1
5. 6 5 0.9 .2 1 1 0 0.3 .1 1 3 6 0.5 .1 6 2 5 1.3 .0 7
N NS S * *** * N NS S * ** S N NS N NS S
** * N S NS
** *
3 1 .6 .9
7 5. 8.3 0.00 3.2 .6 3.9 .5 2. 0 3.4 Peat (2) 1.8
27. 23.7 0.03 3.5 2.3 276.9
107.6 1. 0 7.4
Calcined clay 1 (3) .7 6. 22.1 0.00 10.1 85.2 91.5 54.2 1. 0 33.9 Calcined clay 2 (3) .8 6. 26.6 0.00 6.6 66.8
349.7 47.9 1. 0 30.5
Clinoptilolite 1 (4) .7 6. 84.7 0.00 5.7 38.1 358.0 19.7 1. 0 6.3 Clinoptilolite 2 (4) .0 6. 13.5 0.00 15.7 15.9 228.8
136.2 3
5. 0 4.5 Diatomaceous earth 1 (5) 3 8. 36.2 0.00 8.3 45.8 98.8 6.6 1. 0 10.4 Diatomaceous earth 2 (5) .2 7. 27.1 0.00 3.9 5.9 46.1 7.9 3. 0 22.5
1Smectite (6) .3 6. 14.2 0.00 126.8 2
8.8 677.3 155.1 1. 0 2.4 Iron Humate (7) .4 6. 8.9
0.03 8.3 63.6
920.4 19.5 2. 1 3 99.5
Contrast: 1 vs. 2 S *** *** *** NS NS *** *** NS N NS Contrast: 2 vs. others ** *** *** *** *** *** NS *** NS ** *** Contrast: 2 vs. 3 S *** NS *** * *** ** *** NS N
N***
Contrast: 2 vs. 4 ** *** *** *** ** *** NS *** NS NS Contrast: 2 vs. 5 S *** *** *** NS *** *** *** NS * * Contrast: 2 vs. 6 S *** *** *** *** NS *** *** NS
SN NS
Contrast: 2 vs. 7 * *** *** NS *** *** *** *** N * ** *** Contrast: 3 vs. 5 S *** *** NS NS *** NS ***
*N * ***
Contrast: 3 vs. 7
* *** *** *** *** ** *** ** NS * ** ***
CV (%) 1.7 1.9 4.7 38.4 15.2 7.1 3.5 12.8 110.2 15 14 6.2NS, *, **, *** Not significant, significant at the 0.05, 0.01, and 0.001 probability levels, respectively. † 2:1 deinonized water:soil ‡ Mehlich-1 extractable

50
Potassi
e ehlich-1
extracta K of the pure amendment samples (Table 4-2). Calcined clays contained
higher l s of extractable K than zeolites which were followed by DEs. Sand contained
the e tained the highest. All amendments except
gher K levels than peat.
l tio
nd DEs. Sand and sand/peat treatments
tite increased
sand/peat treatment.
m
O pure amendment samples, highest Ca levels were found in iron mate
ecti able ). O emaining amendments, sand/peat contained
Ca lev in
rporation, Ca levels dropped for all amendments. Both iron humate and ectite
ary difference between Ca levels of amendments alone and amendment/sand
lites possessed lower Ca levels than peat before sand incorporation
ese results com
. (2003) where zeolite amended sand was found
e Ca levels as at mixtures both before and after turf establishment.
d t amendment
may be used when considering the pot
Howeve li il
um
nlik
ble
evel
st K
ll K
f the
U P, clear trends were observed between amendment classes for M
low levels while iron humate con
sand and smectite contained hi
the highest levels of K followed by CCs a
contained the lowest am
extractable K above the
Cal
followed by sm
hig
inco
con
prim
mixtures is that zeo
while they contained sim
favorably with those reported by Ok et al
to have the sam
With regards to initial retention of P, K,
clas
Ca.
A evels dropped after incorpora n with sand (Table 4-3). Zeolites contained
ount of extractable K. All amendments except smec
ciu
hu
and
sm
pare
C
te (T 4-2 f the r
her els than zeolites followed by CCs, DEs, and sand. Follow g s
tinued to exhibit the highest Ca levels after sand incorporation (Table 4-3). The
ilar Ca levels after incorporation. Th
san
f C
d/pe
Cs
an
zeo
Ca
en
tes
, th
tial influence of plant available K and
ma
es
y d
e re
ec
su
rea
lts
se
sho
pla
w
nt
tha
ava
ses
r, incorporation o or able a.
51
Phosphorus availability may increase with incorporation of CCs or zeolites, but it appears
that in
n,
e amendment samples were likely
leach
of 5.5
A-1).
Retention
ided
ter
olite 2
ples in
dividual amendments should be recommended instead of amendment classes.
pH and EC
Salinity levels dropped after incorporation with sand (Table 4-3). Because
sand/amendment samples were taken from plots that were allowed to settle by irrigatio
the excess salts which were initially observed in the pur
ed out of the soil media.
Soil acidity also became more basic after sand incorporation. Acidity levels
of pure amendments rose to near 6.5 after sand incorporation. This may also be due to
excess leaching with water high in Ca (Table
Moisture
Analysis of moisture retention data revealed incorporation of amendments prov
a variety of beneficial physical characteristics to a sand-based rootzone. Moisture
content at field capacity, moisture content at wilting point, and plant available wa
increased with the addition of soil amendments (Table 4-4). These parameters were
influenced primarily by the increase in total and micro porosity which accompanied
amendment incorporation.
Saturated hydraulic conductivity was found to be within acceptable ranges as
recommended by the USGA (Table 4-4). Diatomaceous earth 1 and 2 and clinoptil
reduced Ksat while all other amendments were similar to pure sand. Water flow in a
saturated soil is primarily through macropores (Hillel, 1998). However, this researcher
observed soils that produced the highest Ksat values also possessed the lowest
macroporosities. While this seems counterintuitive, McIntyre 1974 states that soils
prepared for Ksat analysis must be taken from undisturbed core samples. Core sam

52
this analysis were taken from recently renovated soils and, thus, physical analysis may
not entirely agree with analysis of undisturbed soils.
Soil porosities varied from 32.2 to 38.9% (Table 4-4). Only clinoptilolite 1 failed
to inc aving
. 4-1). Both CCs increased macroporosity above sand
while
h 1 and iron humate were shown to
ence, increasing microporosity from 7.7 to 15.6%. This is likely
due to
ge
arth
or plant uptake. Thus, correlation between microporosity and
plant was
y
t
rved from
rease total porosity above that of sand. This is likely due to clinoptilolite 1 h
the highest percentage of very course sand-sized particles (Table 3-1), and may explain
why clinoptilolite 1 was the only amendment that had a lower volumetric water content at
saturation than sand alone (Fig
all other amendments decreased macroporosity. The greatest influence of soil
amendments on porosity was observed in microporosity. All amendments increased
microporosity above sand alone. Diatomaceous eart
have the greatest influ
iron humate having the largest percentage by weight of medium and fine sand size
particles than any other amendment (Table 3-1). Diatomaceous earths contain a lar
number of internal channels which may contribute to the influence of diatomaceous e
1 on microporosity.
Of the water held in macro and micropores, only water held in micropores is
considered to be available f
available water should be high. The relation between microporosity and PAW
found to be well correlated (R2 = 0.83; Fig. A-8).
As expected, amendment incorporation increased moisture held at field capacit
and wilting point. Correspondingly, plant available water also increased with amendmen
incorporation. The greatest increase in moisture held at wilting point was obse
diatomaceous earth 1 where percent moisture increased by more than 8 times that of

53
Tabl -4. ys l analysi f a nd t/sand . - ------ Por ---
e 4 Ph ica s o me men-----
mixture at 85:15 by volumee Space ---- ----
Ame ent sat To Mi § M ¶ # D FC P § P ¶¶ h --- ---- - --- ---- -- --- cm --- -- -- --- --- ---
ndm K cm
†‡ tal r-1 ----- -----
cro acro PD B †† ‡‡ WP §% --- ----- ---- --- -- g -3 -- -- ------ ------ % - -----
AW ------
Sand 0 a 3.3 7. 25 bc 4 a 56 7. 0. f Peat 2 a 5.3 3. 21 d 3 b 37 3. 1. 1 b Calci cla 4 a 8.9 2. 26 b 9 a 39 2. 2. 1 de Calci cla 6 a 8.2 1 26 6 a 46 1. 3. f Diato aceous art 5 c 8.3 5.6 a 22 cd 7 a 40 5. 3. 1 b Diato aceous art 5 b 5.9 3.7 b 22 d 1 c 35 3. 2. 1 bc Clino olit 1 a 2.2 1.4 cd 20 4 b 45 1. 1 d e Clino olit 4 b 5.0 0.9 d 24 bcd 4 a 45 0. 1 e e Smec 3 a 6.2 3.1 b 23 bcd 9 a 52 3. 2 1 cd Fe-H te 7 a 6.7 5.5 a 21 2 a 47 5. 1. 1 a
CV ( 2 5.1 4.3 7 8 4.3 12With lu , m s fo ed the e r a t signific d ent ord to ca mu le ran te .05
61.66.
ned y 1 52.ned y 2 55.m e h 1 25.m e h 2 44.ptil e 1 63.ptil e 2 43.tite 71.uma 51.
%) 17.in co mns ean llow
b 3 b b 3 ab 1b 3 a 1b 3 a 1 3 a 1c 3 ab 1b 3 b 1c 3 ab 1 3 ab 1b 3 ab 1
by sam lette re no
7 e .6 a 2.3 1. a 7 e 4 f 5 b .8 c 2.1 c 1. f 1 5 b 2 e 5 bc .4 a 2.2 b 1. ef 1 5 bc 4 b
.2 cd .9 a 2.3 1. bcd 1 2 cd 4 a .6 b 2.2 bc 1. def 1 6 a 5 a .1 c 2.1 1. f 1 7 b 1 bc.7 d 2.1 c 1. cde 1 4 cd .9 bc.1 a 2.2 bc 1. cde 1 9 d .5 cd.1 a 2.3 1. ab 1 1 b .4 b .1 d 2.3 1. bc 1 5 a 4 de
.1 3.0 1. .8
antly iffer acc ing Dun n’s ltip ge st (0 ).
7.3 2.3 0.0 7.8 2.1 1.6 9.4 9.3 0.6 4.1
4.4
† saturated h au nd vit‡ US rec e 1 (n al) 30-60 (accelerated) cm § mic ore ore t c in water a c si¶ ma ore (pores t at ain air at 3 m t on)# part de y †† bu en‡‡ fie ap§§ pl t wilting po by me ¶¶ pl va e lume
ydr lic co uctiGA ommendations arrop s (p s tha onta
crop s h conticle nsitlk d sity ld c acity, by volume
an int, voluant a ilabl water, by vo
y 5-30 orm and
t 35 m ten on) 5 c ensi
hr-1

54
ion Head (cm)
0 60 8
olum
etric
Wat
e
0.0
0.1
0.2
0.3
0.4
re release curve for USGA sa
Suct
0 20 4
V
Figure 4-1. Moistu nd amvolume.
0 100
r Con
tent
(%)
SandClinoptilolite 1Clinoptilolite 2
ended with zeolites at 85:15 by

55
Suction Head (cm)
0 20 40 60 80
Volu
met
ric W
ater
Con
tent
(%)
1000.0
0.1
0.2
0.3
0.4
SandDiatomaceous Earth 1Diatomaceous Earth 2
Figure 4-2. Moisture release curve for USGA sand amended with diatomaceous earths at 85:15 by volume.

56
Suction Head (cm)
0 20 40 60 80
Volu
met
ric W
ater
Con
tent
(%)
1000.0
0.1
0.2
0.3
0.4
SandCalcined Clay 2Calcined Clay 1
Figure 4-3. Moisture release curve for USGA sand amended with calcined clays at 85:15 by volume.
57
sand. Interestingly, peat and iron humate contained two of the lowest moisture contents
at wilting point but had the two highest PAW contents. This indicates that in order to
have the greatest influence on PAW, amendment must not only increase water held at FC,
but must also decrease water held at WP.
Moisture release curves indicated incorporation of soil amendments with sand
increased moisture content and moisture retention. Diatomaceous earths (Fig. 4-2), as a
class, produced greater moisture retention than calcined clays (Fig. 4-3) or zeolites.
Zeolites were observed to have the least influence on moisture held at saturation and
moisture held against 50 cm of head (Fig. 4-1), which is likely due to zeolites also having
the least influence on total pore space (Table 4-4). This relation between available water
and porosity was also noted by Brown and Duble (1975). Waltz et al. (2003) observed
amendments with the lowest soil porosity were also observed to retain the least amount of
water against gravity. Waltz et al. further noted sand amended with peat produced more
suitable physical and hydraulic properties for turfgrass growth than either calcined clay or
diatomaceous earth. However, of the two inorganic amendments Waltz investigated,
diatomaceous earths were found to be the most suitable replacement for peat. These
observations by Waltz both agree and contradict those found during this research. When
only physical and hydraulic properties are considered, diatomaceous earths increased
moisture held against gravity above that of peat while providing similar or adequate
PAW and conductivity. Thus, diatomaceous earths are not only the most suitable
inorganics replacement for peat, but they are actually more suitable than peat.
Of the amendments used, Fe-humate produced the greatest beneficial influence on
the putting green rootzone physical properties. The observed increase in moisture held

58
against gravity (Fig. 4-4) was matched only by diatomaceous earth 1. Correspondingly,
Fe-humate amended sand produced the highest amount of plant available water while
maintaining adequate hydraulic conductivity and bulk density (Table 4-4).
Suction Head (cm)
me
cte
nt (
0.2
0.3
0
Fe-Humate
0 20 40 60 80 100
Volu
tri W
ar C
ote
n%
)
0.0
0.1
.4 SandPeatSmectite
85:15 by volume or with smectite at 97.5:2.5 by volume. Figure 4-4. Moisture release curve for USGA sand amended with peat or Fe-Humate at

59
Glasshouse 2002
Establishment
Analysis of turfgrass establishment revealed amendment influence was dependent
upon amendment source (Fig. 4-5). Pots containing clinoptilolite 1, diatomaceous earth
2, calcined clay 1, or calcined clay 2 did not change the establishment rating compared to
pots containing sand alone. Clinoptilolite 2, diatomaceous earth 1, and Fe-humate
decreased the rate of turf establishment while only peat and smectite increased turf
establishment above pots containing only sand. No amendment increased the rate of turf
establishment above pots containing the sand/peat mixture.
The influence of the zeolite treatment on turf establishment is in contrast to finding
reported by Nus and Brauen (1991). They reported plots containing zeolite were over
90% established 28 DAP while plots containing equal volumes of peat were 87%
established. Furthermore, they reportedly failed to establish turf on 100% sand plots.
However, Ferguson et al. (1986) reported decreased growth with the incorporation of
zeolite to pure sand. Findings by Ferguson are similar to those found by this researcher.
Because NH4NO3 was used as the sole source of N during establishment, and due to the
did not increase with zeolite incorporation because much of the N was sorbed out of soil
solution which effectively decreased the amount of plant available N.
Diatomaceous earths reacted similarly to zeolites with diatomaceous earth 2
producing nearly identical establishment ratings as sand alone and diatomaceous earth 1
lowering the turf establishment rate. While DEs tend to increase soil moisture, they have
low CECs which may be crucial during turf establishment. Nutrients applied during
establishment may be continually leached due to excessive water applications
affinity zeolites have for NH4 (Ferguson and Pepper, 1987), it is likely turf establishment

60
Days After P lanting
0
100
Sand
2D Graph 2
20
40
60
Peat
80
100
AxisPSA
0
20
Ecosand
D.
100 A.
40
60
40
60
80
EcoliteSand
B.
20
40
60
80
Soil M asterProfile
% C
over
0
80
100
M ontm orillonite
Iron Hum ateSand
0
20 Sand
C.
7 14 21 28 35
by (A.) zeolites, (B.) diatomaceous earths, (C.) clay and organics, and (D.) Figure 4-5. Establishment of Tifdwarf bermudagrass during summer 2002 as influenced
calcined clays. Vertical bars denote standard error.
42

61
which are typically applied during the first weeks of establishment (Shaddox, 2001).
Thus, low CEC rootzones may be more susceptible to nutrient depletions which may lead
to plant deficiencies and decreased growth.
Peat and smectite were the only amendments that increased the rate of turf
establishment above sand alone. The influence of peat on turf establishment has been
well documented and has been primarily attributed to the increase in moisture retention,
CEC, and additional nutrients which are mineralized from peat during the establishment
period (Bigelow et al., 2001b; Carlson et al., 1998). Smectite was found to produce high
moisture retention and possessed a CEC of 20 cmol(+) kg-1. These parameters may have
been sufficient to produce establishment equal to peat.
Turf Quality
Turf quality ratings were taken each week to assess overall turf health during the 12
week study (Table 4-5). Pots containing only sand produced the lowest quality turf while
pots containing calcined clay 2 and iron humate produced the highest quality. These
results correspond well with each amendment’s physical and chemical characteristics.
Sand exhibited low moisture retention (Fig 4-4) and low nutrient content (Table 4-3) and,
thus, pots containing only sand exhibit poor turf quality. Pots containing calcined clay 2
or iron humate were observed to increase soil moisture and nutrient content and, thus,
pots containing these amendments produced superior turf quality. Turf quality for the
inorganic amendments fit well within amendment classes. Calcined clays produced the
highest quality turf followed by DEs and zeolites. The low quality rating from pots
containing
zeolite incorporation. The influence of soil amendments on turf growth was investigated
zeolites are likely due to the low moisture retention which accompanies

62
Tabl 5. su ua ra g o er ag s a fl ce 85:15 d/ endm nt tz du g 2 glassh e s y. --- --- --- ---- --- --- --- Week ---- --- --- ---- ---- --- --- ------------
e 4- Vi al q lity tin f b mud ras s in uen d by- ----- ----- ----- ----- ----- ----- ---
san-----
am e roo one rin 200----- ----- ---- ----- ----- -----
ous tud-----
Treat 2 3 5 7 9 1 2 Mean Sand e 5. .7 de 5.0 4 7 f 4 0 d 5.0 2 d 5.
ment 1 4 64.7 1 ef 4 e 5.7 b .7 b
4.
8 10 1 .7 c 5. d 5.1 c
1 5. 0 e
Peat 8 bcd 6. cd .1 2 bcd 6.6 6 c 2 c 6 7 a 5 bc 6.3 5 b 6.Calci cla a 6. .8 bcd 6.7 7 b 1 a 7 6 a ab 7.6 1 a 6.Calci cla a 7. .3 abc 7.0 7 7.2 a 7 1 a ab 7.5 3 a 7. Diato eo rth ab 5. ef .3 2 bcd 6.6 6 c 6.5 b 6 b 5 b 3 bc 6.3 1 c 6.Diato eo rth cd 6. de .6 cde 6.5 6 c 7.0 a 6 5 6 bc 6.1 ab 6.Clino lit e 5. .1 e 5.6 5 5.7 d 5 1 c cd 6.2 2 c 5Clino lit de 5. f .5 de 5.6 5 5.6 e 5 3 c 6.3 1 c 5Smec ab 6. c .3 ab 6.8 6 6.1 d 6 b 1 a b 6.5 3 b 6Iron ate a 7. .1 a 6.8 7 7.3 a 7 5 a a 7.8 6 a 7. CV ( ) 5 9.0 7. 8.1 5 8. 9. 3 Withi lu m followed b he e l ar t s ica di en rding to ca mu le ran te .05
5. 5 ab 6 cd 6. a .2 bned y 1 6.8 8 ab 6 abc 6.3 a .0 aned y 2 7.1 1 a 7 a 6.7 a .6 amac us ea 1 6.3 c 7 cd 6 bcd 6. a .3 bmac us ea 2 5.7 0 bc 6 abc 6.0 a .3 bptilo e 1 4.8 0 f 5 e 5.2 b .6 cptilo e 2 5.3 6 de 5 de 5.8 b .8 ctite 6.6 6 ab 6 bcd 7.0 a .0 c
Hum 7.0 1 a 7 ab 7.2 a .3 a
% 9.0 9. 8.3 0 9.1n co mns, eans y t sam etter e no ignif ntly ffer t acco
6.7.
de .2 b 6. bc 6. b b .1 a 6. bc 7.1 a b .3 a 7. b 7.2 a cd .6 a 6. c 6. b bc .0 b 6. bc 6. b e .8 b 6. 5.8 b .8 b 6. bc 6.1 b e .7 a 7. b 6.3 c b .5 a 7. 7.8 a
8. 6 8.7 5Dun n’s ltip ge st (0 ).
6. c 3 c 7. b 9 b 7. 2 ab6. 3 c 6.8 c 3 c 6. .6 d 6. .8 d 6. c .5 c 7. 3 a
7.7 .2

63
by W ti
rporation with na soil and concluded that improvement in bermudagrass
increases in soil moisture. Overall, these findings
le 000). Miller (2000) investigated several
endments along with peat a reported turf may perform differently when
o t only reported little
nces d e amendments performed
ly to pots amended with pur n n this researcher’s study, all amendments
a ifferences between the two
are m h amendments were incorporated into the
z were introduced by first aerifying and then
ay have decreased the
e d ne and may have decreased each amendments
ce on turf growth.
U
o d c li ld ed water, or WUE were observed between
nd sand/peat rootzones (Table 4-6). Only zeolite amended pots failed to increase
4NO3) and to the affinity
e for NH , it is likely that as ch as ½ of the applied N may have been
ered e, th plant growth was hindered. Absorption of
4 by zeolite amended soils has been observed by Bigelow et al. (2000). They also
with zeol ere less effective during turf establishment
noted this apparent negative
ehtje et al. (2003). They inves gated the influence of zeolite, DE, and CC
inco
perf
agr
inorganic am
gro
diff
sim
increased tu
stu
roo
back-filling those holes w
hom
infl
Wa
san
WUE above
zeolites hav
rend
NH
noted that rootzones am
than those am
tive
ikeorm
ee
wn
ere
ilar
dies
ting
og
uen
ter
N
d a
ance is most l ly related to
with findings reported by Mil r (2
nd
ver, Miller (2000) no
observed som
d. I
The reported d
tzo
pli
mu
us,
ite w
in various rootzone media. H we
between amen ments, but also
e sa
rf quality above that of s nd.
lik
e.
ely
A
du
me
e
nd
to
me
the
nts in Miller’s study
ethod in whic
on
ith each amendment. This m
neity of the amendment/san roo
se Efficiency
ifferen es in c pping yie , ap
that of sand/peat. Due to the source of N used (NH
4
le inaccessib to plant uptak
ended
ended with peat. Other researchers have also
64
Table 4-6. Tissue yield, applied water, and water-use-efficiency of Tifdwarf
study. bermudagrass as influenced by soil amendments during glasshouse 2002
Rootzone Mixture† Clipping Yield Applied Water WUE‡ (g) (ml) (mg g-1)
Peat (2) 3.8 3628.3 1.1
Calcined clay 2 (3) 5.9 4210.8 1.4
Diatomaceous earth 2 (4) 5.9 4298.3 1.4
Clinoptilolite 2 (5) 4.4 3858.5 1.1
Iron Humate (7) 4.7 3215.5 1.5 Contrast: 1 vs. 2 NS NS NS Contrast: 2 vs. others *** ** *** Contrast: 2 vs. 3 *** *** ***
Contrast: 2 vs. 5 NS NS NS
Contrast: 2 vs. 7 *** ***
Contrast: 3 vs. 7 *** *** NS
CV
Sand (1) 3.4 3363.3 1.0
Calcined clay 1 (3) 6.5 4453.3 1.5
Diatomaceous earth 1 (4) 5.5 4376.8 1.3
Clinoptilolite 1 (5) 4.1 3544.8 1.2
Smectite (6)§ 4.6 3677.3 1.3
Contrast: 2 vs. 4 *** *** ***
Contrast: 2 vs. 6 ** NS * ***
Contrast: 3 vs. 4 * NS *
8.0 3.9 7.4
NS, *, **, ***, Not significant, significant at the 0.05, 0.01, and 0.001 probability levels, respectively. † 85% USGA uncoated sand plus 15% amendment by volume ‡ Wat§ 2.5% by volume
een
,
er Use Efficiency = clipping yield / applied water
characteristic inherent in natural zeolites and attempted to overcome them by using
zeolites which have been pre-loaded with NH4. Incorporation of these products has b
shown to lead to rapid establishment and high quality turf (Andrews et al., 1999; Miller
2000). Therefore, it is reasonable to assume the low clipping yield and WUE produced
by the zeolite treatment was due to the removal of plant available N. However, if this is
the case, it is also likely that over time, the zeolite will come to equilibrium with NH4 in

65
soil solution and, thus, provide a buffer for plant consumption when NH4 in soil solution
is low.
Calcined clays and iron humate were ally effective a roduced the greatest
in turf WUE (Table 4-6). This is likely due to CCs and iron humate providing
plant available P and K (Table 4-3) and m retention (F -4).
d in order of decr g effectivene : iron huma
> zeolites = peat = sand.
s that produced the greatest increase in W those ame ents
equate moisture retention and adequate CEC a nitial n trient tent.
ncrease PAW comparable to that of inorganic ents (Table 4-4),
ease CEC, available P, or ove that provid y sand alone le 4-
nd is also clear regarding ites. Zeolites no ly increased t
ove all other amendments, but they also provide adequate P and the
est amount of K. However, zeolites h e lowest influe n moisture held at
. According to these findings, in order to maximize turf WUE by
st be able to increase moisture
tention, provide adequate available nutrients, and retain those nutrients via cation
increase. Iron humate was the only amendment that produced higher establishment
equ nd p
increase
both an increase in oisture ig. 4
Rootzone mixtures ranke easin ss were te = CCs
> DEs = smectite
Amendment UE were ndm
that provided ad nd i u con
While peat did i amendm
peat did not incr K ab ed b (Tab
3). A similar tre zeol t on he
rootzone CEC ab
high ad th nce o
field capacity
incorporating soil amendments, the amendment mu
re
exchange.
Glasshouse 2003
Establishment
During the 2003 establishment phase, all amendments increased turf establishment
rate above that of pots containing only sand (Fig. 4-6). Peat and iron humate produced
the greatest increase in establishment while pots containing smectite produced the lowest

66
Days After Planting
0
20
40 Calcined Clay 1Calcined Clay 2Sand
% C
ovr
0
100
Peat
40
60
80
0
20
40 Clinoptilolite 1
Sand
A.
B.
D.
100
100
60
80
Clinoptilolite 2
60
80
100
e
20
40
60
80
Smectite
Fe-HumateSand
0
20
Diatomaceous Earth 1Diatomaceous Earth 2Sand
C.
7 14 21 28 35 42 49
by (A.) zeolite, (B.) diatomaceous earths, (C.) clay and organics, and (D.) Figure 4-6. Establishment of Tifdwarf bermudagrass during summer 2003 as influenced
calcined clays. Vertical bars denote standard error.

67
ratings than pots containing sand/peat. These findings are different than those found
during the 2002 study in which only peat and smectite produced higher rating than pots
containing only sand. While the reason for this difference is unknown, difference
between irrigation manifolds between the two studies may have allowed more water to be
applied during the 2002 study, thus decreasing the influence of each amendments
moisture retention capabilities.
No inorganic amendment produced higher establishment ratings than did pots
containing sand/peat. These findings agree with those reported by Bigelow et al. (1999).
They investigated the influence of CCs, DEs, and zeolites on turf establishment and also
reported that no inorganic amendment produced faster establishment than peat.
As in the 2002 study, differences between establishment rates of inorganic
amendments were minimal. All pots containing organic or inorganic amendments were
fully established at 42 days after planning (DAP). This is over 7 days longer than the
2002 study. This may also be due to the different irrigation manifolds used between the
two studies.
Turf Quality
Upon analysis of turf quality, turf grass response was dependent upon the method ×
treatment interaction (Table 4-7). Therefore, amendment influences were determined
within each method.
Analysis of turf quality as influenced by sand/amendment mixtures revealed quality
was dependent upon amendment type (Table 4-8). All amendments increased turf quality
above that of sand alone. However, only CCs and iron humate increased quality above
pots contai g
ning sand/peat. Amendments influence on turf quality in order of decreasin

68
Table 4-7. Analysis of variance of mean squares on turf quality during 2003 study as
Source of Variation df Mean Squares F value
Method (M) 2 0.54 1
Amendment (A) 9 2.11 66.28 ***
Error (b) 72 0.03 Total 109
4.35 *** Error (a) 5 0.03
A × M 18 0.40 12.60 ***
*, ***, Significant at 0.05, 0.001 probability levels, respectively.
influenced by incorporation method and amendment type.
Block 3 0.10 2.79 *
effect . As
isture
has b ent and
0)
ster establishment for seeded bentgrass than soil amended with inorganic
igelow et al. (2001b) also determined that improved turf quality of
amen
ty. This is clearly observable in the case of DEs. Diatomaceous
earths produced 30% more PAW than CCs (Table 4-4), but DEs produce quality ratings
nearly 1 unit lower than CCs. Clearly available water is not the only variable dictating
the influence of amendments on turf quality. It seems more likely that the combination of
available water and nutrient content of amended rootzones was the primary influencing
factor during this study.
iveness followed: iron humate > CCs > smectite = peat = DEs > zeolites > sand
observed during 2002, iron humate produced superior turf quality above all other
amendments. This is likely due to the iron humate providing background levels of P and
K, but more importantly providing the greatest amount of PAW (Table 4-4). Mo
een noted as being the primary limiting factor when assessing turf establishm
quality. Bigelow et al. (1999) stated moisture appeared to be the main limiting factor
when assessing amendments influence on turf establishment. Waltz and McCarty (200
hypothesized that more moisture held near the soil surface by peat-amended soils
provided a fa
amendments. B
ded sand rootzone was due to higher water holding capacities. However, according
to findings by this researcher, moisture content may not be the primary variable
influencing turf quali

69
udagrass as influenced by 85:15 sand/am en ot e during 2003 glasshouse study. - -- -- --- -- --- --- --- W -- -- --- --- --- ------- Table 4-8. Visual quality rating of berm endm t ro zon
----- ------ ----- ------ ----- ----- ----- --- eek ------ ----- ----- ----- ----- ----------------------------- Tr en 1 3 6 7 Mean Sa 6 d 4.6 e 5. 8 f 4 4.8 4 0 e d 4.
eatm t 2 4 5 8 9nd 4. e 4.8 d 5.1 0 e 4. e 4.8 .8 e e
10.8 d
5.
11 15.0
2 8 e
Pe 3 b 6.3 1 bcd 6. d 6 c 6 d 6. 6 c 6.5 c 6 bc 6.Ca ed 1 1 ab 6.6 b 7. 0 b 7 b 7.1 7 7.6 a 7.3 abCa ed 2 0 a 7.3 b 7. c 3 b 7 bc 7.1 7 7.3 abc 7.1 abDi ac s e 1 5 3 bc 6.3 1 bcd 6. 6 8 bcd 6 cd 6. 6 6.3 cd 6.0 c Di ac s e 2 0 0 bc 5.8 cd 6. 5 6 bcd 6 d 6. 6 c 6.5 cd 6.6 bc Clinoptil 1 6 d 5.0 de 5. 8 e 6 6.0 6 6.0 d 6.1 c Clinoptil 2 3 cd 5.3 de 5. 6 e 6 .1 6 6.3 cd 6.1 c Smectite 6 bc 6.3 bc 6. d 0 d 6 cd .0 6 6.8 bcd 6.8 abc Iron Hum 3 a 7.5 a 7. 5 a 7 .6 8 8.1 a 7.6 a CV (% 7.4 8.6 1 4 8 7. 8 6. 6 8.4 7.1 Within co ns an e same letter are not sign ican di n r ca m le e test
at 6. bc 6.5 b 6. 6 bc 6. abc 6.3 de .3 c 5 bcd lcin clay 7. ab 6.8 ab 7.0 1 ab 7. ab 7.1 .3 a ab lcin clay 7. ab 7.5 a 7.0 0 ab 7. ab 7.0 c .1 a ab atom eou arth 6. abc 6. b 6. 5 cd 6. abc 6. .6 b 3 bcd atom eou arth 6. cd 6. bc 6.0 e 1 d 6. bcd 6. .3 c 3 bcd
olite 4. e 4.6 cd 5.3 5 e 5. cd 5.8 .0 d d olite 5. de 5.5 cd 5.6 5 e 5. de 5.8 .0 d 6 cd
6. abc 6.3 b 6.8 6 bc 6. cd 6.1 e .8 b 7 abcate 7. a 7.5 a 7.8 3 a 7. a 8.0 .8 a 7 a
) 8.0 7. . 6 6.4 7. 8
lum , me s followed by th if tly ffere t acco ding to Dun n’s ultip rang
.6 b.3 b.3 b.3 c
.6 b.1 c.1 c.1 c.1 a
.7(0.0
d b
6. 4 c 7.1 b 7.1 b 6.4 c 6.3 c 5.5 d 5.8 d 6.5 c 7.7 a
4.3
5).

70
ality were observed between amendments when
ndments were incorporated after 4 tine aerification (Table 4-9). All amendments
e eptable quality ratings. During the aerification
the r st arily of sand/peat mixture. This likely decreased the
endments on turf quality, thus pots modified with sand, DEs, and zeolites
only sand/peat. Only CCs,
te, a p ed ratin higher than pots modified with pure sand.
t quality ratings were observed fr iron humate amended pots followed by CCs.
ents were fully incorporated into the
r a eans were observed when amendments
rp ificatio an after 4 tine (Table 4-10). This result was
ated and is most likely due to a la
us the 4 tine. Only diatomaceous earth 1
to in se tu lity above that of pots modified with only sand. As in the full
e ods, humate produced the highest quality turf
umate can positively influence
da w when uate N is available. Sartain attributed
dagrass response to the addition of iron which accompanies iron humate
N, in iron humate is likely the cause of the
Minimal differences in turf qu
ame
pro
stu
influence of am
pro
sme
Hig
This trend was also observed when am
rootzone.
were inco
antic
each treatm
fail
mix
followed by CCs. Sartain (1999) rep
berm
berm
incorporation. The increase in Fe, along with
observed increase in
duc
dy,
du
cti
hes
G
ip
ed
tur
u
u
d turf above the minimal acc
ootzone consi ed prim
ced quality ratings equal to that of pots containing
nd iron humate roduc gs
om
ent m
n th
rge portion of the rootzone being replaced by
iron
iron h
adeq
endm
eater difference between tre tm
orated after 9 tine aer
ent in the 9 tine aerification vers
crea
4
rf
er
qua
ifiand tine a cation meth
orted
grass gro th and quality
turf quality.
71
t ae cat d g 3 sh e s y. --- --- ---- ---- --- --- --- --- eek ---- --- --- --- ---- --- --- ---- -Table 4-9. Visual quality rating of Tifdwarf bermudagrass as influenced by 4
-- ----- ----- ---- ----- ----- ------ ----- -- Wine rifi ion urin 200 glas ous tud ------ ----- ----- ----- ----- ----- ----- ----
Treatment 4 5 6 7 9 1 2 m Sand 2 bc 6. b 6. 0 b .2 6 5 b 6 .6 7 bc 6.
1 2 3 6. 3 a 6.5 0 b 6. 6.3 a 6
8 10 1 1 ean b .6 b 6. c .3 b 6 abc 6. 3 d
Peat 3 bc 6. b 6. 5 a .3 b 6 b 7 6 .0 5 b 6. d Calcined clay 1 ab 6. b 6. 8 a .3 b 7 b 2 c 7 .3 0 a 6. Calcined clay 2 bc 6. ab 6. 5 a .8 ab 6 0 a 6 .3 0 a 6.Diatomaceous eart 2 bc 6. b 6. 2 a .2 b 6 5 6 b .1 5 b 6.Diatomaceous eart c 6. b 6. 0 b .6 b 6 5 6 b .7 0 a 6.Clinoptilolite 1 bc 6. b 6. 6 a .3 b 6 3 b 6 .5 3 b 6.Clinoptilolite 2 c 6. ab 6. 6 a .1 b 6 7 b 6 .6 1 c 6. Smectite bc 7. ab 6. 2 a .5 b 7 b 7 b 6 .6 7 b 6. Fe-Humate a 7. a 7. 1 a .5 b 7 5 a 7 .3 6 a 7. CV (%) 6. 8. 6 .2 6.5 7. 6 1Within columns, means followed b the e r a t s fic d ent ord to Dunca mu le ran te .05
6. 5 a 6.6 3 b 6. b 6.7 a 66.7 6 a 6.5 8 ab 6. b 6.3 a 66.3 7 a 6.8 8 ab 6. b 7.0 a 6
h 1 6. 2 a 6.5 2 b 6. b 6.8 a 6h 2 5.7 2 a 6.2 3 b 6. 6.6 a 6
6.1 5 a 6.1 1 b 6. b 6.6 a 66.0 7 a 6.7 5 b 6. b 7.1 a 66.3 0 a 6.7 2 ab 6. b 6.3 a 67.1 0 a 7.5 6 a 7. 7.1 a 7
6.5 7 7.5 1 8. 7.5 7y sam lette re no igni antly iffer acc ing
.7 a 6. bc .2 b 7 ab 6. c 5 bc
.0 a 6. .0 ab 6 bc 7. b 6 bc
.5 b 7. b .7 ab 6 bc 7. b 7 b
.5 b 6. bc .6 a 6 c 6. c 4 d
.3 b 6. bc .7 a 6 abc 7. b 4 d
.6 b 6. c .6 ab 6 bc 6. c 4 d
.6 b 6. c .5 ab 6 abc 6. 5 cd
.1 a 6. c .7 ab 6 abc 6. c 6 bc
.5 a 7. .3 a 7 a 7. 3 a
7.4 7.8 6 6. .8 n’s ltip ge st (0 ).

72
T
able 4-10. Visual quality rating of Tifdwarf bermudagrass as influenced by 9 tine aerification during 2003 glasshouse study. - -------------------------------------------------------------------- Week --------------------------------------------------------------------
reatment 9 0 1 2 3 4 5 6 7 8 1 1 1 mea fand 0 c 2 d 5.8 d 6.1 c .1 b .1 c .0 d 6.0 6.6 6. 6.5 b 6.7 b 6.2
eat 5 abc 3 d 6.5 c 6.8 bc .6 ab 8 abc .6 bc 6.5 b 7.0
6. 6.6 b 6.3 b 6.5 cbalcined clay 1 8 ab 5 bcd 6.8 b 7.0 ab .8 ab .6 bc .7 bc 6.8 a
a6.3 6.8 6.6 7.1 a 6.7
alcined clay 2 6 abc 3 a 7.2 ad
6.6 bc
.5 ab .1 ab .7 bc 6.6 6.7 6.8 6.5 6.7 b 6.8iatomaceous earth 1 5 abc 1 d 6.0 6.3 bc .2 b .8 ab .8 b 6.6 6.3 5.8 6. 6.3 b 6.3iatomaceous earth 2 3 abc 3 cd 6.5 c 6.6 bc .2 b .5 bc .6 bc 6.3 6.6 6.7 6.6 b
ab6.7 b 6.5
linoptilolite 2 1 bc 2 d 6.3 c 6.3 bc .3 ab .0 ab .1 cd 6.5 6.8 6.1 6.8 6.8 ab
6.4linoptilolite 1 8 c 5 bcd 5.8 d 6.2 bc .7 ab .0 ab .3 bcd 6.5 6.5 6.6
6.5 b 6.6 6.4
mectite 6 abc 0 abc 7.0 aba
6.7 bc .0 ab .5 bc .5 bcd 6.8 a a
6.8
6.8 6.6 b5 a
6.8 aa
6.7 e-Humate 1 a
1 ab 7.5 7.6 a .2 a .3 a
.7 a
7.5
7.3 7. 7. 7.6 7.4
V (%) 7.7 .0 5.9 7.0 8.1 6.4 .9 8.7 6. 6. 7. 7.1 1.ithin columns, means followed by the same letter are not significantly different according to Duncan’s multiple range test (0.05).
T 1 2 n S 6. 6. 6 6 6 b b 3 bc P 6. 6. d 6 6. 6 ab 3 bc d C 6. 6. c 6 6 6 b b b b b c C 6. 7. b 6 7 6 b ab b b b D 6. 6. 6 6 6 ab b c 2 b ef D 6. 6. d 6 6 6 d b b b de C 6. 6. d 6 7 6 b ab bc b de C 5. 6. 6 7 6 b b bc de S 6. 7. c 7 6 6 b ab b b bc F 7. 7. 7 7 7 a 7 a a
C 6 5 5 9 8 9 W

73
Days
In ord furthe t ine the influence of soil amendments on turf growth,
pplication was stopped at the end of the study and days-to-wilt (DTW) was
thod × treatment interaction was not
cant. Therefore, treatments effects were averaged across methods (Table 4-11).
4 f mean squares on Tifdwarf days to wilt during 2003 n ation method and amendment type.
Source of Variation Mean Squares F value
to Wilt
er to r de erm
wat
observed. U
sig
Ta
er a
nifi
ble
pon analysis of DTW, the me
-11. st
Anud
alyy a
siss i
onfl
f vuen
arice
ancd b
e oy i corpor
df BloMethod (MErroAmendmeA × M ErroTo
ck
r (a
r (tal
3 2 5 9
18 72 09
5.07 1.78 4.90 1.72
) 2.84 nt (A) 3.10 0.78
5.05 1.26 b 4.00
1
)
)
am
hum
considered s
(20
ear
Mi
lack of differences betw
amendm
versus full incorporation
T
endm
ate and diatom
00)
ths,
ller
urf pots ng sand at was observed to wilt at 8.9 days. No
ent increased DTW above sand/ t (Table 4-12). While turf grown with iron
ll f t. Thes e reported by Miller
. Miller observed turf grown in p iatomaceous
a e reach DTW as pots containing sand/peat.
observed only sand and one zeoli eatment reduced DTW below sand/peat. The
ethod in which
ents were inco orated. When am ents were incorporated after aerification
ce of endment on dry matter yield and WUE
grown in containi /pe
pea
erved to extend DTW to 9.8, it was not
e findings agree with thos
ots containing calcined clays, d
e to
te tr
is likely due to the m
endm
each am
aceous earth 1 was obs
tatistica y signi ican
nd zeolites required the sam tim
een amendments
rp
, the influen

74
was reduced (Table 4-14, Table 4-15). If full incorporation were the only method
85:15 sand/amendment rootzone during 2003 glasshouse
Treatment Days to Wilt
analyzed, amendments may influence DTW.
Table 4-12. Days to wilt of Tifdwarf bermudagrass as influenced by
study.
--- d ---- Sand (1) 9.1
8.9 Calcined clay 1 (3) 8.8
DiatomaceoDiatomac 9.4
ilolite 1 (5) 9.0 2 (5) 8.0
9.0 9.8
1 vs. 2 NS
st: 2 vs. others NS ontrast: 2 vs. 3 NS
NS NS
ContContContrast: 3 vs. 4 NS
Peat (2)
Calcined clay 2 (3) 9.3 us earth 1 (4) 9.8
eous earth 2 (4) ClinoptClinoptilolite
(6) Smectite Iron Humate (7) Contrast: ContraCContrast: 2 vs. 4 Contrast: 2 vs. 5
rast: 2 vs. 6 NS rast: 2 vs. 7 NS
Contrast: 3 vs. 7 NS
CV (%) 21.6
Water Use Efficiency
Upon analysis of WUE for the 2003 study, Tifdwarf WUE was dependent upon the
method × treatment interaction (Table 4-13). Therefore, amendment influences were
determined within each method.
As observed in the 2002 study, no differences in mean clipping yield, applied
water, or WUE were observed between sand and sand/peat rootzones (Table 4-14). This
was unexpected due to the greater amount of PAW retained in the peat amended rootzone
versus sand alone (Table 4-4), as well as larger quantities of TKN, Ca, and Mg found in
75
Table 4-13. Analysis of variance of mean squares on Tifdwarf water use efficienc
type.
y during 2003 study as influenced by incorporation method and amendment
Source of Variation df Mean Squares F value Block 3 0.001
2 0.853 0.72
Method (M) 385.88 *** Error (a) 5 0.002 Amendmen 9 0.287 139.13 ***
× M 18 0.084 41.00 *** 72 0.002
109 .05, 0.001 probability levels, respectively.
t (A) AError (b) Total *, ***, Significant at 0
eat amended pots (Table
rmud
eported by Come
mendments with
r wh
p 4-3). These findings contradict those found by Snyder (2003)
who reported a 32% increase in clipping yield of be agrass when peat was
incorporated into an uncoated sand-based rootzone. However, similar findings were
r r (1999) who investigated the incorporation of a variety of soil
a and without peat into a sand-based putting green. Comer reported that
pots containing amendments produced less dry matte en peat was incorporated than
when peat was withheld. Similar trends were observed between the control containing
only sand and the control containing sand/peat. Differences were attributed to N
mobilization by microbes in the sand/peat pots which would effectively reduce plant
upply of C relative to inorganic N is provided by peat, N
consu
d/peat (Table 4-14). Explanations for this response
regard on.
im
available N. If a large s
mption by microbes will be stimulated (Pierzynski et al., 1994).
Only pots amended with zeolites failed to produce clipping yields and WUE
ratings above pots containing san
ing NH4 immobilization by zeolites have been addressed in the preceding secti
Zeolite- amended pots required 17% more water to produce essentially the same biomass
as sand/peat pots. During both the 2002 and 2003 studies, zeolite amended pots did not
produce quality ratings, clipping yields, or WUE ratings superior to that of peat. These

76
Table 4-14. Tissue yield, applied water, and water-use-efficiency of Tifdwarf influenced b lly incorpo dments du
glasshouse 2003 study. zone Mixture† Clipping Yield Applied Water W
bermudagrass as y fu rated soil amen ring
Root UE‡ (mL) )
and (1) 3.5 3181.8 .1 3.6 2986.1
alcined c 4.7 2745.1alcine 5.0iatomaceous earth 1 (4) 4.9
(g) (mg g-1 S 1Peat (2) 1.2C lay 1 (3) 1.7 C d clay 2 (3) 3325.6 1.5
3037.5 1.6 iatomaceous earth 2 (4) 4.4 3176.2 1.4
Clinoptilolite 1 (5) 3.8 3478.8 1.1
Smectite (6)§ 4.5 2522.2 1.8
DD
Clinoptilolite 2 (5) 4.2 3516.7 1.2
Iron Humate (7) 7.1 3925.0 1.8
Contrast: 2 vs. others *** *** **
Contrast: 2 vs. 4 ** NS **
Contrast: 2 vs. 6 * ** ***
Contrast: 3 vs. 4 NS NS NS
CV (%) 11.2 5.9 6.NS, *, **, ***, Not significant, significant at the 0.05, 0.01, and 0.001 probability levels, respectively. † 85% USGA uncoated sand plus 15% amendment by volume
§ 2.5% by volume ‡ Water Use Efficiency = clipping yield / applied water
results suggest zeolite is not a suitable replacement for peat in sand-based putting greens
if increasing turf quality or WUE is desired. However, zeolites may be considered as an
amendment to increase putting green CEC (Table 4-3).
No differences in applied water were observed between peat and CCs and peat
and DEs, yet differences were observed between clipping yield and WUE (Table 4-14).
Because the same amount of water and nutrients were applied to CCs, DEs, and peat
Contrast: 1 vs. 2 NS NS NS *
Contrast: 2 vs. 3 *** NS ***
Contrast: 2 vs. 5 NS ** NS
Contrast: 2 vs. 7 *** *** ***
Contrast: 3 vs. 7 *** *** * 8

77
Table 4-15. Tissue yield, applied water, and water-use-efficiency of Tifdwarf bermudagrass as influenced by soil amendments after 9 tine aerification
Roduring glasshouse 2003 study. otzone Mixture† Clipping Yield Applied Water WUE‡
4.1 3388.9 1.2 P .5 3531.7 1.0 Calcined c 4.0 3056.4 1.3 Calcined clay 3.8 3156.9 1.2 Diatomaceous earth 3.9 3568.2 1.1 Diatomaceous earth 4.0 3352.8 1.2 Clinoptilolite 1 (5) 3.7 3353.0 1.1 Clinoptilolite 2 (5) 3.7 3680.0 1.0 Smectite (6)§ 3.9 3542.4 1.1 Iron Humate (7) 6.7 4164.6 1.6 Contrast: 1 vs. 2 NS NS *
ontrast: 2 vs. others * NS **
NS
CContrast: 2 vs. 3 NS *** ** Contrast: 2 vs. 4 NS NS NS Contrast: 2 vs. 5 NS NS NS Contrast: 2 vs. 6 NS NS NS Contrast: 2 vs. 7 *** *** *** Contrast: 3 vs. 4 ** NS Contrast: 3 vs. 7 *** *** *** CV (%) 15.4 7.5 8.3 NS, *, **, ***, Not significant, significant at the 0.05, 0.01, and 0.001 ability levels,
ely. prob
respectiv† 85% USGA uncoated sand plus 15% amendment by volume ‡ Water Use Efficiency = clipping yield / applied water
mended pots, and CCs and DEs were found to have similar amounts of PAW as peat, it
eat amended pots (Table 4-3).
Thus,
§ 2.5% by volume
(g) (ml) (mg g-1) Sand (1)
eat (2) 3lay 1 (3)
2 (3) 1 (4) 2 (4)
a
is likely nutrients applied to pots containing CCs and DEs were more plant available than
that applied to pots containing peat. Mehlich I extractable levels of P, K, and Fe from
CCs and DEs were found to be higher than those from p
higher WUE ratings were observed from CCs and DEs than from peat.
Water-use-efficiency ratings from iron-humate and smectite were identical and
higher than all other amended pots (Table 4-14). These results regarding iron humate

78
contradict those reported by Sartain and Comer (2004). They investigated WU
ass one year after establishment
E of
bermudagr and observed pots containing peat had greater
UE ratings than pots containing sand/iro mate or sand alone. Iron huma
product of water treatment facilit As such, its co y over tim y
organic matter and nutrient content. Iron used in th dy
f N, K, Ca, and F an iron humate used in the study by Comer
ld account for the differe sponses obser ng this stu
endments were in rporat llowing -tine tion diffe s
nt means became ess app t (Table 4-15). Only iron humate, CCs,
ed WUE above that of the sand/peat mixture. increase in W
due to a 13% decrease in r required to m in 90% field capacity.
ired 17% more water than t, but produced more dry m .
icative of an increase in nu nt uptake by tur wn in iron hu e
ed the
ere observed from peat and
ots. During 2003, incorporation of soil amendments via 9-tine
an
s
on
W n hu te is a
residual ies. nsistenc e ma
vary along with its humate is stu
contained higher levels o e th
(1999). This cou nt re ved duri dy.
When am co ed fo 9 aerifica , rence
between treatme l aren
and sand increas The UE from
CCs was largely wate ainta
Iron humate requ pea 90% atter
This may be ind trie f gro mat
amended sand. Iron humate produce 23% greater WUE than CCs which produc
second highest WUE response. Lowest WUE responses w
olite amended pze
aerification produced 22% lower WUE than when amendments were fully mixed into the
rootzone. Fully mixing amendments with sand allows for greater consistency and
homogeneity. Thus, fully-mixed amendments had a greater influence on turf growth th
when amendments were incorporated in localized regions throughout the rootzone as wa
the case in each aerification method.
Incorporation of soil amendments via 4-tine aerification had a similar influence
turf WUE as 9-tine aerification (Table 4-16). The only amendment that increased WUE

79
Table 4-16. Tissue yield, applied water, and water-use-efficiency of Tifdwarf
during glasshouse 2003 study. bermudagrass as influenced by soil amendments after 4 tine aerification
Rootzone Mixture† Clipping Yield Applied Water WUE‡ (g) (ml) (mg g-1)
Peat (2) 3.8 3193.2 1.2
Calcined clay 2 (3) 3.8 3141.7 1.2
Diatomaceous earth 2 (4) 4.3 3559.7 1.2
Clinoptilolite 2 (5) 3.8 3460.6 1.1
Sand (1) 3.8 3456.1 1.1
Calcined clay 1 (3) 3.9 3033.3 1.3
Diatomaceous earth 1 (4) 3.9 3533.3 1.1
Clinoptilolite 1 (5) 4.2 3472.2 1.2
Smectite (6)§ 3.9 3515.2 1.1 Iron H
umate (7) 5.7 4085.7 1.4
Contrast: 1 vs. 2 NS NS NS Contrast: 2 vs. others * * NS Contrast: 2 vs. 3 NS NS NS
Contrast: 2 vs. 5 NS NS NS
Contrast: 2 vs. 7 *** *** **
Contrast: 3 vs. 7 *** *** *
Contrast: 2 vs. 4 NS * NS
Contrast: 2 vs. 6 NS * NS
Contrast: 3 vs. 4 NS * NS
CV (%) 13.1 6.9 9.2 NS, *, **, ***, Not significant, significant at the 0.05, 0.01, and 0.001 probability levels, respectively. † 85% USGA uncoated sand plus 15% amendment by volume ‡ Water Use Efficiency = clipping yield / applied water § 2.5% by volume
above peat was iron humate. This trend remained consistent across all incorporation
methods. However, the influence of iron humate on WUE decreased in the order o
incorporation > 9-tine aerification > 4-tine aerification. However, no differences were
observed between the overall mean of treatments from 9-tine and 4-tine aerification
(Table 4-17). According to these resu
f: full
lts, soil amendments may not increase WUE when
incorporated after aerification compared to full incorporation. Moreover, it seems the
likelihood of producing an increase in WUE will increase as more of the rootzone is

80
removed during aerification. However, incorporation of amendments into a san
ill produce the greatest increase
d-based
rootzone w in turf quality, clipping yield, and WUE when
e amendment is fully incorporated into t otzone (Table . This allo
n distribution of nutrients and m re for turf upta
fficiency of Tifdwarf bermudagrass as influenced by poration method.
r Use Efficienc
th he ro 4-17) ws for a
more eve oistu ke.
Table 4-17. Water use eincor
Method Wate y Full (1) 1.4 4 Tine (2) 1.1 9 Tine (3) 1.1
*** NS
3.5
Contrast: 1 vs. 2Contrast: 2 vs. 3 CV (%)
Nutrient Leaching Study
sly mentioned, a primary concern in the golf industry is to minim ze any
dy
retain NO3-, NH4
+, and P during
eriods of normal nutrient but high water applications.
3-
off
moved through the column with the wetting front, and the primary mode of leaching was
convection.
As previou i
environmental impact that may arise from fertilizer applications. This phase of the stu
compares 3 soil amendments and their capacity to
p
Nitrate
No differences were observed between the NO3-N breakthrough curves of sand and
sand/peat rootzones (Fig. 4-7). As desired, nitrate-N leached as a pulse. Maximum NO
N concentration reached 0.2 C/Co at one pore volume and quickly dropped, tapering
to no detectable NO3-N at near 2.5 pore volumes. Both sand and sand/peat leaching
patterns were well described by the CD model. Thus, nitrate can be assumed to have

81
0.20
0.25
HDTMA - Ecosand
C/C
0.05
0.10
0.15
0.20
.25
0
0.25
HDTMA - Soil Master
EcosandCD Model
ProfileCD Model
Soil MasterCD Model
0.00
0.05
0.10
Sand/Peat Sand
0.15
0.20 CD Model CD Modelo 0.00
0.05
0.10
0.15
0.2
0
HDTMA - Profile
0.00
0.15
Effluent Volume (Pore Volume)
0 1 2 3
0.00
0.05
0.10
0 1 2 3
Figure 4-7. Nitrate breakthrough curves as influenced by filter zone media.
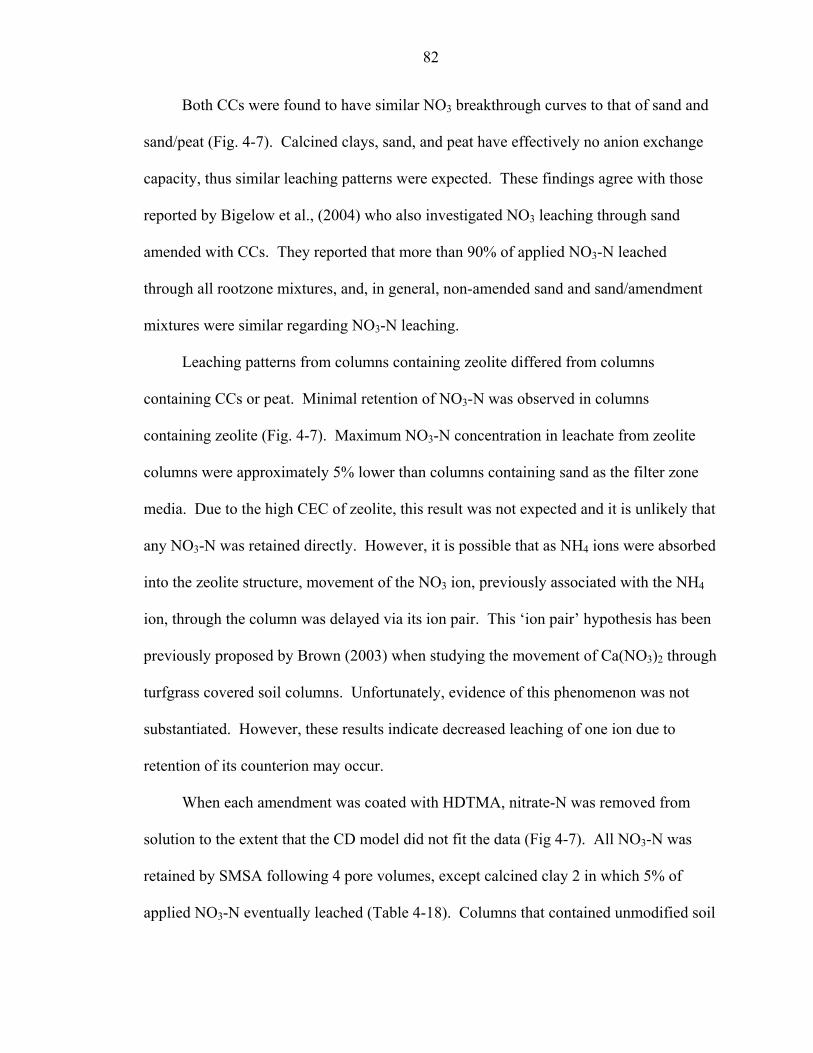
82
Both CCs were found to have similar NO3 breakthrough curves to that of sand and
sand/peat (Fig. 4-7). Calcined clays, sand, and peat have effectively no anion exchange
capacity, thus similar leaching patterns were expected. These findings agree with those
reported by Bigelow et al., (2004) who also investigated NO3 leaching through sand
amended with CCs. They reported that more than 90% of applied NO3-N leached
through all rootzone mixtures, and, in general, non-amended sand and sand/amendment
mixtures were similar regarding NO3-N leaching.
Leaching patterns from columns containing zeolite differed from columns
containing CCs or peat. Minimal retention of NO3-N was observed in columns
containing zeolite (Fig. 4-7). Maximum NO3-N concentration in leachate from zeolite
columns were approximately 5% lower than columns containing sand as the filter zone
media. Due to the high CEC of zeolite, this result was not expected and it is unlikely that
any NO3-N was retained directly. However, it is possible that as NH4 ions were absorbed
into the zeolite structure, movement of the NO3 ion, previously associated with the NH4
ion, through the column was delayed via its ion pair. This ‘ion pair’ hypothesis has been
previously proposed by Brown (2003) when studying the movement of Ca(NO3)2 through
turfgrass covered soil columns. Unfortunately, evidence of this phenomenon was not
substantiated. However, these results indicate decreased leaching of one ion due to
retention of its counterion may occur.
When each amendment was coated with HDTMA, nitrate-N was removed from
solution to the extent that the CD model did not fit the data (Fig 4-7). All NO3-N was
retained by SMSA following 4 pore volumes, except calcined clay 2 in which 5% of
pplied NO3-N eventually leached (Table 4-18). Columns that contained unmodified soil a
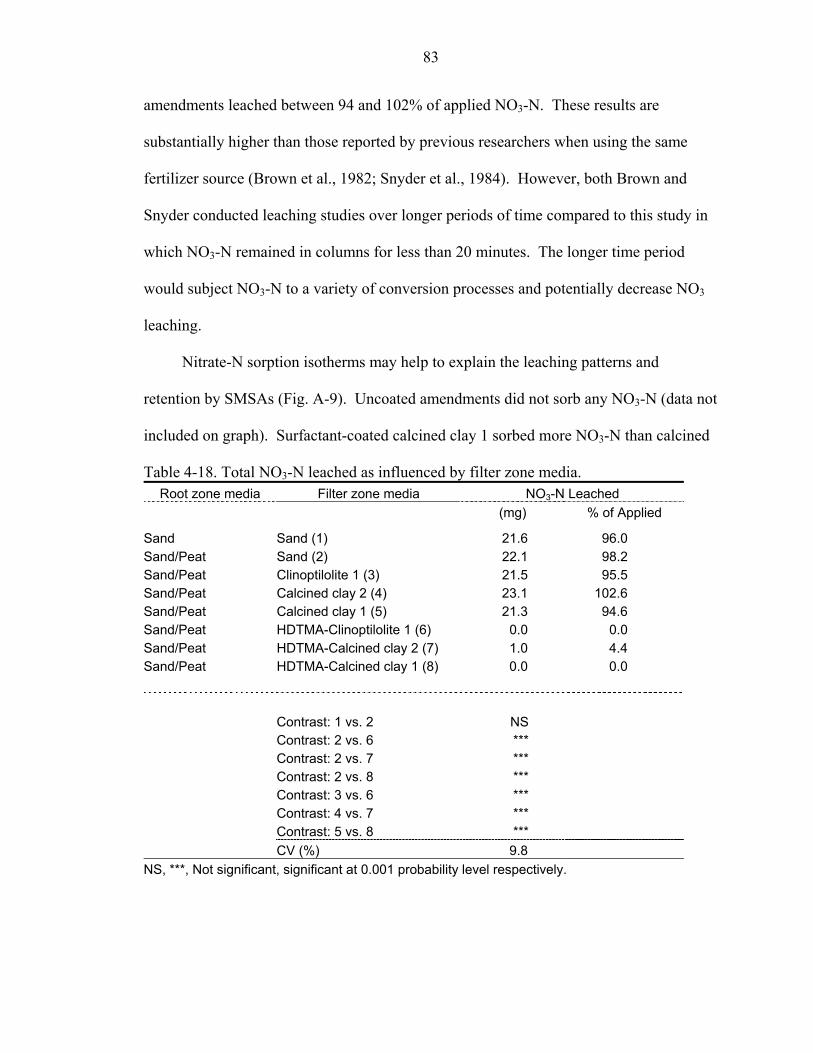
83
amen
in
d
(data not
d
Root zone media Filter zone media NO -N Leached
dments leached between 94 and 102% of applied NO3-N. These results are
substantially higher than those reported by previous researchers when using the same
fertilizer source (Brown et al., 1982; Snyder et al., 1984). However, both Brown and
Snyder conducted leaching studies over longer periods of time compared to this study
which NO3-N remained in columns for less than 20 minutes. The longer time perio
would subject NO3-N to a variety of conversion processes and potentially decrease NO3
leaching.
Nitrate-N sorption isotherms may help to explain the leaching patterns and
retention by SMSAs (Fig. A-9). Uncoated amendments did not sorb any NO3-N
included on graph). Surfactant-coated calcined clay 1 sorbed more NO3-N than calcine
Table 4-18. Total NO3-N leached as influenced by filter zone media. 3
(mg) % of Applied
Sand Sand (1) 21.6 96.0
Sand/Peat Clinoptilolite 1 (3) 21.5 95.5
Sand/Peat Calcined clay 1 (5) 21.3 94.6 Sand/Peat HDTMA-Clinoptilolite 1 (6) 0.0 0.0 Sand/Peat HDTMA-Calcined clay 2 (7) 1.0 4.4
Sand/Peat Sand (2) 22.1 98.2
Sand/Peat Calcined clay 2 (4) 23.1 102.6
Sand/Peat HDTMA-Calcined clay 1 (8) 0.0 0.0
Contrast: 1 vs. 2 NS
Contrast: 2 vs. 7 Contrast: 2 vs. 6 ***
*** Contrast: 2 vs. 8 ***
CV (%) 9.8
Contrast: 3 vs. 6 *** Contrast: 4 vs. 7 ***
Contrast: 5 vs. 8 ***
NS, ***, Not significant, significant at 0.001 probability level respectively.

84
clay 2 or clinoptilolite 1. Calcined clay 2 and clinoptilolite 1 produced similar iso
with calcined clay 2 retaining slightly more NO3-N than clinoptilolite 1. These isotherm
relate well with each amendment’s effective anion exchange capacity (EAEC) (Table 4
1). Calcined clay 1 and clinoptilolite 1 had the highest and lowest EAEC, respectively.
Thus, calcined clay 1 and clinoptilolite 1 produced the highest and lowest Smax,
respectively.
Ammoniu
therms
s
-
m
When C of
This phenomenon
was observed during analysis of NH4-N leaching.
Leaching patterns of NH4-N through columns containing only sand were similar to
tterns of e same columns (Fig. 4-8) and were well described
e model. arameters can be seen in table A-2. Maximum
centratio ere obser at 1.09 por umes. This
dicates that, under ese experimental conditions, the movement and retention of NH4-
is not influenced b hese findings support previous work conducted
nder similar experi s (Bigelow et al., 20
Addition of peat into the rootzone mixture decrease aximum NH4
oncentration in leac g. 4-8). Furthermore, peak concentrations were
tor (R). However, no
HDTMA is coated onto a solid phase that possesses a CEC, the effective CE
that solid may decrease (Table 4-1). This is due to a portion of the original cation
exchange sites being occupied by HDTMA head groups. Due to this decrease in CEC,
sorption or retention of cations from soil solution may also decrease.
leaching pa NO3-N through th
by the 2-sit The 2-site model p
NH4-N con ns reached 0.21 C/CO and w ved e vol
in th
N y USGA sand. T
u mental condition 03).
d m -N
c hate by 25% (Fi
observed at 1.1 pore volumes which lead to a higher retardation fac

85
0 1 2 3
0.05
0.10
2-Site Model
Effluent Volume (Pore Volume)
0 1 2 3
o
0.15
HDTMA - ProfileProfile
0.00
0.25
HDTMA - Soil Master Soil Master
0.05
0.10
2-Site Model 2-Site Model
Figure 4-8. Ammonium breakthrough curves as influenced by filter zone media.
0.00
0.15
0.20
0.25
Sand/Peat Sand
0.20
C/C
0.20
0.25
2-Site Model
0.05
0.10
0.15
2-Site Model 2-Site Model
0.00
0.15
0.20
0.25
HDTMA - Ecosand Ecosand
0.00
0.05
0.10

86
differences in total NH4-N leached were observed between columns containing sand and
sand/peat. This indicates the CEC increase associated with peat addition (Table 4-3) is
enough to delay NH4-N leaching, but will not prevent NH4-N from leaching under these
conditions. These findings are in contrast to previous research. In general, past research
has shown that under normal growing conditions, leaching of NH4-N is minimal due
primarily to the rapid conversion of NH4-N to NO3-N in well-aerated soils that contain an
adequate microbe population (Petrovic 1990; Reddy, 1982; Tate, 1977). Thus, inclusion
of peat into a sand-based media has been shown to reduce NH4-N leaching by as much as
70% (Bigelow et al., 2003). However, this study was conducted under a worse-case
scenario in which oxygen was limited and percolation rates were high. Therefore,
nitrification was likely limited and, thus, peat did not have as great an influence on total
NH4-N leached as previous research might indicate.
Addition of a filter layer containing unmodified amendments reduced NH4-N
leaching by 98%. (Table 4-18). No NH4-N was detected in leachate from columns
containing zeolite while 6% of applied NH4-N leached through calcined clay 1.
Decreased NH4-N leaching from zeolite amended sand than from CC amended sand was
also observed by Bigelow et al. (2003). The removal of NH4-N from leachate in this
study was likely due to two factors. First, because CCs and zeolites possess relatively
high CECs (Table 4-2), they each have the capacity to remove large amounts of cations
from solution. Sorption isotherms showed that CCs are capable of adsorbing between 55
and 65 mg kg-1 NH4-N, while zeolites which possess a higher CEC are capable of
adsorbing 260 mg kg-1 NH -N (Fig A-10, Fig A-11, Fig A-12). Secondly, amendments
were placed in each column in a 2 cm thick layer below the rootzone which forced all
4
87
Table 4-18. Total NH4-N leached as influenced by filter zone media. Root zone media Filter zone media NH4-N Leached
--- (mg) --- % of Applie
Sand/Peat Calcined clay 2 (2) 0.0 0.0
Sand/Peat HDTMA-Clinoptilolite 1 (4) 1.0 4.0
Sand/Peat HDTMA-Calcined clay 1 (6) 18.2 73.3
Sand Sand (8) 23.1 93.1
Contrast: 2 vs. 5 ***
Contrast: 7 vs. 8 NS
Contrast: 7 vs. 5 ***
NS, ***, Not significant, significant at 0.001 probability leve
d Sand/Peat Clinoptilolite 1 (1) 0.0 0.0
Sand/Peat Calcined clay 1 (3) 1.5 6.0
Sand/Peat HDTMA-Calcined clay 2 (5) 12.5 50.4
Sand/Peat Sand (7) 22.7 91.5
Contrast: 1 vs. 4 NS
Contrast: 3 vs. 6 ***
Contrast: 7 vs. 4 ***
Contrast: 7 vs. 6 ***
CV (%) 12.9 l respectively.
leachate to pass through each amendment. It is probable that the thickness of this layer
directly influences the retention of potential contaminants. The influence of filter layer
thickness is of concern and future research in this area would be valuable.
When CCs were coated with HDTMA, each amendments capacity to retain NH4-N
decreased (Fig A-10, Fig A-11). Thus, more NH4-N leached through columns containing
HDTMA-coated calcined clay 1 and calcined clay 2 than columns containing their
unmodified counterparts (Table 4-18). Only a minor decrease in NH4-N retention was
observed from HDTMA-clinoptilolite 1 (Fig A-12). Thus, columns containing
clinoptilolite 1 and HDTMA-clinoptilolite 1 leached similar amounts of NH4-N (Table 4-
18). The influence of SMSA on decreasing NH4-N leaching in order of decreasing
effectiveness was: clinoptilolite 1 > calcined clay 2 > calcined clay 1. These results

88
correspond well with each amendment’s CEC and Smax. Clinoptilolite 1 had the highest
CEC and S ax and, thus, leached the least amount of NH d calcined
EC than c 1 and, thus, less N ed through
ntaining H an HDTMA cined clay 1 (Tabl 8).
s
r peak P concen ere observed in leachate f olumns containing sand
nd sand/peat (Fig. 4- . However, a broader peak produced from sand/peat columns
an from sand alone. els of P in leachate b een 0.0-0.5 pore vol mes
dicate columns cont leached P not associ ent solution.
hen determining P leached as a percent of applied, this would artificially inflate the
mount of P applied. However, columns containing sand/peat underlined with
This amount seemed
reasonable until leachate from columns containing only sand were analyzed. Only 88%
of applied P leached from the column that contained only sand. These results indicate
that a portion of P applied to sand/peat rootzones may be retained by sand, while peat
may exacerbate P leaching. These findings agree with previous researcher by Brown and
Sartain (2000). Brown and Sartain investigated P leaching from USGA greens from three
P-source fertilizers. They reported as much as 70% more P leached from columns
containing peat than from those containing only sand. Despite fertilizer source, columns
in Brown and Sartain’s study containing sand/peat leached more P than those without
peat, in all cases.
m 4-N. Coate clay 2 had
a higher EC oated calcined clay H4-N leach
columns co DTMA-calcined clay 2 th -cal e 4-1
Phosphoru
Simila trations w rom c
a 9)
th Background lev etw u
in aining sand/peat ated with the nutri
W
a
unmodified amendments leached 101% of applied P (Table 4-19).
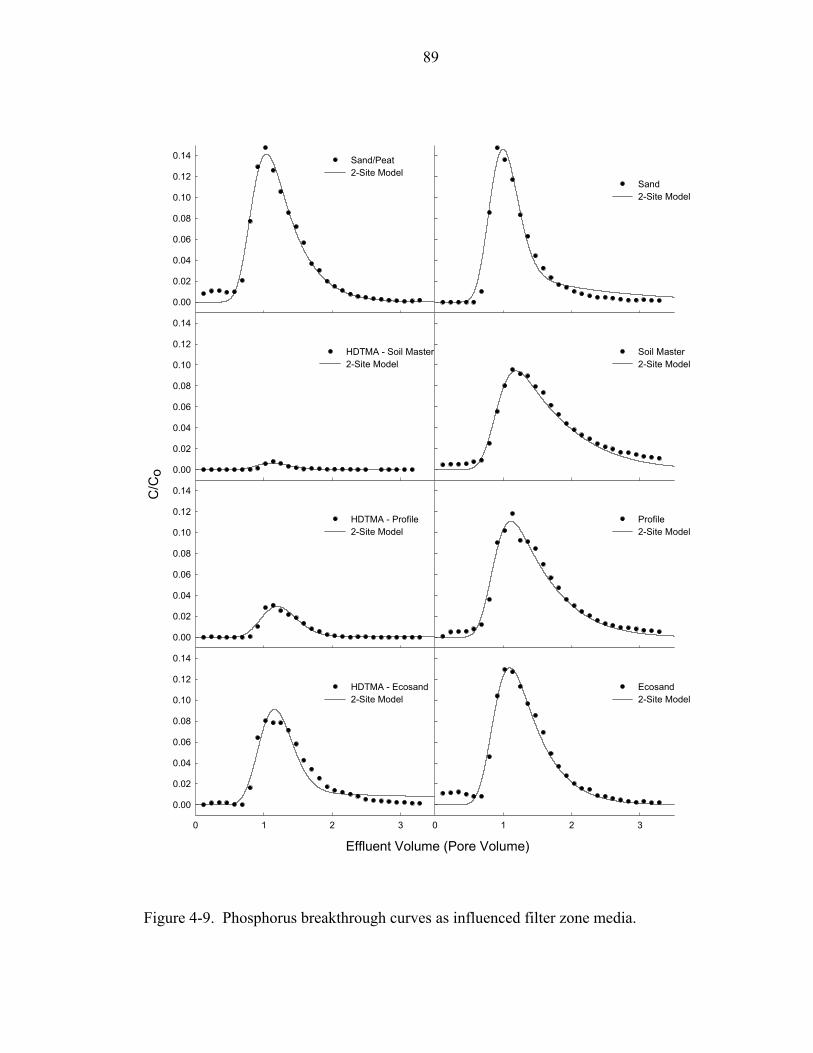
89
Effluent Volume (Pore Volume)
0 1 2 3
0.02
0.06
C/C
0.00
0.04
0.14
HDTMA - Profile
0.02
0.06
0.12
0 1 2 3
Profile
0.00
0.06
0.10
0.14 Sand/Peat
2-Site Model
Figure 4-9. Phosphorus breakthrough curves as influenced filter zone media.
0.08
0.12 2-Site ModelSand
0.04
0.00
0.04
0.08
0.10
0.12
0.14
HDTMA - Ecosand2-Site Model
o
0.02
0.06
0.08
0.10
0.12
2-Site Model
0.00
0.04
0.08
0.10
0.14
HDTMA - Soil Master2-Site Model
Ecosand2-Site Model
2-Site Model
Soil Master2-Site Model
0.02

90
Breakthrough curves produced from columns containing CCs indicate P movement
was retarded (Fig 4-9). Calcined clays reduced maximum effluent concentration by as
much as 30%. However, they were unable to retain P against percolate flow as indicated
by the broaden peaks. This is further reinforced by the percent of applied P that was
leached (Table 4-19). Since neither CCs possesses any appreciable AEC, retardation of P
through CC amended columns is likely due to the Fe levels determined via Mehlich I
extraction (Table 4-2). Phosphorus has been shown to be strongly sorbed by Fe-
containing compounds (Makris et al., 2004; Brown and Sartain, 2000). Furthermore,
sorption isotherms indicate calcined clay 1 and calcined clay 2 are capable or sorbing
approximately 1600 and 700 mg P kg-1 (Fig A-13, A-14).
When CCs were coated with HDTMA, maximum effluent P concentrations were
Table 4-19. Total Phosphorous leached as influenced by filter zone media. Root zone media Filter zone media P Leached
--- (mg) --- % of Applied Sand/Peat Clinoptilolite 1 (1) 44.2 100.4 Sand/Peat Calcined clay 2 (2) 44.3 100.6 Sand/Peat Calcined clay 1 (3) 44.8 101.8 Sand/Peat HDTMA-Clinoptilolite 1 (4) 23.7 53.8 Sand/Peat HDTMA-Calcined clay 2 (5) 7.2 16.3 Sand/Peat HDTMA-Calcined clay 1 (6) 1.3 2.9 Sand/Peat Sand (7) 44.5 101.1 Sand Sand (8) 38.6 87.7 Contrast: 1 vs. 4 *** Contrast: 2 vs. 5 *** Contrast: 3 vs. 6 *** Contrast: 7 vs. 8 ** Contrast: 7 vs. 4 *** Contrast: 7 vs. 5 *** Contrast: 7 vs. 6 ***
CV (%) 6.9
**, ***, Significant at 0.01, 0.001 probability level respectively.

91
reduc
h
e 1
us, little or no differences
were .
Sorption
isotherms indicate Smax of HDTMA clinoptilolite 1 is r than tha
. A-15). T ing was observed from zeolite than fr s.
ed by approximately 90%. Breakthrough curves for coated CCs indicated P
movement was not only retarded, but P was also retained against water flow. Columns
containing coated calcined clay 1 leached 3% of applied P while coated calcined clay 2
leached 16% (Table 4-19). The amount of P leached from CCs directly correlated wit
each amendments EAEC (Table 4-1). Furthermore, analysis of sorption isotherms
indicates that HDTMA coating can increase its capacity to sorb P by as much as 100%
(Fig A-14).
No differences were observed between the breakthrough curves for columns
containing clinoptilolite 1 versus sand as the filter zone media (Fig. 4-9). Clinoptilolit
has extractable iron levels similar to that of USGA sand, th
observed. However, coated clinoptilolite 1 both retained and retarded P movement
Addition of coated clinoptilolite 1 reduced P leaching by 46% (Table 4-19).
- 5 times lowe t of calcined
clay 1 (Fig hus, greater P leach om CC
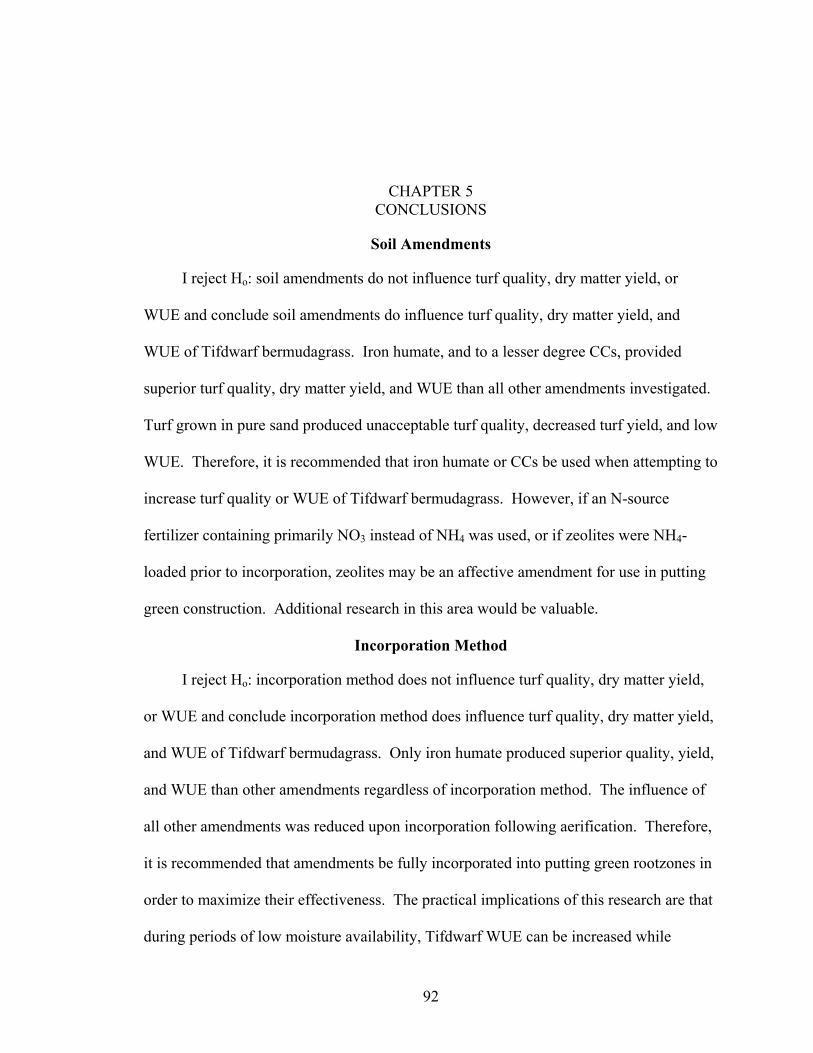
CHAPTER 5
endments do influence turf quality, dry matter yield, and
WUE
low
green construction. Additional research in this area would be valuable.
Incorporation Method
I reject Ho: incorporation method does not influence turf quality, dry matter yield,
or WUE and conclude incorporation method does influence turf quality, dry matter yield,
and WUE of Tifdwarf bermudagrass. Only iron humate produced superior quality, yield,
and WUE than other amendments regardless of incorporation method. The influence of
all other amendments was reduced upon incorporation following aerification. Therefore,
it is recommended that amendments be fully incorporated into putting green rootzones in
order to maximize their effectiveness. The practical implications of this research are that
during periods of low moisture availability, Tifdwarf WUE can be increased while
CONCLUSIONS
Soil Amendments
I reject Ho: soil amendments do not influence turf quality, dry matter yield, or
WUE and conclude soil am
of Tifdwarf bermudagrass. Iron humate, and to a lesser degree CCs, provided
superior turf quality, dry matter yield, and WUE than all other amendments investigated.
Turf grown in pure sand produced unacceptable turf quality, decreased turf yield, and
WUE. Therefore, it is recommended that iron humate or CCs be used when attempting to
increase turf quality or WUE of Tifdwarf bermudagrass. However, if an N-source
fertilizer containing primarily NO3 instead of NH4 was used, or if zeolites were NH4-
loaded prior to incorporation, zeolites may be an affective amendment for use in putting
92

93
maintaining acceptable turf quality via the use of certain soil amendments. However, the
influence of soil amendments on turf WUE and quality during periods of adequate
moisture and nutrients availability remains ambiguous. It is likely that during these
periods, soil amendments may not in and development. Thus, further
research regarding this concern wo
o 3 4 te
3
3
nd
4
4
es, may have a
greater affinity and capacity to re than CCs. Future research in
this a
3 4 4
3 4 4
4
3
4
fluence turf growth
uld be valuable.
Nutrient Leaching
I fail to reject H : soil amendments do not reduce NO - or PO -2 leaching. Nitra
breakthrough curves and applied NO leached show soil amendments have little or no
influence on NO leaching. Calcined clays did slow P movement but were incapable of
reducing total P leached. These results show that P movement can be slowed by
incorporating CCs into a filter-zone below the rootzone of USGA putting greens.
However, if water movement persists, P may not be retained and could leach to grou
water. I reject Ho: soil amendments do not reduce NH leaching, and conclude soil
amendments do reduce NH leaching. Ammonium leaching was nearly eliminated via
soil amendment incorporation. Higher CEC amendments, such as zeolit
tain NH4 against leaching
rea would be warranted.
I reject Ho: SMSA do not reduce NO -, NH +, or PO -2 leaching, and conclude soil
amendments do reduce NO -, NH +, or PO -2 leaching. The influence of SMSA on
reducing nutrient leaching was directly or, in the case of NH + indirectly, related to each
amendment’s EAEC. With the incorporation of SMSA into the filter layer, NO - and
PO -2 movement may not only be slowed but may be retained, effectively reducing the
potential for groundwater contamination. The practical implications of this study are that
during periods of normal fertilizer applications but excessive leaching, N and P

94
movement through golf course putting greens can be reduced or eliminated via the use of
surfactant-modified soil amendments. However, further research is needed prior to
recommendations. Bi-layer stability and longevity in a dynamic soil system have no
been investigated nor have any potential environmental influences. Furthermore, the
influence of SMSA on turf growth and development
use
t
is unknown and may be detrimental.
Research in this area must be cond rating these products in a putting
green.
ucted prior to incorpo

APPENDIX MISCALLENEOUS GRAPHS AND TABLES
Termperature (oC)
0 100 200 300 400 500 600
Wei
ght (
%)
0
10
20
30
40
50
60
70
80
90
100
Figure A-1. Thermal gravimetry analysis of HDTMA.
96

97
Temperature (oC)
0 100 200 300 400 500 600
Wei
ght (
%)
90
92
94
96
98
100HDTMA - Soil MasterSoil Master
oated calcined clay 1. Figure A-2. Thermal gravimetry analysis of HDTMA c

98
Temperature (oC)
0 100 200 300 400 500 600
Wei
ght (
%)
90
92
94
96
98
100HDTMA - ProfileProfile
Figure A-3. Thermal gravimetry analysis of HDTMA coated calcined clay 2.

99
Temperature (oC)
0 100 200 300 400 500 600
Wei
ght (
%)
88
90
92
94
96
98
100HDTMA-ClinoptiloliteClinoptilolite
Figure A-4. Thermal gravimetry analysis of HDTMA coated clinoptilolite.

100
Figure A-5. X-ray diffractogram of diatomaceous earths in a side-packed powder mount.
Axis
PSA
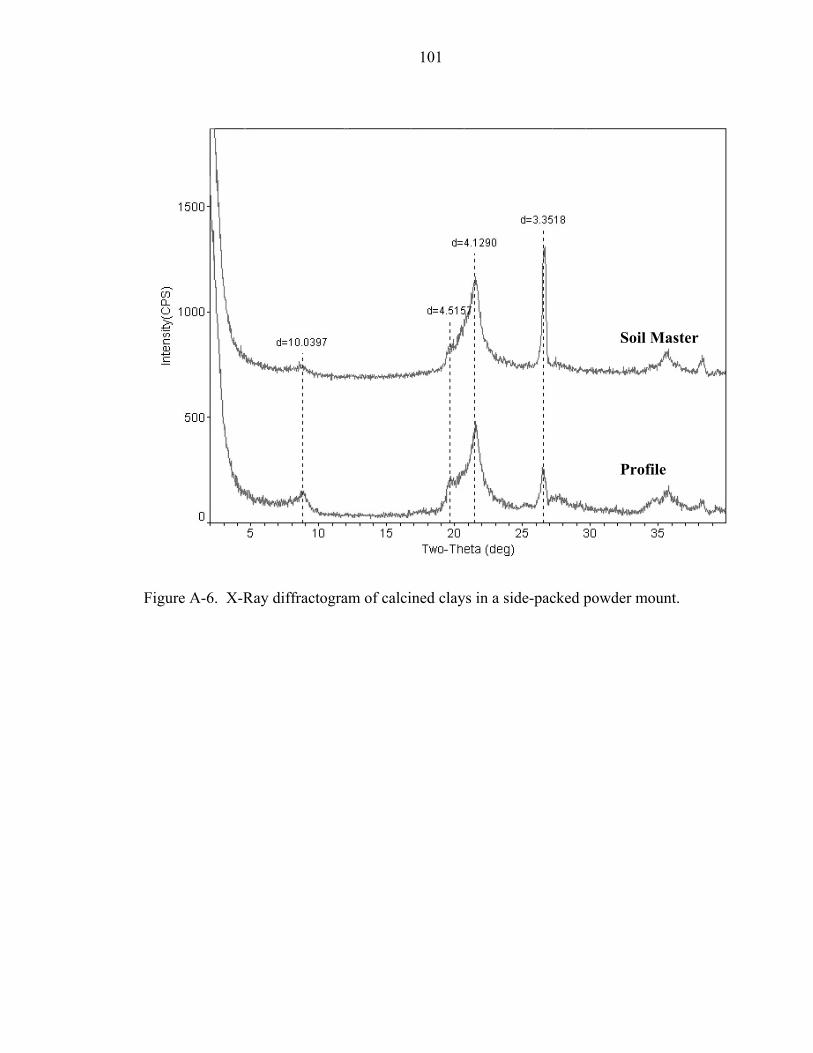
101
Soil Master
Profile
Figure A-6. X-Ray diffractogram of calcined clays in a side-packed powder mount.

102
d
coliteE
Ecosan
Figure A-7. X-Ray diffractogram of zeolites in a side-packed powder mount.

103
Table A-1. Chemical properties of irrigation water used in glasshouse and field studies.
Field Glasshouse
pH 7.1 6.8
EC (µS cm-1) 0.2 0.1
P (mg L-1) 0.2 0.1
K (mg L-1) 0.9 0.2
Ca (mg L-1) 81.9 45.2
Mg (mg L-1) 9.6 2.2
Zn (mg L-1) 0.0 0.0
Mn (mg L-1) 0.0 0.0
Cu (mg L-1) 0.0 0.0
Fe (mg L-1) 0.0 0.0
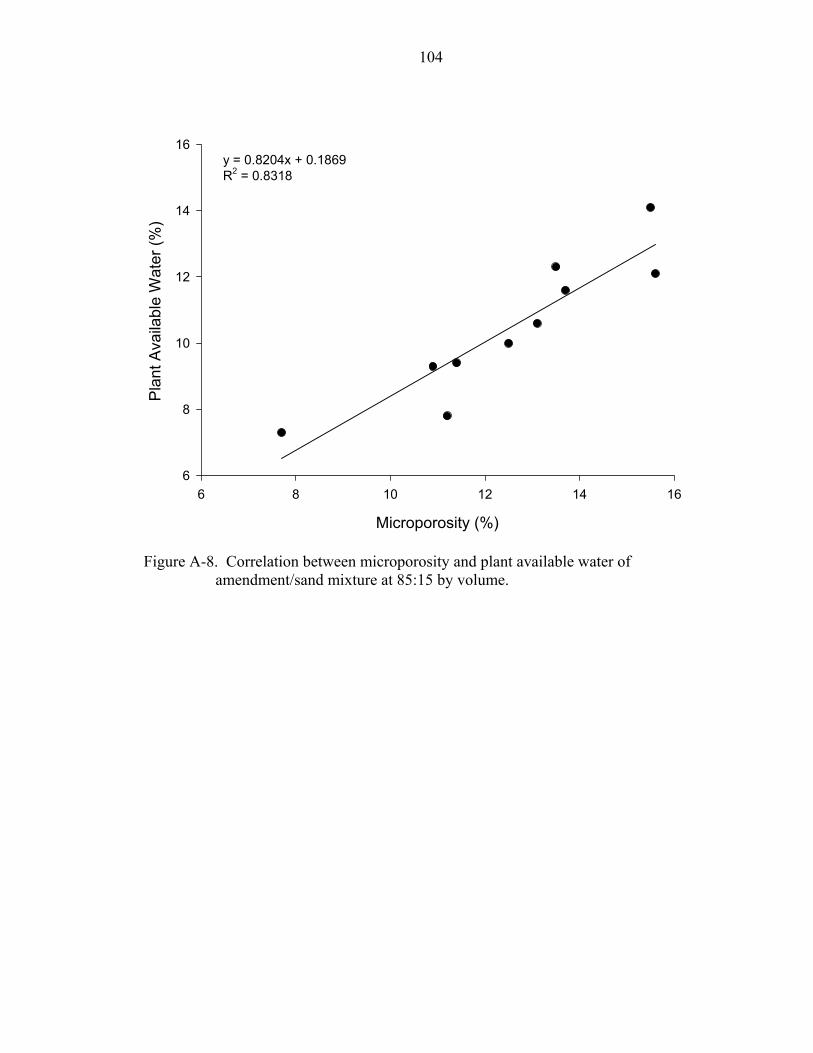
104
Microporosity (%)
6 8 10 12 14 16
Pla
nt A
vaila
ble
Wat
er (%
)
6
10
14
R = 0.8318
Figure A-8. Correlation between microporosity and plant available water of amendment/sand mixture at 85:15 by volume.
8
12
16y = 0.8204x + 0.1869
2

105
Solution NO3-N (mg L-1)
0 100 200 300 400 500
NO
3-N
Abs
orbe
d (m
g kg
-1)
0
500
1000
1500
2000
2500
3000
3500 Calcined Clay 1Calcined Clay 2ClinoptiloliteS = 265.07 * C0.40
S = 121.51 * C0.47
S = 145.82 * C0.39
Figure A-9. Nitrate sorption isotherm for surfactant-modified soil amendments.
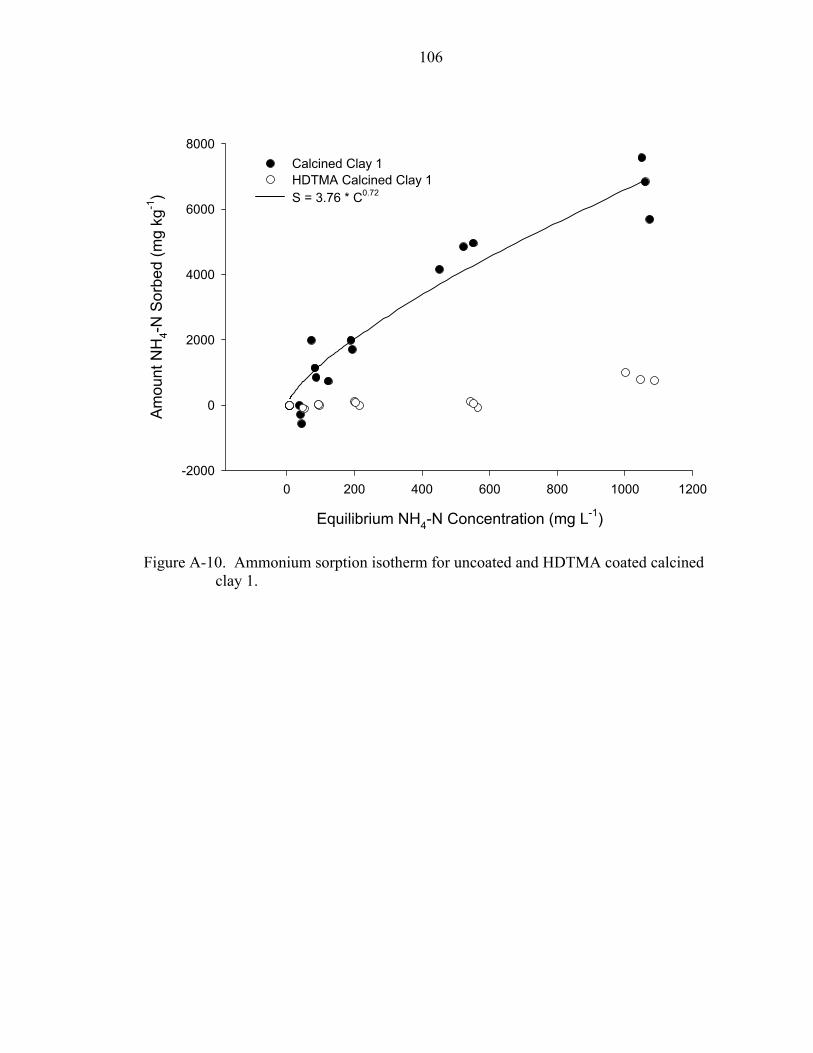
106
Equilibrium NH4-N Concentration (mg L-1)
0 200 400 600 800 1000 1200
Am
ount
NH
4-N
Sor
bed
(mg
kg-1
)
-2000
0
2000
4000
6000
8000Calcined Clay 1HDTMA Calcined Clay 1S = 3.76 * C0.72
Figure A-10. Ammonium sorption isotherm for uncoated and HDTMA coated calcined clay 1.

107
Equilibrium NH4-N Concentration (mg L-1)
0 200 400 600 800 1000 1200 1400
Amou
nt N
H4-
N S
orbe
d (m
g kg
-1)
-2000
0
2000
4000
6000
8000Calcined Clay 2HDTMA Calcined Clay 2S = 4.69 * C0.50
S = 6.31 * C0.77
Figure A-11. Ammonium sorption isotherm for uncoated and HDTMA coated calcined clay 2.

108
Equilibrium NH4-N Concentration (mg L-1)
0 200 400 600 800 1000
Am
ount
NH
4-N
Sor
bed
(mg
kg-1
)
0
10000
20000
30000
40000ClinoptiloliteHDTMA ClinoptiloliteS = 5.59 * C0.74
S = 4.95 * C0.78
Figure A-12. Ammonium sorption isotherm for uncoated and HDTMA coated clinoptilolite.

109
Equilibrium P concentration (mg L-1)
-100 0 100 200 300 400 500
Am
ount
P S
orbe
d (m
g kg
-1)
-500
0
500
1000
1500
2000
2500HDTMA Calcined 1Calcined 1S = 4.5 * C0.54
S = -0.21 * C1.17
Figure A-13. Phosporus sorption isotherm for uncoated and HDTMA coated caclay 1.
lcined

110
Equilibrium P concentration (mg L-1)
-50 0 50 100 150 200 250 300 350
Am
ount
P S
orbe
d (m
g kg
-1)
0
1000
2000
3000
4000HDTMA Calcined Clay 2Calcined Clay 2S = 4.86 * C0.60
S = 3.81 * C0.69
Figure A-14. Phosphorus sorption isotherm for uncoated and HDTMA coated calcinedclay 2.

Equilibrium P concentration (mg L-1)
-100 0 100 200 300 400 500 600
Am
ount
P S
orbe
d (m
g kg
-1)
-100
0
100
200
300
400
500
600
700HDTMA ClinoptiloliteClinoptiloliteS = 4.02 * C0.39
Figure A-15. Phosporus sorption isotherm for uncoated and HDTMA coated clinoptilolite.

112
Table A-2. Phosphorous and ammonium leaching parameters for the 2-site model. --------------- P ------ ------- --------------- NH4 --------------- ----
Root zone media Filter zone media Ρ† β‡ R¶ Ρ β ω R
Sand/Peat Zeolite 1 43 0.810 1.26 UD# UD UD UD
ω§
1.05
Sand/Peat CC 2 43 0.740 1.32 1.38 UD UD UD UD
Sand/Peat CC 1 43 0.700 1 1.56 43 0.030 3.22 51.8
Sand/Peat HDTMA-Zeolite 1 43 0.340 0.74 3.46 43 0.029 3.52 50.83
Sand/Peat HDTMA- CC 2 43 0.012 1.84 108.04 43 0.308 1.02 4.26
Sand/Peat HDTMA- CC 1 43 0.003 3.65 405.27 43 0.650 0.62 1.86
Sand/Peat Sand 43 0.820 0.99 1.18 43 0.880 0.12 1.29
Sand Sand 43 0.680 1.45 43 0.830 0.12 1.09
† Peclet number
.41
0.44
‡ fraction of instantaneous retardation
§ Damkohler number
¶ Retardation Factor
# undetermined
113
LIST OF REFERENCES Allen, E.R., D.W. Ming, L.R. Hossner, and D.L. Henninger. 1995. Modeling transport
kinetics in clinoptilolite-phosphate rock systems. Soil Sci. Soc. Am. J. 59:248-255.
Amon , J.E tion of mineralogy and environmental In Amonette (ed.). Soil mineralogy with environmental
l ons. SS SSSA Madison, WI.
Andrews, R.D., A.J. Koski, J.A. Murphy, and A.M. Petrovic. 1999. Zeoponic materials -in. Golf Course Manage. 67(2):68-72.
Basta T., R.J. Zupa . 2000. Evaluating soil tests to predict udagrass growth in drinking water treatment residuals with phosphorus
ilizer iron. Qual. 29:2007-2012.
B , L.D. 1956. Soil physics. 3rd ed. John Wiley & Sons. New York.
B , J.B 82. Turf management for golf courses. Burgess publishing, Minneapolis,
B . 2002. The putting green. p. 105-193. In J.T. Snow et al. (ed.) Turf or Press, Chelsea, MI.
Bigelow, C.A., D.C. Bowman, and D.K. Cassel. 1999. Germination and establishment h root-zone amendments. Golf Course Manage. 67(4)62-65.
B C.A. modification with rganic soil amendments and sphagnum peat moss. USGA Green Sect. Rec.
38(4):7-13.
Bigelow, C.A., D.C. Bowman, and D.K. Cassel. 2001a. Nitrogen leaching in sand-based rootzones amended with inorganic soil am ents and sphagnum peat. J. Amer. Soc. Hort. Sci. 126(1):151-156.
Bigelow, C.A., D.C. Bowm . Rufty. 2001b. Creeping bentgrass response to inorganic soil am ents and mechanically induced subsurface drainage and aerati 7-8
Bigelow, C.A., D.C. Bowman, and D.K. Cassel. 2003. Inorganic soil amendments limit ni en leaching in newly constructed n rooting mixtures. U 2(2
etteavailability. p. 153-198. app
allow rapid greens grow
, N.bermfert
. 2002. Methods for determina
icati SA Book series, no. 7.
ncic, and E.A. Dayton
. J. Env
aver
eard
eard
igel
. 19Minn.
, J.Bman
wit
ow, ino
agement for golf courses. Ann Arb
, D. Bowman, and K. Cassel. 2000. Sand-based rootzone
endm
05.
-11
an, D.K. Cassel, and T.W
n. Cendm
Sco rop i. 41:79
trogSGA T
sand-based putting gree4):1urfgrass Env. Res. Online .
114
Bigelow, C.A., D.C. Bowman, and D.K. Cassel. 2004. Physical properties of three sand size classes amended with inorganic materials or sphagnum peat moss for putting green rootzones. Crop Sci. 44:900-907.
Biran, I., B. Bravado, I. Bushkin-Harav, and E. Rawitz. 1981. Water consumption and growth rate of 11 turfgras height, irrigation frequency,
Black, C.C., T.M. Chen, and R.H. Brown. 1969. Biochemical basis for plant
Boett A. Dick et al. (ed.) Soil mineralogy with environmental applications. SSSA, Madison, WI.
Bowm n. 2001. Pilot test of a surfactant-modified zeolite permeable barrier for groundwater remediation. p.
Breck, D.W. 1974. Zeolite molecular sieves: Structure, chemistry, and use. John Wiley &
en construction. Agron. J. 67:647-652.
itrate and 4:947-950.
117.
.
Brusseau, M.L., R.E. Jessup, and S.C. Rao. 1991. Nonequilibrium sorption of organic
Bugbee, G.J., and C.R. Frink. 1985. Alum sludge as a soil amendment: Effects on soil
Carlson, M.S., C.L. Kerkman, and W.R. Kussow. 1998. Peats and supplements for root
Carro 1. Cation exchange capacity. p. 45-66. In Turfgrass soil fertility and chemical problems. Ann Arbor Press, Chelsea, MI.
ses as affected by mowing and soil moisture. Agron. J. 73:85-90.
competition. Weed Sci. 17:338-344.
inger, J.L., and D.W. Ming. 2002. Zeolites. p. 585-610. In W.
an, R.S., Z. Li, S.J. Roy, T. Burt, T.L. Johnson, and R.L. Johnso
161-185. In Smith and Burns (ed.) Physiochemical groundwater remediation. Kluwer academic/Plenum publishers, New York.
Sons, New York, NY.
Brown, K.W., and R.L. Duble. 1975. Physical characteristics of soil mixtures used for golf gre
Brown, K.W., J.C. Thomas, and R.L. Duble. 1982. Nitrogen source effect on nammonium leaching and runoff losses from greens. Agron. J. 7
Brown, E.A., and J.B. Sartain. 2000. Phosphorus retention in united states golf association greens. Soil and Crop Sci. Soc. Florida Proc. 59:112-
Brown, E.A. 2003. Differential nitrate leaching and mass balance of 15N-labeled nitrogen sources applied to turfgrass and citrus. Ph.D. diss. Univ. of Florida, Gainesville
chemicals: elucidation of rate-limiting processes. Environ. Sci. Technol. 25(1):134-142.
properties and plant growth. Connecticut Agric. Exp. Stn. Bull. 823. Connecticut Agric. Exp. Stn., New Haven.
zone mixes. Golf Course Manage. 66(9):70-74.
w, R.N., D.V. Waddington, and P.E. Rieke. 200

115
Coale, F.J., P.S. Porter, and W. Davis. 1994. Soil amendments for reducing phosphorus concentrations of drainage water from Histosols. Soil Sci. Soc. Am. J. 58:1470-1475.
Comer, J. 1999. Impact of soil amendments on moisture retention and reduction of nutrients loss from a simulated USGA green profile. M.S. thesis. Univ. of Florida,Gainesville.
rooting and . Crop Sci. 38:1639-1644.
, DC.
soil analysis. ASA, Madison, WI.
iol. 33(5):1037-1041.
and l. 19(3):345-
354.
Feldh Factors influencing rate in urban environments. Agron. J. 75:924-930.
Feldhnse to deficit irrigation. Agron. J. 76:85-89.
on
Cooper, R.J., C. Liu, and D.S. Fisher. 1998. Influence of humic substances onnutrient content of creeping bentgrass
Crawley, W., and D. Zabcik. 1985. Golf green construction using perlite as an amendment. Golf Course Manage. 53(7):44-52.
Danielson, R.E., C.M. Feldhake, and W.E. Hart. 1981. Urban lawn irrigation and management practices for water saving with minimum effect on lawn quality. Complete Rep. Office of Water Res. and Technol. Proj. No. A-043-Colo., FortCollins, Co. U.S. Dep. of the Interior, Washington
Day, P.R. 1965. Particle fractionation and particle-size analysis. p. 545-567. In C.A. Black (ed.) Methods of
Dean-Raymond, D., and M. Alexander. 1977. Bacterial metabolism of quaternary ammonium compounds. Appl. Environ. Microb
DeRoo, H.C. 1980. Nitrate fluctuations in groundwater as influenced by use of fertilizer. Con. Agric. Exp. Sta. Bull. 779, New Haven, Conn., p. 13.
Elliott, H.A., and L.M. Singer. 1988. Effect of water treatment sludge on growthelemental composition of tomato shoots. Commun. Soil Sci. Plant Ana
ake, C.M., R.E. Danielson, and J.D. Butler. 1983. Turfgrass evapotranspiration. I.
ake, C.M., R.E. Danielson, and J.D. Butler. 1984. Turfgrass evapotranspiration. II. Respo
Ferguson, G.A., I.L. Pepper, and W.R. Kneebone. 1986. Growth of creeping bentgrass a new medium for turfgrass growth: clinoptilolite zeolite-amended sand. Agron. J.78:1095-1098.
Ferguson, G.A., and I.L. Pepper. 1987. Ammonium retention in sand amended with clinoptilolite. Soil Sci. Soc. Am. J. 51:231-234.
Flocker, W.J., J.A. Vomocil, and F.D. Howard. 1959. Some growth responses of tomatoes to soil compaction. Soil Sci. Soc. Am. Proc. 23:188-191.

116
Flury, M., M.V. Yates, and W.A. Jury. 1999. Numerical analysis of the effect of the lower boundary condition on solute transport in lysimeters. Soil Sci. Soc. Am. J.63:149
3-1499.
Frank, A.B., R.E. Barker, and J.D. Berdahl. 1987. Water-use efficiency of grasses grown
Fresenburg, B.S. 1999. Soil amendments for Missouri athletic fields: Infield soils and Missouri].
Fu, J., J. Fry, and B. Huang. 2003. Effects of deficit irrigation on photosynthesis, 2002
Geert 4. Long-term effects of sludge application to land. J. AWWA. 86:11-64.
Gilbe alkyltrimethylammonium bromides. Lett. Appl. Microbiol. 1:101-104.
Goto, l zeolites as soil conditioners: III. Determination of the ion-exchange selectivity coefficients of
Gregory, P.J., L.P. Simmonds, and C.J. Pilbeam. 2000. Soil type, climatic regime, and the
Halberg, G.R. 1987. The impacts of agricultural chemicals on groundwater quality. Geo. Journal. 15:283-295.
Harri horus retention as related to morphology of sandy coastal plain soil material. Soil Sci.
Hatfield, J.L., T.J. Sauer, and J.H. Prueger. 2001. Managing soils to achieve greater water
Havlin, J.L., J.D. Beaton, S.L. Tisdale, and W.L. Nelson. 1999. Nitrogen. In L. Harvey (ed.) Soil fertility and fertilizers 6th ed. Prentice Hall. Upper Saddle River, NJ.
Heil, t sludge influence on the growth of sorghum-sudangrass. J. Environ. Qual. 18:292-298.
Hillel ntal soil physics. Academic Press. San Diego, CA.
Follett, R.F. (ed.). 1989. Nitrogen management and groundwater protection. In Developments in agricultural managed-forest ecology #21. Elsevier, New York.
under controlled and field conditions. Agron. J. 79:541-544.
topdressings. p. 7-8. In Turfgrass: 1999 Research & Information Report [
respiration, and water use efficiency of zoysiagrass and tall fescue. p. 88-93.Turfgrass Research Report, Kansas State University.
sema, W.S., W.R. Knocke, J.T. Novak, and D. Dove. 199
rt, P., and A. Al-taae. 1985. Antimicrobial activity of some
I., and M. Ninaki. 1980. Studies on the agriculture utilization of natura
natural zeolites. J. Agric. Sci. Tokyo Nogyo Daigaku 25(2):168.
response of water use efficiency to crop management. Agron. J. 92:814-820.
s, W.G., R.D. Rhue, G. Kidder, R.B. Brown, and R. Littell. 1996. Phosp
Soc. Am. J. 60:1513-1521.
use efficiency: a review. Agron. J. 93:271-280.
D.M., and K.A. Barbarick. 1989. Water treatmen
, D. 1998. Flow of water in saturated soil. p. 173-201. In Environme

117
Huang, Z. T. and A. M. Petrovic. 1991. Clinoptilolite zeolite amendment of sand influence on water use efficiency of creeping bentgrass and nitrate leaching. Agron. Abst. 177.
leaching .
23:1190-1194.
Huds y. J. Soil and Water Cons. 49(2):189-194.
Hull, In D.V. Waddington et al. (ed.) Turfgrass. Agronomy Monogr. 32. ASA, SSSA,
Humm il, or compost? Golf Course Manage. 68(4)57-60.
Ippol Co-application effects of water treatment residuals and biosolids on two range grasses. J. Environ. Qual. 28:1644-
Kirkham, R.R., G.W. Gee, and T.L. Jones. 1984. Weighing lysimeters for long-term
Korai mmonium compounds. Hakko Kogaku Zasshi 48:635-640.
KluteMethods of soil analysis. Part 1. Agron. Monogr. 9. ASA and SSSA, Madison, WI.
Lawtin, L.A., and G.A. Codd. 1991. Cyanobacterial (blue-green algae) toxins and their significance in UK and European waters. J. Inst. Wat. Environ. Managt. 5:460:465.
Letey , nd wetting agents in turfgrass management III. Effects
on oxygen diffusion rate and root growth. Agron. J. 58:531-535.
Lewis, M.D., F.D. Moore, III, and R.L. Goldsberry. 1984. Ammonium-exchanged clinoptilolite with urea as nitrogen fertilizer. p. 105-111. In W.G. Pond and F.A.
:1121-1125.
lolite.
Huang, Z.T., and A.M. Petrovic. 1994. Clinoptilolite zeolite influence on nitrateand nitrogen use efficiency in simulated sand based golf greens. J. Environ. Qual
on, B.D. 1994. Soil organic matter and available water capacit
R.J. 1992. Energy relations and carbohydrate partitioning in turfgrasses. p. 175-205.
and CSSA, Madison, WI.
el, N.W. Jr. 2000. What goes best with sand: peat, so
ito, J.A., K.A. Barbarick, and E.F. Redente. 1999.
1650.
water balance investigations at remote sites. Soil Sci. Soc. Am. J. 48:1203-1205.
, H., and K. Takeichi. 1970. Antimicrobial activity of quaternary a
, A. 1986. Water retention: Laboratory methods. P. 635-662. In A. Klute (ed.)
, J., W.C. Morgan, S.J. Richards, and N Valoras. 1966. Physical soil amendmentssoil compaction, irrigation, a
Mumpton (ed.) Zeo-agriculture, use of natural zeolites in agriculture and aquaculture. Westview Press, Boulder, CO.
Li, D., L.K. Joo, N.E. Christians, and D.D. Minner. 2000. Inorganic soil amendment effects on sand-based sports turf media. Crop Sci. 40
Li, Z. 1999. Sorption kinetics of Hexadecyltrimethylammonium on natural clinoptiLangmuir 15:6438-6445.

118
Li, Z., H.K. Jones, R.S. Bowman, and R. Helferich. 1999. Enhanced reduction of chromate and PCE by palletized surfactant-modified zeolite/ zerovalent iron. Environ. Sci. Techn 33ol. :4326-4330.
Li, Z., S.J. Roy, Y. Zou, and R.S. Bowman. 1998. Long-term chemical and biological
Li, Z., and R.S. Bowman. 1997. Counterion effects on the sorption of cationic surfactant
Lucas, R.E., P.E. Rieke, and R.S. Farnham. 1965. Peats for soil improvement and soil mixes. Ext. Bull. 593. Mich. State Univ., East Lansing.
MacKown, C.T., and T.C. Tucker. 1985. Ammonium nitrogen movement in a coarse-textured soil amended with zeolite. Soil Sci. Soc. Am. J. 49:235-238.
Makrrticle phosphorus diffusion in a drinking water treatment residual at room
temperature. J. Coll. and Inter. Sci. 277:417-423.
Malec from Sediment in the Lower St. Johns River Estuary. J. Environ. Qual. 33:1545-
Mannion, B. 1996. Topdressing and aeration strategies. California Fairways 5(4):24-30.
Marti14:24-26.
McCoturf rootzones mixes. Agron. J. 84:375-381.
McCo zones. J.
Turfgrass Manage. 2:49-69.
McInarnham
rth
Li, Z., I, Anghel, and R.S. Bowman. 1998. Sorption of oxyanions by surfactant-modified zeolite. J. Disp. Sci. Tech. 19(6&7):843-857.
stability of surfactant-modified zeolite. Environ. Sci. Technol. 32:2628-2632.
and chromate on natural clinoptilolite. Environ. Sci. Technol. 31:2407-2412.
is, K.C., H. El-Shall, W.G. Harris, G.A. O’Connor, and T.A. Obreza. 2004. Intrapa
ki, L.M., J.R. White, and K.R. Reddy. 2004. Nitrogen and Phosphorus Flux Rates
1555.
n, A., and G.D. Cooke. 1994. Health risks in eutrophic water supplies. Lake Line
y, E.L. 1992. Quantitative physical assessment of organic materials used in sports
y, E.L., and R.C. Stehouwer. 1998. Water and nutrient retention properties of internally porous inorganic amendments in high sand content root
tyre, D.S. 1974. In J. Loveday (ed.) Methods of analysis for irrigated soils. Commonwealth Agricultural Bureaux Technical Communication No 54, FRoyal, England.
Meier, W.M., and D.H. Olson. 1988. Atlas of zeolite structure types. 2nd ed. Butterwoand Co. Ltd., London, UK.

119
Mercer, B.W., L.L. Ames, T.J. Touhill, W.J. Van Slyke, and R.B. Dean. 1970. Amremoval from secondary effluents by selective ion exchange. J. Water Poll. CoFed. 42:R95-R107.
monia nt.
of water conservation: Determining crop coefficient of turfgrasses. p. 357-364. In F. Lemaire (ed.) Proc. 5th Int.
.,
SSA, Madison, WI.
Morton, T.G., A.J. Gold, and W.M. Sullivan. 1988. Influence of over watering and 30.
Nace, cular, No. C 0536. U. S. Geological Survey, Reston, VA.
Nkedn during displacement of hydrophobic organic chemicals and calcium-45
through soil columns with aqueous and mixed solvents. Environ. Sci. Technol.
ent of creeping bentgrass on sandy media. Hortscience 26(2):117-119.
rium of hydrophobic organic
chemicals by organoclays. Environ. Sci. Technol. 30(1):89-96.
O’Co . Final lorida Department of Environmental Protection.
tems for
rt 2, 2nd ed. Agronomy Monogr. 9. ASA and SSSA, Madison, WI.
Meyer, J.L., V.A. Gibeault, and V.B. Younger. 1985. Irrigation of turfgrass below replacement of evapotranspiration as a means
turfgrass res. conf., Avignon, France. 1-5 July. Inst. Natl. de la Recherche AgronParis.
Miller, G.L. 2000. Physiological response of bermudagrass grown in soil amendments during drought stress. Hortscience 35(2):213-216.
Ming, D.W., and F.A. Mumpton. 1989 Zeolites in soils. p. 874-911. In J.B. Dixon and S.B. Weed (ed.) Minerals in soil environments. 2nd ed. S
Minner, D. 1988. Turfgrass culture and water use. Landscape Manage. 28(2):60-68.
fertilization on nitrogen losses from home lawns. J. Environ. Qual. 17:124-1
N.L. 1967. Are we running out of water? p. 7. Cir
i-Kizza, P., Brusseau, M.L.; Rao, P.S.C., Hornsby, A.G. 1989. Nonequilibrium sorptio
23:814-820.
Nus, J.L., and S.E. Brauen. 1991. Clinoptilolite zeolite as an amendment for establishm
Nzengung, V.A., E.A. Voudrias, P. Nkedi-Kizza, J.M. Wampler, and C.E. Weaver. 1996.Organic cosolvent effects on sorption equilib
nnor, G.A., and D. Sarkar. 1999. Fate of applied residuals-bound phosphorusReport, Contract WM 661, F
Ok, C., S.A. Anderson, and E.H. Ervin. 2003. Amendments and Construction SysImproving the Performance of Sand-Based Putting Greens. Agron. J. 95:1583-1590.
Olsen, S.R., and L.E. Sommers. 1982. Phosphorus. p. 403-430. In A.L. Page et al. (ed.) Methods of soil analysis. pa
120
Petrovic, A.M. 1990. The fate of nitrogenous fertilizers applied to turfgrass. J. Environ. Qual. 19:1-14.
Pierzynshki, G.M., J.T. Sims, and G.F. Vance. 1994. Soil and Environmental Quality.
Porte orption
Pratt, P.F. 1984. Nitrogen use and nitrate leaching in irrigated agriculture. p. 319-333. In
Ralston, D.S., and W.H. Daniel. 1973. Effect of porous rootzone materials underlined
Richardson, M., and D. Karcher. 2001. Inorganic amendments and aerification recovery.
ure and ge. Commun. Soil Sci. Plant Anal. 11:533-
545.
Rodri 27.
Rowell, D.L. 1994. Soil science: methods and applications. Longman Scientific, Harlow,
Salisbury, F.B., and C.W. Ross. 1992. Mineral nutrition. p. 116-135. In Plant physiology.
Sartai sources. p. 77-84. In Turfgrass research in florida. T.E. Freeman. (ed.) Univ. of Fl., Gainesville, FL.
Sartai .
Sartain, J.B., and H.D. Gooding. 2000. Reducing nitrate leaching during green grow-in.
SAS
Scambilis, N.A. 1977. Land disposal of chemical sludges. Ph.D. diss., Univ. of Missouri, Columbia.
Lewis Publishers, Boca Raton, FL.
r, P.S., and C.A. Sanchez. 1992. The effect of soil properties on phosphorus sby Everglades Histosols. Soil Sci. 154:387-398.
R.D. Hauck (ed.) Nitrogen in crop production. Am. Soc. Agron. Madison, WI.
with plastic on the growth of creeping bentgrass. Agron. J. 65:229-232.
Golf Course Mange. 69(10):58-62.
Reddy, K.R. 1982. Mineralization of nitrogen in organic soils. Soil Sci. Soc. Am. J.46:561-566.
Rengasamy, P., J.M. Oades, and T.W. Hancock. 1980. Improvement of soil structplant growth by addition of alum slud
quez, I.R., and G.L. Miller. 2000. Using near infrared reflectance spectroscopy toschedule nitrogen applications on dwarf-type bermudagrasss. Agron. J. 92:423-4
UK.
4th ed. Wadsworth Publishing Company, Belmont, CA.
n, J.B. 1990. Leaching studies involving selected slow-release N
n, J.B. 1999. Iron nutrition improves turf’s mettle. Grounds Main. 34(8):24-28
Sartain, J.B., and J. Comer. 2004. Influence of soil amendments on water-use-efficiency, bermudagrass growth, and nutrient leaching. Fla. Turf. Dig. 21(3):8-11.
Golf Course Manage. 68(4):70-73.
Institute. 1987. SAS user’s guide: Statistics. 6th ed. SAS Inst., Cary, NC.

121
Schantz, H.L., and L.N. Piemeisel. 1927. The water requirement of plants at Akron, Colorado. J. Agric. Res. 34:1093-1189.
anic matter. p. 275-330. In Environmental
organic chemistry. 2nd ed. John Wiley & Sons, Hoboken, NJ.
Semm tural zeolites. p. 45-54. In W.G. Pond and F.A. Mumpton (ed.) Zeo-agriculture: use of natural zeolites in agriculture
Shaddox, T.W. 2001. Fate of nitrogen during grow-in of a golf course fairway under
ction Record. 39(5):17-18.
on properties and on yield and quality of putting greens. Agron . J.
54:393-395.
Snydetion for reducing N leaching in bermudagrass turf. Agron. J. 76:964-969.
tigations Report No. 42, Version 3.0. USDA-Natural Resources Conservation Service-National Soil Survey Center, Lincoln, NE.
Starre nitrogen applied to turfgrass-covered soil columns. J. of Irrg. Drain. Eng. 121:390-395.
Stoutaffected by soil drainage and nitrogen fertilization on two floodplain soils. J. Soil
rass under humid conditions. Soil Sci. Soc.
Schwarzenback, R.P., P.M. Gschwend, and D.M. Imboden. 2003. General introductionand sorption processes involving org
ens, M.J. 1984. Cation-exchange properties of na
and aquaculture. Westview Press, Boulder, CO.
different nitrogen management practices and irrigation intensities. M.S. Thesis. Univ. of Florida, Gainesville.
Shuman, L.M. 2001. Nitrogen and phosphorus loss from greens and fairways: Is there a potential problem? USGA Green Se
Smalley, R.R., W.L. Pritchett, and L.C. Hammond. 1962. Effects of four amendmentssoil physical
r, G.H., B.J. Augustin, and J.M. Davidson. 1984. Moisture sensor controlled irriga
Snyder, R.H. 2003. Investigation of coated sands and peat for use in golf course putting green construction. Ph.D. diss. Univ. of Florida, Gainesville.
Soil Survey Laboratory Staff. 1996. Soil survey laboratory manual. p. 693. Soil Survey Inves
tt, S.K., N.E. Christians, and R. Al Austin. 1995. Fate of
, W.L., and R.R. Schnabel. 1997. Water-use efficiency of perennial ryegrass as
and Water Cons. 52(3):207-211.
Stout, W.L. 1992. Water-use efficiency of grasses as affected by soil, nitrogen, and temperature. Soil Sci. Soc. Am. J. 56:897-902.
Stout, W.L., G.A. Jung, and J.A. Shaffer. 1988. Effects of soil and nitrogen on water useefficiency of tall fescue and switchgAm. J. 52:429-434.
Sylvia, D.M., J.J. Fuhrman, P.G. Hartel, and D.A. Zuberer. 1997. Principles and applications of soil microbiology. Prentice-Hall, Inc. Englewood Cliffs, N.J.

122
Tate, L.R. 1977. Nitrification in Histosols: a potential role for heterotrophic nitrifier. Appl. Environ. Microbial. 33:911-914.
Taylor, D.H., C.F. Williams, and S.D. Nelson. 1997. Water retention in root-zone soil mixtures of layered profiles used for sports turf. Hortscience 32(1):82-85.
United States Golf Association, Green Section Staff. 1993. Specifications for a method of
Van Genuchten, M. 1981. Th. Research Report No. 119, USDA Salinity Laboratory, Riverside, CA.
Varsh on Plant Anal. 24(17&18):2493-2505.
Waddington, D.V. 1992. Soils, soil mixtures, and soil amendments. p. 331-383. In D.V.
Waltz, C., and B. McCarty. 2000. Soil amendments affect turf establishment rate. Golf Course Manage. 68(7):59-63.
Waltzproperties of rootzone mixes amended with inorganics for golf putting greens.
Wehtje, G.R., J.N. Shaw, R.H. Walker, and W. Williams. 2003. Bermudagrass growth in
Wess relation to soils and crops. p. 461-504. In J.N. Luthin (ed.) Drainage of agricultural lands. ASA, Madison, WI.
White of Everglades Wetland Soils along a Phosphorus-Impacted Gradient. J. Environ. Qual. 32:2436-
Younger, V.B., and A.W. Marsh, R.A. Strohman, V.A. Gibeault, and S. Spaulding. 1981. Water use and quality of warm-season and cool-season turfgrasses. p. 251-257. In
3 ll., Univ. of Guelph, Guelph, ON.
putting green construction, the 1993 revision. 31(2):1-3.
ovi, A., and J.B. Sartain. 1993. Chemical characteristics and microbial degradatiof humate. Commun. Soil Sci.
Viets, F.G., Jr. 1962. Fertilizers and the efficient use of water. Adv. Agron. 14:223-264.
Waddington et al. (ed.) Turfgrass. Agron. Monogr. 32. ASA, Madison, WI.
, F.C., V.L. Quisenberry, and L.B. McCarty. 2003. Physical and hydraulic
Agron. J. 95:395-404.
soil supplemented with inorganic amendments. Hortscience 38(4):613-617.
eling, J., and W.R. van Wijk. 1957. Land drainage in
, J.R., and K.R. Reddy. 2004. Nitrification and Denitrification Rates
2443.
R.W. Sheard (ed.) Proc. 4th Int. turfgrass res. conf., Guelph, ON, Canada. 19-2July. Int. Turfgrass Soc., and Ontario Agric. Co
Travis Shaddox was born in Shawnee, Oklahoma, on February 10, 1976. After
receiv in horticulture from Oklahoma State University in 1999,
accepted to the university as a graduate student with Dr. Jerry Sartain. Throughout the
next two years he investigated nitrogen leaching during turfgrass establishment, and in
2001,
in
received Travis as his graduate student to continue his work towards a Ph.D. degree in
degree, Travis would like to continue using his knowledge and skills in fertilizers and soil
fertili
BIOGRAPHICAL SKETCH
ing his bachelor’s degree
he moved to Gainesville with the hopes of attending the University of Florida. He was
he fulfilled his requirements and was awarded a Master of Science degree.
Having enjoyed his experience in Gainesville, he wished to remain there to
continue working on his doctorate degree. As luck would have it, Dr. Sartain aga
the Soil and Water Science Department at the University of Florida. After earning his
ty at either a university or industry position.
123