soil amendments, fertilizers, mulches, and cover crops ...ccag-eh.ucanr.edu/files/271979.pdf ·...
TRANSCRIPT
Soil Amendments, Fertilizers, Mulches, and Cover Crops: Think Outside the Bag
Santa Clara Master Gardener Talk October 19, 2017
Chuck Ingels
Farm & Horticulture Advisor
UCCE Capitol Corridor MCP, Sacramento County
http://ccag-eh.ucanr.edu
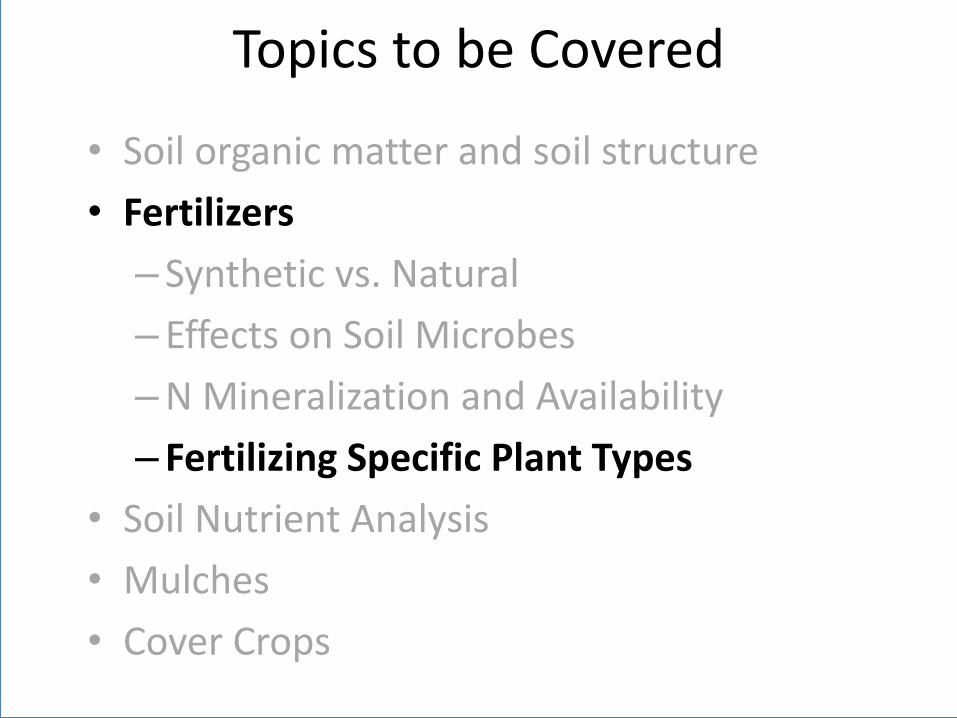
Topics to be Covered
• Soil organic matter and soil structure
• Fertilizers
– Synthetic vs. Natural
– Effects on Soil Microbes
– N Mineralization and Availability
– Fertilizing Specific Plant Types
• Soil Nutrient Analysis
• Mulches
• Cover Crops

Topics to be Covered
• Soil organic matter and soil structure
• Fertilizers
– Synthetic vs. Natural
– Effects on Soil Microbes
– N Mineralization and Availability
– Fertilizing Specific Plant Types
• Soil Nutrient Analysis
• Mulches
• Cover Crops
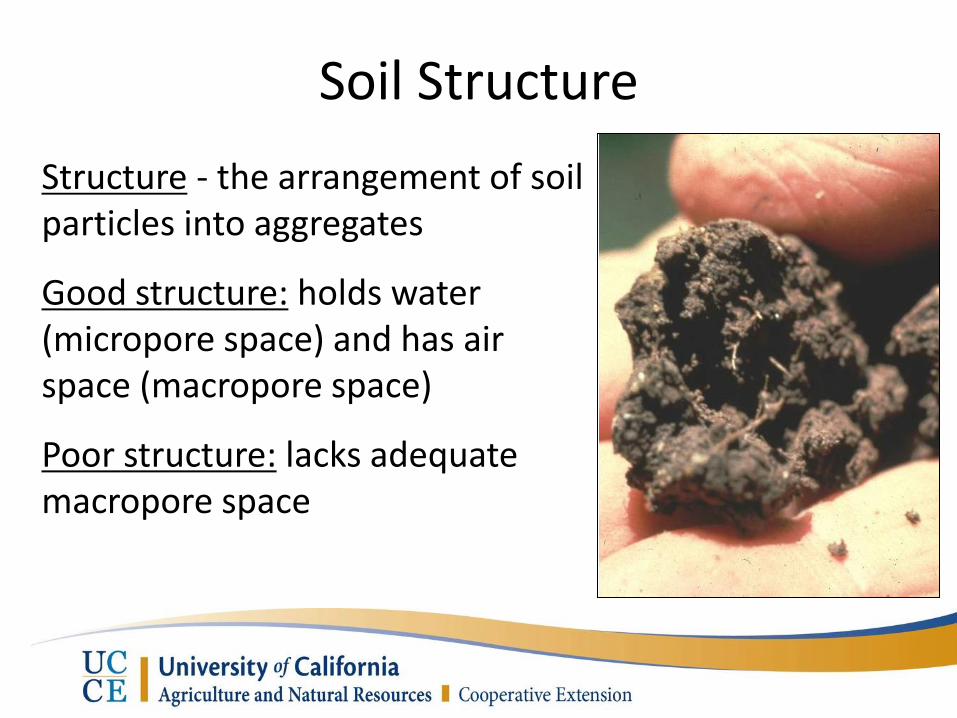
Soil Structure
Structure - the arrangement of soil particles into aggregates
Good structure: holds water (micropore space) and has air space (macropore space)
Poor structure: lacks adequate macropore space
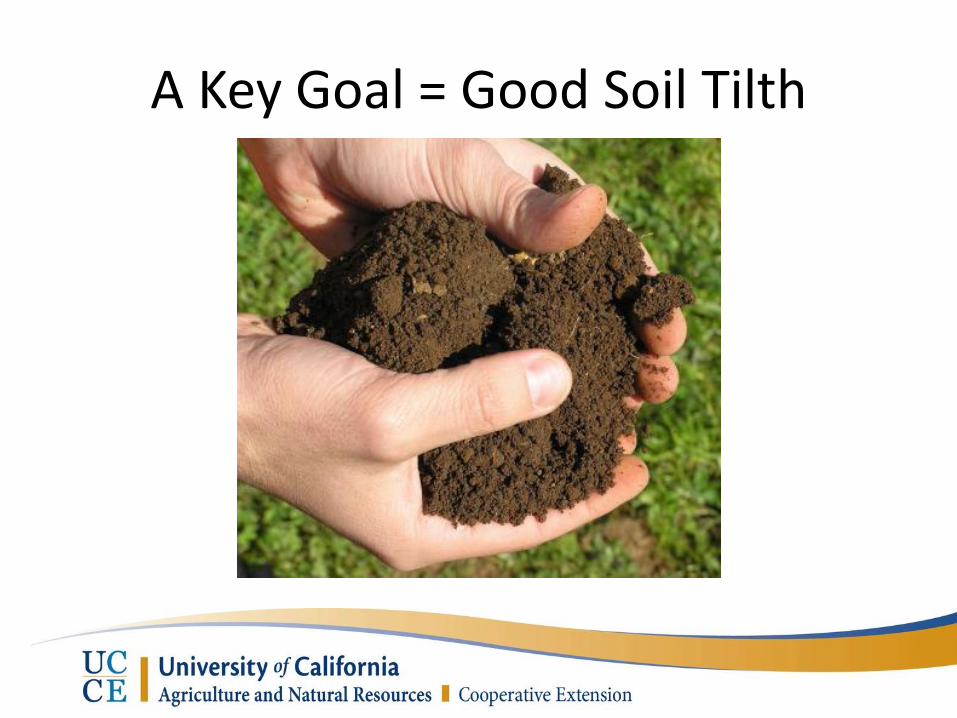
A Key Goal = Good Soil Tilth
Soil Organic Matter
• Serves as energy source (food) for microorganisms, which promote stable aggregation of the soil particles
• Essential nutrients are obtained by plants as organic matter decomposes
• Enhanced by OM additions but destroyed by cultivation
How Organic Matter Additions Improve the Soil
• Increased biological activity
• Increased soil aggregation
• Decomposition releases nutrients
• Increased pore structure
– Improved water retention (sandy soil) and infiltration (clay soil)

• Bacteria, polysaccharides, etc. – micro-aggregate formation
• Fungal hyphae – enmeshing micro-aggregates into macro-aggregates
Soil Aggregation
© 2012 Nature Education
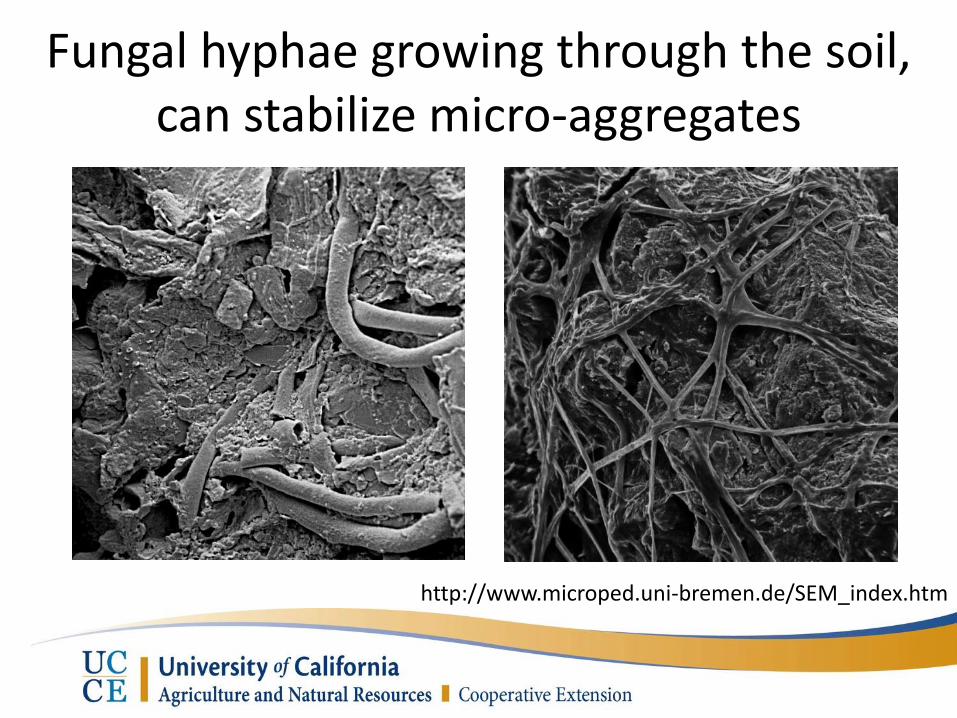
http://www.microped.uni-bremen.de/SEM_index.htm
Fungal hyphae growing through the soil, can stabilize micro-aggregates
Topics to be Covered
• Soil organic matter and soil structure
• Fertilizers
– Synthetic vs. Natural
– Effects on Soil Microbes
– N Mineralization and Availability
– Fertilizing Specific Plant Types
• Soil Nutrient Analysis
• Mulches
• Cover Crops
Synthetic Fertilizers
• Commonly derived from petroleum
• A typical 40-pound bag of lawn fertilizer contains the fossil-fuel equivalent of 2.5 gallons of gasoline (Univ. of Vermont)
• Prolonged use of ammonia-based fertilizers can greatly reduce soil pH
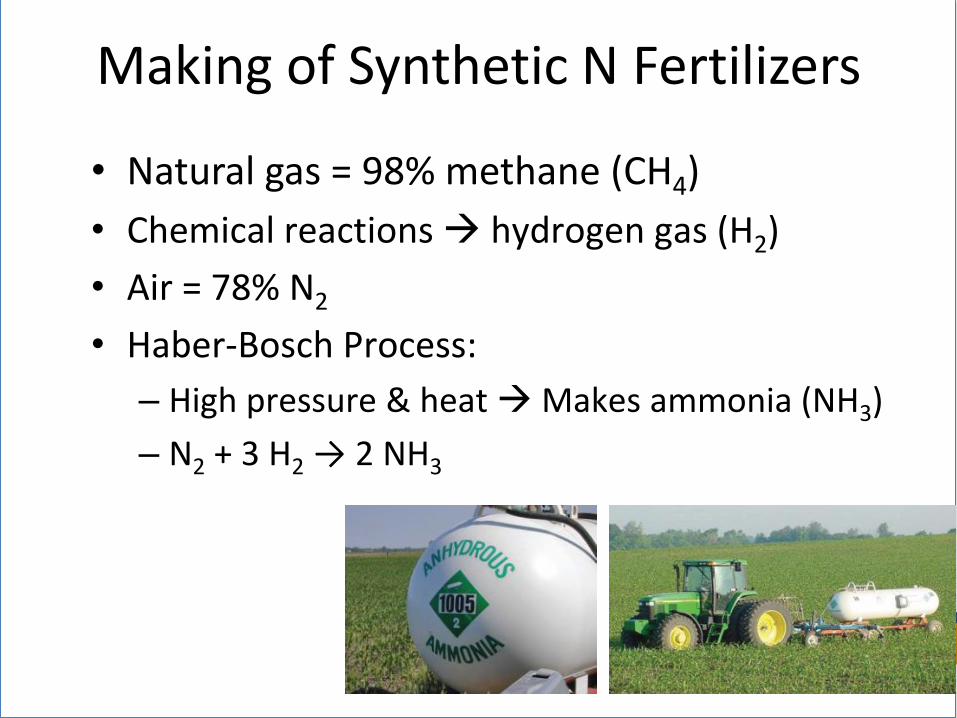
Making of Synthetic N Fertilizers
• Natural gas = 98% methane (CH4)
• Chemical reactions hydrogen gas (H2)
• Air = 78% N2
• Haber-Bosch Process:
– High pressure & heat Makes ammonia (NH3)
– N2 + 3 H2 → 2 NH3
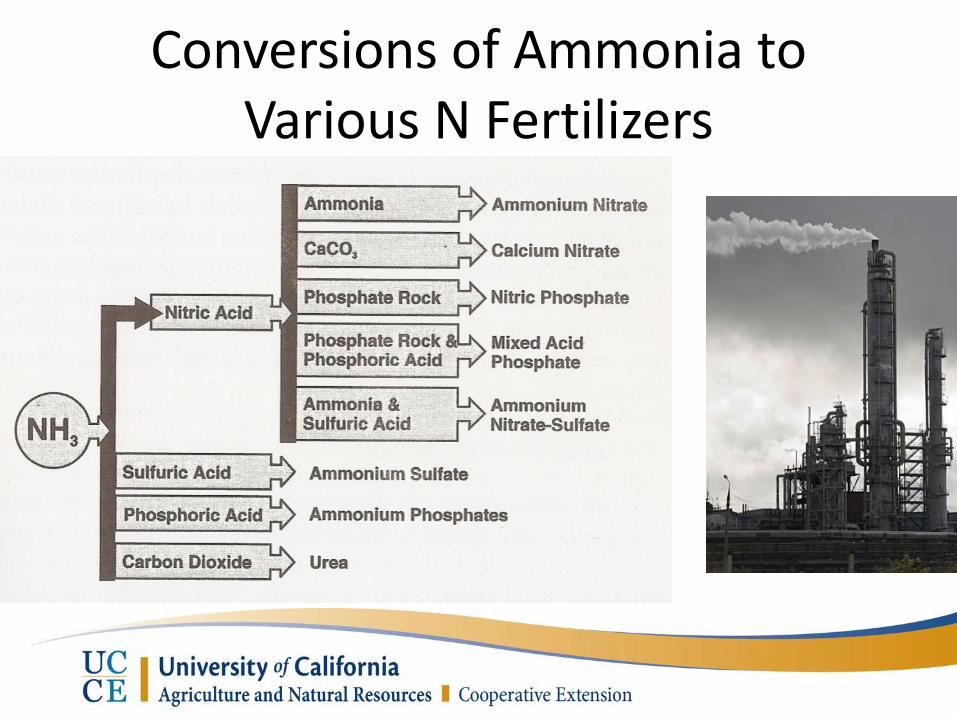
Conversions of Ammonia to Various N Fertilizers
Slow-Release N Fertilizers
• Synthetic
– UF (urea formaldehyde), MU (methylene urea), IBDU (isobutylidenediurea) (uncoated polymers)
– Polymer-coated (e.g., Osmocote)
– Longer lasting, not readily leached
– Label says “Slow Release Nitrogen”
• Water-Insoluble Nitrogen (W.I.N.)
• Natural (e.g., compost, feather meal)
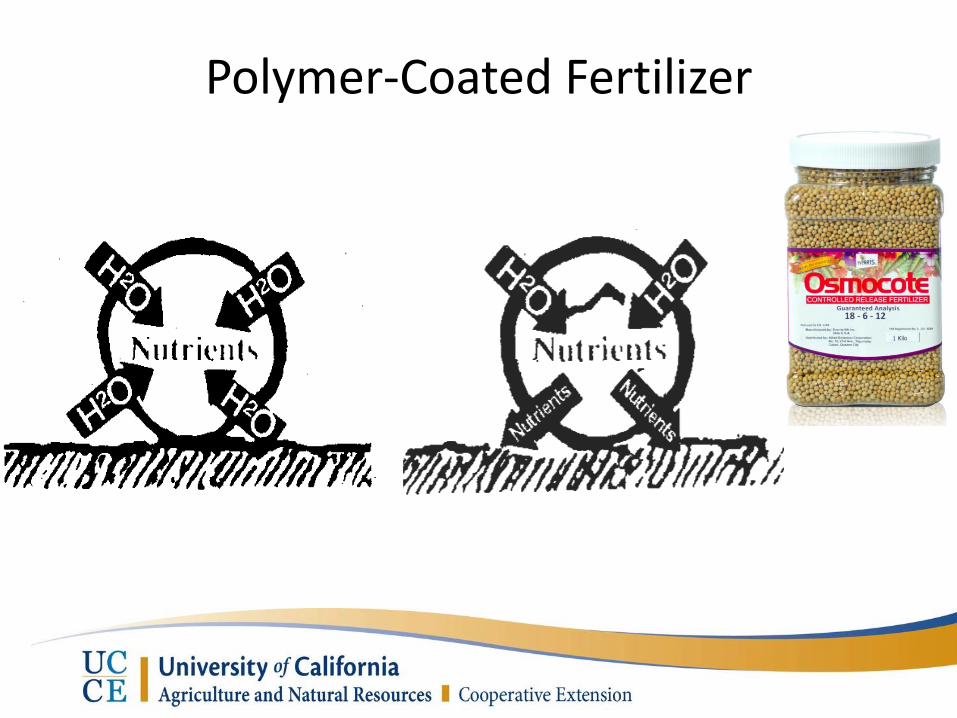
Polymer-Coated Fertilizer
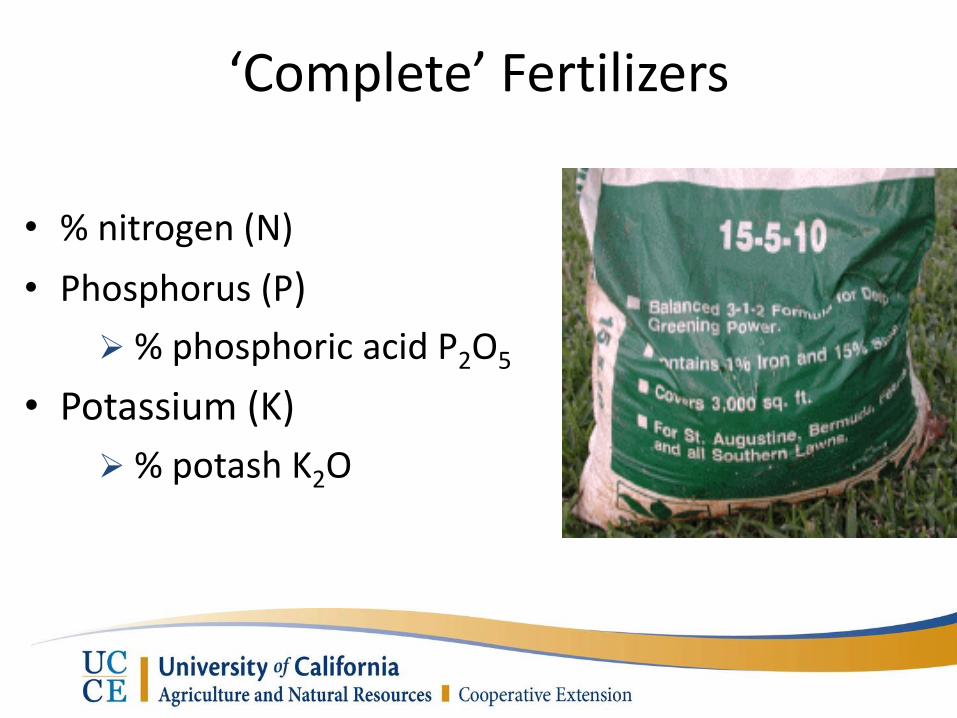
• % nitrogen (N)
• Phosphorus (P)
% phosphoric acid P2O5
• Potassium (K)
% potash K2O
‘Complete’ Fertilizers
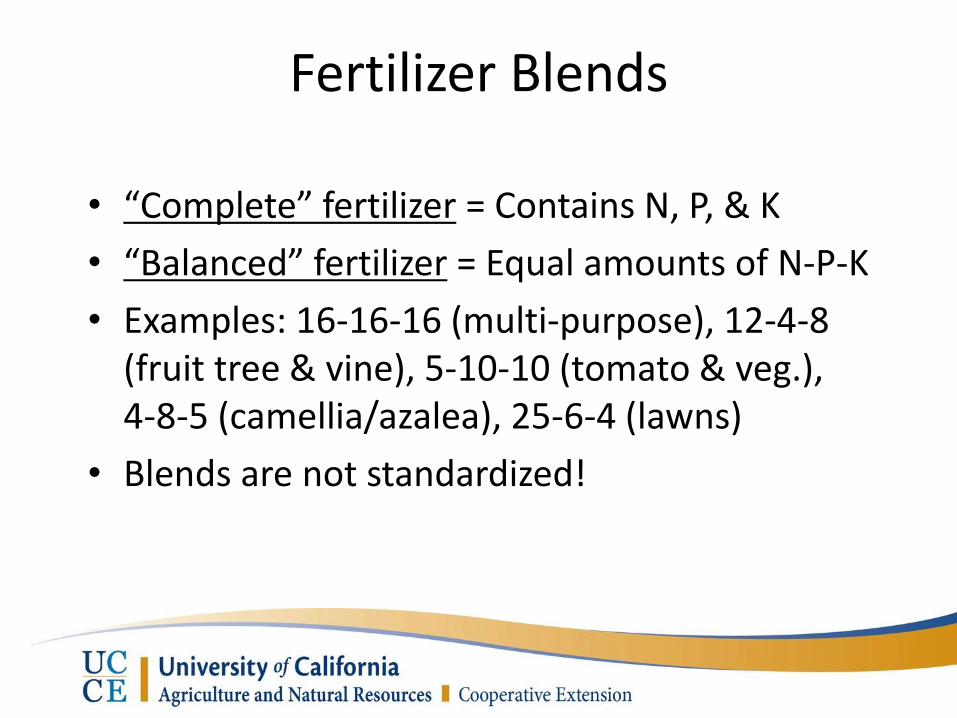
Fertilizer Blends
• “Complete” fertilizer = Contains N, P, & K
• “Balanced” fertilizer = Equal amounts of N-P-K
• Examples: 16-16-16 (multi-purpose), 12-4-8 (fruit tree & vine), 5-10-10 (tomato & veg.), 4-8-5 (camellia/azalea), 25-6-4 (lawns)
• Blends are not standardized!
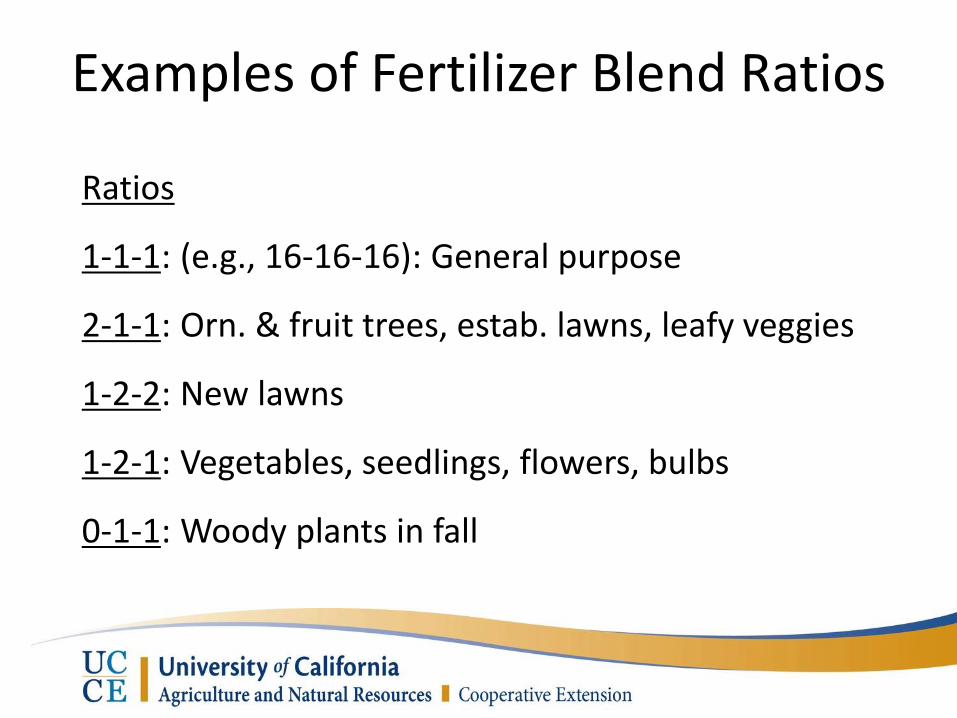
Examples of Fertilizer Blend Ratios
Ratios
1-1-1: (e.g., 16-16-16): General purpose
2-1-1: Orn. & fruit trees, estab. lawns, leafy veggies
1-2-2: New lawns
1-2-1: Vegetables, seedlings, flowers, bulbs
0-1-1: Woody plants in fall
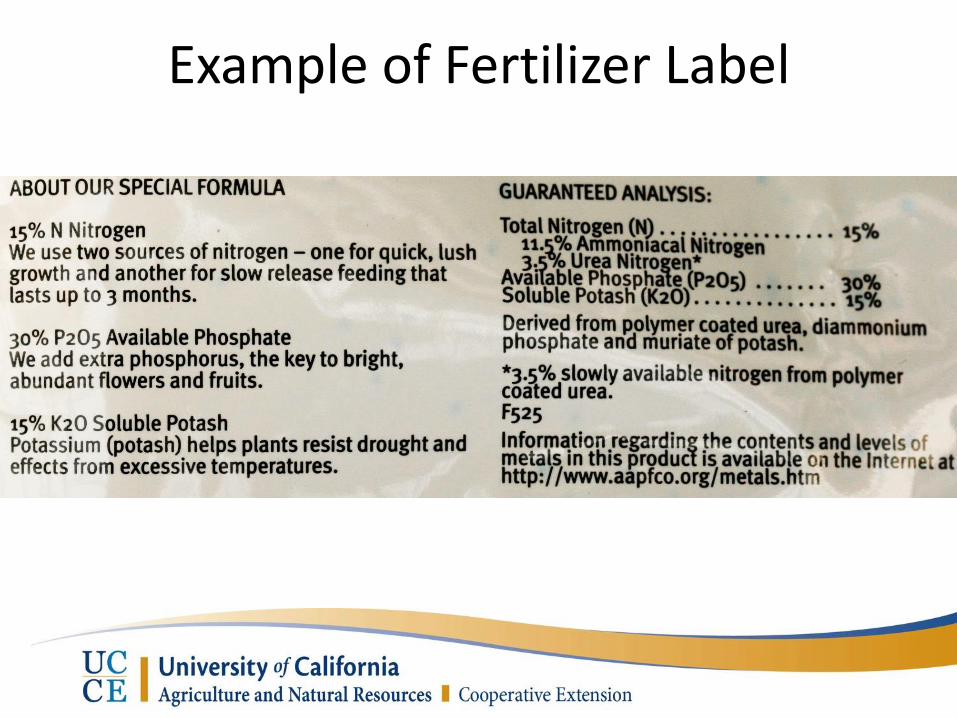
Example of Fertilizer Label
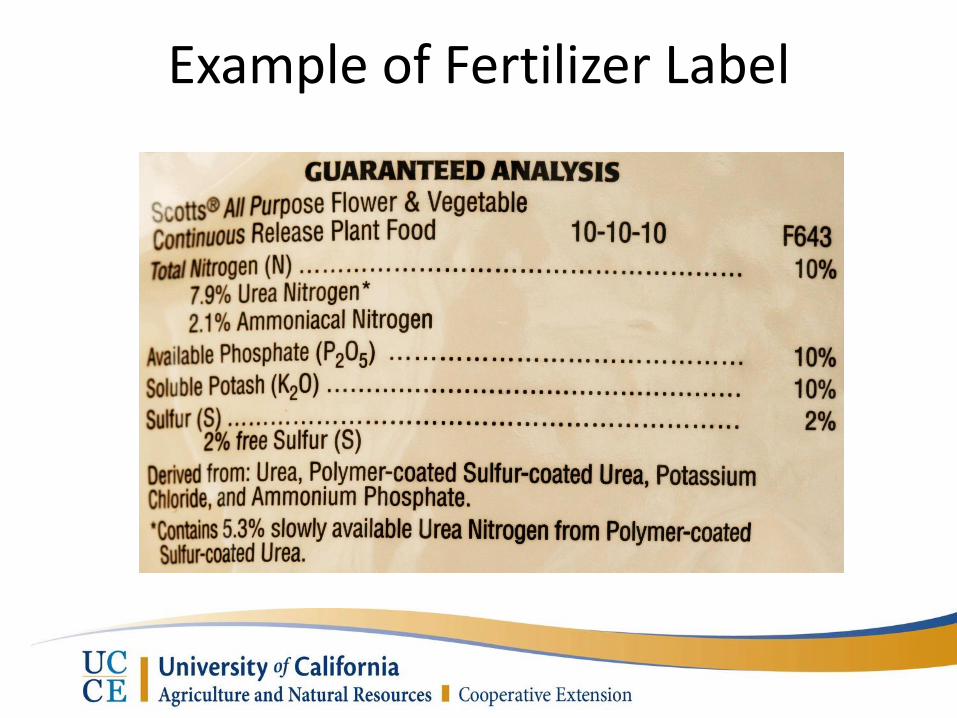
Example of Fertilizer Label
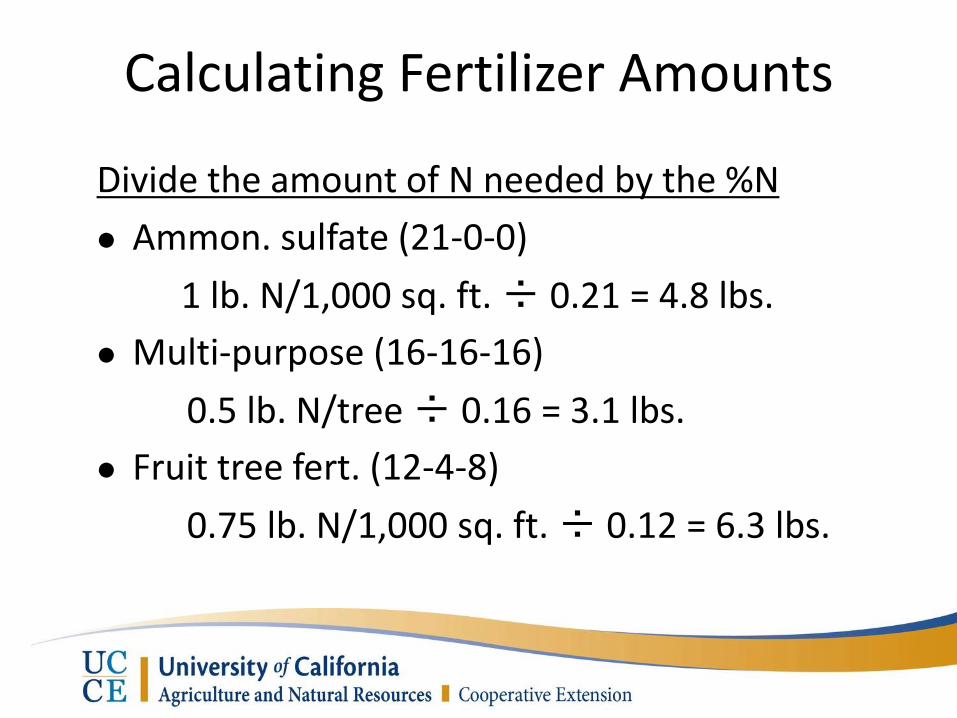
Calculating Fertilizer Amounts
Divide the amount of N needed by the %N
Ammon. sulfate (21-0-0)
1 lb. N/1,000 sq. ft. ÷ 0.21 = 4.8 lbs.
Multi-purpose (16-16-16)
0.5 lb. N/tree ÷ 0.16 = 3.1 lbs.
Fruit tree fert. (12-4-8)
0.75 lb. N/1,000 sq. ft. ÷ 0.12 = 6.3 lbs.

Soil Builders vs Organic Fertilizers
• <2% nitrogen
• Can apply at higher rates
to build SOM
• C/N ratio: 15-30:1
• >2% nitrogen
• Applied at rates
estimated to meet crop
nutrient needs
• Dry organic fertilizers:
C/N ratio: 5:1 or less
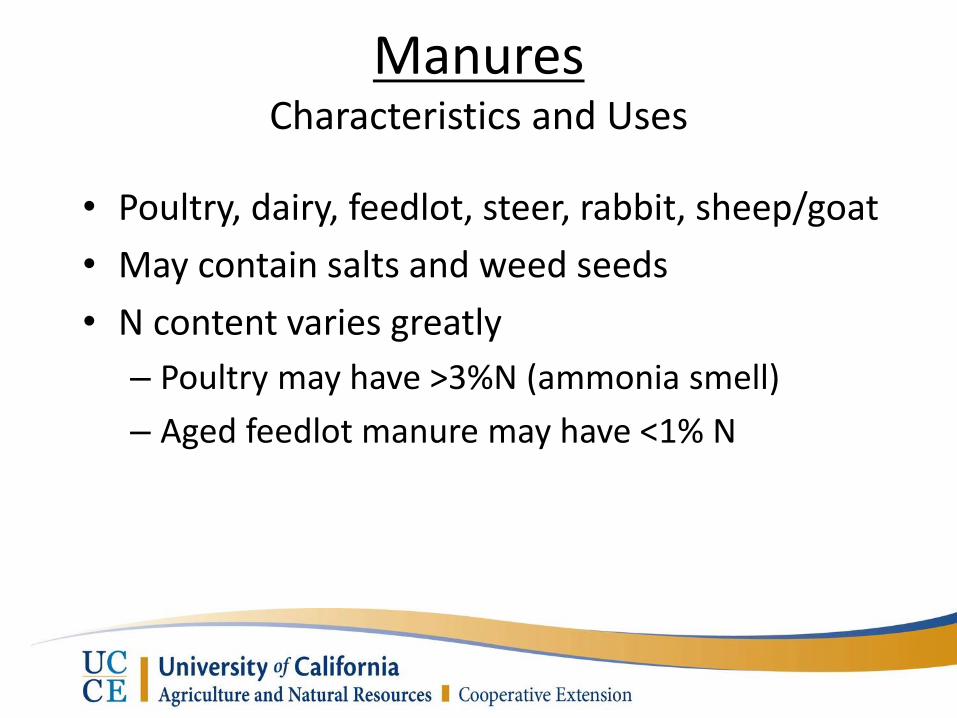
Manures Characteristics and Uses
• Poultry, dairy, feedlot, steer, rabbit, sheep/goat
• May contain salts and weed seeds
• N content varies greatly
– Poultry may have >3%N (ammonia smell)
– Aged feedlot manure may have <1% N

N Content of Raw Manures
(Bary et al., 2000)
Compost Characteristics and Uses
• Contains most nutrients required by plants
• May contain weeds & plant pathogens
• N content usually about 1-2%, very slow release
• Considered a soil amendment, not fertilizer
“Finished” Compost
• Has undergone thermophilic heating process with turning and water
• Temperature low, no ammonia smell
• Contains diverse microbial populations
• Contains most nutrients required by plants
• N content usually 1-2%, very slow release
• Adding an organic soil amendment builds organic matter, fertilizers generally don’t
Earthworm Castings vs. Compost
• Both improve soil structure & nutrient retention
• Earthworm castings likely better:
– Greater microbial activity
– Formation of more humic acids (humification)
– Improved soil aggregation
• Earthworm castings more expensive
• Using compost and some EW castings ideal

• By-product of animal slaughter
– Blood meal (13-0-0)
– Bone meal (2-13-0)
– Feather meal (13-0-0)
– Fish products (4 to 11% N)
Selected Animal-Based Natural Fertilizers
• Manures
– Bat guano
(Up to 10% N, 12% P)
– Livestock manures
Selected Plant-Based Natural Fertilizers
• Alfalfa meal (about 2-1-2)
• Cottonseed meal (6-2-2)
• Soybean meal (7-2-1)
Mined Natural Fertilizers
• Rock phosphate
• Potassium
– Muriate of potash
– Sulfate of potash
– Greensand

Mining of Rock Phosphate
• Source : Natural deposits in N. America, China, Morocco, & former Soviet Union
• N. America – Florida, Idaho/Mont./Utah/
Wyoming, N. Carolina, Tennessee
Rock Phosphate
• Hard-rock phosphate
– 20% P and 48% Ca – can raise pH
– Breaks down very very slowly
• Soft-rock phosphate
– 16% P and 19% Ca, many micronutrients
– Form that plants can use more easily
– Breaks down very slowly
Mining of Potassium Fertilizers
• World reserves deposited when water from ancient inland oceans evaporated
– K salts crystallized into beds of potash ore
– Covered by thousands of feet of soil
• Most deposits chloride (KCl), some sulfate (K2SO4)
• From Canada (#1), Russia, Belarus, US (#7)
– New Mexico, Utah, Canada
Potash
• Historically used for bleaching textiles, making glass, making soap (lye)
• Originally, came from extraction of K2CO3 by leaching ashes and evaporating the solution in iron pots, leaving a white residue ("pot ash“)
• Now potash is the common term used for the fertilizer forms of potassium
• Standard measurement is potassium oxide (K2O)
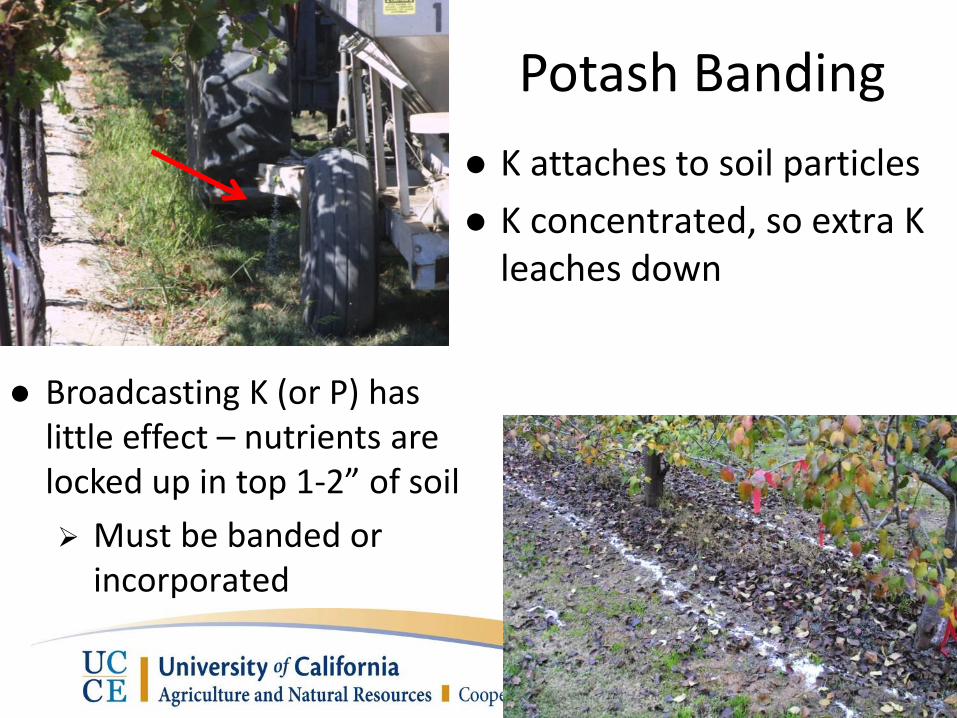
Potash Banding
K attaches to soil particles
K concentrated, so extra K leaches down
Broadcasting K (or P) has little effect – nutrients are locked up in top 1-2” of soil
Must be banded or incorporated
Synthetic Fertilizers
• No C-H linkage, so not used as energy source by soil microbes
• Nutrients in synthetic fertilizers are attached directly together with ionic bonding, which separates or dissociates readily in water
• Because of the lack of carbon, fertilizers “feed the plant but not the soil”
Natural Fertilizers
• Carbon-hydrogen linkage in natural fertilizers slows the release of the nutrient ions
• Carbon forms covalent bonds with carbon and other elements – allows the formation of complex chemicals and structures
• Slow release, low leaching and burning potential
• “Feed the plant and feed the soil”
Synthetic vs. Natural Fertilization
• Plants take up nutrients from natural and synthetic sources (no preference)
• Natural fertilizers feed soil microbes and require them for breakdown
• Microbes (and roots) release compounds like organic acids, enzymes, and chelates convert nutrients from organic form into a plant-available (soluble) form
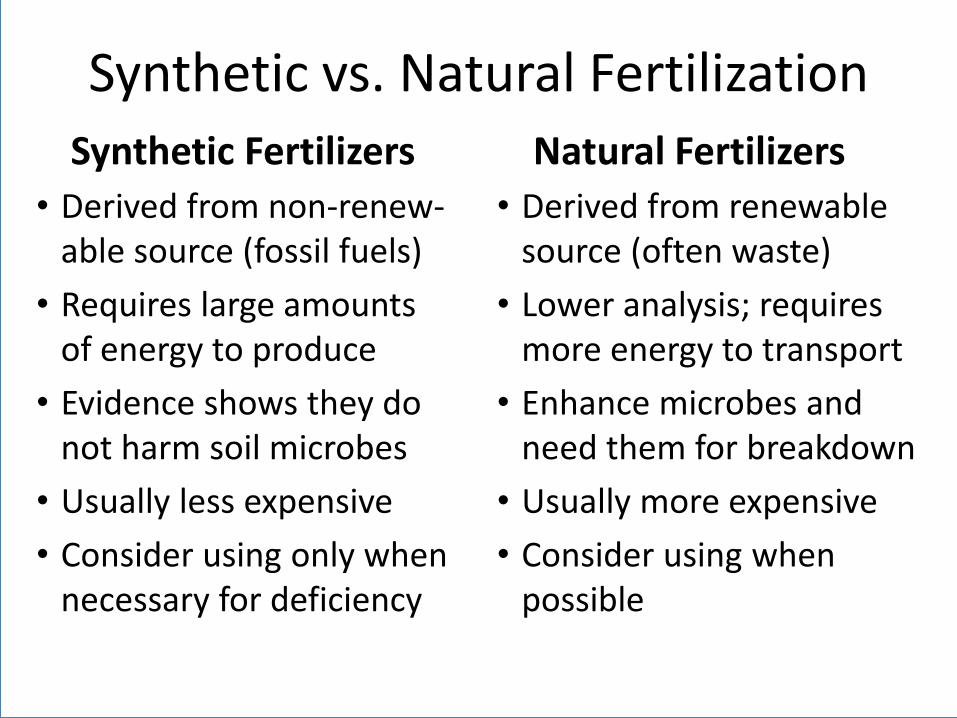
• Derived from non-renew-
able source (fossil fuels)
• Requires large amounts of energy to produce
• Evidence shows they do not harm soil microbes
• Usually less expensive
• Consider using only when necessary for deficiency
Synthetic Fertilizers Natural Fertilizers
• Derived from renewable source (often waste)
• Lower analysis; requires more energy to transport
• Enhance microbes and need them for breakdown
• Usually more expensive
• Consider using when possible
Synthetic vs. Natural Fertilization
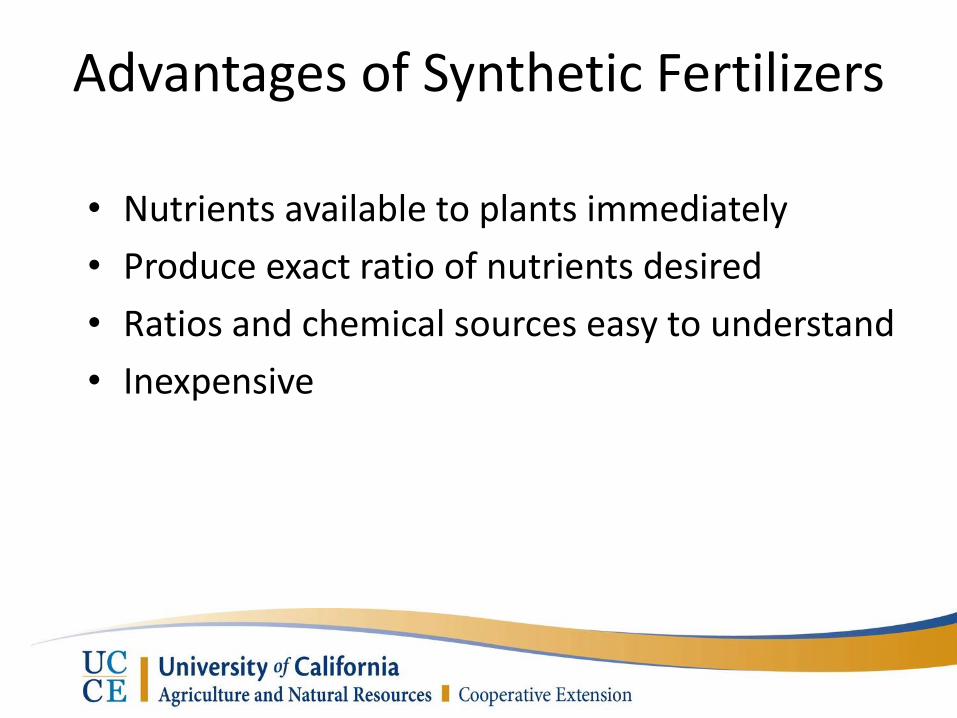
Advantages of Synthetic Fertilizers
• Nutrients available to plants immediately
• Produce exact ratio of nutrients desired
• Ratios and chemical sources easy to understand
• Inexpensive
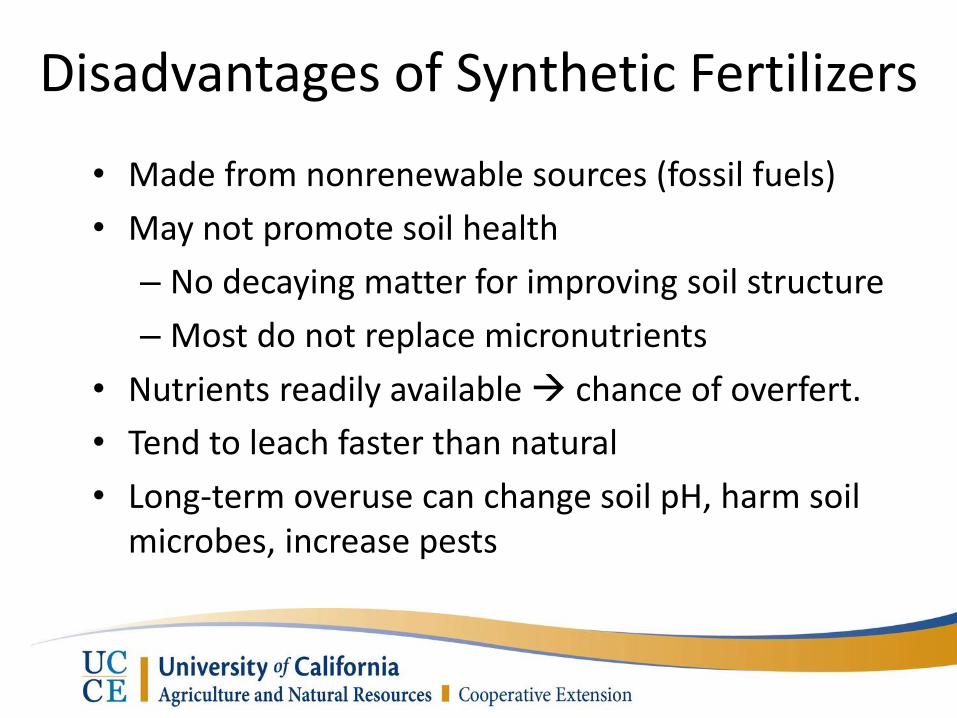
Disadvantages of Synthetic Fertilizers
• Made from nonrenewable sources (fossil fuels)
• May not promote soil health
– No decaying matter for improving soil structure
– Most do not replace micronutrients
• Nutrients readily available chance of overfert.
• Tend to leach faster than natural
• Long-term overuse can change soil pH, harm soil microbes, increase pests
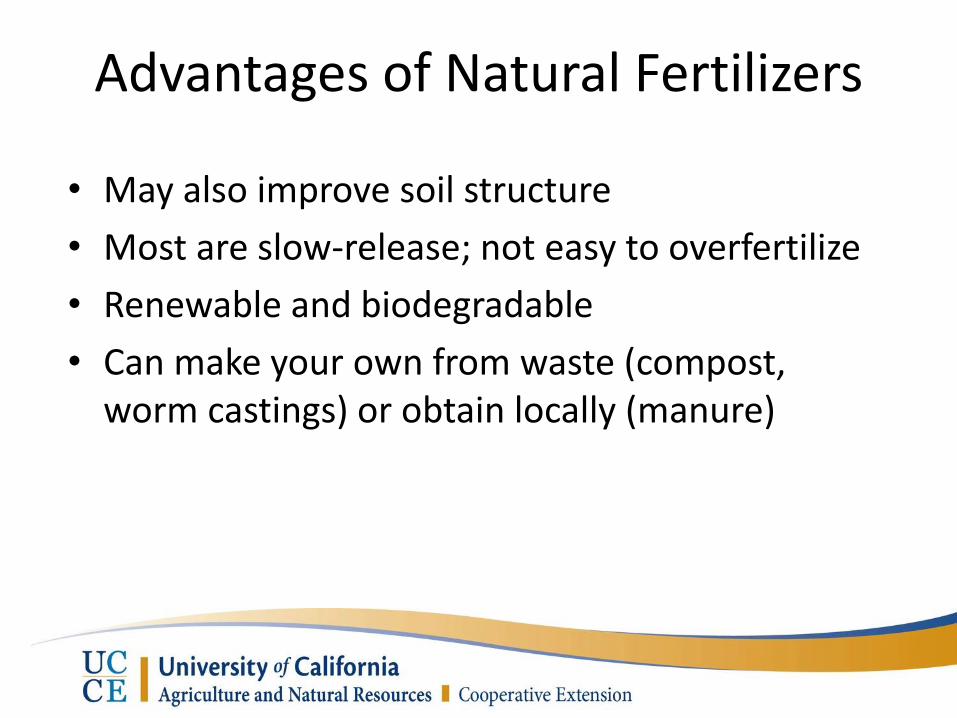
Advantages of Natural Fertilizers
• May also improve soil structure
• Most are slow-release; not easy to overfertilize
• Renewable and biodegradable
• Can make your own from waste (compost, worm castings) or obtain locally (manure)
Disadvantages of Natural Fertilizers
• May not release nutrients as they are needed
• Nutrient content of manure & compost often unknown
• % nutrients usually lower than chemical fertilizers
• Tend to be bulkier, requiring more fossil fuels and producing more GHG; more expensive

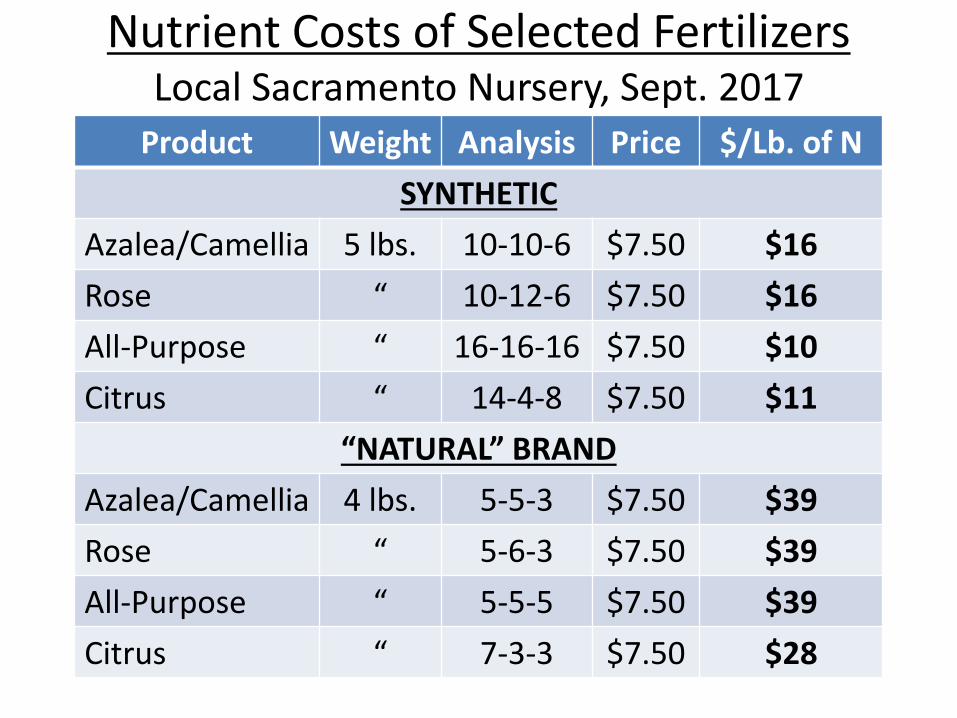
Product Weight Analysis Price $/Lb. of N
SYNTHETIC
Azalea/Camellia 5 lbs. 10-10-6 $7.50 $16
Rose “ 10-12-6 $7.50 $16
All-Purpose “ 16-16-16 $7.50 $10
Citrus “ 14-4-8 $7.50 $11
“NATURAL” BRAND
Azalea/Camellia 4 lbs. 5-5-3 $7.50 $39
Rose “ 5-6-3 $7.50 $39
All-Purpose “ 5-5-5 $7.50 $39
Citrus “ 7-3-3 $7.50 $28
Nutrient Costs of Selected Fertilizers Local Sacramento Nursery, Sept. 2017
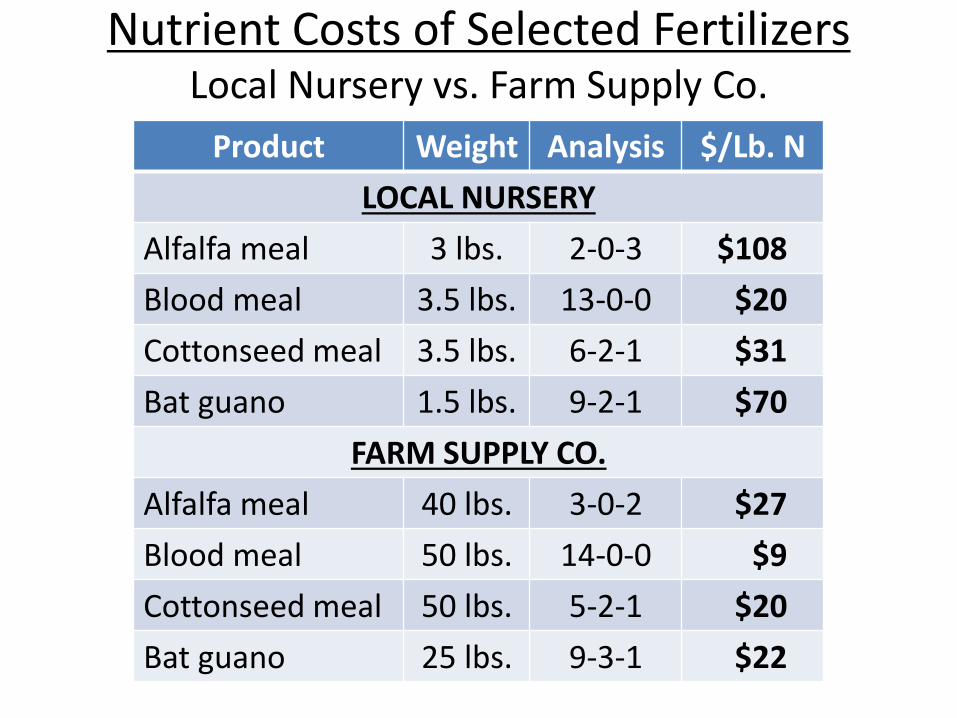
Product Weight Analysis $/Lb. N
LOCAL NURSERY
Alfalfa meal 3 lbs. 2-0-3 $108
Blood meal 3.5 lbs. 13-0-0 $20
Cottonseed meal 3.5 lbs. 6-2-1 $31
Bat guano 1.5 lbs. 9-2-1 $70
FARM SUPPLY CO.
Alfalfa meal 40 lbs. 3-0-2 $27
Blood meal 50 lbs. 14-0-0 $9
Cottonseed meal 50 lbs. 5-2-1 $20
Bat guano 25 lbs. 9-3-1 $22
Nutrient Costs of Selected Fertilizers Local Nursery vs. Farm Supply Co.
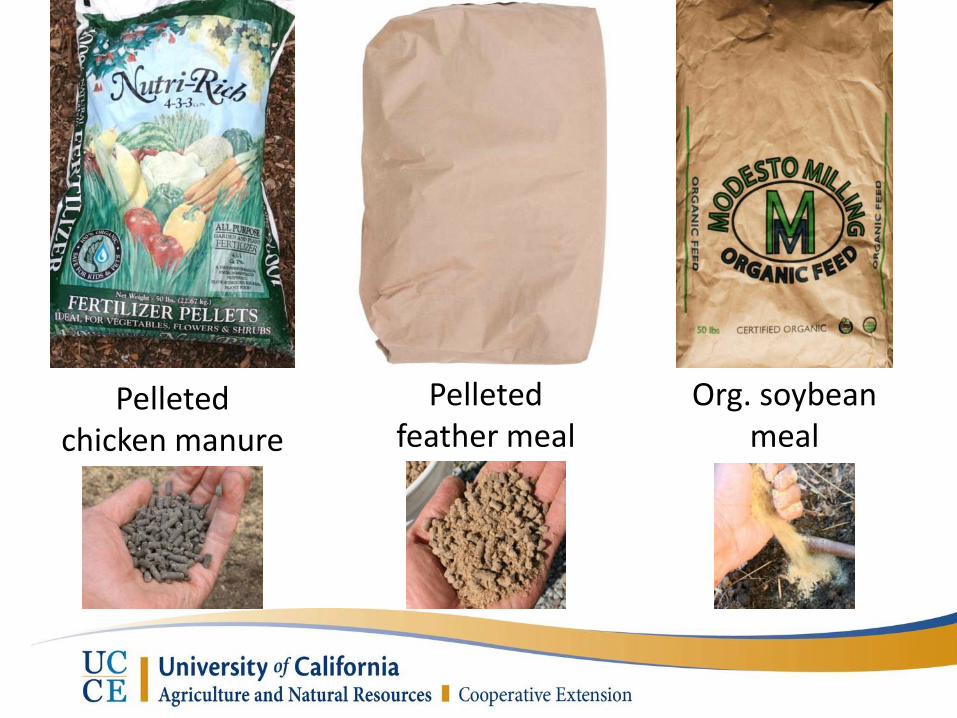
Pelleted chicken manure
Org. soybean meal
Pelleted feather meal
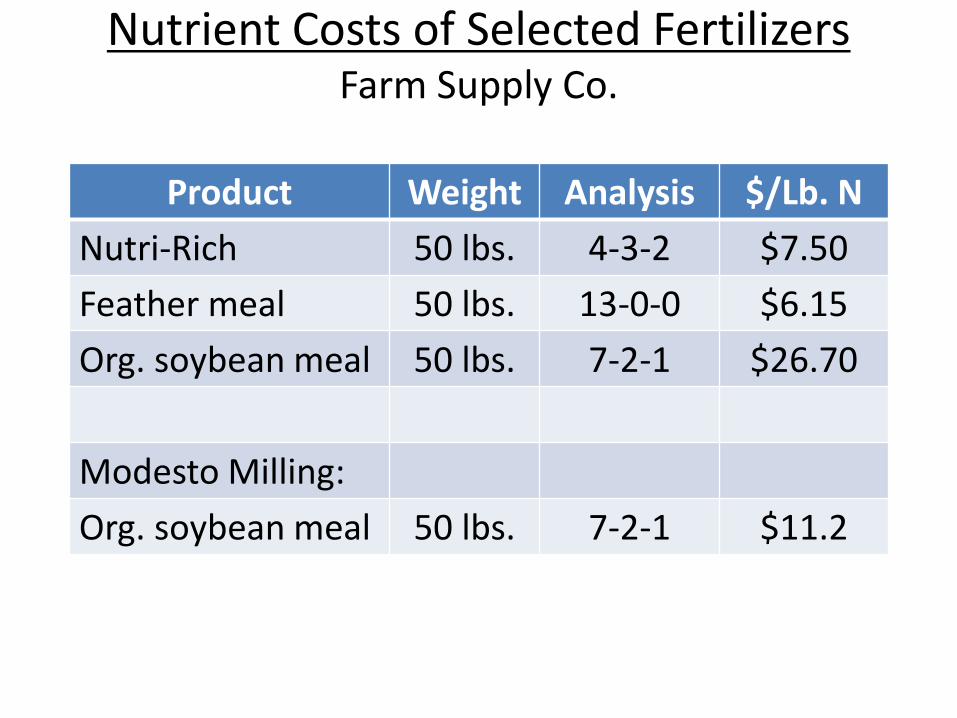
Product Weight Analysis $/Lb. N
Nutri-Rich 50 lbs. 4-3-2 $7.50
Feather meal 50 lbs. 13-0-0 $6.15
Org. soybean meal 50 lbs. 7-2-1 $26.70
Modesto Milling:
Org. soybean meal 50 lbs. 7-2-1 $11.2
Nutrient Costs of Selected Fertilizers Farm Supply Co.
Topics to be Covered
• Soil organic matter and soil structure
• Fertilizers
– Synthetic vs. Natural
– Effects on Soil Microbes
– N Mineralization and Availability
– Fertilizing Specific Plant Types
• Soil Nutrient Analysis
• Mulches
• Cover Crops
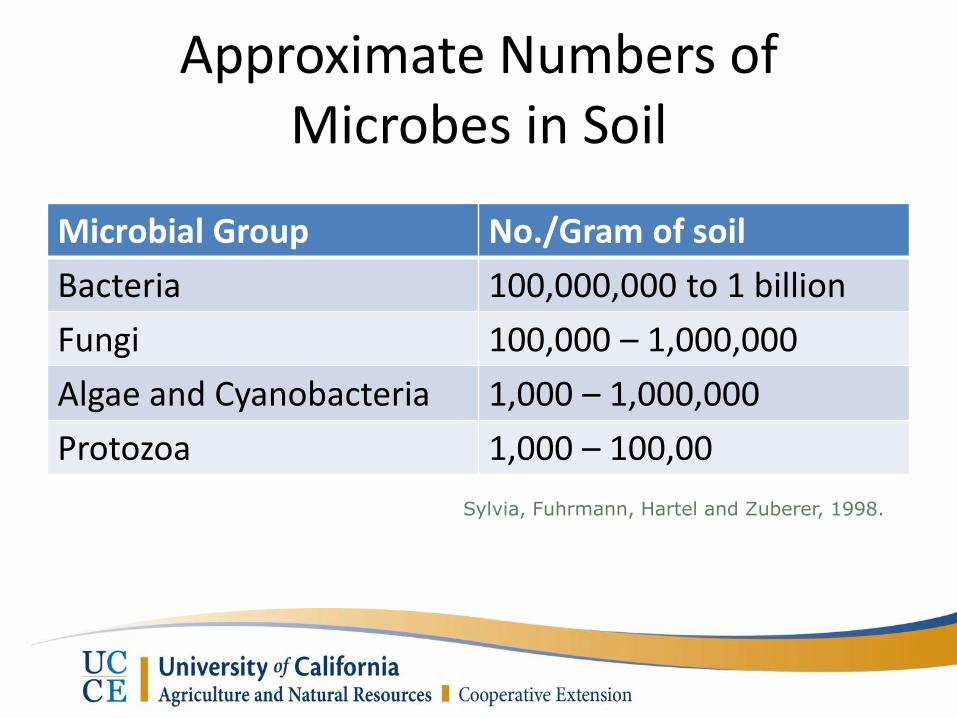
Approximate Numbers of Microbes in Soil
Microbial Group No./Gram of soil
Bacteria 100,000,000 to 1 billion
Fungi 100,000 – 1,000,000
Algae and Cyanobacteria 1,000 – 1,000,000
Protozoa 1,000 – 100,00
Sylvia, Fuhrmann, Hartel and Zuberer, 1998.
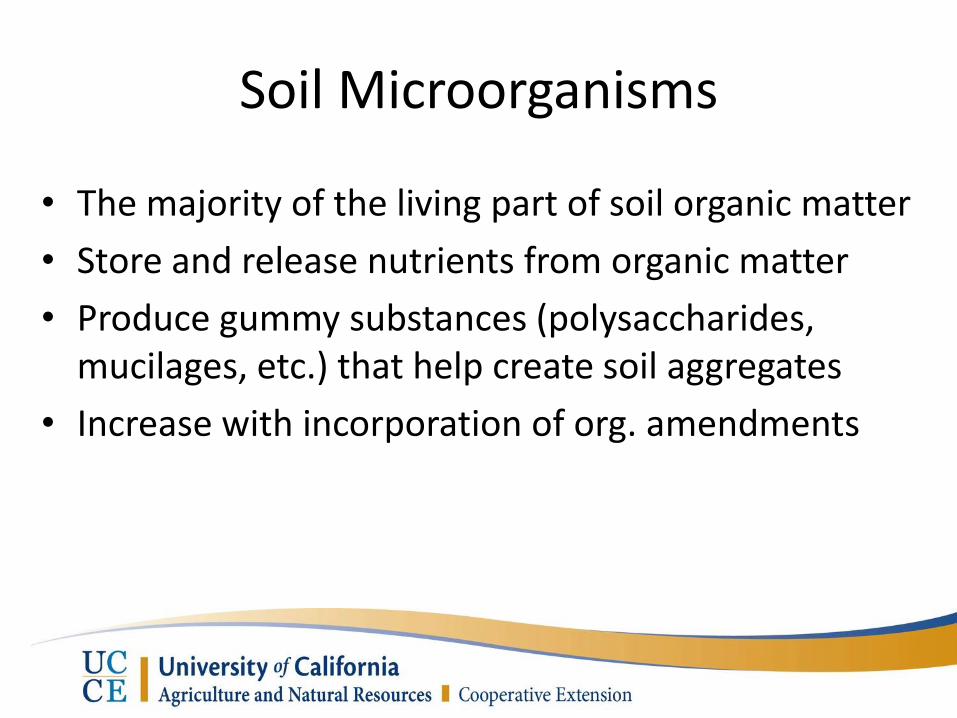
Soil Microorganisms
• The majority of the living part of soil organic matter
• Store and release nutrients from organic matter
• Produce gummy substances (polysaccharides, mucilages, etc.) that help create soil aggregates
• Increase with incorporation of org. amendments

Ways to Promote Soil Microorganisms
• Reduce tillage
• Grow cover crops
• Add soil amendments, especially compost or worm castings
• Use organic fertilizers, reduce synthetic fertilizers?
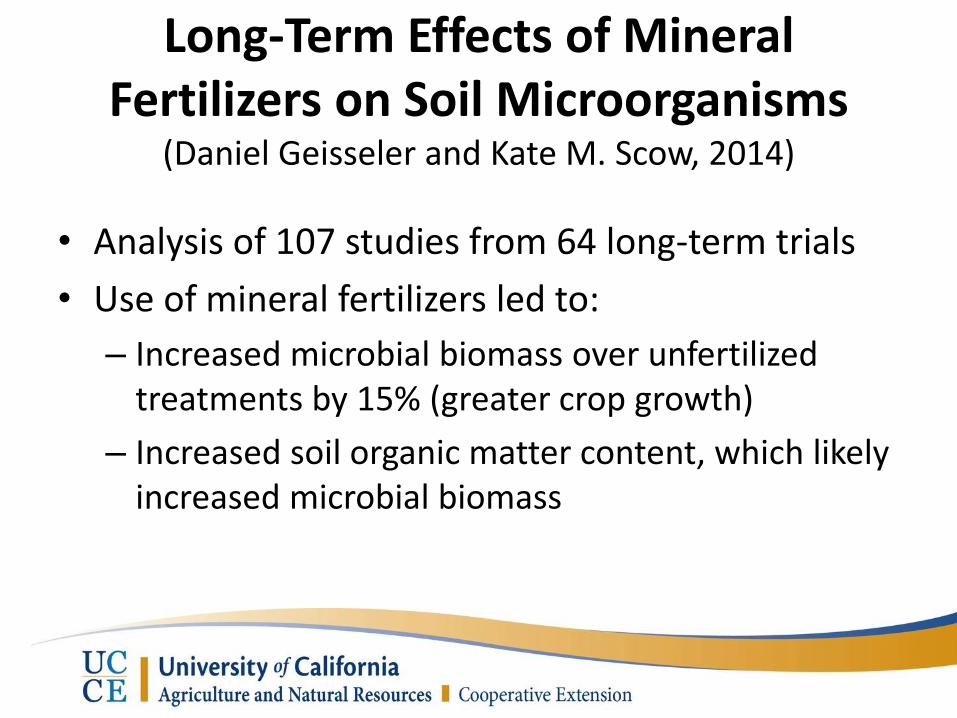
Long-Term Effects of Mineral Fertilizers on Soil Microorganisms
(Daniel Geisseler and Kate M. Scow, 2014)
• Analysis of 107 studies from 64 long-term trials
• Use of mineral fertilizers led to:
– Increased microbial biomass over unfertilized treatments by 15% (greater crop growth)
– Increased soil organic matter content, which likely increased microbial biomass

• Ammonium concentrations were likely far below levels toxic to microorganisms
• In general, fungi were found to benefit from mineral N fertilization
• Using N fertilizers doesn’t appear to have direct negative effects on soil microbial biomass in ag.
Long-Term Effects of Mineral Fertilizers on Soil Microorganisms
(Daniel Geisseler and Kate M. Scow, 2014)
Topics to be Covered
• Soil organic matter and soil structure
• Fertilizers
– Synthetic vs. Natural
– Effects on Soil Microbes
– N Mineralization and Availability
– Fertilizing Specific Plant Types
• Soil Nutrient Analysis
• Mulches
• Cover Crops
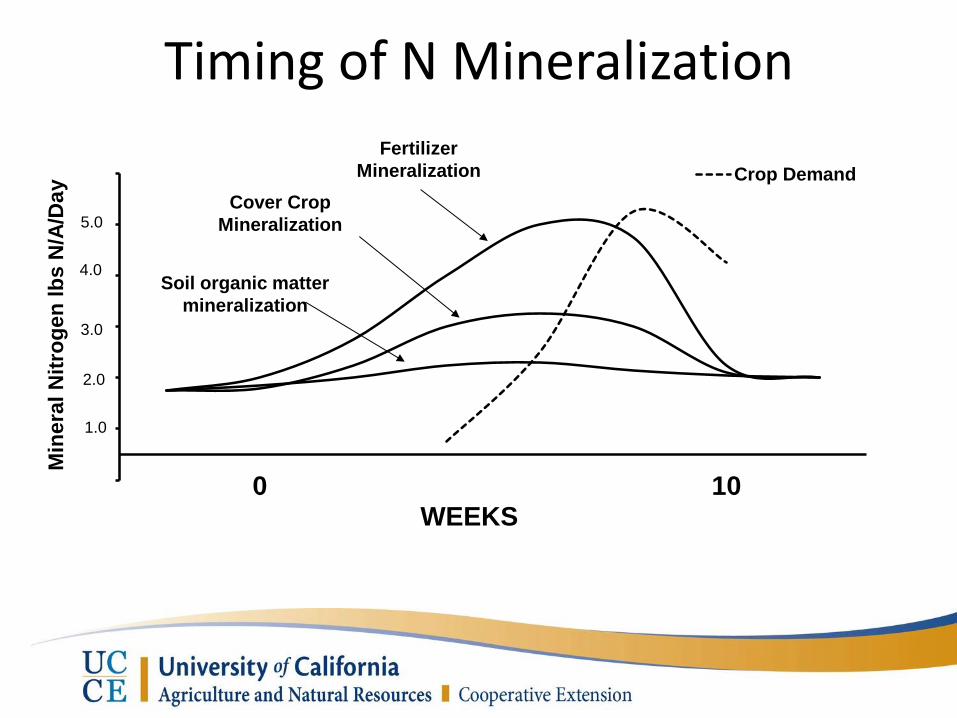
0 10
Min
era
l N
itro
gen
lb
s N
/A/D
ay
WEEKS
Crop Demand
Fertilizer
Mineralization
2.0
3.0
4.0
5.0
Soil organic matter
mineralization
1.0
Cover Crop
Mineralization
Timing of N Mineralization
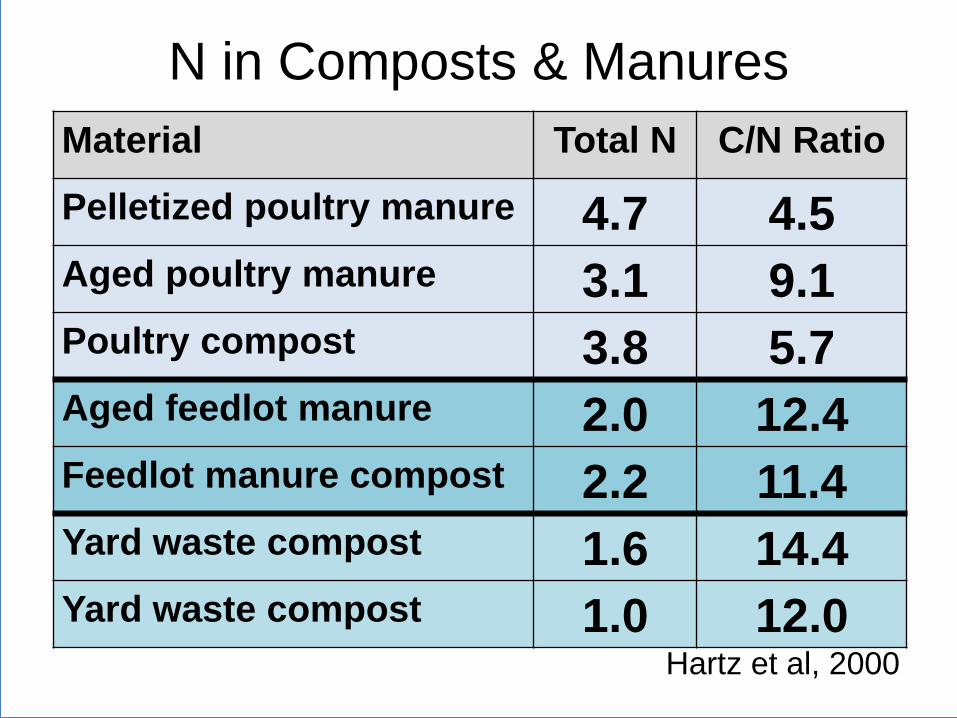
N in Composts & Manures
Material Total N C/N Ratio
Pelletized poultry manure 4.7 4.5
Aged poultry manure 3.1 9.1
Poultry compost 3.8 5.7
Aged feedlot manure 2.0 12.4
Feedlot manure compost 2.2 11.4
Yard waste compost 1.6 14.4
Yard waste compost 1.0 12.0 Hartz et al, 2000
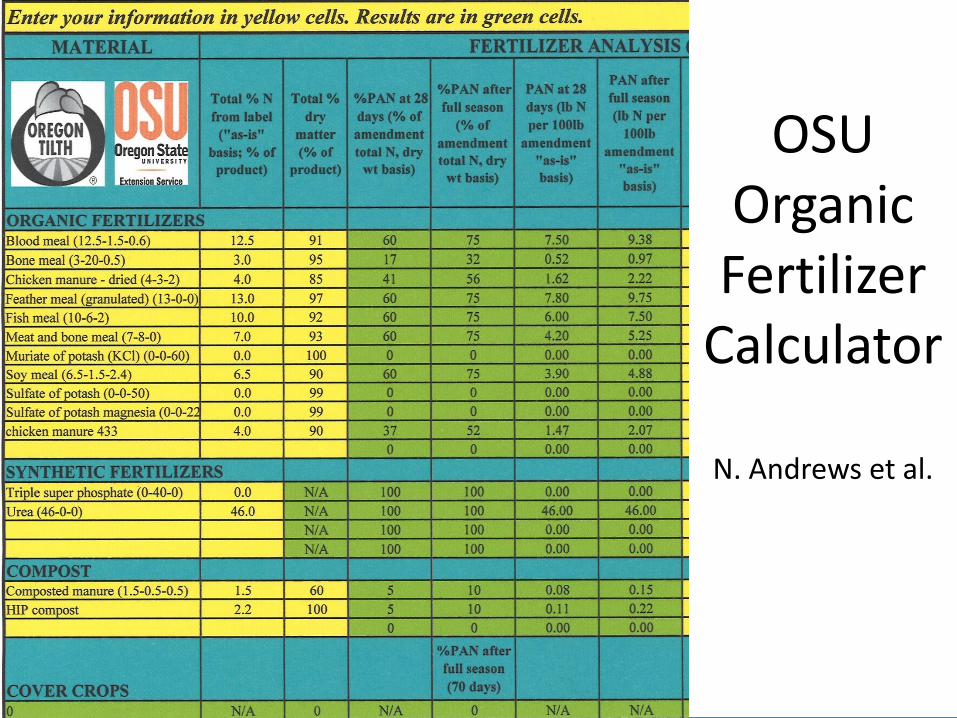
OSU Organic Fertilizer
Calculator
N. Andrews et al.
Fertilizer
Total % N
% PAN, 28 days
% PAN, season
Alfalfa meal (2.5-0.5-2) 2.5 11 26
Bat guano—high N (10-3-1) 10.0 60 75
Blood meal (12.5-1.5-0.6) 12.5 60 75
Bone meal (3-15-0) 3.0 17 32 Comp. manure (1.5-0.5-0.5) 1.5 5 10 Cottonseed meal (6-0.4-1.5) 6.0 60 75
Feather meal (12-0-0) 12.0 60 75
Fish meal (10-6-2) 10.0 60 75
Nutri-Rich (4-3-3) 4.0 36 51
Soy meal (6.5-1.5-2.4) 6.5 60 75
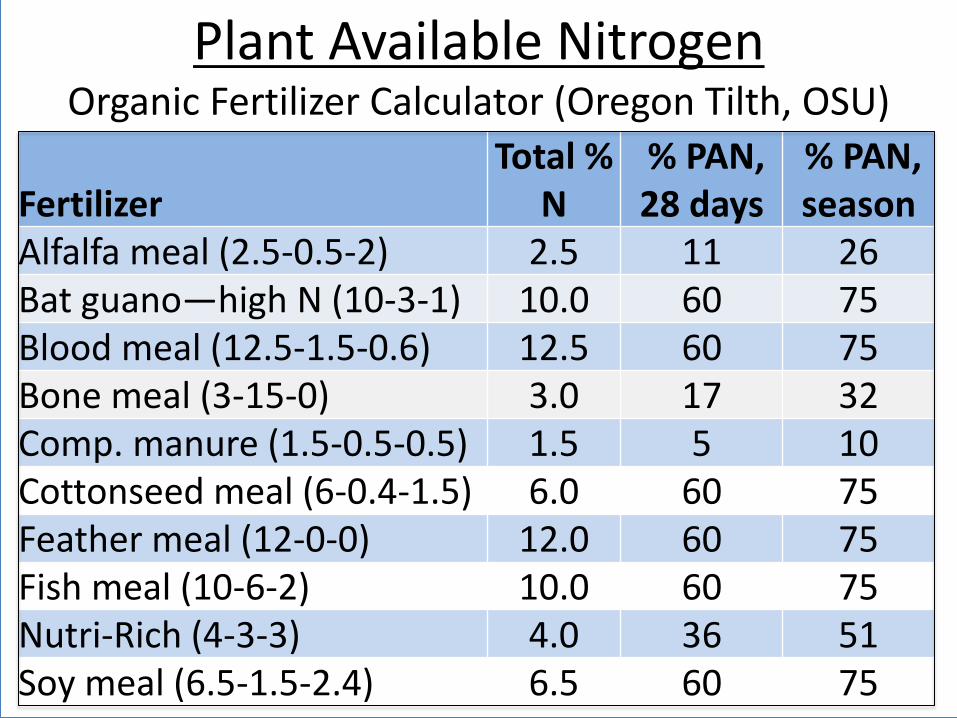
Plant Available Nitrogen Organic Fertilizer Calculator (Oregon Tilth, OSU)
Fertilizer
Total % N
% PAN, 28 days
% PAN, season
Alfalfa meal (2.5-0.5-2) 2.5 11 26
Bat guano—high N (10-3-1) 10.0 60 75
Blood meal (12.5-1.5-0.6) 12.5 60 75
Bone meal (3-15-0) 3.0 17 32 Comp. manure (1.5-0.5-0.5) 1.5 5 10 Cottonseed meal (6-0.4-1.5) 6.0 60 75
Feather meal (12-0-0) 12.0 60 75
Fish meal (10-6-2) 10.0 60 75
Nutri-Rich (4-3-3) 4.0 36 51
Soy meal (6.5-1.5-2.4) 6.5 60 75
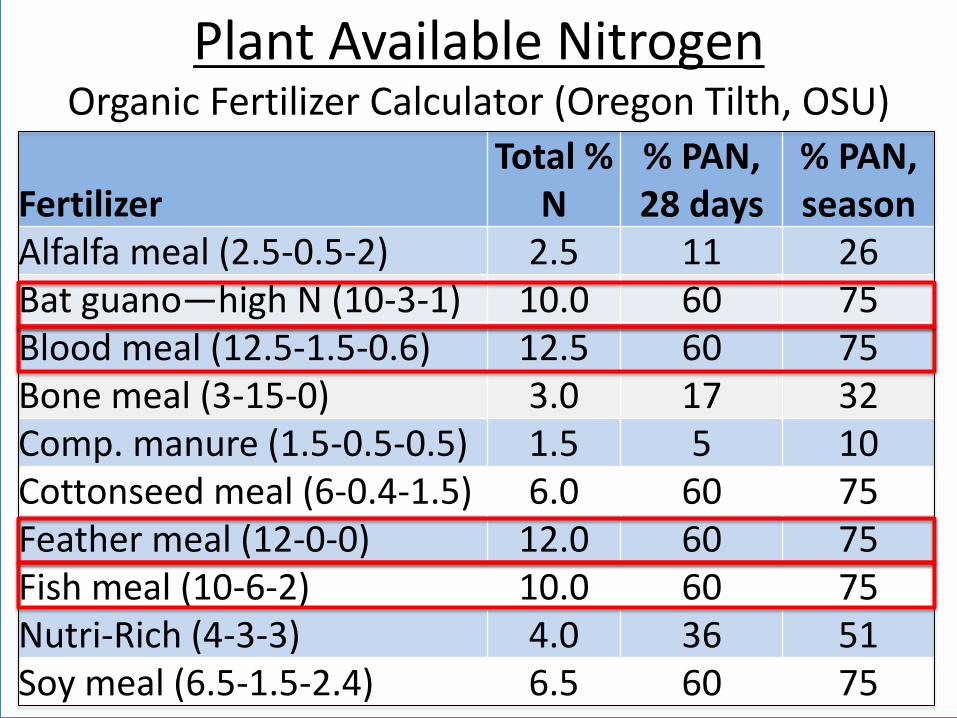
Plant Available Nitrogen Organic Fertilizer Calculator (Oregon Tilth, OSU)
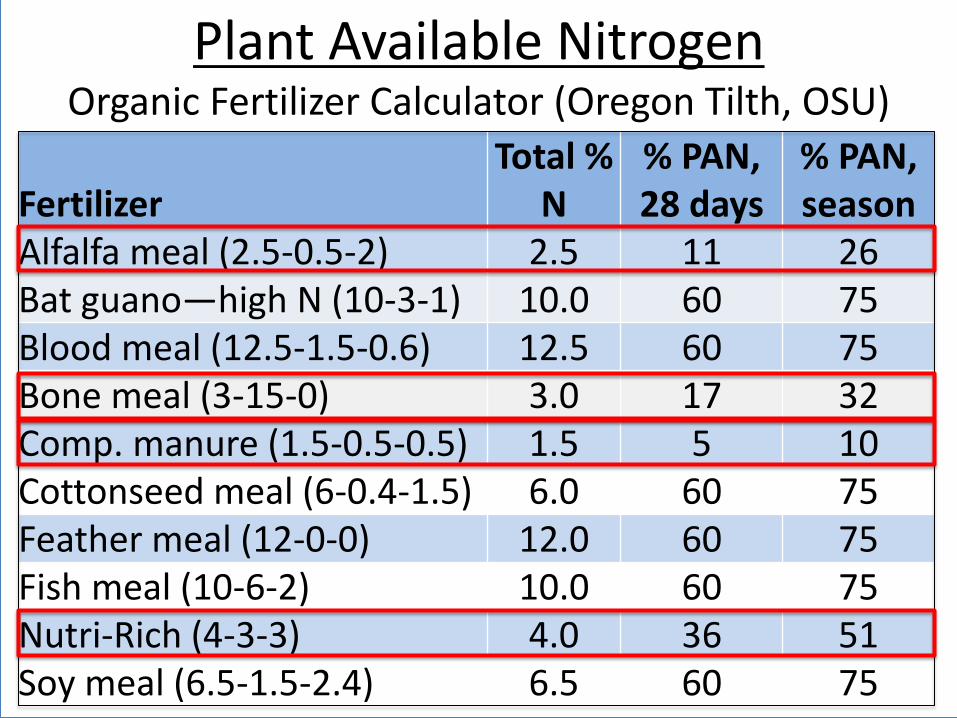
Fertilizer
Total % N
% PAN, 28 days
% PAN, season
Alfalfa meal (2.5-0.5-2) 2.5 11 26
Bat guano—high N (10-3-1) 10.0 60 75
Blood meal (12.5-1.5-0.6) 12.5 60 75
Bone meal (3-15-0) 3.0 17 32 Comp. manure (1.5-0.5-0.5) 1.5 5 10 Cottonseed meal (6-0.4-1.5) 6.0 60 75
Feather meal (12-0-0) 12.0 60 75
Fish meal (10-6-2) 10.0 60 75
Nutri-Rich (4-3-3) 4.0 36 51
Soy meal (6.5-1.5-2.4) 6.5 60 75
Plant Available Nitrogen Organic Fertilizer Calculator (Oregon Tilth, OSU)
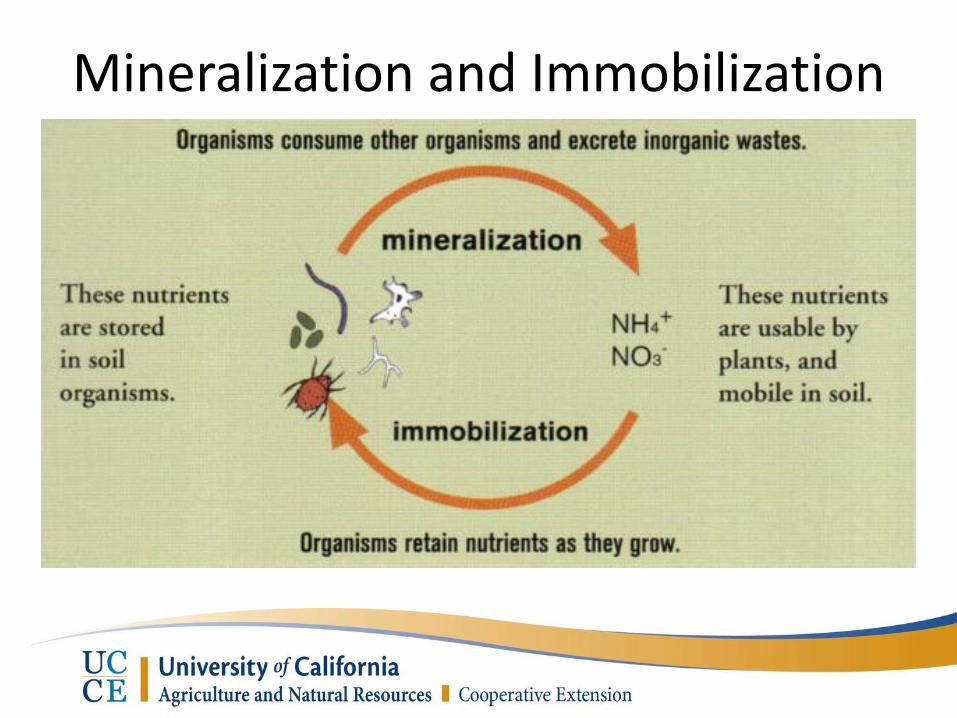
Mineralization and Immobilization
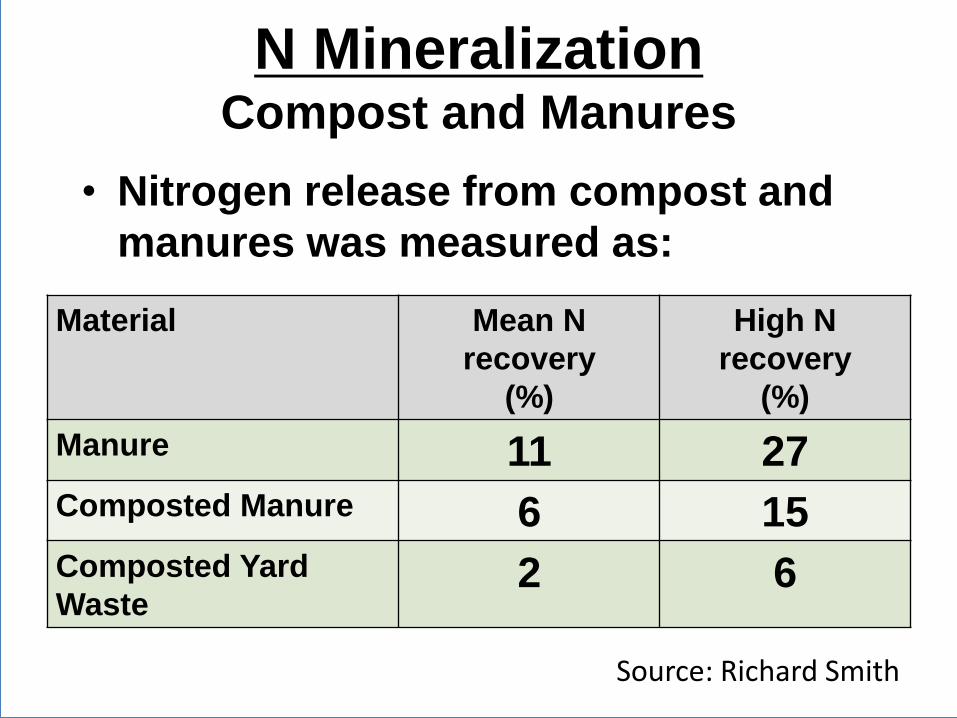
N Mineralization Compost and Manures
• Nitrogen release from compost and
manures was measured as:
Material Mean N
recovery
(%)
High N
recovery
(%)
Manure 11 27
Composted Manure 6 15
Composted Yard
Waste 2 6
Source: Richard Smith
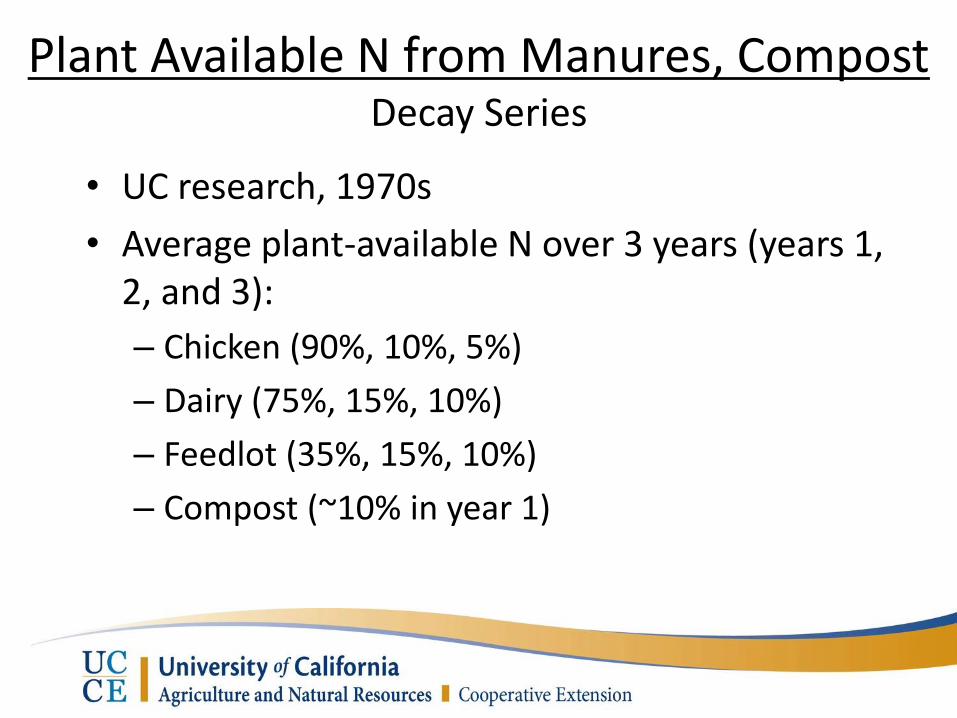
Plant Available N from Manures, Compost Decay Series
• UC research, 1970s
• Average plant-available N over 3 years (years 1, 2, and 3):
– Chicken (90%, 10%, 5%)
– Dairy (75%, 15%, 10%)
– Feedlot (35%, 15%, 10%)
– Compost (~10% in year 1)
Topics to be Covered
• Soil organic matter and soil structure
• Fertilizers
– Synthetic vs. Natural
– Effects on Soil Microbes
– N Mineralization and Availability
– Fertilizing Specific Plant Types
• Soil Nutrient Analysis
• Mulches
• Cover Crops
• Garden soils rarely contain all nutrients in optimal amounts
• Equally rare for garden soil to be deficient in several nutrients
• When appropriate, add only N or the nutrients that are deficient
Should I Fertilize?

FERTILIZING
“Adding fertilizer, soil amendments, or root stimulants to the planting hole or backfill soil is not recommended. Most nursery-grown trees
are well fertilized during production and seldom respond to fertilizing at planting except in the
most infertile soils.”

• Trees adapted to low soil N levels!
• Routine N-P-K fertilization unjustified unless deficiency exists
• High N wasteful, polluting, and may increase insect & disease problems
• Trees in turf likely do not require fertilization
• Use slow release fertilizers if necessary
Landscape Tree Fertilization Points to Remember
Nutrient Deficiencies are Rare in Woody Ornamentals
• N – Sandy, overwatered, or sub soils
• P – Deficient in foothills
• Ca – Acidic or sandy soils
• Fe, Mn, Zn, B – High-pH or waterlogged soils
N Fertilization for Fruit & Nut Trees The Home Orchard, UC Pub. 3485
• Total lbs. of N/year to correct a deficiency: – Large fruit tree: 1 lb. – Small fruit tree: 0.5 lb. – Large nut tree: 2 lbs. – Small nut tree: 1 lb.
• Deciduous trees: Late spring and summer
• Citrus: Jan. or Feb. just before bloom, then in May and perhaps in June
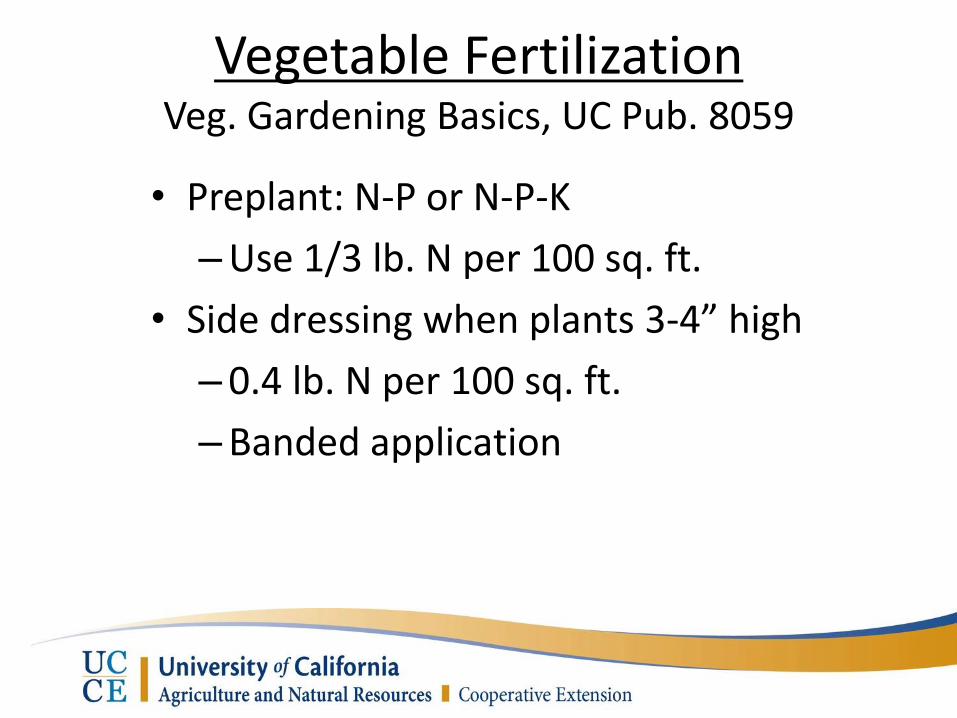
Vegetable Fertilization Veg. Gardening Basics, UC Pub. 8059
• Preplant: N-P or N-P-K
– Use 1/3 lb. N per 100 sq. ft.
• Side dressing when plants 3-4” high
– 0.4 lb. N per 100 sq. ft.
– Banded application
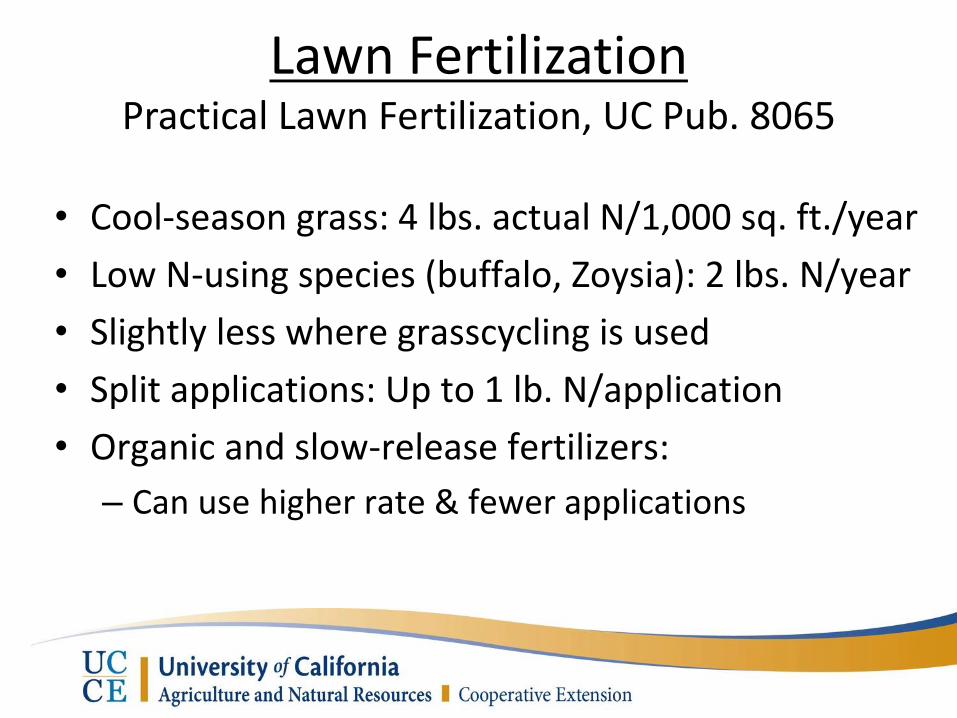
Lawn Fertilization Practical Lawn Fertilization, UC Pub. 8065
• Cool-season grass: 4 lbs. actual N/1,000 sq. ft./year
• Low N-using species (buffalo, Zoysia): 2 lbs. N/year
• Slightly less where grasscycling is used
• Split applications: Up to 1 lb. N/application
• Organic and slow-release fertilizers:
– Can use higher rate & fewer applications
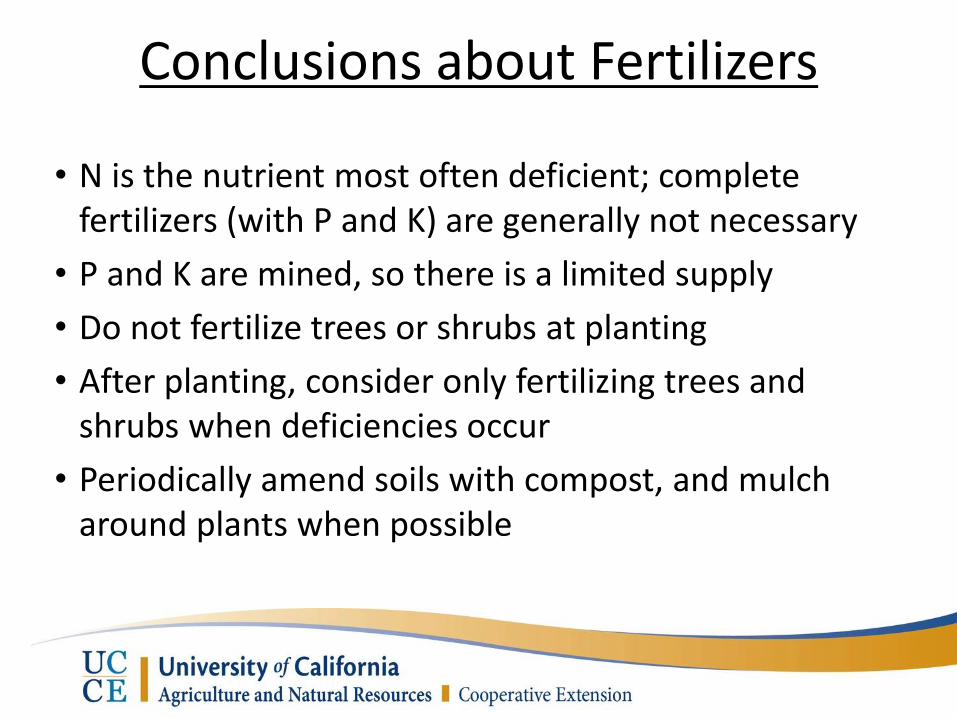
Conclusions about Fertilizers
• N is the nutrient most often deficient; complete fertilizers (with P and K) are generally not necessary
• P and K are mined, so there is a limited supply
• Do not fertilize trees or shrubs at planting
• After planting, consider only fertilizing trees and shrubs when deficiencies occur
• Periodically amend soils with compost, and mulch around plants when possible
Topics to be Covered
• Soil organic matter and soil structure
• Fertilizers
– Synthetic vs. Natural
– Effects on Soil Microbes
– N Mineralization and Availability
– Fertilizing Specific Plant Types
• Soil Nutrient Analysis
• Mulches
• Cover Crops
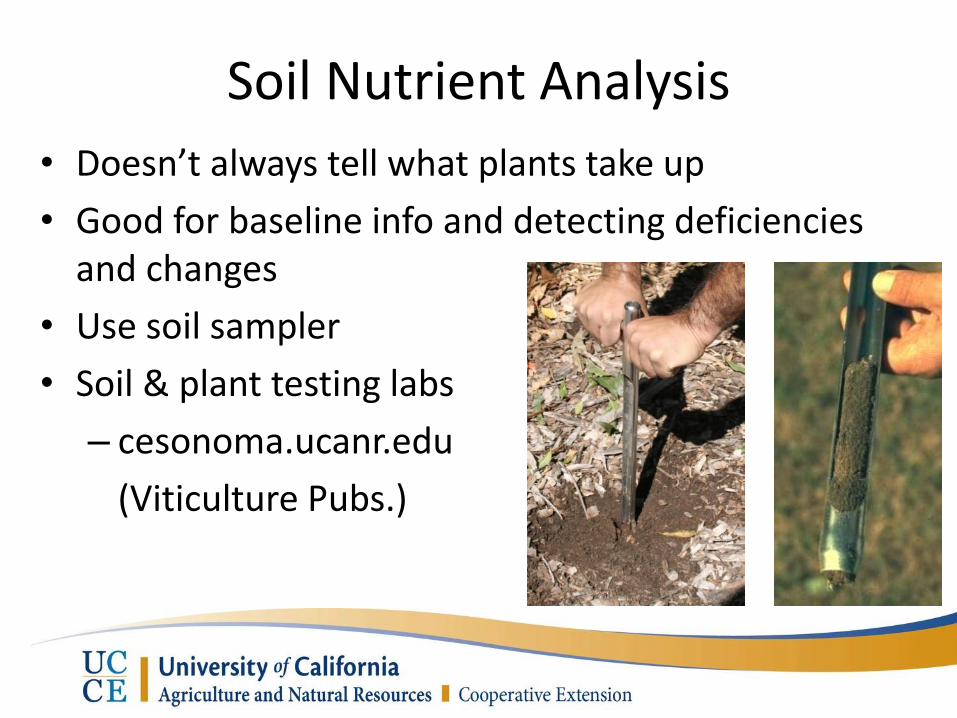
• Doesn’t always tell what plants take up
• Good for baseline info and detecting deficiencies and changes
• Use soil sampler
• Soil & plant testing labs
– cesonoma.ucanr.edu
(Viticulture Pubs.)
Soil Nutrient Analysis
• Sample in rooting zone (0-12”, maybe 12-24”)
• Mix multiple cores in bucket for each “sample”
• Use 1 pint per sample, place in bag, send to lab
– See http://cagardenweb.ucdavis.edu
• Additional samples from distinct areas
• Include: Total N, NO3-N, P, K, Ca, Mg, soil texture, pH, OM, CEC, salts(?)
Soil Nutrient Analysis Methods
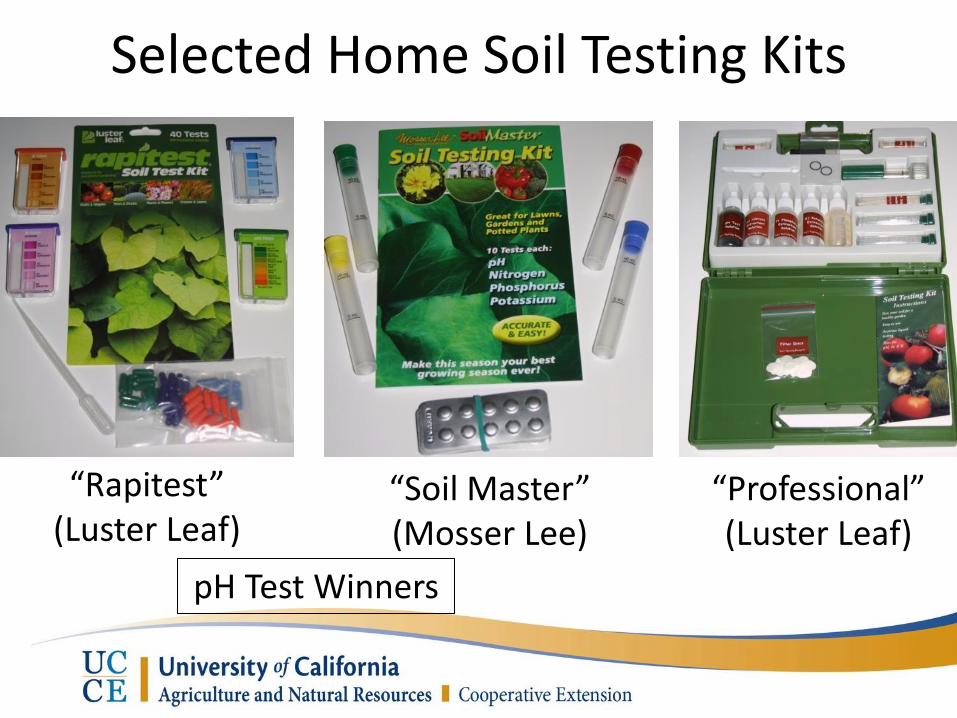
Selected Home Soil Testing Kits
“Rapitest” (Luster Leaf)
“Soil Master” (Mosser Lee)
“Professional” (Luster Leaf)
pH Test Winners
Topics to be Covered
• Soil organic matter and soil structure
• Fertilizers
– Synthetic vs. Natural
– Effects on Soil Microbes
– N Mineralization and Availability
– Fertilizing Specific Plant Types
• Soil Nutrient Analysis
• Mulches
• Cover Crops
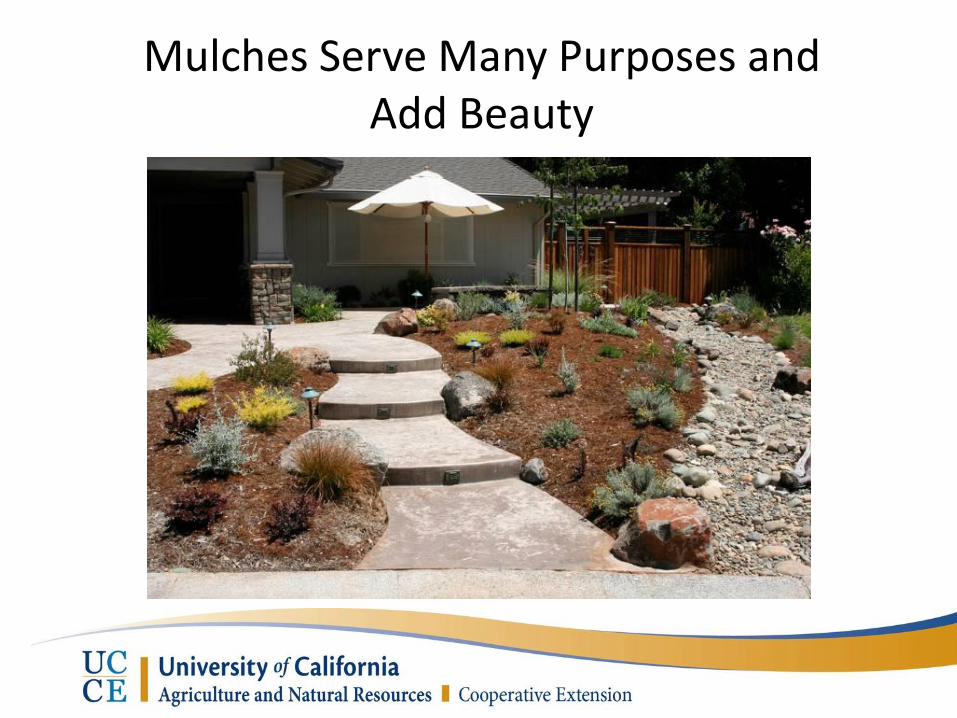
Mulches Serve Many Purposes and Add Beauty
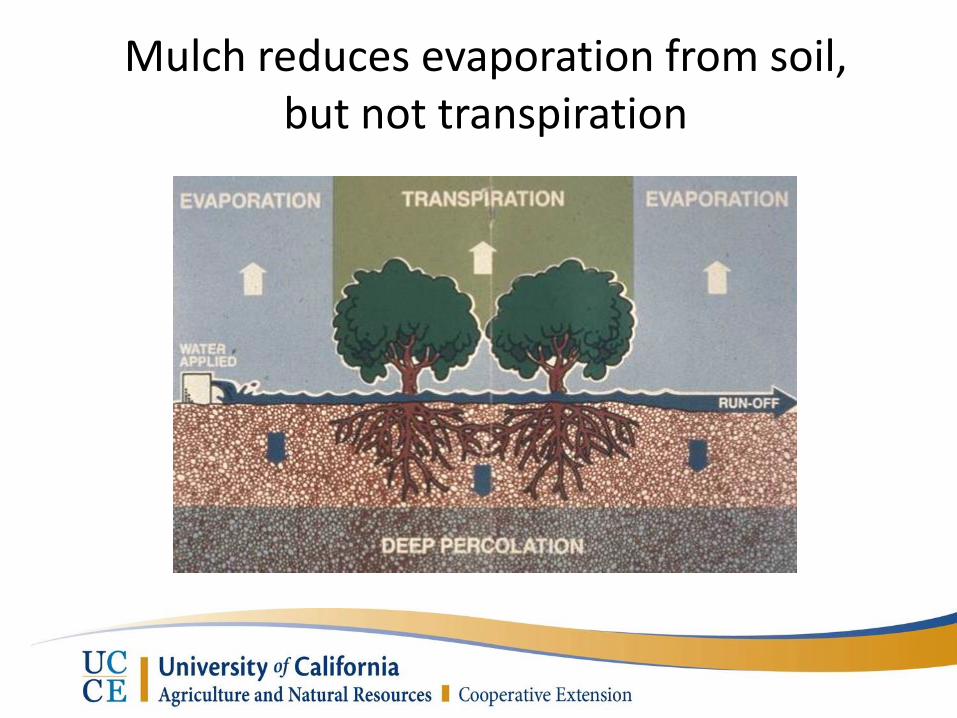
Mulch reduces evaporation from soil, but not transpiration
Mulch vs. Compost
• Mulch = Organic or inorganic material spread on the soil surface
• Compost = Mass of rotted organic matter made from decomposed plant material and/or manure
– Thermophilic decomposition (heat)
– Finished compost is not hot
– Usually incorporated into the soil
Potential Benefits of Mulch
• Insulates roots from temp. extremes
• Increases:
Root growth Microbial biomass
Water penetration
• Protects trees from mechanical injury
• Improves plant establishment
• Reduces Weeds and erosion
Environ. stresses
Soil moisture loss
Potential Problems with Mulch • May prolong saturation in heavy soils
– Favors root and crown rot
• Can’t see soil moisture
• May host plant diseases, insects, and nuisance fungi
• Some wood chips poor quality
• Time consuming to spread
Mulch Basics (Wood Chips)
• Remove weeds, water before applying
• Replace grass with mulch under trees
• Keep mulch 6-12 in. away from the base of trees & shrubs
• Application rate: Generally 2-4 in. deep
– Fine = <2 in. Coarse = 4-6 in.
• Keep mulch on top of soil to prevent N tie-up
More Mulch Basics
• Durability of wood chips increases with underlying fabric or plastic
• Mulch has little or no effect on termites
• Softwood mulches (pine, cypress, etc.) last longest
– Less microbial feeding
Do Wood Chips Affect Soil Nutrients? • Tie-up of N?
– N immobilization from high C:N mulch
– Generally N tie-up at interface only
– But since soil is mixed by fungal hyphae, earthworms, may be tie-up
– Better tree growth w/ N fert. or compost
– Avoid mulch in planting holes
• Soil pH – little effect (pine needles acidic)
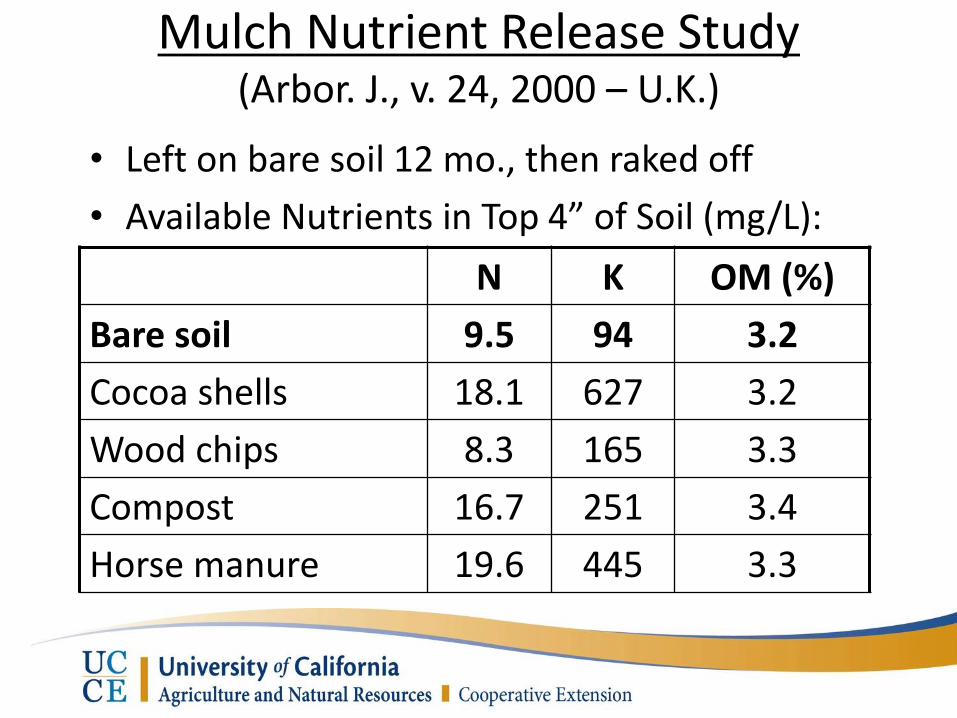
N K OM (%)
Bare soil 9.5 94 3.2
Cocoa shells 18.1 627 3.2
Wood chips 8.3 165 3.3
Compost 16.7 251 3.4
Horse manure 19.6 445 3.3
Mulch Nutrient Release Study (Arbor. J., v. 24, 2000 – U.K.)
• Left on bare soil 12 mo., then raked off
• Available Nutrients in Top 4” of Soil (mg/L):
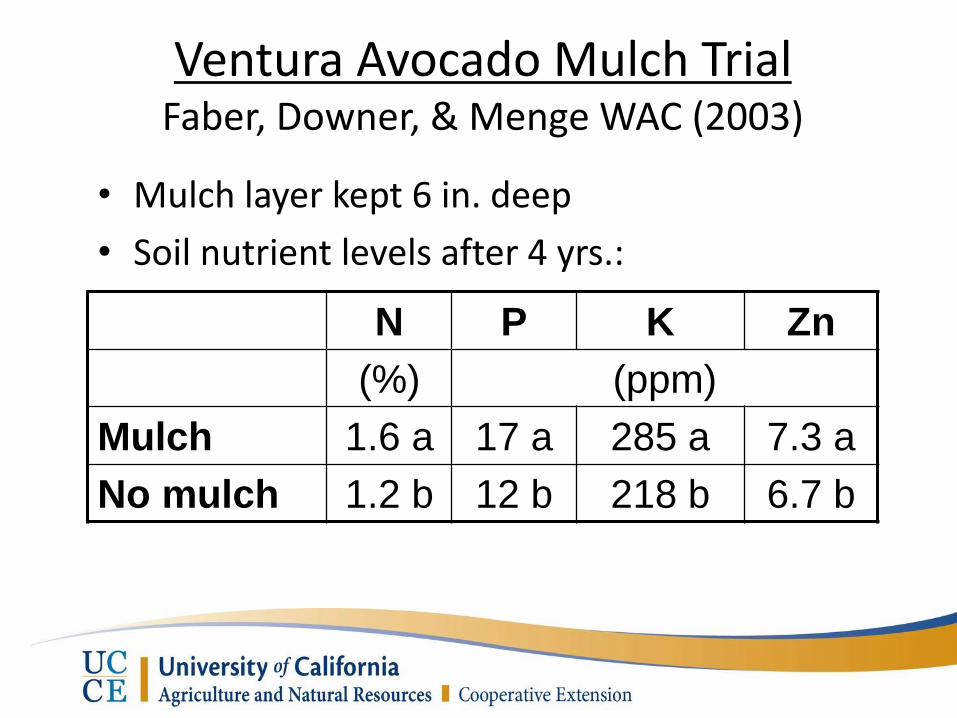
Ventura Avocado Mulch Trial Faber, Downer, & Menge WAC (2003)
• Mulch layer kept 6 in. deep
• Soil nutrient levels after 4 yrs.:
N P K Zn
(%) (ppm)
Mulch 1.6 a 17 a 285 a 7.3 a
No mulch 1.2 b 12 b 218 b 6.7 b
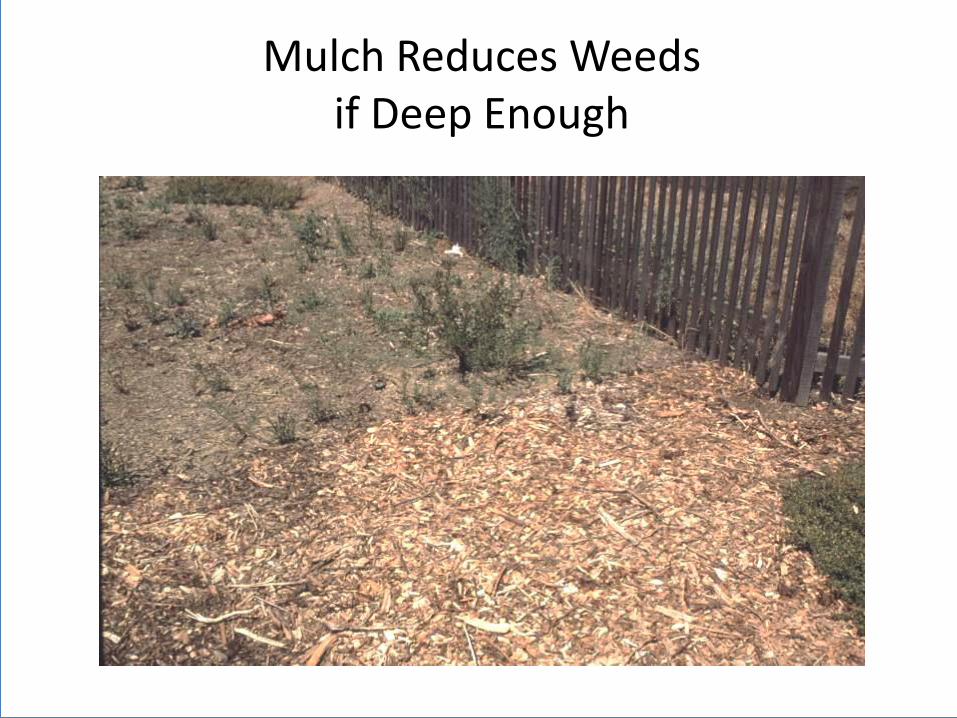
Mulch Reduces Weeds if Deep Enough
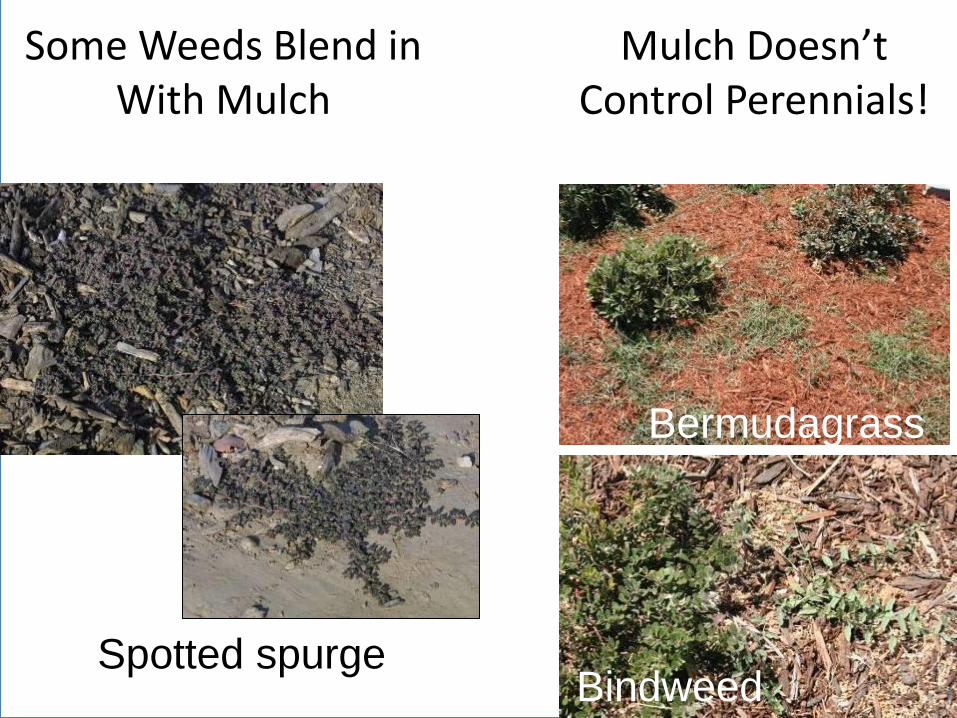
Bermudagrass
Bindweed
Mulch Doesn’t Control Perennials!
Some Weeds Blend in With Mulch
Spotted spurge
Mulching and Weed Control
• Thickness to mulch depends on mulch type
• Various studies:
– 3-in. layer: 85% weed control over 3-yrs.
– 4-in. mulch gave better control than 3-in.
– Phenols & tannins in coniferous bark improved weed control
Allelopathy
• Suppression of growth of a plant by a toxin released from a nearby plant
• Black walnut and some others, not Eucalyptus
• Only relates to annual seedlings, not mature plants
• Composting materials or irrigating reduces effect
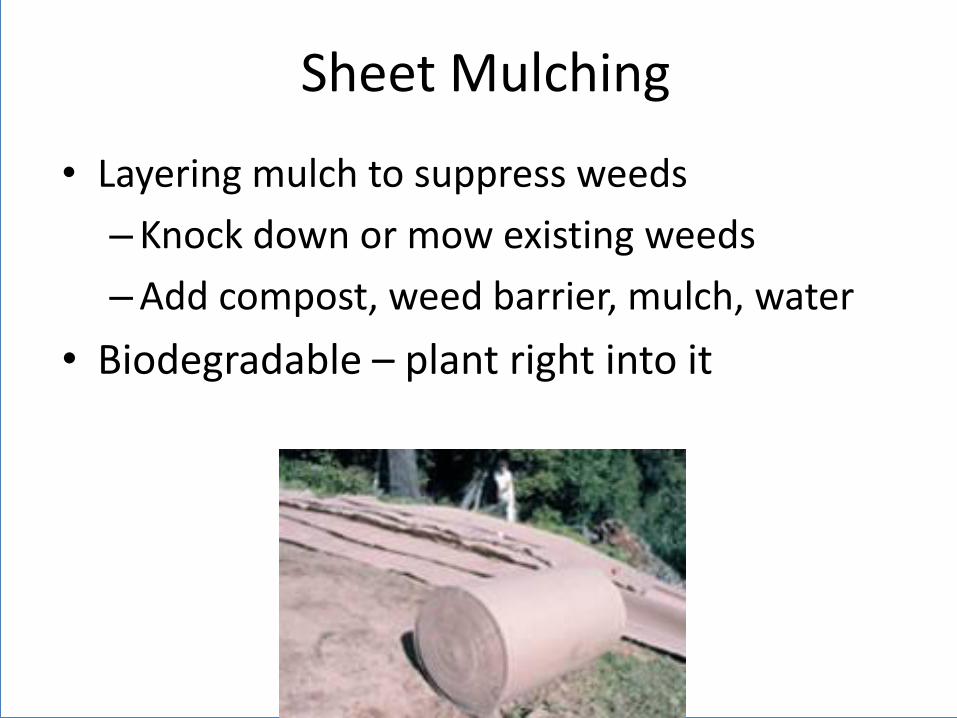
Sheet Mulching
• Layering mulch to suppress weeds
– Knock down or mow existing weeds
– Add compost, weed barrier, mulch, water
• Biodegradable – plant right into it
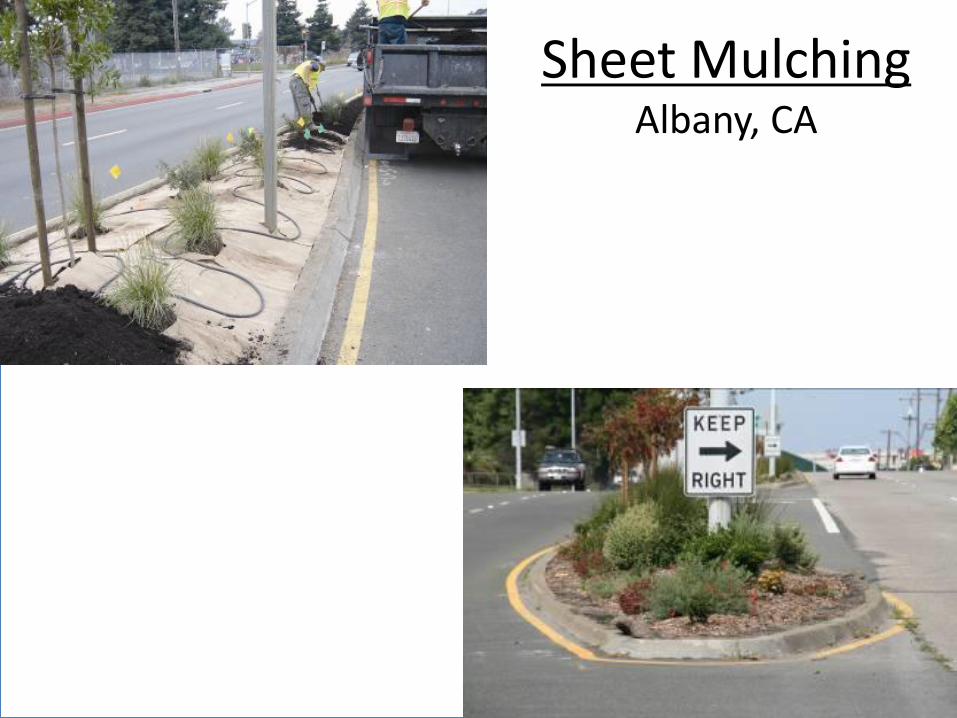
Sheet Mulching Albany, CA
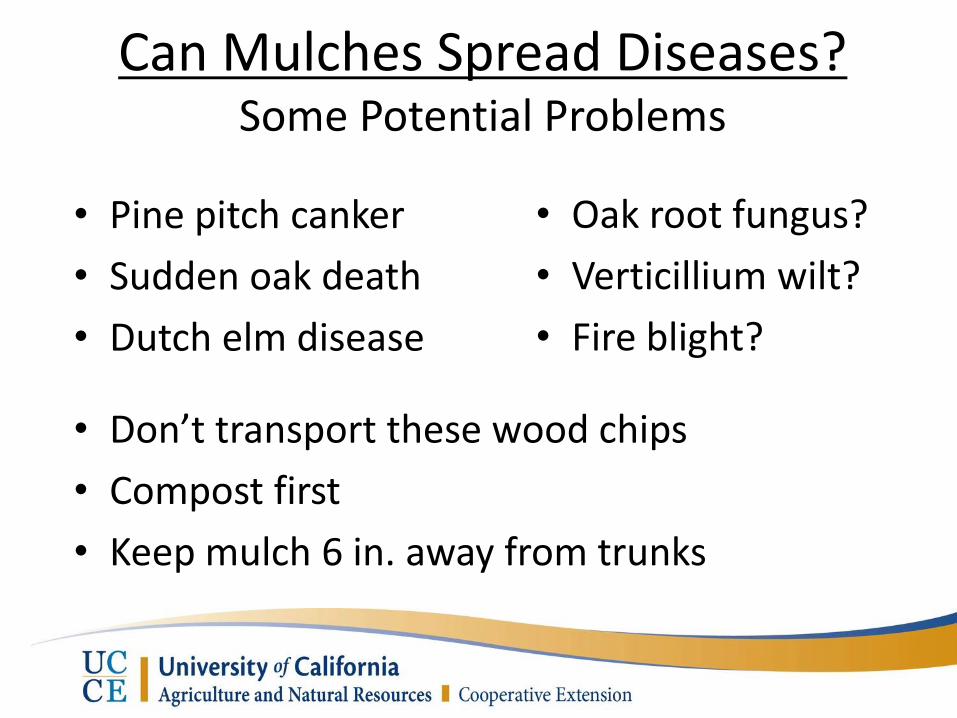
Can Mulches Spread Diseases? Some Potential Problems
• Pine pitch canker
• Sudden oak death
• Dutch elm disease
• Don’t transport these wood chips
• Compost first
• Keep mulch 6 in. away from trunks
• Oak root fungus?
• Verticillium wilt?
• Fire blight?
Heating Mulch to Kill Pathogens
• Several studies have shown:
– Temps. in large piles easily reach 120 to 150F
– 3 days exposure enough to kill all pathogens of woody plants
– Piles should be turned two to three times to expose all portions to high temps.
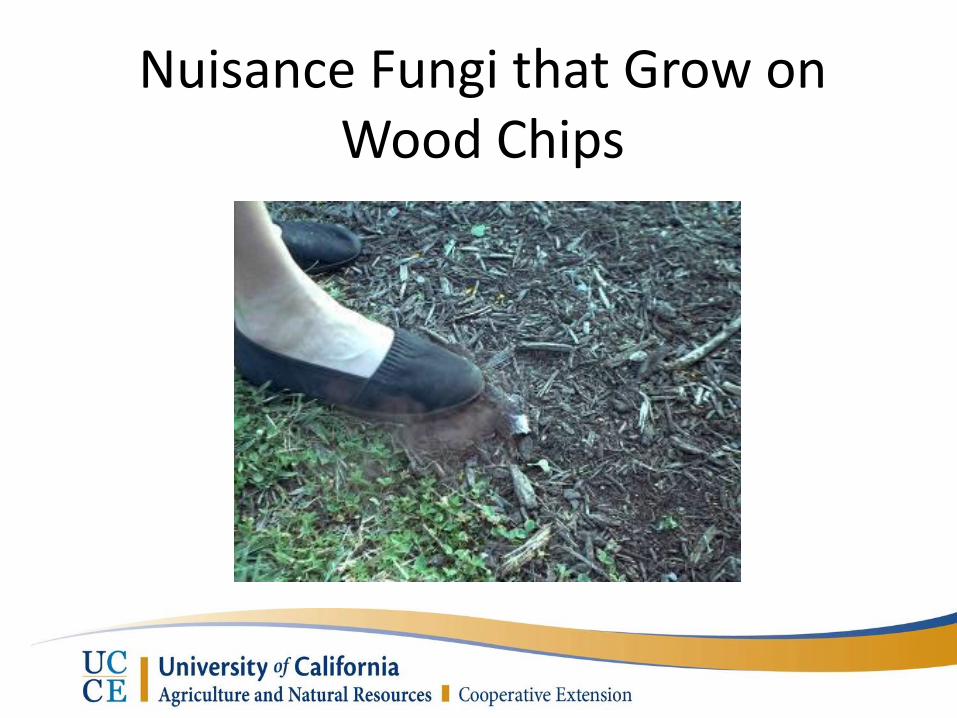
Nuisance Fungi that Grow on Wood Chips
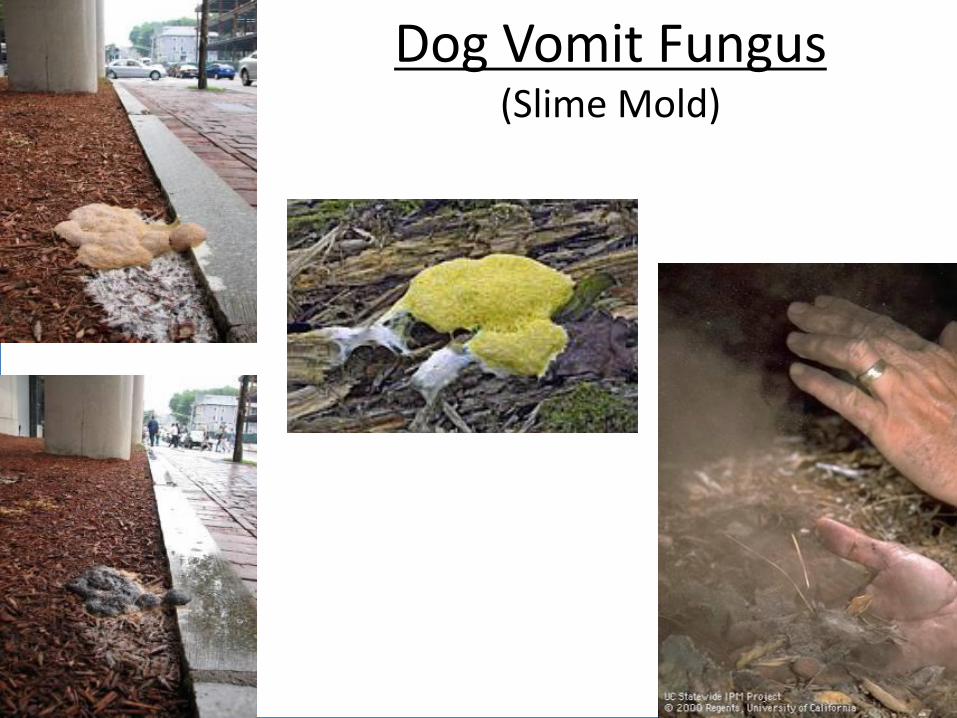
Dog Vomit Fungus (Slime Mold)
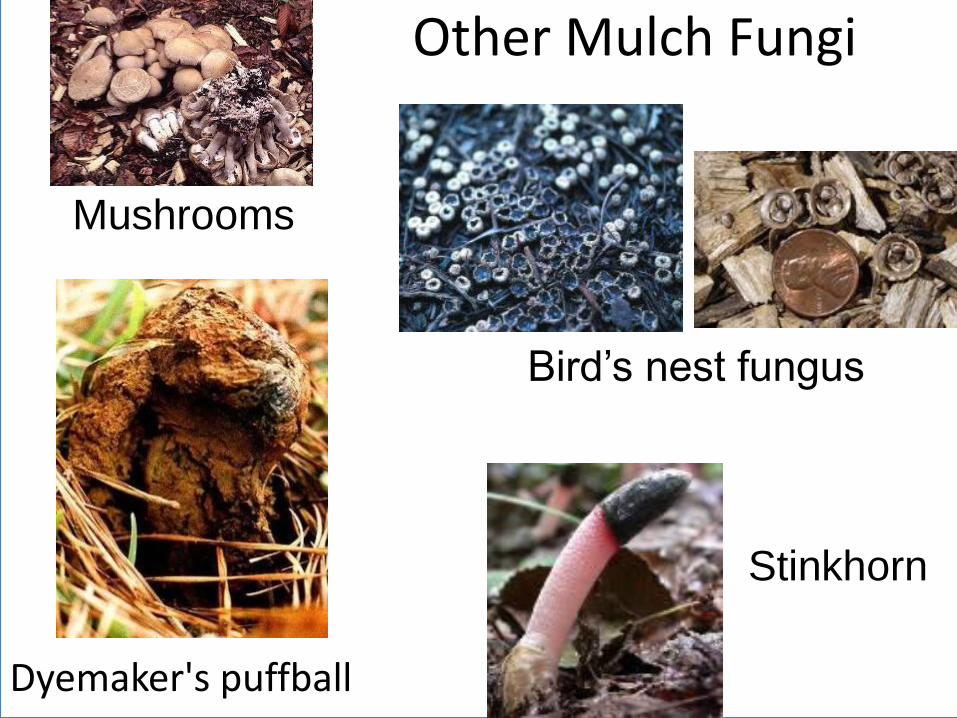
Dyemaker's puffball
Stinkhorn
Other Mulch Fungi
Bird’s nest fungus
Mushrooms
Rock Mulches
• Long-lasting, may look good
• Absorb and reflect heat
– ↑ ET; Heat roots?
• Rocks eventually mix with soil
– Difficult to remove later
• Do not improve soil quality
• Weeds eventually come through
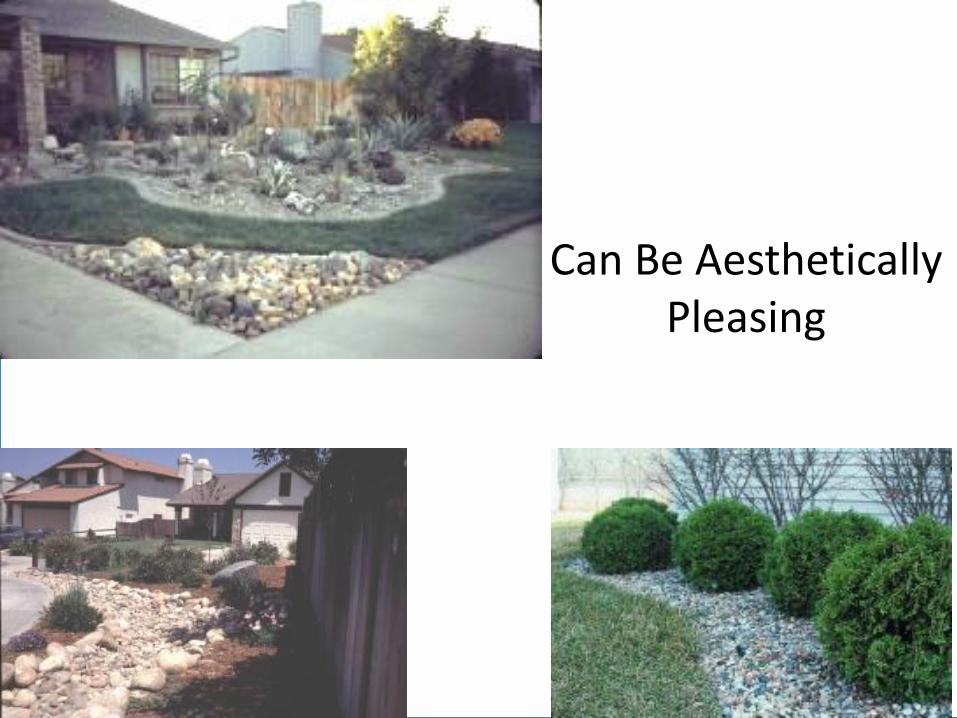
Can Be Aesthetically Pleasing
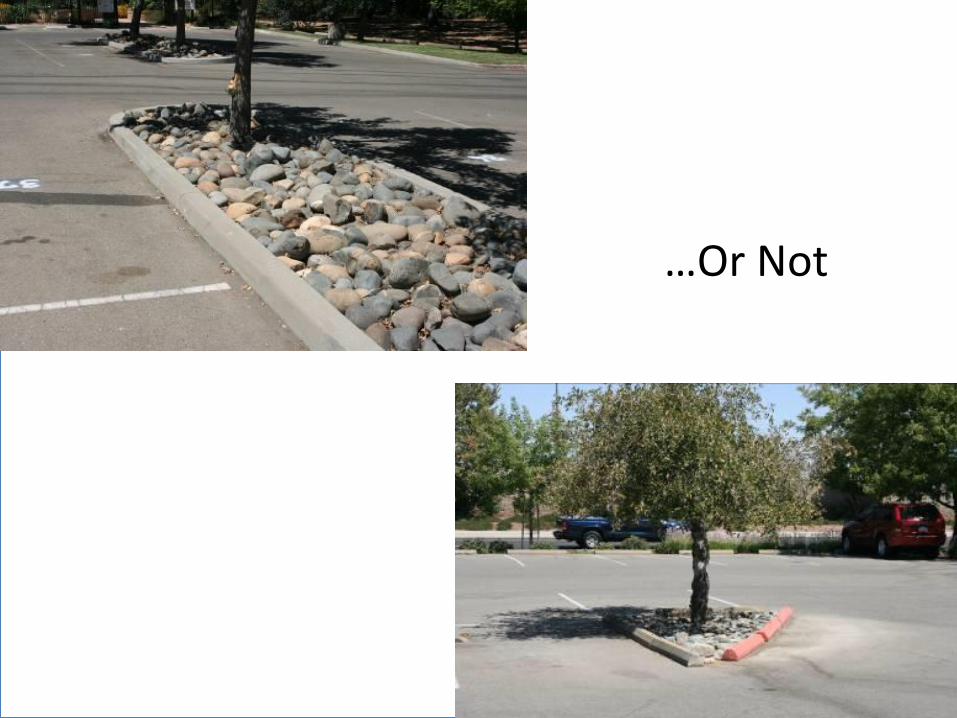
…Or Not

Synthetic Mulches Polypropylene and Polyester
• Better weed control than chips alone
• Slower breakdown of wood chips
• Allow water & air movement
• Do not improve soil quality
• Most are effective 3-5 yrs. (under chips)
• Most are not recyclable (landfill!)
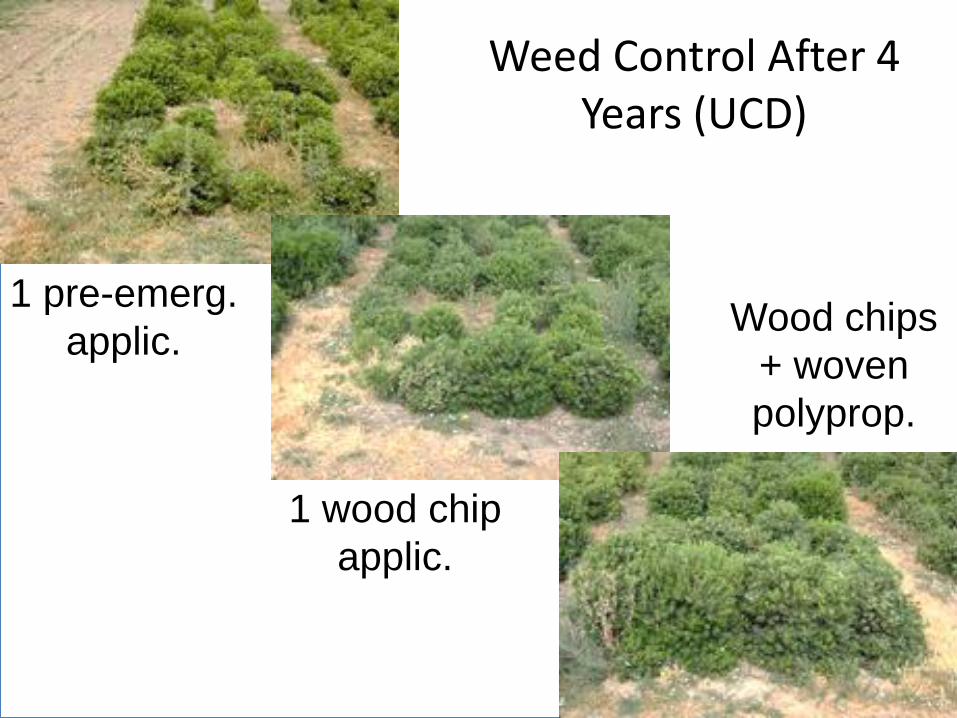
Weed Control After 4 Years (UCD)
1 pre-emerg.
applic.
1 wood chip
applic.
Wood chips
+ woven
polyprop.
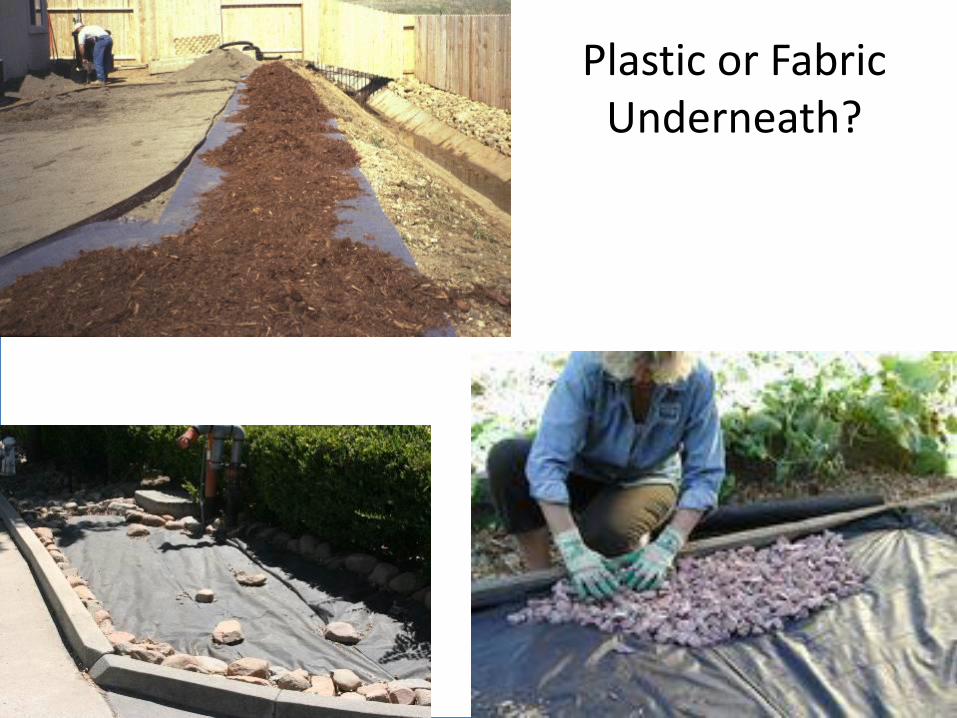
Plastic or Fabric Underneath?
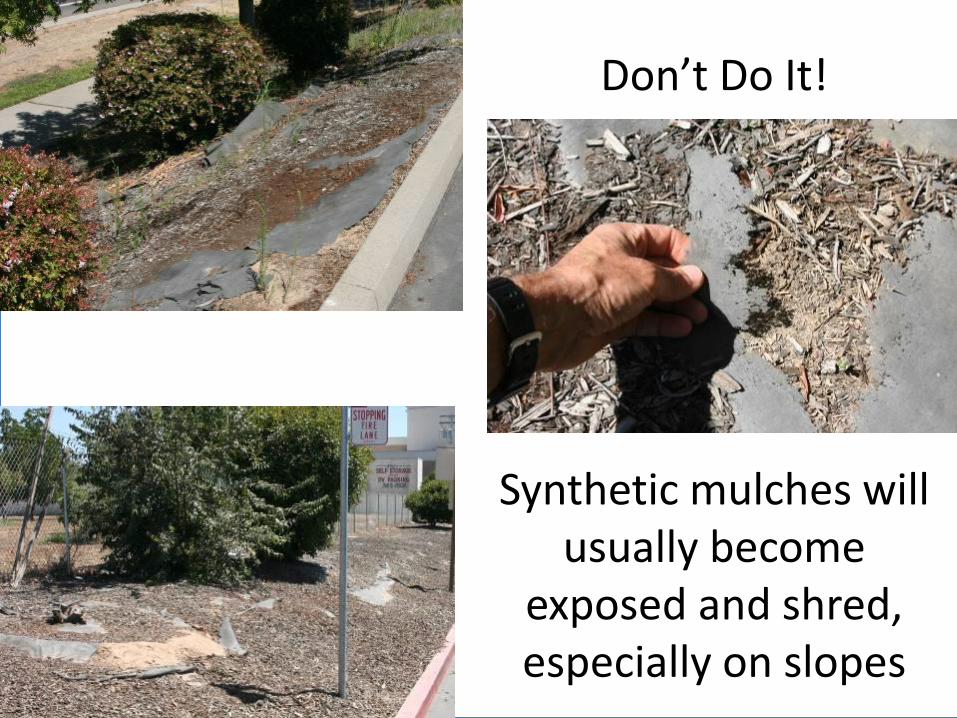
Synthetic mulches will usually become
exposed and shred, especially on slopes
Don’t Do It!
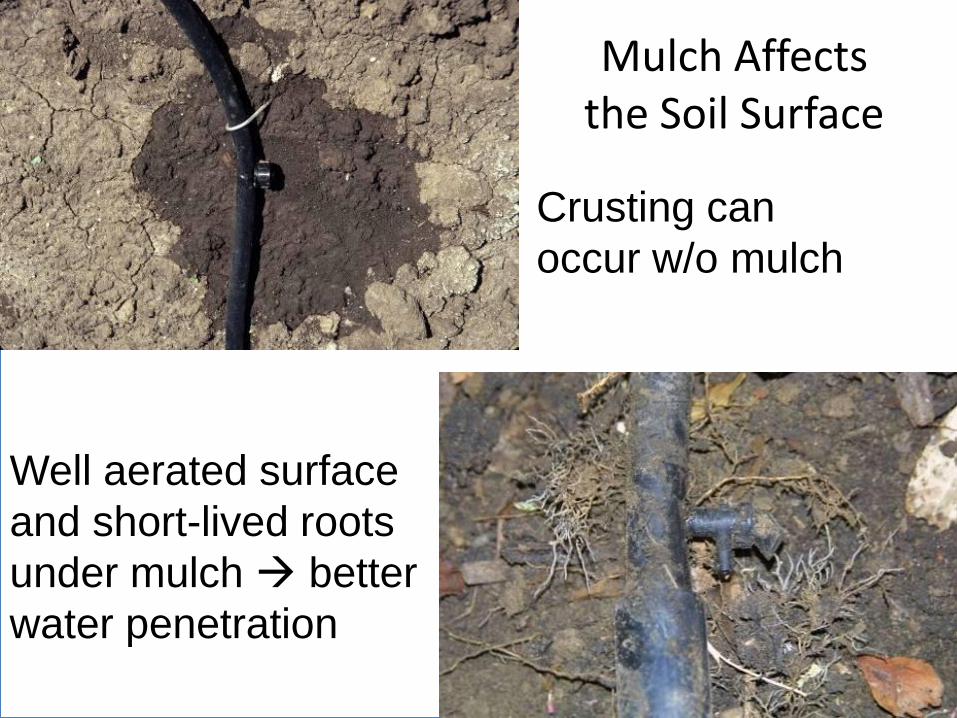
Mulch Affects the Soil Surface
Well aerated surface
and short-lived roots
under mulch better
water penetration
Crusting can
occur w/o mulch
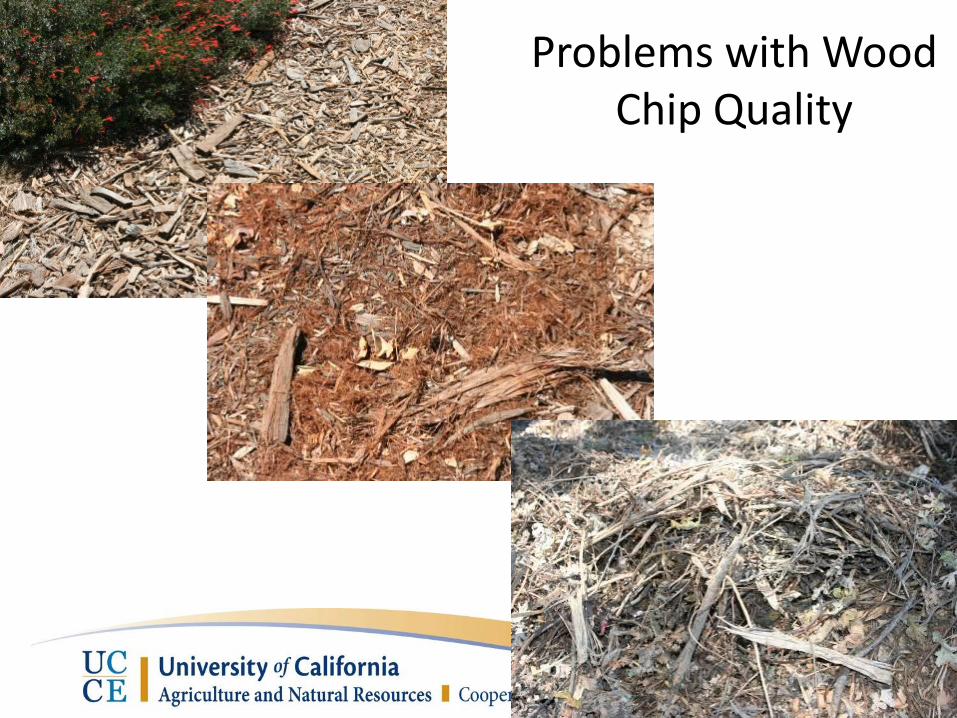
Problems with Wood Chip Quality
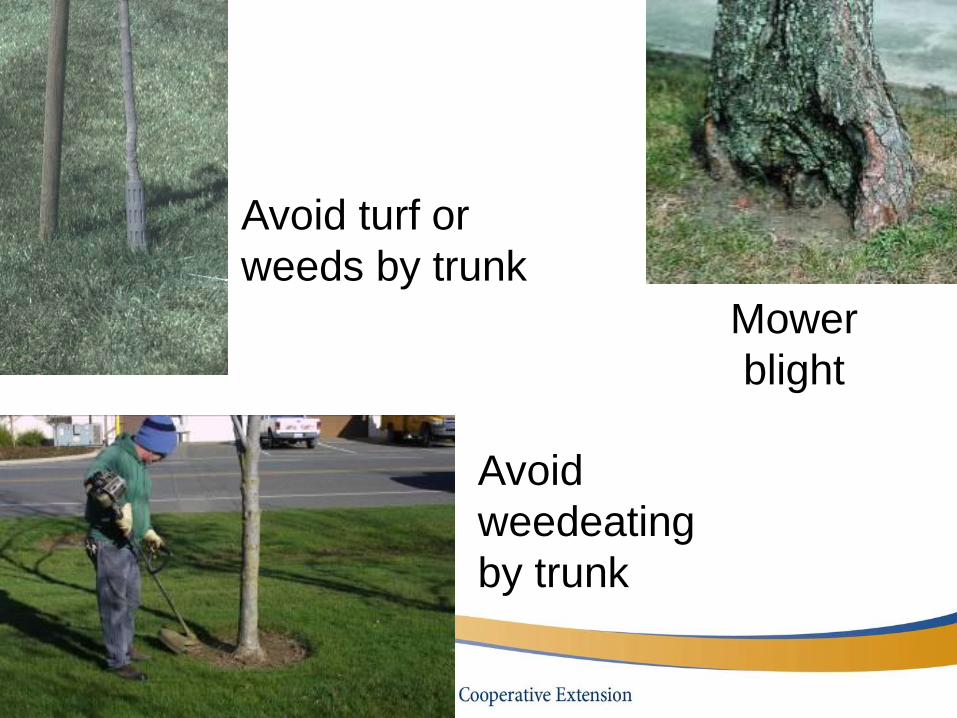
Mower
blight
Avoid
weedeating
by trunk
Avoid turf or
weeds by trunk
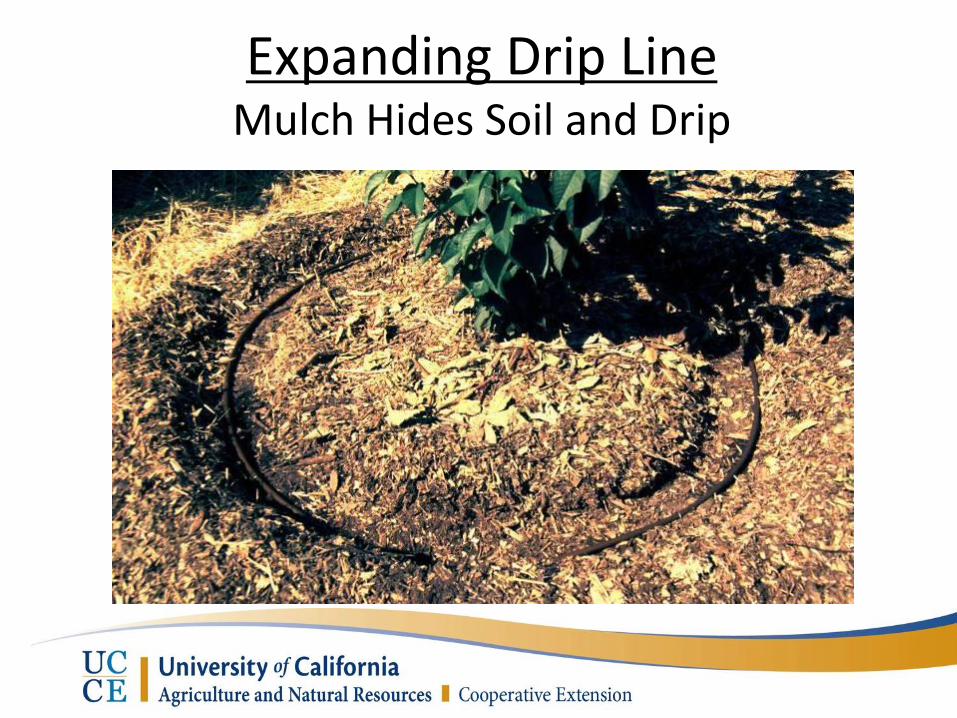
Expanding Drip Line Mulch Hides Soil and Drip

Mulch alone won’t keep soil in place on steep slopes
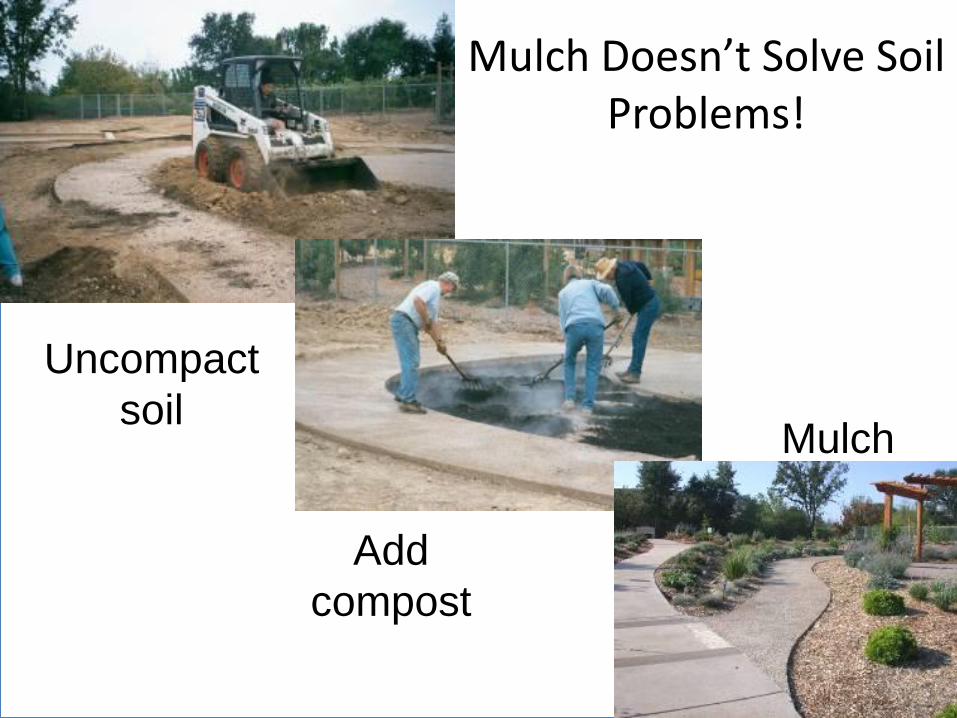
Mulch Doesn’t Solve Soil Problems!
Uncompact
soil
Add
compost
Mulch

Mulch – Conclusions • Avoid mulch in planting holes
• Control perennial weeds first
• Caution on clay soils; away from trunks
• Little or no N tie-up; add N or compost
• Little or no disease transmission
• Root growth improved
• Fabric reduces weeds but it shreds
• Benefits outweigh disadvantages
Topics to be Covered
• Soil organic matter and soil structure
• Fertilizers
– Synthetic vs. Natural
– Effects on Soil Microbes
– N Mineralization and Availability
– Fertilizing Specific Plant Types
• Soil Nutrient Analysis
• Mulches
• Cover Crops
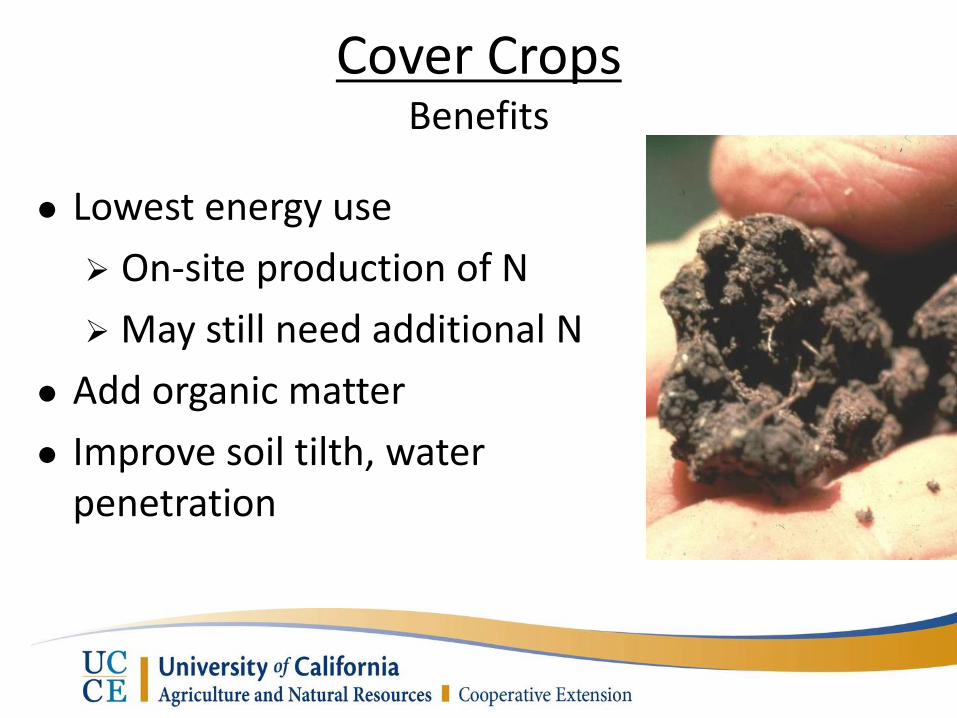
Lowest energy use
On-site production of N
May still need additional N
Add organic matter
Improve soil tilth, water penetration
Cover Crops Benefits
Atmosphere = 78% N; only legumes can use
Rhizobium bacteria in roots use N in soil air
Store N in nodules on roots
Resemble root-knot nematodes
Most N translocated to foliage
Contribute up to 2-3 lbs. N/1,000 sq. ft.
Cover Crops Nitrogen Fixation of Legumes
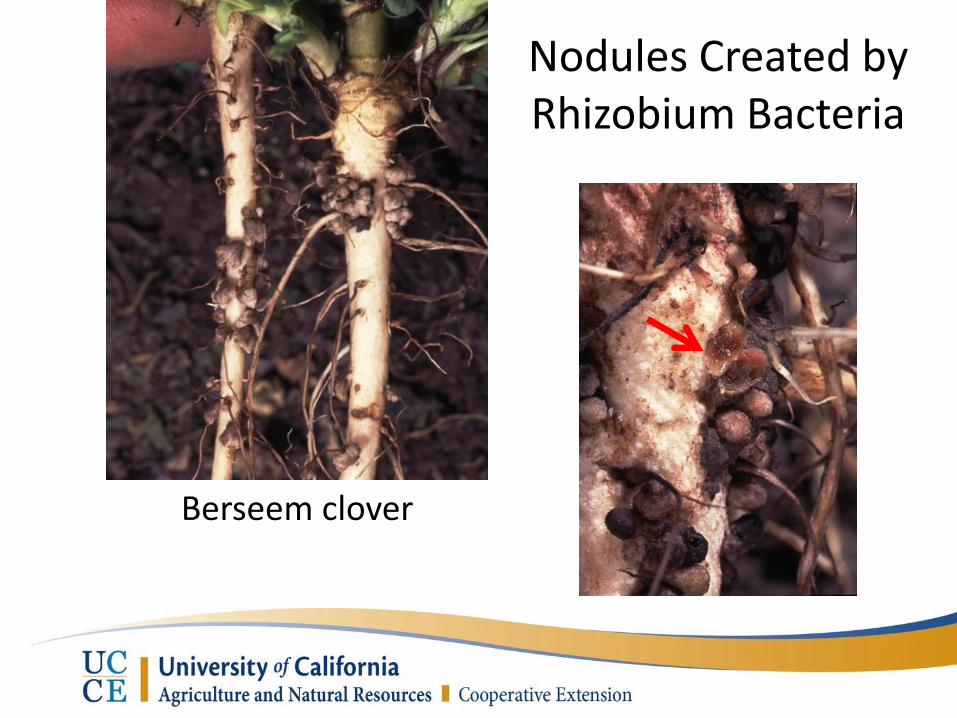
Nodules Created by Rhizobium Bacteria
Berseem clover
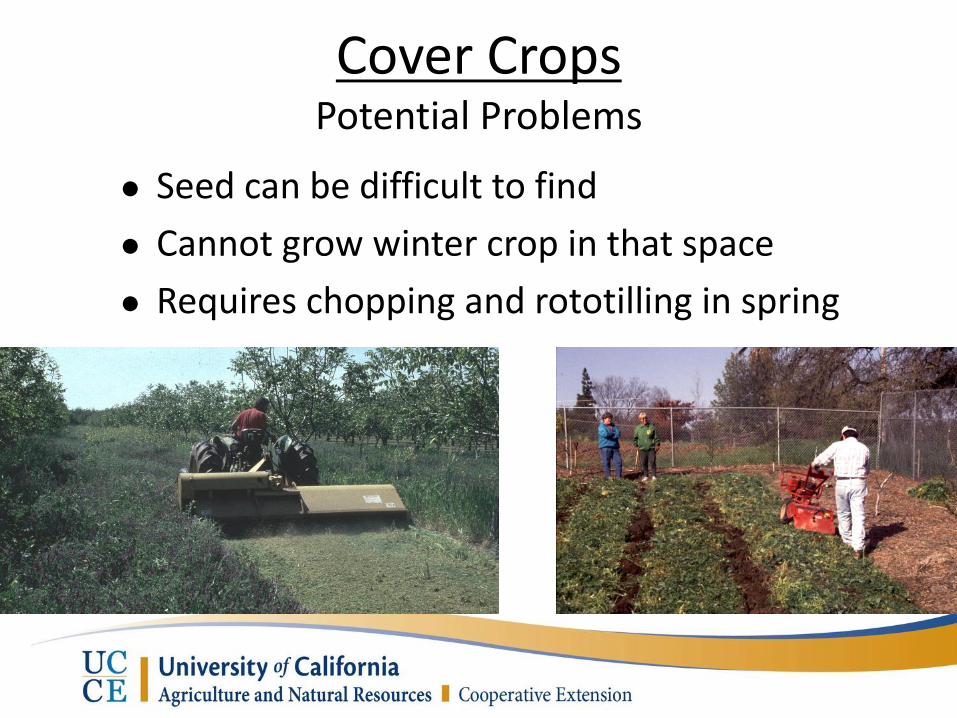
Seed can be difficult to find
Cannot grow winter crop in that space
Requires chopping and rototilling in spring
Cover Crops Potential Problems
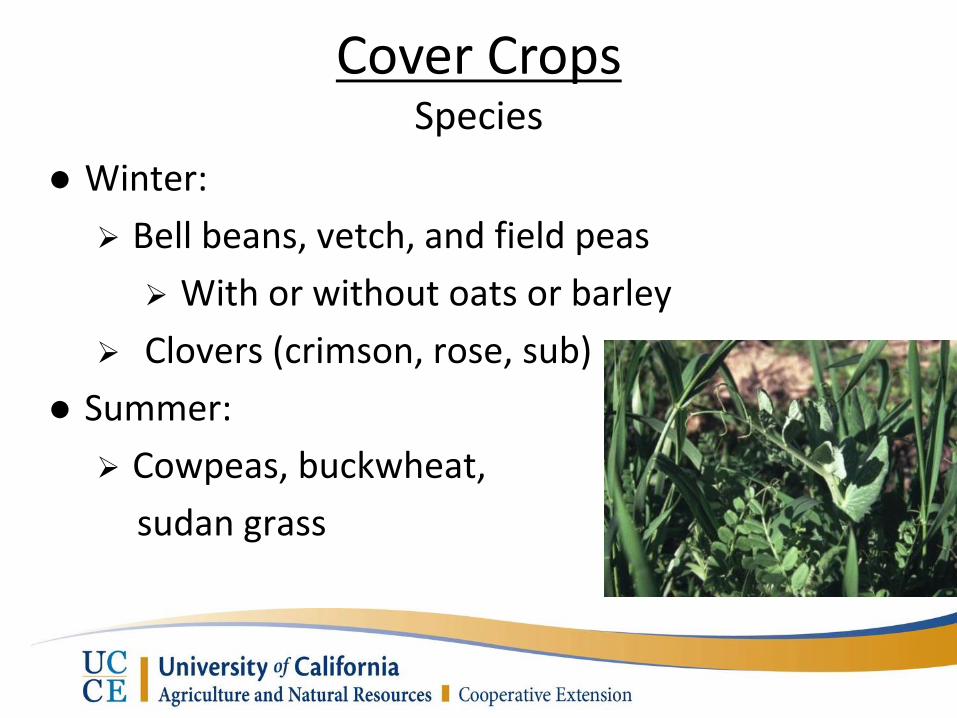
Winter:
Bell beans, vetch, and field peas
With or without oats or barley
Clovers (crimson, rose, sub)
Summer:
Cowpeas, buckwheat,
sudan grass
Cover Crops Species
• Grass alone requires N
• Avoid N fertilizers on legumes
– High soil N - legumes fix little N
• Max. N contribution is at early flowering (incorporate in March)
• >80% of N is in above-ground parts; <20% in roots
Cover Crops Nutrition
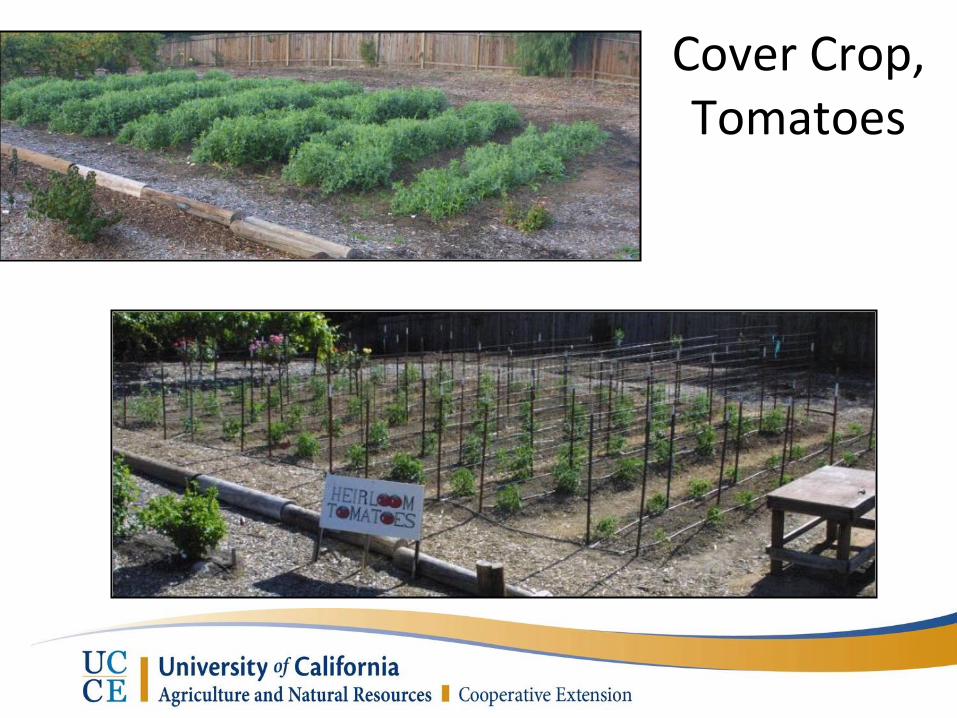
Cover Crop, Tomatoes
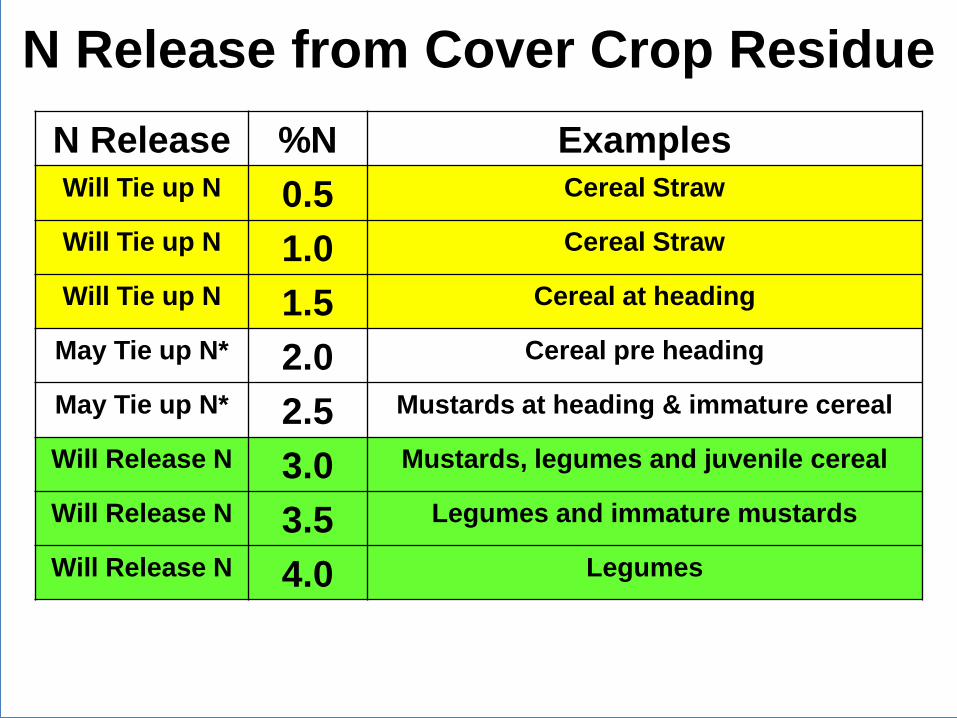
N Release from Cover Crop Residue
N Release %N Examples
Will Tie up N 0.5 Cereal Straw
Will Tie up N 1.0 Cereal Straw
Will Tie up N 1.5 Cereal at heading
May Tie up N* 2.0 Cereal pre heading
May Tie up N* 2.5 Mustards at heading & immature cereal
Will Release N 3.0 Mustards, legumes and juvenile cereal
Will Release N 3.5 Legumes and immature mustards
Will Release N 4.0 Legumes
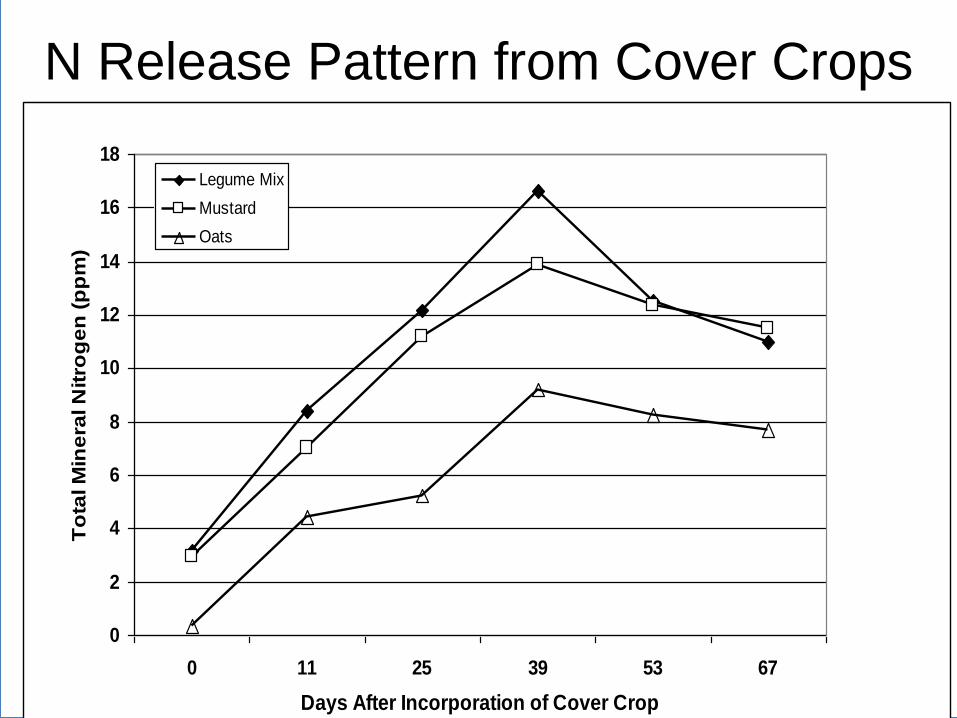
N Release Pattern from Cover Crops
0
2
4
6
8
10
12
14
16
18
0 11 25 39 53 67
Days After Incorporation of Cover Crop
To
tal M
ine
ral N
itro
ge
n (
pp
m)
Legume Mix
Mustard
Oats
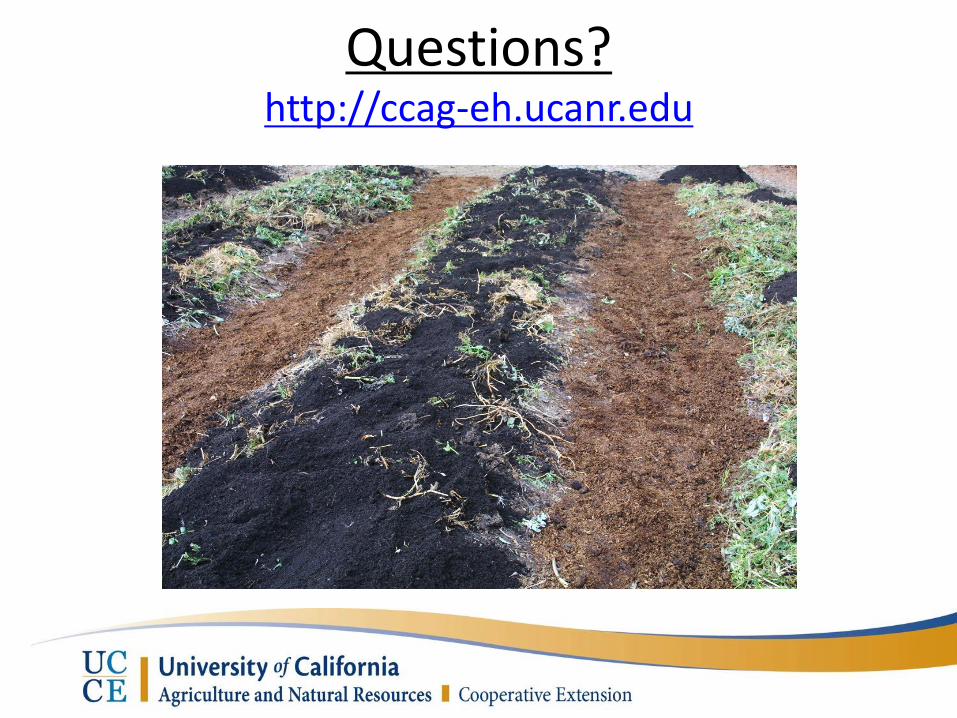
Questions? http://ccag-eh.ucanr.edu