international monetary fund washington, d.c. · 2013-10-30 · isa international standards on...
TRANSCRIPT

© 2013 International Monetary Fund October 2013 IMF Country Report No. 13/316
January 29, 2001 January 29, 2001 January 29, 2001 January 29, 2001
Costa Rica: Fiscal Transparency Assessment
This pilot Fiscal Transparency Assessment for Costa Rica was prepared by a staff team of the International Monetary Fund as background documentation for the periodic consultation with the member country. It is based on the information available at the time it was completed in October 2013. The views expressed in this document are those of the staff team and do not necessarily reflect the views of the government of Costa Rica or the Executive Board of the IMF. The policy of publication of staff reports and other documents by the IMF allows for the deletion of market-sensitive information.
Copies of this report are available to the public from
International Monetary Fund Publication Services 700 19th Street, N.W. Washington, D.C. 20431
Telephone: (202) 623-7430 Telefax: (202) 623-7201 E-mail: [email protected] Internet: http://www.imf.org
Price: $18.00 a copy
International Monetary Fund
Washington, D.C.
INTERNATIONAL
MONETARY
FUND
Fiscal Affairs Department
Costa Rica
Fiscal Transparency Assessment
October 2013
Mario Pessoa, Apolinar Veloz, Ana Teresa Albuquerque and Maria Eugenia Benavides Legarda
2
Contents Page
List of Abbreviations .................................................................................................................4
Executive Summary ...................................................................................................................5
I. Presentation of Fiscal Reports ..............................................................................................10 A. Introduction .............................................................................................................10 B. Quality .....................................................................................................................16 C. Integrity ...................................................................................................................24 D. Recommendations ...................................................................................................26 E. Conclusion ...............................................................................................................27
II. Fiscal Forecasting and Budgeting .......................................................................................29 A. Introduction .............................................................................................................29 B. Comprehensiveness .................................................................................................29 C. Timeliness ...............................................................................................................34 D. Policy Orientation ...................................................................................................35 E. Credibility ................................................................................................................40 F. Recommendations....................................................................................................42 G. Conclusions .............................................................................................................43
III. Fiscal Risk Analysis and Management ..............................................................................45 A. Introduction .............................................................................................................45 B. Risk Analysis...........................................................................................................45 C. Risk Management ....................................................................................................52 D. Fiscal Coordination .................................................................................................58 E. Recommendations ...................................................................................................60 F. Conclusions..............................................................................................................60
Annex. Costa Rica: Recommendations and Action Plan to Improve Fiscal Transparency and Analysis of Fiscal Risks ........................................................................................62
Tables 1. Summary of Fiscal Transparency Assessment ......................................................................8 2. Recommendations to Improve Fiscal Transparency and Risk Analysis ................................9 3. List of Principal Fiscal Reports in Costa Rica .....................................................................10 4. Public Sector: Total Revenue and Expenditure by Institutional Category—2011 ..............12 5. Public Sector: Assets, Liabilities, and Net Worth—2011 ....................................................13 6. Estimates of Tax Expenditures as a Percentage of GDP 2010–13 ......................................15 7. Sectorization: GFSM 2001 Classification versus Costa Rica’s Classification ....................17 8. Classification: National Standards versus International Standards .....................................18 9. Fiscal Reports Published with respect to Institutional Coverage and Periodicity ...............20 10. Reconciliation of Executive Branch Fiscal Figures as of December 2012 ........................24 11. Observations of the CGR on the Financial Statements of the Executive Branch 2011 .....26 12. Summary of the Evaluation of Fiscal Report Practices .....................................................27

3
13. List of Budget Documents .................................................................................................29 14. Projections of Real GDP and the Inflation Rate ................................................................31 15. Projected and Actual Budgetary Central Government Revenues ......................................33 16. Time Elapsed between Submission and Approval of Annual Budget ...............................35 17. Degree of Budget Rigidity as a Percentage of Expenditure ..............................................36 18. Revenue Losses due to Failure to Approve the Tax Reform .............................................36 19. Funds Allocated to Relevant Goals of the 2011–14 PND for the Education Sector .........37 20. Changes in the Annual Budget ..........................................................................................41 21. Projected and Actual Revenue, Expenditure, and Financing .............................................42 22. Summary Evaluation of Fiscal Projection and Budgeting Practices .................................43 23. Fiscal Risks Reports ...........................................................................................................45 24. Specific Elasticity of CG Tax Revenues Relative to GDP ................................................46 25. Examples of Laws with Earmarked Budget Targets..........................................................49 26. Average Premium Calculation for Pensions System .........................................................51 27. National Commission for Risk Prevention and Emergency Response ..............................52 28. Asset Structure and Solvency of Financial Institutions in 2011 ........................................55 29. Characteristics of Public-Private Partnerships ...................................................................57 30. Example of Simulated Calculation of Risk Associated with a Concession Contract for the Daniel Oduber International Airport Passenger Terminal ...........................................57 31. Summary Assessment of Risk Analysis and Management Practices ................................60 Figures 1. Coverage of Flows in Fiscal Reports ...................................................................................12 2. Public Sector: Consolidated and Non-consolidated Entities in Financial Statements .........14 3. Public Sector: Consolidated and Non-Consolidated Total Assets of the Public Sector as a Percentage .........................................................................................................................14 4. Extent of Revisions to Historical Data before and after 2005 .............................................21 5. Discrepancy between Bases for Statistics and Accounting Reports in 2012 .......................23 6. 2011 Budgetary Execution: Institutional Coverage .............................................................30 7. GDP and Inflation: Projections and Actual Data .................................................................32 8. Sectors Benefited by Number of Goals with Satisfactory Progress—2011 PND ...............38 9. Long-Term Profile of Costa Rican Public Debt ..................................................................39 10. Number of Legal Documents Needed to Amend Budget ..................................................41 11. Fiscal Balance of the NFPS as a percent of GDP ..............................................................46 12. GDP Gap as a Percent of Potential GDP ...........................................................................47 13. Deposit Interest Rate, State and Private Banks ..................................................................48 14. Public Debt of the NFPS and the BCCR as a Percent of GDP ..........................................48 15. Trends in Maturity of Total Debt .......................................................................................53 16. Distribution of Key Municipalities’ Debt in 2012 .............................................................58 17. 2012 Budgetary Execution of Nonfinancial Public Corporations .....................................59 Box 1. Costa Rica’s Dual Budgetary System ..................................................................................30

4
LIST OF ABBREVIATIONS ARESEP Public Services Regulatory Authority www.aresep.go.cr BCCR Central Bank of Costa Rica CCSS Costa Rican Social Security Fund CGR Office of the Comptroller General of the Republic www.cgr.go.cr CNC National Concessions Council COFOG Classification of the Functions of Government CONAVI National Roads Council CPI Consumer Price Index DCP Directorate of Public Credit DGCN General Directorate of National Accounting DGCP General Directorate of Public Credit DGPN General Directorate of the National Budget FTA Fiscal Transparency Assessment GDP Gross Domestic Product GFS Government Finance Statistics GFSM 1986 Government Finance Statistics Manual 1986 GFSM 2001 Government Finance Statistics Manual 2001 IMF International Monetary Fund ICE Costa Rican Electricity Institute IFRS International Financial Reporting Standards ILO International Labor Organization INS National Insurance Institute INTOSAI International Organization of Supreme Audit Institutions IPSAS International Public Sector Accounting Standards ISA International Standards on Auditing ISSAI International Standards of Supreme Audit Institutions LARFPP Financial Management Act of the Republic and Public Budgets MIDEPLAN Ministry of Planning www.mideplan.go.cr MOF Ministry of Finance www.hacienda.go.cr MTBF Medium-Term Budgetary Fiscal Framework NFPS Nonfinancial Public Sector PND National Development Plan ROSC Report on Observance of Standards and Codes SDDS Special Data Dissemination Standard SIBINET System for Administration of State Properties SIGAF Integrated Financial Management System SIPP Plans and Budgets Information System STAP Technical Secretariat of the Budgetary Authority SUGEF General Superintendency of Financial Entities www.sugef.fi.cr TE Tax Expenditure TR Tax Revenue UASF Unit of Analysis and Fiscal Monitoring

5
EXECUTIVE SUMMARY
One of the most important aspects of good fiscal management is the capacity of government to formulate and communicate fiscal policies. Fundamental to this is the production and publication of fiscal reports which are both timely and complete and written in an accessible language. The same applies with regard to the preparation, approval, and outturn data of the budget. Likewise, the identification and management of fiscal risks has become increasingly important in view of the recent international crises which have demonstrated that part of the risks lay outside the traditional areas of central government attention. The new 2013 Fiscal Transparency Assessment (FTA) Code developed by the Fiscal Affairs Department (FAD) of the International Monetary Fund (IMF) is an instrument that seeks to reveal a country’s fiscal transparency situation and help prevent fiscal crises. The new Fiscal Transparency Code replaces the 1988 Fiscal Transparency ROSC Code, which was updated in 2007. The structure of the previous Code was based on four pillars, namely the (i) clarity of the roles and responsibilities of public institutions, (ii) degree of openness and transparency of budget processes, (iii) availability to the public of fiscal information, and (iv) guarantees regarding the integrity of fiscal information. This Code has served member countries well, having been used as the basis for the Fund’s assessment of 93 countries. The 1998 Code also played an important role in promoting improvements to fiscal standards, institutions, and reporting. The objectives of the new Code are broad. They aim to enable country authorities, international agencies, markets, and the general public to have: (i) a better understanding of the most significant differences or discrepancies in the fiscal data published by governments; (ii) a more comprehensive description of the main risks to governments’ fiscal forecasts, (iii) a clearer picture of how countries’ fiscal information management practices compare with international standards, and (iv) a more specific, sequenced action plan for addressing the main fiscal transparency weaknesses identified. The new fiscal transparency assessment is divided into three pillars. Those are: (i) the presentation of fiscal reports; (ii) the development of fiscal projections and budgets; and (iii) the analysis and management of fiscal risks. Chapters I, II, and III of the report follow this same sequence. The new Code is divided into 38 dimensions. For each dimension, the practice-based situation is evaluated as “BASIC” (yellow), “GOOD” (light green), or “ADVANCED” (dark green). If the practice is not up to the basic assessment, the denomination “LESS THAN BASIC” (red) is adopted. Costa Rica participated in a fiscal transparency ROSC assessment in November 2007 in keeping with the previous version of the Fiscal Transparency Code. The findings of the

6
assessment showed that Costa Rica was in compliance with the transparency code in several areas. The responsibilities of government authorities and levels were clearly specified and the central bank was operationally independent. The underlying legal framework for public financial management (PFM) processes was sound and significant progress was made in debt management as well as in the centralization and management of financial resources, the updating of accounting standards, and the updating of financial management systems. The budget process was well defined and public. The laws governing private sector regulation were usually clear, tax legislation was good and available to the public, and taxpayer rights were clearly defined in the law. Internal and external audit frameworks were solid and the Office of the Comptroller General of the Republic was independent and technically strong. There was, however, a need for greater efforts to improve transparency in other areas. Essentially, there was a need for improvement in the mechanisms for fiscal coordination with government institutions in general, improvement of the coverage and quality of budget documents and fiscal reports, the introduction of a medium-term fiscal framework, and the preparation of fiscal risk reports and analyses. More specifically: There was room for improvement in the clarity of responsibilities of public institutions
so as to avoid duplication of effort and improve coordination.
Budget formulation and presentation could be improved, in particular by: (i) bringing autonomous government institutions within the scope of the budget; (ii) adopting a medium-term budgetary framework; (iii) developing a public investment program and establishing clear principles for assessing and approving investment projects; (iv) eliminating appropriated expenditure mandates; and (v) including a statement of fiscal risks in the budget documents.
Budget execution and fiscal reporting could be strengthened, among other things by: (i) harmonizing accounting standards and procurement processes across all public institutions; (ii) enhancing supervision and presenting budget outturn reports within the general government budget execution cycle and (iii) improving parliamentary oversight of budget execution.
This current fiscal transparency assessment confirmed that Costa Rica has various excellent and sophisticated fiscal transparency practices. Those include: (i) institutional coverage with annual consolidated budgetary information for the entire public sector and monthly information for the Executive Branch; (ii) information produced regarding tax expenditures; (iii) an independent Office of the Comptroller General of the Republic that audits budget balances by May of the following year; (iv) a medium-term budgetary framework and budgetary projections with forecasts of key macroeconomic variables and the assumptions on which they are based; (v) a Budgetary Central Government budget that is submitted and approved on a timely basis; (vi) the Office of the Comptroller-General’s assessment of the credibility of the government’s fiscal forecast; (vii) annual publication by
7
the General Superintendency of Financial Entities of extensive information on financial sector stability; (viii) wide disclosure of transfers between the government and public corporations; and (ix) of performance data. However, weaknesses persist in some areas. Those include: (i) most fiscal and budgetary information is on a cash basis; (ii) there is insufficient reconciliation and comparability between accounting, budgetary, and statistical information and revenue, expenditure, and financing forecasts; (iii) the budgetary system is very fragmented and dual given that part of the budget is approved by the Legislative Assembly (41 percent of expenditures) and part is approved by the Office of the Comptroller General of the Republic (59 percent); (iv) the government does not revise the budgetary framework for the year in progress; (v) there is no statement of numerical targets for the main fiscal aggregates; (vi) fiscal projections cover only five years; and (vii) no fiscal risk aggregate report is produced on aspects such as macroeconomic risks, contingent liabilities, guarantees, concession contracts, and the indebtedness of municipal governments. A summary of the assessment is presented in Table 1. Table 2 sets out in summary form the actions proposed to improve fiscal transparency in the areas where performance was weakest and a detailed action plan is presented in the Annex.

8
Table 1. Summary of Fiscal Transparency Assessment
1. Fiscal Reporting 2. Fiscal Forecasting & Budgets 3. Fiscal Risk Analysis & Management
Coverage of Institutions
(Advanced) Unity (Less than Basic) Macroeconomic Risks (Basic)
Coverage of Flows (Basic) Gross Budgeting (Advanced) Specific Fiscal Risks (Less than Basic)
Coverage of Stocks (Good) Macroeconomic Forecasts (Good)Contingency Reserves (Less than
Basic)
Tax Expenditures (Good) Medium-term Budget Framework
(Basic)
Asset and Liability Management
(Advanced)
Frequency of In-year Fiscal
Reports (Advanced) Fiscal Strategy Report (Basic) Guarantees (Basic)
Timeliness of Annual Financial
Statements (Basic) Budget Submission (Advanced) Financial Sector Exposure (Advanced)
Classification (Basic) Budget Approval (Good) Long-Term Contracts (Basic)
Internal Consistency (Less than
Basic)
Fiscal Policy Objectives (Less than
Basic)
Financial Derivatives (Not
Applicable)
Historical Consistency (Advanced) Separation of Existing and New
Policies (Good) Sub-National Governments (Basic)
Comparability of Forecasts &
Outturns (Basic)
Performance Information
(Advanced) Public Corporations (Advanced)
Statistical Independence (Basic) Distributional Analysis (Basic)
External Audit (Good) Fiscal Sustainability Analysis (Less
than Basic)
Reliability (Basic) Independent Evaluation
(Advanced)
Supplementary Budget (Good)
Forecast Reconciliation (Less than
Basic)
Advanced 10 (27%) Practices
Good 7 (18%) Advanced
Basic 13 (34%) Good
Less than Basic 7 (18%) Basic
Non Applicable 1 (3%) Less than Basic
Total 38 (100%) Not Applicable

9
Table 2. Recommendations and Action Plan to Improve Fiscal Transparency and Risk Analysis
Practice Recommendation Deadline Coverage of flows, balances, and budgetary classification, accounting and statistics. 1.1.2 and 1.3.1
Complete the implementation of the international public sector accounting standards for the public sector, ensuring that accounting and budgetary classifications are harmonized.
2021
Consistency and reliability of budgetary, accounting, and statistical information. 1.3.2, 1.3.3, and 1.3.4
Reconcile fiscal reports and produce timely audit reports to ensure the reliability of the information.
2017
Budgetary unit, proposal and approval of budget. 2.1.1, 2.2.2, and 2.2.3
Prepare budget reports with analysis of situation and outlooks by the end of the year for the public sector, with the following periodicity: (i) approved budget report by the end of January; (ii) quarterly execution report by 30 days after the end of the quarter; (iii) annual consolidated execution report by April 1 of the following year. Amend the Constitution to make the Legislative Assembly responsible for approving the budget for the entire public sector.
2016
2017
Medium-term budgetary framework, report on fiscal strategy and fiscal policy objectives. 2.1.4, 2.2.1, and 2.3.1
In the medium-term budgetary framework (MTBF) document, the government should summarize macroeconomic and fiscal developments since the last budget and a revised macroeconomic and fiscal framework for the year in progress over the medium term. The MTBF should accurately state the numerical targets for the main fiscal aggregates over time and the medium term.
2018
Information on performance of programs. 2.3.3
Establish direct linkage between National Development Plan programs and the budget. Adjustments include: standardization of concepts, programmatic structures, and performance indicators; identification of priority programs; improved performance evaluations to measure the results of policies.
2016
Fiscal sustainability analysis. 2.3.5
In the report on the Situation of the Debt, the analysis of debt trends should be expanded by describing multiple scenarios for evaluating the main fiscal aggregates and including social security with a minimum of ten years and publish debt information on the consolidated public sector.
2018
Analysis and management of fiscal risks. Pillar 3.
The Ministry of Finance (MOF) should prepare an annual document reporting on fiscal risks as part of the budget documents. This document should contain information on macroeconomic risks, public debt, public corporations, debt guarantees, contingent liabilities, concession contracts, natural disasters, financial institutions, municipal governments, and social security and health.
2017

10
I. PRESENTATION OF FISCAL REPORTS
A. Introduction
Table 3. List of Principal Fiscal Reports in Costa Rica
Report Area Responsible Content Consolidation of public sector data
MOF – Technical Secretariat of the Budgetary Authority
Annual data on revenues, expenditures, primary and financial deficits of the public sector, in comparison with previous year.
Report on budget execution
MOF – General Directorate of the National Budget
Annual comparison between execution and budget authorized for the budgetary central government.
Report on physical outcomes of executed programs
MOF - General Directorate of the National Budget
Annual performance of budget compared to amounts authorized; overall progress in operational and strategic indicators.
Estimate of Tax Expenditure
MOF – General Directorate of Finance, Fiscal Policy Division
Annual estimate of tax expenditure by type of tax and economic sector.
Status of public debt MOF - Directorate of Public Credit Annual evaluation of public sector debt and placement strategy; projects financed with external debt; analysis of debt sustainability and risk.
Report evaluating the National Development Plan (PND)
MIDEPLAN – Ministry of Planning Annual report on the degree of success in reaching the goals of the central government and other entities.
Annual report CGR – Office of the Comptroller General of the Republic
Report on public finances, budget execution, evaluation of the PND, and management of general government.
Financial data on central government revenue, expenditures, and financing
MOF – Technical Secretariat of the Budgetary Authority
Monthly data on revenues, expenditures, primary and financial deficits, compared to same period in previous year.
Managing the debt MOF – Directorate of Public Credit Quarterly report on placement of domestic debt bonds.
Monitoring of budgetary management
MOF – General Directorate of the National Budget
Semiannual comparison of execution and the budget; number of physical indicators achieved.
Fiscal and budgetary development of the public sector
CGR – Office of the Comptroller General of the Republic
Semiannual comparison of fiscal flows from consolidated public sector budgets with the first half of the previous year; observations on PND goals and available sectoral goals; index of institutional vulnerability.
Semiannual report on evaluation of the PND
MIDEPLAN – Ministry of Planning Progress in PND sectoral goals.
1.1. Coverage
Coverage of institutions (1.1.1) 1. Each year fiscal statistics at the budget execution level consolidate 225 out of 229 public sector entities (99.7 percent of total expenditure) and are widely available to the

11
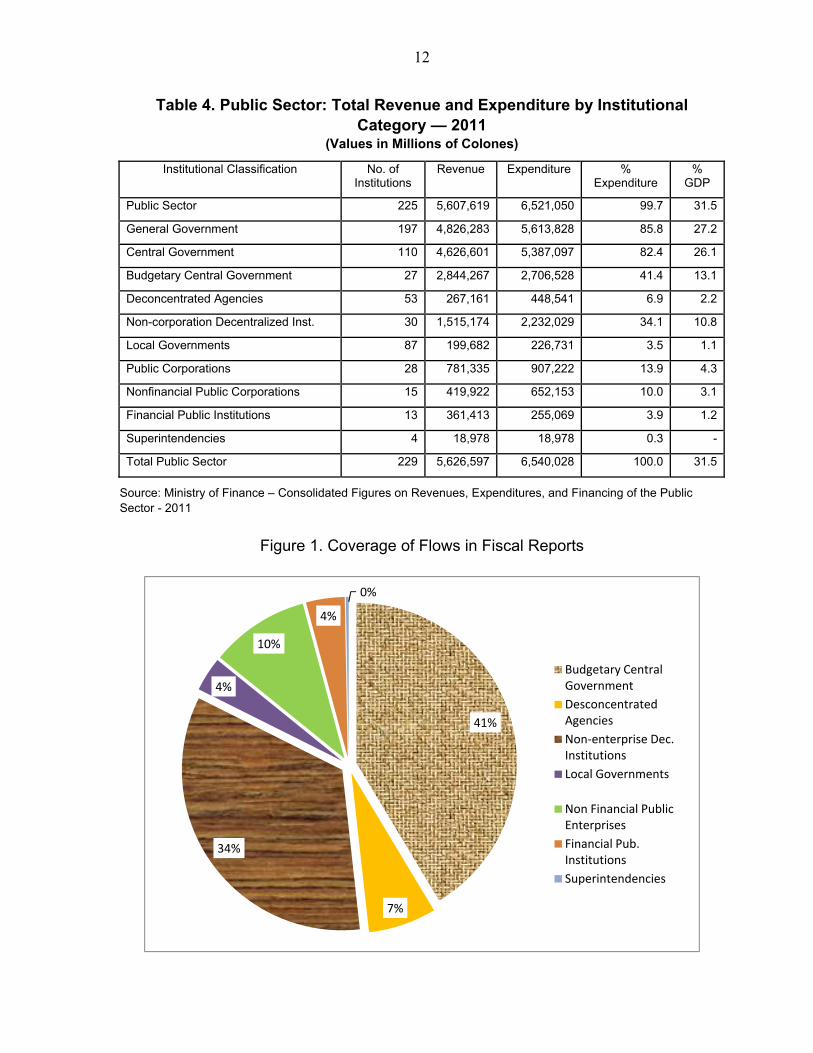
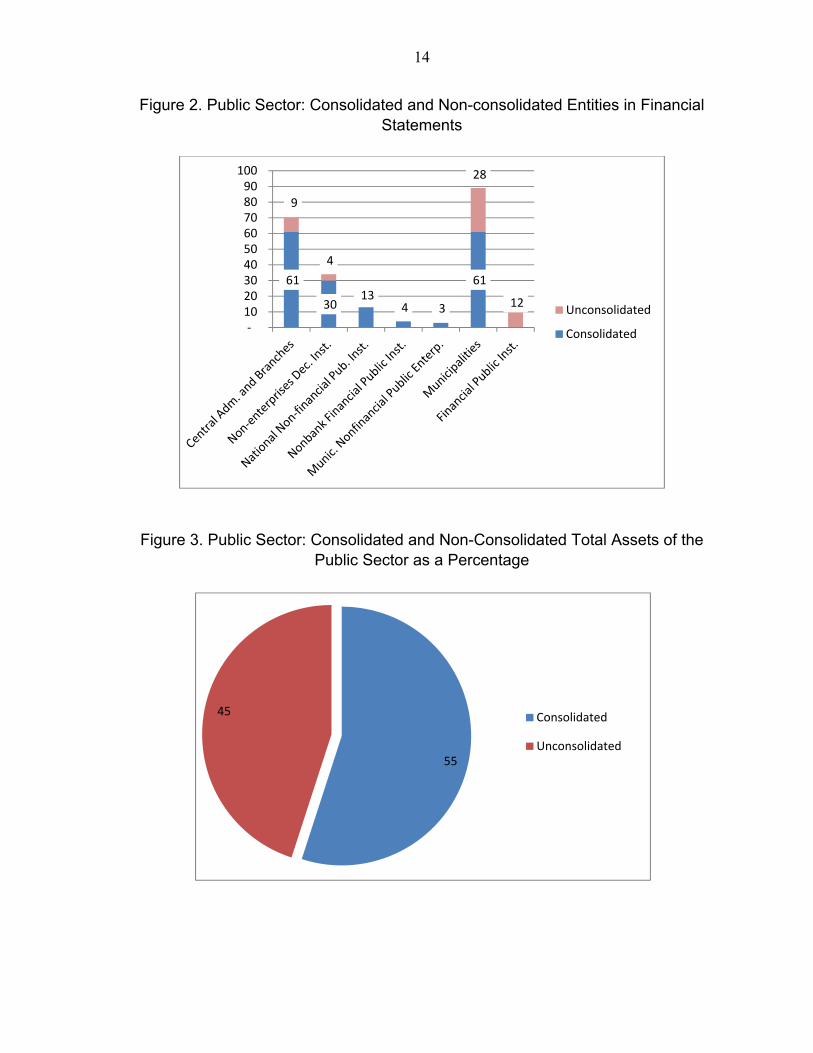
public (ADVANCED). The Technical Secretariat of the Budgetary Authority (STAP) publishes at end-June of the following year a report with budget execution figures based on the economic classification of revenue, expenditure, and financing according to the GFSM 1986 and functional classification according to the Classification of Functions of Government (COFOG).1 The dissemination schedule for the reports is available on the STAP website. Only four entities (superintendencies) were not included in the statistics in 2011. The Ministry of Finance (MOF) publishes the budget execution of the budgetary central government on a monthly basis. The entities that make up the rest of the central government (deconcentrated agencies and non-corporation decentralized institutions), the municipalities, and financial and non-financial public corporations submit their budget execution reports, individually and in non-consolidated format, to the Office of the Comptroller General of the Republic (CGR) on a quarterly basis. These reports are available individually by entity in the CGR’s Plans and Budgets Information System (SIPP) and are available to the public on the CGR website.2 Since 2006, budgetary information is broken down according to economic classification by revenue, expenditure, and financing account and is updated on a daily basis. For 2012, the STAP will include all entities in a consolidated report. Table 4 and Figure 1 show the consolidated data for 2011 by institutional category level. Coverage of revenues, expenditures and other flows (1.1.2) 2. Fiscal reports cover 99.7 percent of all public sector revenues and expenditures on a cash accounting basis (BASIC). As seen in Table 2 and Figure 2, the coverage of fiscal statistics includes nearly all revenues, expenditures, and financing of public sector entities. The only exceptions are four superintendencies (financial institutions, pensions, insurance, and securities) that were not consolidated in 2011 (accounting for 0.3 percent of expenditures). For 2012, all entities will be included in the annual consolidated report.
1https://www.hacienda.go.cr/Msib21/Espanol/Secretaria+Tecnica+de+la+Autoridad+Presupuestaria/Consosecpub.htm
2 www.cgr.go.cr
12
Table 4. Public Sector: Total Revenue and Expenditure by Institutional Category — 2011
(Values in Millions of Colones)
Institutional Classification No. of Institutions
Revenue Expenditure % Expenditure
% GDP
Public Sector 225 5,607,619 6,521,050 99.7 31.5
General Government 197 4,826,283 5,613,828 85.8 27.2
Central Government 110 4,626,601 5,387,097 82.4 26.1
Budgetary Central Government 27 2,844,267 2,706,528 41.4 13.1
Deconcentrated Agencies 53 267,161 448,541 6.9 2.2
Non-corporation Decentralized Inst. 30 1,515,174 2,232,029 34.1 10.8
Local Governments 87 199,682 226,731 3.5 1.1
Public Corporations 28 781,335 907,222 13.9 4.3
Nonfinancial Public Corporations 15 419,922 652,153 10.0 3.1
Financial Public Institutions 13 361,413 255,069 3.9 1.2
Superintendencies 4 18,978 18,978 0.3 -
Total Public Sector 229 5,626,597 6,540,028 100.0 31.5
Source: Ministry of Finance – Consolidated Figures on Revenues, Expenditures, and Financing of the Public Sector - 2011
Figure 1. Coverage of Flows in Fiscal Reports
41%
7%
34%
4%
10%
4%
0%
Budgetary Central Government
Desconcentrated Agencies
Non-enterprise Dec. Institutions
Local Governments
Non Financial Public Enterprises
Financial Pub. Institutions
Superintendencies

13
Coverage of assets and liabilities (1.1.3) 3. Fiscal reports cover all financial assets and liabilities of the nonfinancial public sector (GOOD). The General Directorate of National Accounting (DGCN) of the MOF is responsible for the consolidation of financial statements at various levels: (i) Executive Branch; (ii) Central Government; and (iii) Nonfinancial Public Sector. Four balance sheets are prepared by the DGCN or the STAP: (i) statement of net worth including assets, liabilities, and net worth; (ii) revenues, expenditures, financing (Statement of Financial Performance), and earnings (Statement of Economic Result); (iii) cash flow; and (iv) changes in net worth. The financial statements of the Executive Branch are prepared and sent to the CGR on March 1 (60 days). The CGR audits the statements by the end of the year (12 months). The audited financial statements of public banking corporations and the central bank are not part of the consolidation but are published on the respective websites.3
Table 5. Public Sector: Assets, Liabilities, and Net Worth—2011 Values in Millions of Colones
Entities Assets Liabilities Net Worth %GDP Banking Financial Public Institutions 11,995,602 12,387,359 (391,756) 57.8Central Administration and Branches 14,136,860 7,635,447 6,501,414 68.1Non-corporation Decentralized Institutions 3,536,006 399,085 3,136,922 17.0National Nonfinancial Public Corporations 6,493,721 2,369,360 4,124,362 31.3Nonbanking Public Financial Institutions 1,589,427 867,118 722,309 7.7Municipal Public Nonfinancial Corporations 174,160 56,920 117,240 0.8
Municipalities 508,186 64,152 444,033 2.4
Total 26,438,360 11,392,082 15,046,280
Percent of GDP 127.4 54.9 72.5
Source: MOF, General Directorate of National Accounting and Banking Financial Institutions
3 Central Bank www.bccr.fi.cr; Bank of Costa Rica www.bancobcr.com; Banco Nacional de Costa Rica, Banco Crédito Agrícola de Cartago, and Banco Popular y de Desarrollo Comunal
14
Figure 2. Public Sector: Consolidated and Non-consolidated Entities in Financial Statements
Figure 3. Public Sector: Consolidated and Non-Consolidated Total Assets of the Public Sector as a Percentage
61
30 13
4 3
61
9
4
28
12
-10 20 30 40 50 60 70 80 90
100
Unconsolidated
Consolidated
55
45 Consolidated
Unconsolidated

15
Tax expenditure (1.1.4)
4. Tax expenditures are authorized by law; revenue losses are estimated by type of tax and are usually published annually as part of the budget documents (GOOD). The General Directorate of Finance of the MOF, Fiscal Policy Division, prepares a report with the estimate of tax expenditure. The 2010 and 2011 reports were published but not the 2012 report. Total tax expenditure for the year 2011 is estimated at 5.79 percent of GDP; 3.69 percent relates to the general sales tax, 1.8 percent to income tax, and 0.3 percent to other taxes. For 2012 and 2013, tax expenditures are estimated at 5.76 percent of GDP. The report explains the methodology adopted, presents the legal basis supporting exemptions, and breaks down the information by economic sector. However, budgetary goals and targets for tax expenditures are not defined.
Table 6. Estimates of Tax Expenditures as a Percentage of GDP 2010–13
Tax Category 2010 2011 2012 2013
Sales 3.68 3.69 3.66 3.66
Income 1.80 1.80 1.80 1.80
Other 0.33 0.30 0.30 0.30
Total 5.81 5.79 5.76 5.76
Source: Ministry of Finance, Estimated Tax Expenditure for Costa Rica in 2010.4
1.2. Frequency and Timeliness
Frequency on in-year fiscal reports (1.2.1)
5. Since 2010, fiscal reports on the Executive Branch’s budget execution have been published monthly and the consolidated public sector report annually (ADVANCED).5 However, there is no uniform publication schedule for reports issued by other public sector entities. The CGR publishes budget execution reports on each entity: (i) on a quarterly basis for the municipalities and decentralized entities; (ii) semiannually for trust funds; and (iii) annually for private entities that receive public funds. This difference in periodicity makes periodic consolidation of public sector budget execution impossible.
4 https://www.hacienda.go.cr/Msib21/Espanol/Direccion+General+de+Presupuesto+Nacional/proyleyppto2012.htm 0057C30246CC/28791/Gasto_Tributario_CostaRica.pdf
5 https://www.hacienda.go.cr/Msib21/Espanol/Secretaria%20Tecnica%20de%20la%20Autoridad%20 Presupuestaria /Ingresos%20y%20Gastos%20Gobierno

16
Timeliness of audited annual financial statements (1.2.2)
6. The annual financial statements of the Executive Branch are published on March 1 of the following year (ADVANCED) but they are audited 12 months after the end of the fiscal year (BASIC). All public entities submit budget execution reports to the CGR by March 1 of the following year. The CGR prepares a report by May 30 and sends it to the Legislative Assembly. The MOF prepares and submits the financial statements of the Executive Branch to the CGR by March 1 of the following year. The CGR audits these statements by December 31.
B. Quality
Classification (1.3.1)
7. Fiscal reports include an institutional and economic classification that partially coincides with international standards that report budgetary revenues and expenditures separately and include information on all revenue sources (BASIC). The institutional budgetary classifiers are different from the accounting and statistical classifiers of the GFSM 2001. Costa Rica sectorizes the institutions of the nonfinancial public sector as follows: (i) Government of the Republic;6 (ii) rest of the public sector; and (iii) nonfinancial public corporations. The Government of the Republic in turn includes the Central Administration7 and the Central Government according to the internal definition. The national classification presents some sectoral and conceptual differences as compared to the GFSM 2001, particularly in considering the following as entities: (i) service of the public debt; (ii) system of pensions charged to the budget of the republic; and (iii) specific works, which on average represent 44 percent of the approved budgets of the government of the republic in the last three years. However, this does not hamper understanding of the structure of the public sector and is not an obstacle to producing statistics according to the GFSM 2001. Table 7 presents the correlation between the institutional classifier used in Costa Rica and that of the GFSM 2001.
6 Government of the Republic: ministries, autonomous institutions, and the branches (Judiciary, CGR, Prosecutor’s Office, Ombudsman’s Office, Legislative Assembly)
7 Central Administration: ministries and deconcentrated institutions.

17
Table 7. Sectorization: GFSM 2001 Classification versus Costa Rica’s Classification
GFSM 2001 NATIONAL National Reclassification to
GFSM 2001 PUBLIC SECTOR PUBLIC SECTOR General Government Government of the Republic Central Government Ministries Budgetary Budgetary Deconcentrated Entities Extrabudgetary Extrabudgetary Branches of government Extrabudgetary Social Security Funds State Governments Local Governments Public Corporations Rest of the Public Sector
Nonfinancial Non-corporation Decentralized Institutions
Financial Autonomous Entities State Universities Extrabudgetary University Colleges Extrabudgetary Costa Rican Social Security Fund Social Security Funds Local Governments Local Governments Nonbanking Financial Institutions Financial Public Corporations Nonfinancial Public Corporations National Nonfinancial Public Corporations Municipal Nonfinancial Public Corporations Financial Public Corporations Financial Public Corporations
Note: In the case of the STAP, in its statistics, the branches of government form part of the budgetary central government. Source: Ministry of National Planning and Economic Policy: Costa Rica Public Sector and its organization, May 2010. IMF Statistics Department June 2012 and February 2013 mission reports on Public Finance Statistics. 8. Budgetary classifiers are the same in all public sector institutions based on Law 8131 of 2001, the Financial Management Act of the Republic and Public Budgets
(LARFPP). (Table 8). Revenue classifiers are based on the source of funds and expenditures have economic classifiers, classifiers by purpose of expenditure, functional expenditure classifiers, and classifiers by source of financing. Budgetary classifiers are broad except that they group under a single concept transfers, grants, and subsidies, which have different connotations under the GFSM 2001. In addition, the account headings for securities held by the Treasury are not detailed. 9. There is a General Chart of Accounts that is not used fully and uniformly by some public entities as its implementation, initially scheduled for 2012,8 has been postponed to 2016.9 This weakness is currently offset with a conversion table designed by the
8 Published in Gazette 238 of Tuesday, December 9, 2008. Decree 34918
9 Decree 36961-H

18
General Directorate of National Accounting (DGCN). Some accounting classifiers such as expenditures for global allocations are inconsistent with the technical accuracy required in accounting. The level of detail of the budgetary classifiers is not sufficient to meet the requirements of the accounting classifiers and of the GFSM 2001, making it difficult to link and harmonize them and limiting aggregation and consolidation as well as the disclosure of consistent information. In view of this, it would be advisable to introduce a degree of harmonization of the budgetary and accounting classifiers and concepts with less disaggregation in the budget preparation phase and a more detailed breakdown for purposes of budget execution and its recognition in the accounts. The MOF is carrying out a reform to implement accrual basis accounting and international public sector accounting standards. It is anticipated that use of the international standards will be mandatory in 2016 and will cover the entire nonfinancial public sector. Banking financial institutions have already adopted the international standards for financial institutions (IFRS). Table 8 presents a summary of the catalog of accounts included in the National Chart of Accounts, updated as at February 10, 2013, compared to the requirements of the GFSM 200. Internal consistency (1.3.2)
10. Fiscal reports do not include reconciliation of either aggregate flows or aggregate stocks (LESS THAN BASIC). As can be seen in Table 9, there is no standard criterion in terms of periodicity or sectoral division for the submission of fiscal information. Fiscal reports are prepared on the basis of information from various sources and some processes are performed manually, with some adjustments. Outcomes are processed and disclosed with respect to multiple sectors and without regular periodicity. All this makes it impossible to cross reference information and impedes interpretation. Standardization of periodicities and coverage by sector would improve transparency of fiscal information and facilitate coordination, as well as the establishment of a common GFS database.10
Table 8. Classification: National Standards versus International Standards
GENERAL CHART OF ACCOUNTS STATISTICS MANUAL 2001
1000 ASSETS 6 ASSETS 1000 1100 1110 Cash 6202 Currency and deposits1000 1100 1120 Recognized entitlements to be recovered 6208 Other accounts receivable1000 1100 1130 Financial investments 6203 Securities other than shares1000 1100 1140 Credits 6204 Loans 1000 1100 1150 Goods inventory 612 Inventories 1000 1200 1210 Investments and credits 6203 Securities other than shares1000 1200 1220 Private property 611 Fixed assets 1000 1200 1230 Public property 611 Fixed assets 1000 1200 1240 Intangible assets 6144 Intangible assets
1000 1300 Other assets 614 Nonproduced assets 1000 1300 1320 Prepaid expenses 6208 Other accounts receivable1000 1300 1330 Securities held by the Treasury 6213 Securities other than shares
10 See IMF/STA February 2013 technical assistance report on GFS.

19
Table 8. Classification: National Standards versus International Standards (concluded)
GENERAL CHART OF ACCOUNTS STATISTICS MANUAL 2001
Not opened 6205 Shares and other equity
Not opened 6206 Insurance technical reserves
Not opened 6207 Financial derivatives
Not opened 623 Monetary gold and SDRs
2000 LIABILITIES 63 LIABILITIES
2000 2100 2111 Pending payment orders 6308 Other accounts payable
2000 2100 2112 Placement of domestic debt securities - short term 6313 Securities other than shares
2000 2100 2113 Recognized short-term budgetary obligations 6308 Other accounts payable2000 2100 2114 Interest expenses payable 6308 Other accounts payable2000 2100 2115 Nonbudgetary obligations recognized 6308 Other accounts payable2000 2100 2116 Short-term bonded debt 6313 Securities other than shares2000 2100 2117 Short-term external debt 6323 Securities other than shares2000 2100 2118 Miscellaneous short-term deposits 6302 Currency and deposits2000 2100 2119 Accrued coupon interest 6308 Other accounts payable2000 2100 2120 Taxes withheld 6318 Other accounts payable2000 2100 2121 Short-term loans 6304 Loans 2000 2100 2199 Value added taxes 6318 Other accounts payable2000 2200 2211 Placement of long-term securities 6303 Securities other than shares2000 2200 2212 Miscellaneous long-term deposits 6302 Currency and deposits2000 2200 2213 Recognized obligations 6308 Other accounts payable2000 2200 2214 Long-term external debt 6324 Loans 2000 2200 2215 Long-term bonded debt 6303 Securities other than shares2000 2200 2216 Long-term loans 6304 Loans 2000 2200 2217 Shares and other equity 6305 Shares and other equity2000 2200 2218 Insurance technical reserve 6306 Insurance technical reserves2000 2200 2219 Irredeemable debt 6303 Securities other than shares2000 2200 2220 Financial derivatives 6307 Financial derivatives2000 2200 2221 Revenue collected in advance 6308 Other accounts payable2000 2200 2222 Fixed interest premium 6308 Other accounts payable3000 NET WORTH 6 NET WORTH 4000 REVENUE 1 REVENUE 4000 4100 4111 Tax revenue 11 Taxes 4000 4100 4112 Nontax revenue 14 Other revenue 4000 4100 4113 Transfers 13 Grants. 4000 4100 4114 Grants 14 Other revenue 4000 4100 4115 Other revenues 14 Other revenue 4000 4100 4116 Social contributions 12 Social contributions4000 4200 4211 Interest on renegotiated loans 1411 Interest 4000 4200 4213 Favorable exchange rate difference 42 Financial assets 4000 4200 4214 Refunds 14 Other revenue 4000 4200 4215 Asset incorporation 31 Net acquisition of nonfinancial assets4000 4200 4216 Liquidation of liabilities 33 Net incurrence of liabilities 4000 4200 4217 Other nonbudgetary revenues 14 Other revenue 5000 EXPENDITURES 2 EXPENDITURES 5000 5100 5111 Expenditures for personal services 21 Employee compensation 5000 5100 5112 Expenditures for nonpersonal services 22 Use of goods and services 5000 5100 5113 Expenditures for materials and supplies 22 Use of goods and services5000 5100 5114 Expenditures for transfers 26 Grants 5000 5100 5115 Interest expenses 24 Interest Not opened 25 Subsidies Not opened 27 Social benefits 5000 5100 5116 Prior year expenditures 28 Other expenses 5000 5100 5117 Expenditures for global allocations 28 Other expenses 5000 5300 5311 Depreciation expenditures 23 Consumption of fixed capital

20
Table 9. Fiscal Reports Published with respect to Institutional Coverage and Periodicity
Note: “public debt” covers the nonfinancial public sector and the central bank Historical consistency (1.3.3) 11. Historical fiscal data have not been subject to material revisions but have been affected by methodological changes (ADVANCED). There are statistical series according to the GFSM 1986 since the mid-1980s and financial statements published starting in 2007. Historical fiscal data have not been subject to material revisions but have been affected by methodological changes, and series have been recalculated for the last four years to achieve historical consistency while keeping the original data at the same time. Starting in 2005, the functional classification of expenditure under the GFSM 2001 specifying 10 sectors was adopted, replacing the classification based on social function broken down into five sectors, which has affected the composition of spending (Figure 4).
FISCAL REPORTS
2012 2011 2010 2012 2011 2010 2012 2011 2010 2012 2011 2010 2012 2011 2010 2012 2011 2010 2012 2011 2010 2012 2011 2010
ACCOUNTING
Balance sheets X X - L X X - L X - L L L x x x X
Statements X X - L X X - L X - L L L x x x x Notes X X - L X X x x X x x X
BUDGETARY Budgetary revenues report 31 X Annual collections by type of tax X X X
Budgetary settlement X X X
DEBT
Public Debt X X X
STATISTICS
Annual Consolidated X X X
Monthly Consolidated X X X
X With cutoff as of December 31 L With cutoff as of June 30
Central
Government
Consolidated
Nonfinancial Each Ministry
MINISTRY OF FINANCE FISCAL REPORTS PUBLISHED 2010-2012
Executive
Branch
Deconcentrated
Agencies
Branches of
Government
Central
Administration
Central Admin.
and Branches

21
Figure 4. Extent of Revisions to Historical Data before and after 2005
Source: STAP
Economic Services
51%
Education11%
Health 10%
General Public Services
10%
Social Protection
11%
Others3%
Public Order and Security
4%
Recreation, Sports and
Culture0%
Environmental Protection
0%
Expenditure by Function Before 2005
Recreation and Culture,
1%
Housing, 9%
Education, 30%
Health Affairs and Services ,
28%
Security and social
assistance, 32%
Expenditure by Function After 2005

22
Comparability of fiscal reports (1.3.4)
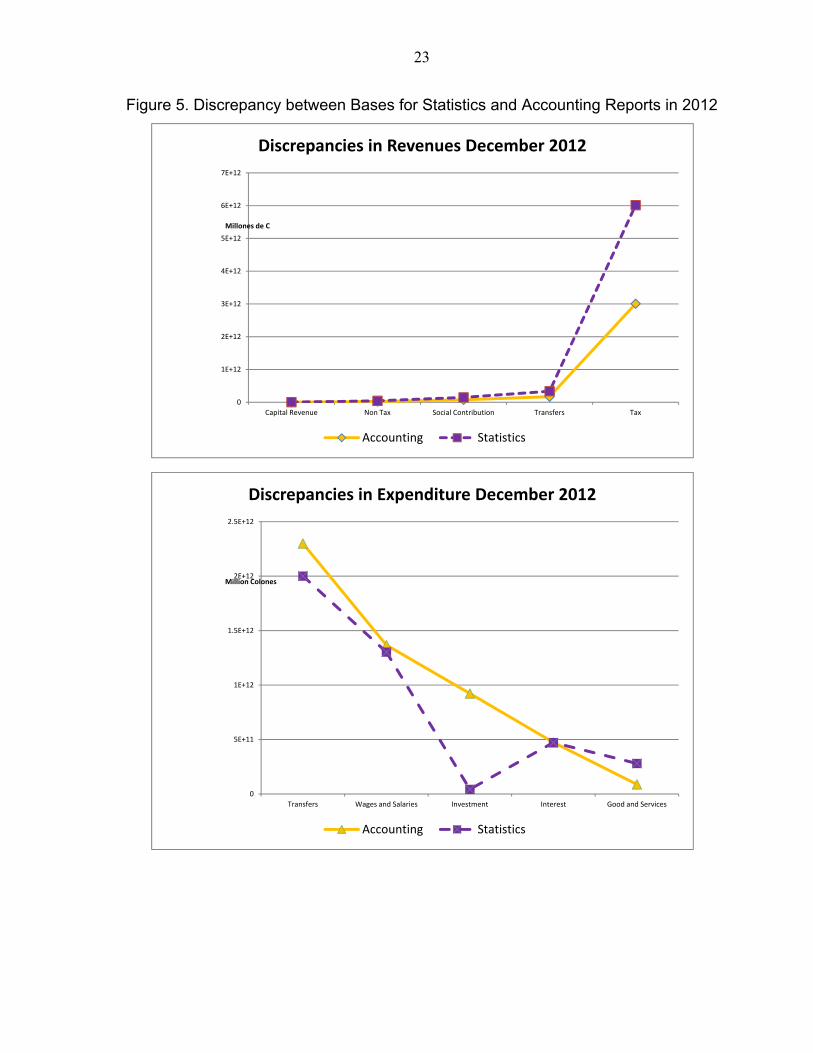
12. The MOF’s monthly budgetary execution report is directly comparable to the budget. However, fiscal reports at broader levels are not readily comparable given the complexity of sectorization of the public sector (BASIC). The General Consolidated Financial Statements of the Nonfinancial Public Sector (NFPS) is prepared annually. Institutional coverage has averaged 60 percent over the last three years, incorporating the financial statements of nine of the largest nonfinancial corporations, including the Costa Rican Electricity Institute, the Costa Rican Petroleum Refinery, and the Costa Rican Social Security Fund. However, budgetary and debt-related information using the same institutional sectorization is not available, so that fiscal reports are not easily comparable. The General Consolidated Financial Statements of the NFPS is not audited and not all the accounting notes are published on the DNCP website. The latest financial statements as of December 31, 2012 contains information on a mixed basis (cash and accrual). 13. The records of economic events emerge on the basis of budgetary events and generate accounting records. However, even though the classification and basis (cash for revenue and accrual for expenditure) used are the same, there are discrepancies between the accounting reports (DNCP) and the revenue and expenditure reports used for the statistical reports (STAP) because of dissimilar coverage as in the case of the reports in Table 9. The STAP covers exclusively budgetary data while the accounting data coverage is much broader. 14. In addition, there are differences between the accounting balances of accounts payable and accounts receivable, as in the case of the National Roads Council (CONAVI) and the Costa Rican Social Security Fund (CCSS). These entities record accounts receivable in the central administration using values pending transfer as assigned by law, which are not recorded as liabilities in the central administration.
23
Figure 5. Discrepancy between Bases for Statistics and Accounting Reports in 2012
0
1E+12
2E+12
3E+12
4E+12
5E+12
6E+12
7E+12
Capital Revenue Non Tax Social Contribution Transfers Tax
Millones de C
Discrepancies in Revenues December 2012
Accounting Statistics
0
5E+11
1E+12
1.5E+12
2E+12
2.5E+12
Transfers Wages and Salaries Investment Interest Good and Services
Million Colones
Discrepancies in Expenditure December 2012
Accounting Statistics

24
Table 10. Reconciliation of Executive Branch Fiscal Figures as of December 2012
HEADING ACCOUNTING STAP DIFFERENCE COLONES
MILLION %
GDP COLONES
MILLION %
GDP COLONES
MILLION %
GDP TOTAL REVENUES 3,274,216.49 14.43 3,271,868.09 14.42 2,348.40 0.01
Tax 3,007,922.21 13.26 3,007,360.13 13.36 562.08 0.00 Nontax 22,210.13 0.10 20,700.32 0.09 1,509.81 0.01 Transfers 170,000.70 1.75 165,746.24 0.73 4,254.46 0.02 Capital Revenue 0.00 0.00 3,977.95 0.02 (3,977.95) (0.02) Social Contributions 74,083.45 0.33 74,083.45 0.33 0.00 0.00
TOTAL EXPENDITURE 4,227,830.56 18.64 3,934,170.78 17.34 293,659.78 1.29 Wages and Salaries 1,356,388.34 0.06 1,138,212.60 5.02 218,175.74 0.96 Soc. Sec. Contr. Expenses 10,110.12 0.04 0.00 0.00 10,110.12 0.04 Contribution to Social Security 0.00 0.00 0.00 0.00 0.00 0.00 Purchase of Goods and Services 87,843.89 0.39 280,280.94 1.24 (192,437.05) (0.85)
Interest 473,460.09 2.09 471,765.80 2.08 1,694.29 0.01 Interest 472,115.27 2.08 471,765.80 2.08 349.47 0.00 Soc. Sec. Interest - State 1,344.82 0.01 0.00 1,344.82 0.01
Transfers 2,300,028.11 10.14 2,001,144.17 0.82 298,883.94 1.32 Real Investment Capital Expenditure (19,557.57) 0.09 41,473.99 0.18 (61,031.56) (0.27)
Machinery and Equipment 16,380.18 0.07 14,625.13 0.06 1,755.04 0.01 Capital Formation (35,937.75) 0.16 26,848.85 0.12 (62,786.60) 0.28
Financial Investment 905,199.10 3.99 1,293.29 0.01 903,905.81 3.98 Purchase of Land 881,159.82 3.88 629.36 0.00 880,530.46 3.88 Purchase of Buildings 24,039.28 0.11 663.93 0.00 23,375.35 0.11 Materials and Supplies 36,290.10 0.16 0.00 0.00 36,290.10 0.16 Special Accounts 150.70 0.00 0.00 0.00 150.70 0.00
Source: DNCP and STAP
15. For purposes of reconciling the fiscal figures, the values recorded in the accounts and in the statistics were used for each of the headings. Some differences can be explained by conceptual differences, unrealized adjustments, and by the non inclusion of transactions in one or other of the dependencies that produce fiscal data. Although the amounts are not significant, the aim of the reconciliation exercise is precisely to make the necessary adjustments, agree on common criteria, and prevent greater discrepancies from appearing.
C. Integrity
Statistical independence (1.4.1)
16. The development and preparation of public sector fiscal statistics is the responsibility of a collegial unit, which uses the GFSM 1986 rules (BASIC). The Budgetary Authority is a collegial entity that has its own functions. It serves as advisor to the Office of the President of the Republic and is made up of the Minister of Finance, the Minister of Planning, and another minister appointed by the President of the Republic, currently the Minister of Labor. Taking into account the macroeconomic variables, the needs of institutions, and their strategic actions, the Budgetary Authority prepares the draft general and specific budgetary policy guidelines for the following fiscal year for the Central Government agencies, comprising the Executive Branch and its dependencies and the Decentralized Government, and State-owned enterprises. The budgetary and wage policy guidelines are examined by the Government Council and submitted to the President of the Republic for final approval. The Budgetary Authority has an executive body: the Technical Secretariat of the Budgetary
25
Authority (STAP) which is responsible for monitoring compliance with the guidelines and directives and for producing fiscal statistics. The Unit of Analysis and Fiscal Monitoring (UASF) is the agency responsible for the compilation and dissemination of fiscal statistics. It prepares and publishes: (i) a monthly, cash basis, report on central government revenue, expenditure, and financing;11 (ii) annual General Government Public Finance Statistics,12 which are sent to the IMF; and (iii) annual Consolidated Figures on Public Sector Revenue, Expenditure, and Financing. This latter publication is the statistical report with the broadest coverage in Costa Rica, and an analytical document on this report is prepared for internal use only. External audit (1.4.2)
17. The annual fiscal reports of the Executive Branch are subject to an audit performed and published by the country’s supreme audit institution, the CGR, an independent audit body. The audit adheres to the International Standards of Supreme Audit Institutions (ISSAI) 1 and 2 (GOOD). The CGR carries out its oversight work based on domestic regulations, the International Standards on Auditing (ISA), and the ISSAI issued by the International Organization of Supreme Audit Institutions (INTOSAI). All public sector entities and private entities that receive public funds are subject to oversight.13 The work of the CGR focuses on ex-ante and ex-post supervision of budgetary execution and to a limited extent on financial audits, with the recommendation that autonomous entities use external auditors. Reliability (1.4.3)
18. The CGR issues an opinion regarding the reasonableness of the financial statements, validating their reliability. However, in recent years, it has refrained from expressing an opinion on the reasonability of the accounts (BASIC). The CGR’s withholding of an opinion was based on a lack of evidence regarding sufficient and appropriate audits. The CGR identified general inconsistencies with respect to: (i) weaknesses in the regulatory framework; (ii) divergence from accounting principles; (iii) failure to apply accrual accounting; and (iv) the omission of records. There were objections regarding 13.49
11 Latest report as of February 2012 published on the MOF website.
12 Corresponding to the Yearbook.
13 Law 7428 of 1998. Organic Law of the Office of the Comptroller General of the Republic.. “Article 6.- Scope of the control of private funds and activities. As regards constitutional and legal competence, the control of private funds and activities, to which the Law refers, shall cover legal, accounting, and technical matters and, in particular, shall ensure compliance with respect to the legal use of the proceeds of financial gains or the sale of securities. The Office of the Comptroller General of the Republic shall have the right to monitor compliance by subject private beneficiaries with the basic rules of common sense, justice, and propriety with a view to avoiding abuses, irregularities, or manifest errors in the use of the gains received.

26
percent of the total recorded under assets and 2.6 percent of liabilities. In addition, many fixed assets have still not been incorporated in the accounts. There are significant inconsistencies between the records of properties in the System for Administration of State Properties (SIBINET) and those disclosed in the accounts, and it has not been possible to reconcile these differences. Table 11 lists the principal accounts and amounts specifically questioned by the CGR.
D. Recommendations
Complete the implementation of international public sector accounting standards, ensuring that accounting and budgetary classifications are harmonized.
Reconcile fiscal reports and produce timely audit reports to ensure the reliability of the information.
Table 11. Observations of the CGR on the Financial Statements of the
Executive Branch 2011
Group Observation Millions of
C
ASSETS 1,776,981 Financial Unsupported accounts receivable 259 Posted amounts that correspond to another account 1,540,443 Accruals corresponding to the year 2012 and later years 1,266 Incorporation of accounts with a high degree of irrecoverability 24,736 Recording of securities provided as collateral 10,068 Goods recorded as assets and liabilities 30,767 Provisions inadequately calculated 1,473 Nonfinancial Assets not incorporated 4,621 Assets without legal support 42,354 Inconsistencies between records in accounts and the SIBINET 106,917 Overvaluation in the updating of assets 14,061 Other 16
LIABILITIES 205,989
Discrepancies between accounting and the primary source 2,320 Balances that cannot be verified 13,072 Accounts incorrectly classified 15,174 Unrecorded amortization and interest on the debt 3,524 Premiums and discounts on securities without cause 9,404 Items not reclassified from long to short term 162,494

27
E. Conclusion
Table 12. Summary of the Evaluation of Fiscal Report Practices
Item DIMENSION PRINCIPLE EVALUATION 1
Presentation of fiscal reports
Fiscal reports should provide a complete general overview that is relevant, timely, and reliable with respect to the government’s financial position, as well as its
financial performance. 1.1 Coverage Fiscal reports should provide an exhaustive general overview of the government’s
fiscal activities
1.1.1 Coverage of Institutions
Fiscal reports cover all entities engaged in public activity that are delineated according to international standards.
Each year fiscal statistics at the budgetary execution level consolidate 225 out of 229 public sector entities (99.7 percent of total expenditure) and are widely available to the public (ADVANCED).
1.1.2 Coverage of revenues, expenditures, and other flows
Fiscal reports cover all government revenues, expenditures, and financing.
Fiscal reports cover 99.7percent of all public sector revenues and expenditures on a cash accounting basis (BASIC).
1.1.3 Coverage of assets and liabilities
Fiscal reports include a balance sheet of government assets, liabilities, and net worth.
Fiscal reports cover all financial assets and liabilities of the nonfinancial public sector (GOOD).
1.1.4 Tax expenditure The government regularly discloses all revenue loss from tax expenditure.
Tax expenditures are authorized by law; revenue losses are estimated by type of tax and are usually published annually as part of the budget documents (GOOD).
1.2 Frequency and timeliness Fiscal reports should be published on a frequent and timely basis
1.2.1 Frequency of in-year fiscal reports
In-year fiscal reports are published on a frequent and regular basis.
Since 2010, fiscal reports on the Executive Branch’s budget execution have been published monthly and the consolidated public sector annualy (ADVANCED).
1.2.2 Timeliness of annual financial statements
Final year-end financial statements are published in a timely manner.
The annual financial statements of the Executive Branch are published on March 1 of the following year (ADVANCED) but they are audited 12 months after the end of the fiscal year (BASIC).
1.3 Quality The information in fiscal reports should be relevant, internationally comparable, and internally and historically consistent
1.3.1 Classification Fiscal reports classify information in ways that the government’s use of public resources, and facilitates international comparisons.
Fiscal reports include an institutional and economic classification that partially coincides with international standards that report budgetary revenues and expenditures separately and include information on all revenue sources (BASIC).

28
Table 12. Summary of the Evaluation of Fiscal Report Practices (concluded)
Item DIMENSION PRINCIPLE EVALUATION 1.3.2 Internal
consistency Fiscal reports are internally consistent and include reconciliations between alternative measures of summary fiscal aggregates.
Fiscal reports do not include reconciliation of either aggregate flows or aggregate stocks (LESS THAN BASIC).
1.3.3 Historical consistency
Material revisions to historical fiscal data in fiscal reports are disclosed and explained.
Historical fiscal data have not been subject to material revisions but have been affected by methodological changes (ADVANCED).
1.3.4 Comparability of fiscal reports
Fiscal forecasts, budgets, and fiscal reports are presented on a comparable basis, with any deviations explained.
The MOF’s monthly budgetary execution report is directly comparable to the budget. However, fiscal reports at broader levels are not readily comparable given the complexity of the sectorization of the public sector (BASIC).
1.4 Reliability Fiscal reports should be reliable and subject to external scrutiny
1.4.1 Statistical independence
Responsibility for preparing and disseminating fiscal statistics is vested in a specific body that is independent and ensures consistency with international statistical standards.
The development and preparation of public sector fiscal statistics is the responsibility of a collegial unit, which uses the GFSM 1986 rules (BASIC).
1.4.2 External audit Government’s annual financial statements are audited by the supreme audit institution and an audit opinion issued according to international audit standards.
The annual fiscal reports of the Executive Branch are subject to an audit performed and published by the country’s supreme audit institution, the CGR, an independent audit body. The audit adheres to the International Standards of Supreme Audit Institutions (ISSAI) 1 and 2 (GOOD).
1.4.3 Reliability The reliability of the government’s fiscal reports is confirmed by an independent assessment.
The CGR issues an opinion regarding the reasonableness of the financial statements, validating their reliability. However, in recent years, it has refrained from expressing an opinion on the reasonability of the accounts (BASIC).

29
II. FISCAL FORECASTING AND BUDGETING
A. Introduction
Table 13. List of Budget Documents
Report Area Responsible Content PND – National Development Plan (4 years)
MIDEPLAN – Ministry of Planning
Government’s priorities, national objectives and goals, and strategies for achieving them.
Budget law MOF – General Directorate of the National Budget
Amounts budgeted by institution, programs, functional and economic classification, and source of financing.
Medium-Term Budgetary Framework
MOF - General Directorate of the National Budget
Overview of prior year’s fiscal policy, policy actions, projected deficits and debt for the next four years
Presentation of the Budget
MOF - General Directorate of the National Budget
Summary of budgetary framework, breakdown of revenue and expenditure projections.
Technical report: draft law
CGR – Office of the Comptroller General of the Republic
Evaluation of fiscal projections in the proposal sent to the Assembly, debt situation and linkage with National Development Plan.
Public sector budgets: situation and outlooks
CGR – Office of the Comptroller General of the Republic
Calculation of fiscal flows, revenues, and expenditures of consolidated public sector budgets and evaluation of the most important decentralized entities.
Executive Branch Budgetary Management Monitoring Report
MOF - General Directorate of the National Budget
Weekly report providing an analysis of budget execution by the Executive Branch and the main difficulties faced in executing the budget.
B. Comprehensiveness
Unity (2.1.1)
19. Budgetary legislation is fragmented. Budgetary Central Government revenues and expenditures are approved by the Legislative Assembly, while the revenues and expenditures of entities attached to ministries, decentralized entities, financial and nonfinancial public corporations, the central bank, municipalities, and social security are approved by the CGR (LESS THAN BASIC). The approval of budgets in Costa Rica is dual: the part approved by the Legislative Assembly includes the Office of the President, the Ministries, and the branches of government, and the other entities have their own budgets (Box 1). The budget sent to the Assembly includes total indebtedness of the budgetary central government, while the budgets of other entities record their debts to the banking system. External debt is approved by the Assembly during the year and constitutes the extraordinary budget, which is also sent to the Assembly for revalidation. In 2011, the budgetary central government accounted for close to 41 percent of expenditures, representing 27 out of a total of 229 entities. The remaining 198 budgets were approved by the CGR. Only four

30
superintendencies did not have their budgets approved by either the Assembly or the CGR. Figure 6 shows budgetary institutional coverage in 2011.
Figure 6. 2011 Budgetary Execution: Institutional Coverage
Box 1. Costa Rica’s Dual Budgetary System
Costa Rica’s dual budgetary system dates back to the effects of reforms in 1948 in the wake of the political and social disturbances caused by the civil war. The previous budgetary system was considered overly centralized, with broad powers concentrated in the Office of the President of the Republic. The Political Constitution approved in 1949 abolished the army, created the Supreme Elections Tribunal, eliminated the reelection of representatives, and reduced the powers of the Executive Branch, the objective being to maintain political stability. In addition, the system of autonomous institutions, the Office of the Comptroller General of the Republic (CGR), and the Civil Service were established. The banking system was nationalized and public corporations were given institutional and budgetary autonomy with the aim of professionalizing management and reducing partisan interference. The Constitution gave responsibility for approving the budgets of autonomous entities to the CGR. Currently, the Executive Branch has limited influence over matters within the jurisdiction of those entities and the policy of expanding budgetary autonomy continues. State universities, municipalities, the Costa Rican Social Security Fund (CCSS), public banks, non-state public entities, corporations with minority public sector participation, private entities that receive public funds, the National Insurance Institute (INS), the Costa Rican Electricity Institute (ICE), and other public corporations have been excluded from the central government’s budget since 2001. In 2011, the budgets of the autonomous entities represented more than 58 percent of public sector expenditure.
Budgetary Central
Government, 27
Deconcentrated Agencies, 53
Non-enterprise Dec. Institutions,
30
Local Governments, 87
Non Financial Public
Enterprises, 15
Financial Public Instit., 13
Superintendencies (non
consolidated), 4

31
Gross budgeting (2.1.2) 20. All domestic and external revenues, except for tax refunds and exemptions, and related expenses are presented in gross terms (ADVANCED). The recording of revenues takes into account gross values net of refunds and exemptions. The amount of tax expenditures is significant and is estimated to be 5.76 percent of GDP in 2012. Expenses and financing are recorded in gross terms. Macroeconomic forecasts (2.1.3) 21. The Central Bank of Costa Rica (BCCR) prepares the macroeconomic program in the first quarter in which the projections of the key macroeconomic variables are published and also reports on the assumptions supporting those variables (GOOD). The most important variables projected by the BCCR for budgetary purposes are gross domestic product (GDP) and the inflation rate measured on the basis of changes in the consumer price index (CPI). The outcomes of these forecasts are related to other variables ranging from development of the international economy (primarily Costa Rica’s most important trade partners), the exchange rate, monetary aggregates, the fiscal deficit, and other factors. The deviations in these projections compared to those developed by international organizations are insignificant, particularly the GDP growth rate and inflation (2014 and 2015), which could be considered normal in this type of exercise. It should be noted that in the case of the inflation rate projection, the BCCR assumes that it will achieve its inflation goal (5% +/- 1 pp); thus it is assumed that this rate would be equal to 5 percent between 2013 and 2015.
Table 14. Projections of Real GDP and the Inflation Rate 1/
Institution 2013 2014 2015
BCCR
GDP 4.3 4.0 4.0
Inflation rate 5.0 5.0 6.0
IMF
GDP 5.0 4.2 4.4
Inflation rate 4.6 5.0 5.0
Source: IMF, MOF, and BCCR. 1/ International Monetary Fund (IMF): Article IV Consultation for 2012, February 2013, page 28. Ministry of Finance and the BCCR: Medium-Term Budgetary Fiscal Framework 2012–16, August 2012, page 9.
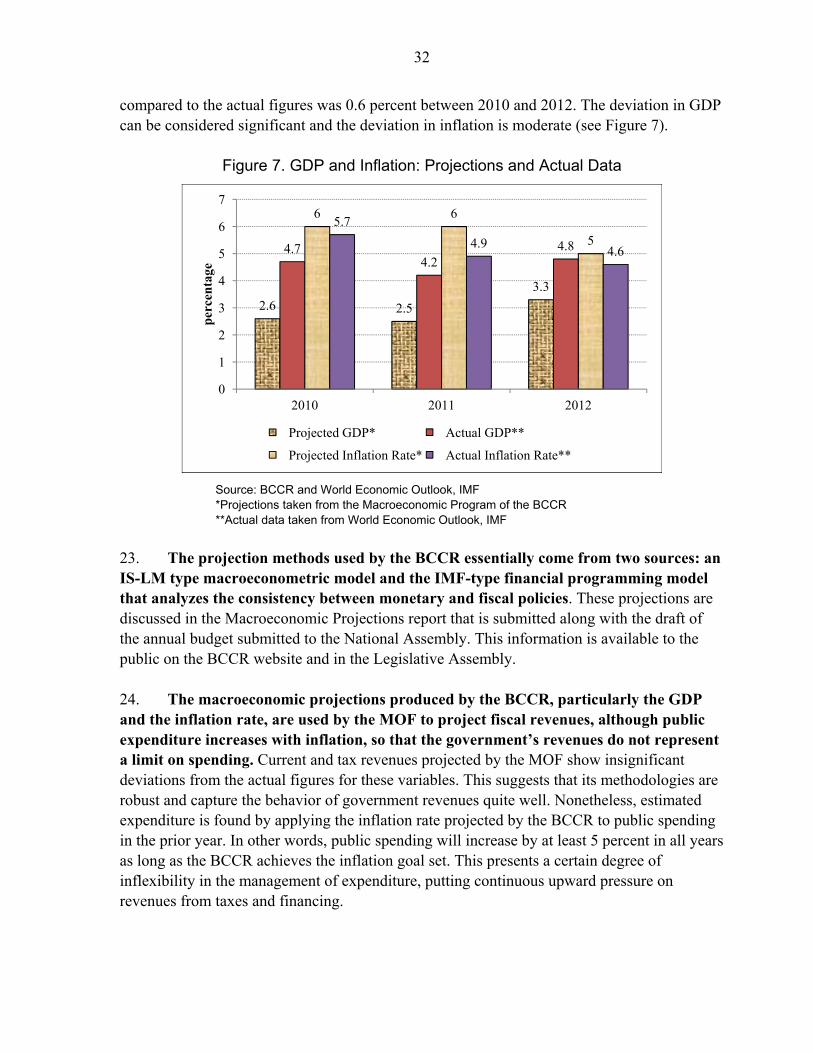
22. When actual data are compared to projected data, as was done during the period 2010–12, projected inflation was greater than actual inflation and, similarly, projected GDP was always less than actual GDP. The GDP growth rate showed an average deviation of 1.8 percent during this period. As for inflation, the average deviation in the projections
32
compared to the actual figures was 0.6 percent between 2010 and 2012. The deviation in GDP can be considered significant and the deviation in inflation is moderate (see Figure 7).
Figure 7. GDP and Inflation: Projections and Actual Data
Source: BCCR and World Economic Outlook, IMF *Projections taken from the Macroeconomic Program of the BCCR **Actual data taken from World Economic Outlook, IMF
23. The projection methods used by the BCCR essentially come from two sources: an IS-LM type macroeconometric model and the IMF-type financial programming model that analyzes the consistency between monetary and fiscal policies. These projections are discussed in the Macroeconomic Projections report that is submitted along with the draft of the annual budget submitted to the National Assembly. This information is available to the public on the BCCR website and in the Legislative Assembly. 24. The macroeconomic projections produced by the BCCR, particularly the GDP and the inflation rate, are used by the MOF to project fiscal revenues, although public expenditure increases with inflation, so that the government’s revenues do not represent a limit on spending. Current and tax revenues projected by the MOF show insignificant deviations from the actual figures for these variables. This suggests that its methodologies are robust and capture the behavior of government revenues quite well. Nonetheless, estimated expenditure is found by applying the inflation rate projected by the BCCR to public spending in the prior year. In other words, public spending will increase by at least 5 percent in all years as long as the BCCR achieves the inflation goal set. This presents a certain degree of inflexibility in the management of expenditure, putting continuous upward pressure on revenues from taxes and financing.
2.6 2.5
3.3
4.74.2
4.8
6 6
5
5.7
4.94.6
0
1
2
3
4
5
6
7
2010 2011 2012
per
cen
tage
Projected GDP* Actual GDP**
Projected Inflation Rate* Actual Inflation Rate**
33
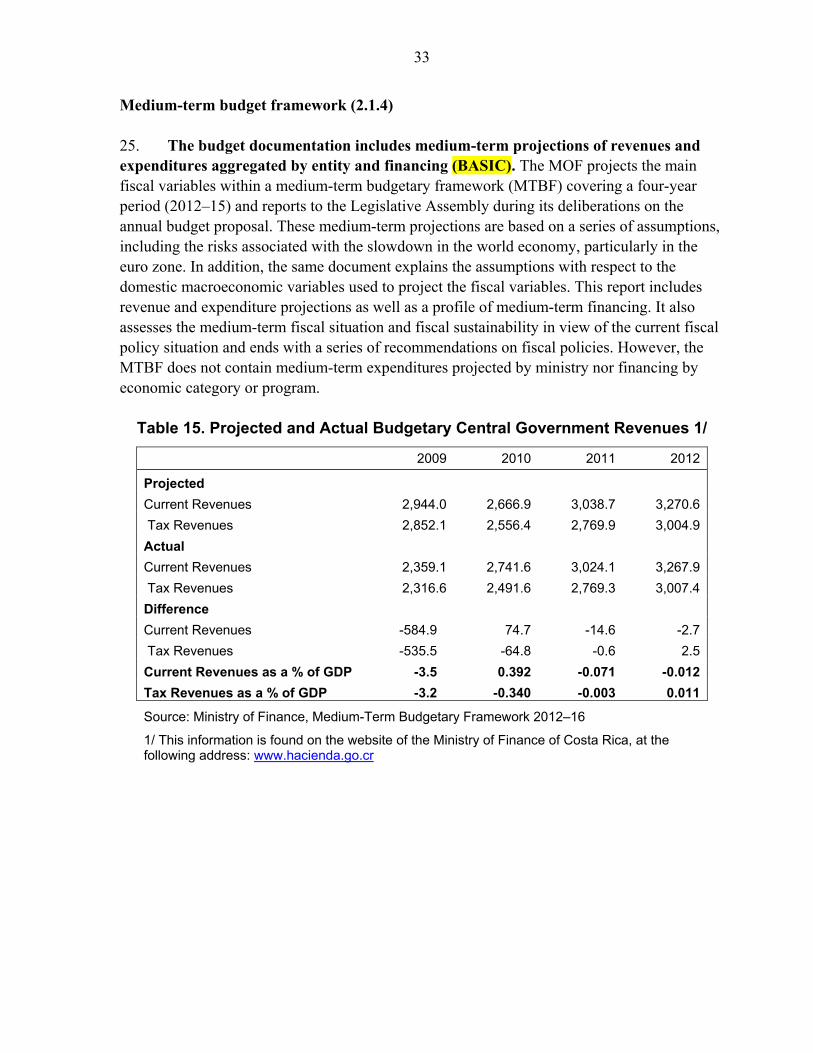
Medium-term budget framework (2.1.4) 25. The budget documentation includes medium-term projections of revenues and expenditures aggregated by entity and financing (BASIC). The MOF projects the main fiscal variables within a medium-term budgetary framework (MTBF) covering a four-year period (2012–15) and reports to the Legislative Assembly during its deliberations on the annual budget proposal. These medium-term projections are based on a series of assumptions, including the risks associated with the slowdown in the world economy, particularly in the euro zone. In addition, the same document explains the assumptions with respect to the domestic macroeconomic variables used to project the fiscal variables. This report includes revenue and expenditure projections as well as a profile of medium-term financing. It also assesses the medium-term fiscal situation and fiscal sustainability in view of the current fiscal policy situation and ends with a series of recommendations on fiscal policies. However, the MTBF does not contain medium-term expenditures projected by ministry nor financing by economic category or program.
Table 15. Projected and Actual Budgetary Central Government Revenues 1/
2009 2010 2011 2012
Projected
Current Revenues 2,944.0 2,666.9 3,038.7 3,270.6
Tax Revenues 2,852.1 2,556.4 2,769.9 3,004.9
Actual
Current Revenues 2,359.1 2,741.6 3,024.1 3,267.9
Tax Revenues 2,316.6 2,491.6 2,769.3 3,007.4
Difference
Current Revenues -584.9 74.7 -14.6 -2.7
Tax Revenues -535.5 -64.8 -0.6 2.5
Current Revenues as a % of GDP -3.5 0.392 -0.071 -0.012
Tax Revenues as a % of GDP -3.2 -0.340 -0.003 0.011
Source: Ministry of Finance, Medium-Term Budgetary Framework 2012–16
1/ This information is found on the website of the Ministry of Finance of Costa Rica, at the following address: www.hacienda.go.cr

34
C. Timeliness
Fiscal strategy report (2.2.1) 26. At mid-year, the MOF prepares and publishes an Executive Branch Budgetary Management Monitoring Report, which it sends to the Legislative Assembly for information purposes (BASIC). However, it does not produce a revision of the macroeconomic and fiscal framework for the year in progress (LESS THAN BASIC). This report provides information on actual budget execution by the Executive Branch over the first six months of the year on the basis of the budget. It also reports on the status of public debt and provides a series of indicators for evaluating budgetary management. This mid-year evaluation is considered one of the responsibilities assigned to the MOF, under Law 8131, Articles 55, 56 and amended Articles 73 and 74. 27. This budgetary execution report emphasizes the level of budgetary execution achieved during the first half of the year and secondarily analyzes the execution of institutions that use public debt to finance their projects. However, it does not present the execution of tax collections and with reference to the debt states only that 84 percent of the debt is of domestic origin. Each institution has a number of operational and strategic indicators related to the priorities defined by the government. The level of compliance with the institutional indicators is reported, but no details are provided on efficiency and effectiveness in the use of funds to achieve the proposed goals. In addition, this report assesses macroeconomic and fiscal projections for the next six months but does not provide revisions of the medium-term fiscal projections. Budget submission (2.2.2) 28. The budget is published and submitted to the Assembly and the CGR four months prior to the beginning of the year (ADVANCED). The government sends the proposal to the Assembly on September 1. The Assembly must approve it by November 29 and forward it to the Executive Branch for sanction. Information relating to other entities’ proposals is included in the CGR data system by August 30 and approved by the CGR by December 31. Budgetary ceilings for Ministries and Branches of Government are set by the Directorate General of the National Budget. Budget approval (2.2.3) 29. The budget law of the budgetary central government is approved and published by one month before the beginning of the year and the other entities’ budgets are approved and published by the end of the year (GOOD). The budget proposal sent by the Executive to the Assembly is approved by November 29 while the CGR approves the other budgets by December 31. There is strict compliance with these deadlines and no delays have

35
been recorded in recent decades. If submission does not occur by the date defined by the CGR, the budget from the preceding year is applied for the entities with budgetary autonomy.
Table 16. Time Elapsed between Submission and Approval of Annual Budget
Dates Approval by the Legislative Assembly Approval by the Office of the Comptroller General of the
Republic March 30 April 15 April June 15 August 30 September 1 November 29 December 31
Publication by Executive Order of general budgetary policy guidelines for the public sector. Communication of expenditure ceilings. Technical and methodological guidelines for formulation. Receipt of drafts from government agencies. Submission of budget to the Legislative Assembly. Approval of budget in the Assembly and forwarding to the Executive for approval.
Disclosure to entities of expenditure ceilings defined by the budgetary authority. Receipt of budget proposals Approval of budget proposals.
D. Policy Orientation
Fiscal policy objectives (2.3.1) 30. The government neither declares nor reports targets for the main fiscal aggregates (LESS THAN BASIC). This is due to a significant degree of inertia and legally mandated pre-allocations that deprive the Executive Branch of full power to formulate fiscal and budgetary policy. In the Medium-Term Budgetary Framework document that accompanies the proposal sent to the Assembly, the government presents a consolidated table of revenues, expenditures, primary and overall balances for the previous year and the next four years, as well as a debt sustainability analysis, reflecting the fiscal situation of the budgetary central government. Fiscal projections are based on an expenditure ceiling, which is defined on the basis of estimated revenues. Some 44 percent of total expenditure is associated with legal obligations and some 52 percent is practically unavoidable, as in the case of expenditures for wages, interest, and pensions. The remaining expenditures are subject to a percentage increase based on expected inflation.
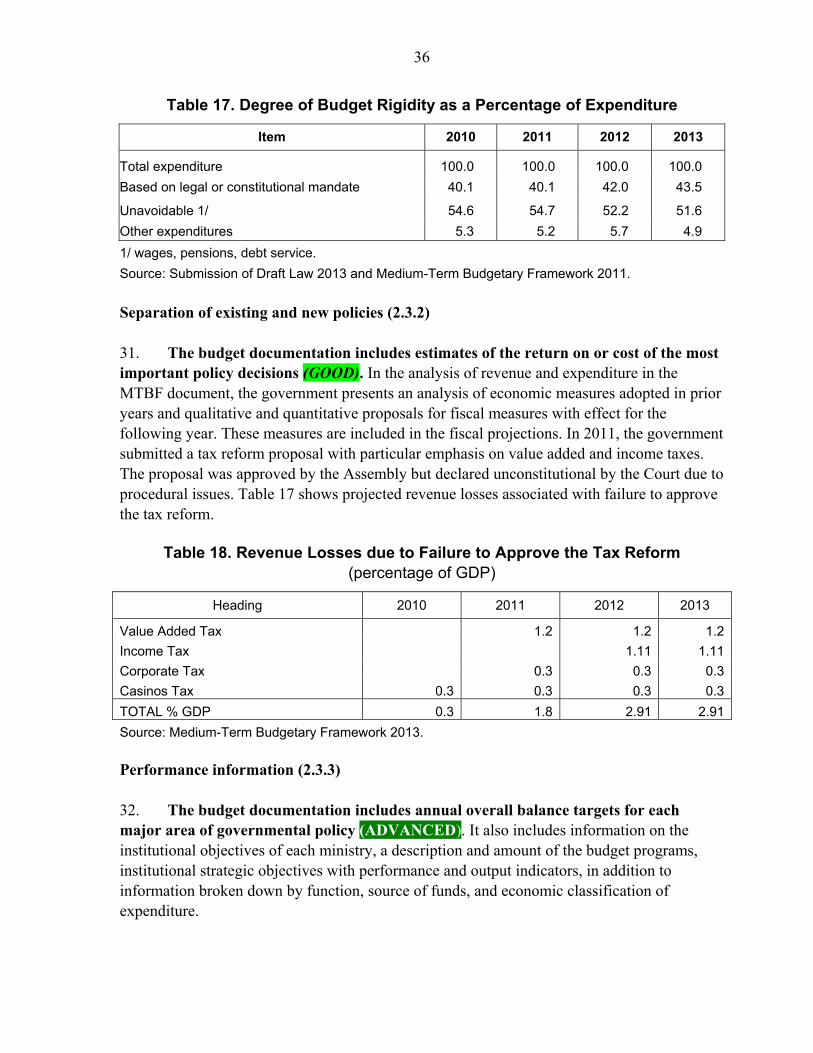
36
Table 17. Degree of Budget Rigidity as a Percentage of Expenditure
Item 2010 2011 2012 2013
Total expenditure 100.0 100.0 100.0 100.0
Based on legal or constitutional mandate 40.1 40.1 42.0 43.5
Unavoidable 1/ 54.6 54.7 52.2 51.6
Other expenditures 5.3 5.2 5.7 4.9
1/ wages, pensions, debt service.
Source: Submission of Draft Law 2013 and Medium-Term Budgetary Framework 2011.
Separation of existing and new policies (2.3.2) 31. The budget documentation includes estimates of the return on or cost of the most important policy decisions (GOOD). In the analysis of revenue and expenditure in the MTBF document, the government presents an analysis of economic measures adopted in prior years and qualitative and quantitative proposals for fiscal measures with effect for the following year. These measures are included in the fiscal projections. In 2011, the government submitted a tax reform proposal with particular emphasis on value added and income taxes. The proposal was approved by the Assembly but declared unconstitutional by the Court due to procedural issues. Table 17 shows projected revenue losses associated with failure to approve the tax reform.
Table 18. Revenue Losses due to Failure to Approve the Tax Reform (percentage of GDP)
Heading 2010 2011 2012 2013
Value Added Tax 1.2 1.2 1.2
Income Tax 1.11 1.11
Corporate Tax 0.3 0.3 0.3
Casinos Tax 0.3 0.3 0.3 0.3
TOTAL % GDP 0.3 1.8 2.91 2.91
Source: Medium-Term Budgetary Framework 2013.
Performance information (2.3.3) 32. The budget documentation includes annual overall balance targets for each major area of governmental policy (ADVANCED). It also includes information on the institutional objectives of each ministry, a description and amount of the budget programs, institutional strategic objectives with performance and output indicators, in addition to information broken down by function, source of funds, and economic classification of expenditure.

37
33. The Ministry of National Planning (MIDEPLAN) prepares the PND and sends it to the Assembly on March 1 of the year following the start of the presidential term. The PND contains strategic actions, targets, and goals for four years, overall costs for the entire period, and identification of the executing entity. The PND covers all segments of the public sector. The PND is monitored every six months, at the end of which a report and an assessment are delivered to the Government Council. Achievement of the previous year’s goals is evaluated in March of each year in accordance with sectoral programming and progress in meeting the proposed goals is evaluated every two years. An annual evaluation report is sent to the municipal councils and published on the web. 34. Linkages between resource allocations and achievement of the PND goals are not presented for all programs in the draft budgets. In some instances, program concepts, goals, and indicators are unclear or not uniformly applied. Table 19 shows an example of the allocation of funds under the 2013 budget to the principal goals of the PND for the education sector. In this example, there are no performance indicators linked to strategic actions, but rather for medium-term goals. In addition, there are no annual physical goals.
Table 19. Funds Allocated to Relevant Goals of the 2011–14 PND for the Education Sector
Strategic Action
2011-2014 Goal
2013 Funds Billions of colones
Evaluation of the improvement in the quality of education
Implementation of the National System for Quality in Education - % of educational centers - Increase in gross rate of enrollment in diversified
secondary education of 85% by 2014
2.2
Plan for improving infrastructure and
equipment
Actual investment in construction projects: 90.3 billion colones Actual investment in land purchases: 19.9 billion colones Actual investment in furnishings: 6.9 billion colones
30.5
5.3
1.6 Reduction of inequities in
effective access to the right to education
Increase to 623,000 the number of students with food service Grant 175,000 scholarships to students with limited resources Increase to 96,000 the number of beneficiaries of free transportation
57.1
20.0
23.9
Source: Prepared by the CGR based on 2011–14 PND and the Draft National Budget.

38
Distributional analysis (2.3.4) 35. The government provides detailed information to the public on progress in achieving goals (BASIC). The Annual PND Goals Achievement Report published in March of each year presents detailed information on progress made toward goals in the preceding year. The CGR provides a page on its website for consultation by the public regarding the development of public sector budgets by institution, programs and goals, revenues and detailed expenditures. The MOF, each of the sectoral ministries, and the CGR appear before the Legislative Assembly to explain the proposed budget. Executive Branch authorities appear before the sectoral committees when called. The evaluation reports of the MOF have ample potential for improvement with respect to the principle of transparency. However, the information available is not easily understood by the public or Assembly delegates. Figure 8 shows aggregate information on the number of goals with satisfactory progress by sector.
Figure 8. Sectors Benefited by Number of Goals with Satisfactory Progress— 2011 PND
Source: MIDEPLAN, Annual Report on Achievement of PND Goals
Fiscal sustainability analysis (2.3.5)
36. Fiscal projections are published and cover a five-year horizon (LESS THAN BASIC). In 2012, the BCCR prepared and disseminated a study on fiscal sustainability. It considered a variety of shocks such as interest rate shock, exchange rate depreciation, and the municipalities’ indebtedness. The MOF does not have publications with projections of the main fiscal variables using multiple scenarios and time horizons of ten or more years. Similarly, there are no MOF studies with scenarios projecting fiscal variables that include variables such as social security, population changes or changes in natural resources, along
productive sector 34
labor 24
education 23
environment, energy, telecom
21foreign trade 12
citizen security 11
social well-being 10
health 9
housing 9
others 47

39
with a detailed discussion of assumptions on trends in macroeconomic and fiscal variables over 30 years. 37. The MOF has published studies on the trends in public debt. However, it does not specify the objectives of the budget policy that could seek, for example, stabilizing the long-term public debt and, thus, the government’s budget balance. In fact, this same document maintains that the current public debt profile is not sustainable over the long term. It also suggests14 that debt may continue to grow without experiencing sustainability problems until it reaches 60 percent of GDP. However, the fiscal policies that would maintain the sustainability of the current debt profile are not established, considering the primary balance as an effort to halt growth in and stabilize the public debt.15
Figure 9. Long-Term Profile of Costa Rican Public Debt
Source: MOF, Annual report on the status of Costa Rica’s domestic and foreign public debt, p. 77.
14 There is an analysis of the sustainability of Costa Rican debt (Oviedo, 2007) that establishes that the debt is sustainable until it reaches 60 percent of GDP.
15 In 2009, the debt/GDP ratio was 24 percent. It reached 43 percent in 2012 and is projected to reach 50 percent in 2013, suggesting that fiscal policy follows an upward trend.
25
34
41.07
24.74
34
41
43.91
20
25
30
35
40
45
50
1992 1994 1996 1998 2000 2002 2004 2006 2008 2010 2012 2014 2016
De
bt/
GD
P, a
s a
%

40
E. Credibility
Independent evaluation (2.4.1)
38. The CGR, an independent entity, evaluates the credibility of the government’s economic forecast and proposes changes in the revenue projections as it deems necessary (ADVANCED). As part of its responsibilities under Article 37-1 of Law No. 7428, the CGR must provide the Legislative Assembly with ongoing studies on the fiscal efficacy of estimated current revenues. The CGR discusses revenue projections with each entity. However, no reports are published to explain deviations from projected revenues. In addition, the Budgetary Authority (AP)16 is responsible for designing the government’s general and specific budgetary policy, with which the agencies of the Budgetary Central Government must comply during the following year. The Budgetary Authority has a Technical Secretariat (STAP), which serves as its executive body. Its legal powers include examining the budget documents submitted by the deconcentrated entities and agencies to verify compliance with budgetary policy directives and guidelines as well as monitoring execution of budget spending by the central government, and making estimates based on the examination of the historical behavior of the principal headings. Neither the CGR nor the AP publishes reports analyzing the behavior of the fiscal projections for either revenues or expenditures. Supplementary budget (2.4.2) 39. A supplementary budget, which should not affect the overall budget, is required before executing sectoral budgetary expenditures (GOOD). Changes affecting the Budgetary Central Government’s revenues and debt must be approved by the Legislative Assembly during the year and constitute extraordinary budgets. The law prohibits changes to finance current expenditures with capital revenues and to increase current spending by reducing capital expenditures. There are no significant changes to the budget of the Budgetary Central Government in comparison with the amounts initially approved. In 2011, actual expenditure diverged from budgeted expenditure by 4 percent. 40. During the year, Executive Branch decrees may authorize: (i) item transfers between subprograms within the same program, without changing the total amount; (ii) revalidation of programs to be executed with external debt, as approved by the Assembly in prior years; and (iii) expenses for non accrued commitments (obligations not paid in the previous year) that
16 On October 18, 1982, the Budgetary Authority was created by Law 6821, on September 4, 2001, Law 8131was promulgated, abolishing Law 6821 and stating that the Budgetary Authority (AP) shall be a Collegial Body responsible for advising the President of the Republic on budgetary policy. The AP is a body with a collegial management style, comprising the Minister of Finance (who shall be the Chair), the Minister of Planning, and a minister appointed by the President of the Republic.

41
compete with the amount authorized for the following year. Most adjustments relate to internal changes approved by decree (Figure 10).
Table 20. Changes in the Annual Budget Billions of colones
2009 2010 2011
Description Law Change Law Law Change Law Law Change Law
% % %
Total expenditure 4,125 185 4.5 4,720 206 4.4 5,485 228 4.1
- revenues 2,950 -278 -9.4 2,804 6 0.2 3,039 1 0.0
- domestic debt 1,154 446 38.6 1,915 98 5 2,446 0 0.0
- external debt 21 17 81.0 0 102 0 227
Source: Annual Report of CGR, various years, Table 2.1.
Figure 10. Number of Legal Documents Needed to Amend Budget
Source: MOF, www.hacienda.go.cr.
Forecast reconciliation (2.4.3) 41. No successive versions are prepared of the government’s revenue, expenditure, and financing forecasts (LESS THAN BASIC). The draft annual budget17 has a section that
17 Ministry of Finance: “Submission of the Draft Law of the Ordinary and Extraordinary Budget of the Republic,
(continued)
0
5
10
15
20
25
30
35
40
45
2009 2010 2011 2012
Executive Decrees Extraordinary Laws

42
evaluates the behavior of revenue, expenditure, and financing but does not explain material discrepancies in the projections for them. Nonetheless, reference is made to the discrepancies in the revenue certifications done by the CGR although, as mentioned above, these certifications do not point out material differences in the fiscal projections. This document describes the behavior of total public revenues, by source, during the previous year for purposes of illustration for the Legislative Assembly. The amount of budget expenditure and financing is also detailed. It should be emphasized that the presentation of the draft budget for 2013 evaluated the national and international factors that could affect fiscal collections, expenditure, and financing, as well as the behavior of the macroeconomic variables. However, this information was not used as input to explain discrepancies in fiscal projections. Finally, this document does not detail changes in fiscal policy and their effects on the macroeconomic variables. Thus, the identification of material differences in the fiscal projections is not reconciled.
Table 21. Projected and Actual Revenue, Expenditure, and Financing As a percent of GDP
Item 2010 2011 2012
Projected
Total Revenues 14.8 16.3 17.5
Total Expenditures 19.8 20.0 20.3
Financing 4.9 3.8 2.8
Actual
Total Revenues 13.6 13.5 13.5
Total Expenditures* 25.1 23.7 23.7
Interest 2.3 2.5 2.5
Financing 5.0 3.7 3.7
Source: Medium-Term Budgetary Framework,
2009-2013, p. 39
*Excluding interest
F. Recommendations
Prepare budget reports with analysis of situation and outlooks by the end of the year for the public sector, with the following periodicity: (i) approved budget report by the end of January; (ii) quarterly execution report by 30 days after the end of the quarter; (iii) annual consolidated execution by April 1 of the following year.
Amend the Constitution to make the Legislative Assembly responsible for approving the budget for the entire public sector.
for Fiscal year 2013,” San José, 2012.

43
In the medium-term budgetary framework (MTBF) document, the government should summarize macroeconomic and fiscal developments since the last budget and a revised macroeconomic and fiscal framework for the year in progress over the medium term. The MTBF should accurately state the numerical targets for the main fiscal aggregates over time and the medium term.
Establish direct linkage between National Development Plan programs and the budget. Adjustments include: standardization of concepts, programmatic structures, and performance indicators; identification of priority programs; improved performance evaluations to measure the results of policies.
In the report on the Situation of the Debt, the analysis of debt trends should be expanded by describing multiple scenarios for evaluating the main fiscal aggregates and including social security with a minimum of ten years and publish debt information on the consolidated public sector.
G. Conclusions
Table 22. Summary Evaluation of Fiscal Projection and Budgeting Practices
Item DIMENSION PRINCIPLE EVALUATION
2 Development of fiscal projections and budgets
Fiscal projections and budgets must clearly provide the objectives and intentions of central government policies as well as exhaustive, timely, and
credible projections regarding the development of public finances
2.1 Scope Fiscal forecasts and budgets must provide an exhaustive general overview of fiscal outlooks
2.1.1 Unity Revenues, expenditures, and financing of the central government are authorized by the legislature.
Budgetary legislation is fragmented. Budgetary Central Government revenues and expenditures are approved by the Legislative Assembly, while the revenues and expenditures of the entities attached to ministries, decentralized entities, financial and nonfinancial public enterprises, the central bank, municipalities, and social security are approved by the CGR (LESS THAN BASIC).
2.1.2 Gross budgeting
Revenues and expenditures are presented on a gross basis in budget documentation.
All domestic and external revenues, except for tax refunds and exemptions, and related expenses are presented in gross terms (ADVANCED).
2.1.3 Macroeconomic forecasts
The macroeconomic forecasts on which the budget projections are based are disclosed and explained.
The Central Bank of Costa Rica (BCCR) prepares the macroeconomic program in the first quarter in which the projections of the key macroeconomic variables are published and also reports on the assumptions supporting those variables (GOOD).
2.1.4 Medium-term budget framework
Budget documentation includes projections of revenues, expenditures, and financing over the medium-term.
The budget documentation includes medium-term projections of revenues and expenditures aggregated by entity and financing (BASIC).

44
Table 22. Summary Evaluation of Fiscal Projection and Budgeting Practices (continued)
Item DIMENSION PRINCIPLE EVALUATION
2.2 Timeliness The government should provide timely updates on fiscal outlooks
2.2.1 Fiscal Strategy Report
The government provides a mid-year report summarizing macroeconomic and fiscal developments since the last budget and the macroeconomic and fiscal forecasts for the preparation of the upcoming budget.
At mid-year, the MOF prepares and publishes an Executive Branch Budgetary Management Monitoring Report, which it sends to the Legislative Assembly for information (BASIC). However, it does not produce a revision of the macroeconomic and fiscal framework for the year in progress (LESS THAN BASIC).
2.2.2 Budget submission The legislature and the public are consistently given adequate time to scrutinize and approve the annual budget before the start of the financial year.
The budget is published and submitted to the Legislative Assembly and the CGR four months prior to the beginning of the year (ADVANCED).
2.2.3 Budget approval The approval and publication of the budget consistently provides adequate time for its effective execution.
The budget law of the budgetary central government is approved and published by one month before the beginning of the year and the other entities’ budgets are approved and published by the end of the year (GOOD).
2.3 Policy Guidance Fiscal forecasts and budgets must be presented so as to facilitate analysis of policies and accountability
2.3.1 Fiscal policy objectives
The government states and reports on clear and measurable objectives for the public finances.
The government neither declares nor reports objectives for the main fiscal aggregates (LESS THAN BASIC).
2.3.2 Separation of existing and new policies
The fiscal forecasts and budget documentation distinguishes the yield of cost of existing policies from the fiscal impact of any new policy measures.
The budget documentation includes estimates on the return on or cost of the most important policy decisions (GOOD).
2.3.3 Performance information
Budget documentation provides information regarding the objectives and results achieved and intended under each major government policy area.
The budget documentation includes annual results targets for each major area of governmental policy. (ADVANCED).
2.3.4 Distributional analysis
Government provides a clear, accessible, and useful summary of the financial implications of its major policies for citizens.
The government provides detailed information to citizens on progress toward achieving goals (BASIC).
2.3.5 Fiscal sustainability analysis
The government regularly publishes the projected evolution of the public finances over the long-term.
Fiscal projections are published and cover a five-year time horizon (LESS THAN BASIC).
2.4 Credibility Fiscal forecasts and budgets must be credible
2.4.1 Independent evaluation
The government’s fiscal forecasts are subject to independent evaluation, where available.
The CGR, an independent entity, evaluates the credibility of the government’s economic forecasts and proposes changes in the revenue and expenditure projections (ADVANCED).

45
Table 22. Summary Evaluation of Fiscal Projection and Budgeting Practices (concluded)
Item DIMENSION PRINCIPLE EVALUATION
2.4.2 Supplementary budget
Any material changes to the approved budget are authorized by the legislature.
A supplemental budget is required before executing sectoral budgetary expenditures that should not affect the total budget (GOOD).
2.4.3 Forecast reconciliation
Budget documentation and any subsequent updates explain any material changes to the government’s previous revenues, expenditures, and financing forecasts.
Differences between successive versions of the government’s revenue, expenditure, and financing forecasts are not indicated at the aggregate level (LESS THAN BASIC).
III. FISCAL RISK ANALYSIS AND MANAGEMENT
A. Introduction
Table 23. Fiscal Risks Reports
Report Area Responsible Content
Medium-Term Estimates of Selected Decentralized and Deconcentrated Agencies: 2012-17
MOF – Technical Secretariat of the Budgetary Authority
Analysis of medium-term deficit/surplus tendencies of principal decentralized entities and public corporations
Annual Report of the Central Bank
Central Bank of Costa Rica Opinions certifying indebtedness of public entities
Annual Report of the SUGEF General Superintendency of Financial Entities
Analysis of equity and solvency status of financial institutions
B. Risk Analysis
Macroeconomic risks (3.1.1)
42. The budget documentation includes an explanation on debt sensitivity but does not cover fiscal forecasts and the key macroeconomic assumptions (BASIC). The MOF publishes an annual report on the situation of public debt. It details the risks of public debt. Besides this publication, there are only ministerial discussions on macroeconomic risks, primarily related to interest rates and the exchange rate. 43. There are other risks that are not evaluated by the public entities, such as the effects of current macroeconomic policies on output dynamics, tax collections, and the level of public financing. Economic growth 44. In recent years, the Costa Rican economy has experienced accelerated growth following the international financial crisis of 2008. However, between 2009 and 2011, tax revenues grew less than GDP. In contrast, in 2012 collections grew faster than GDP,
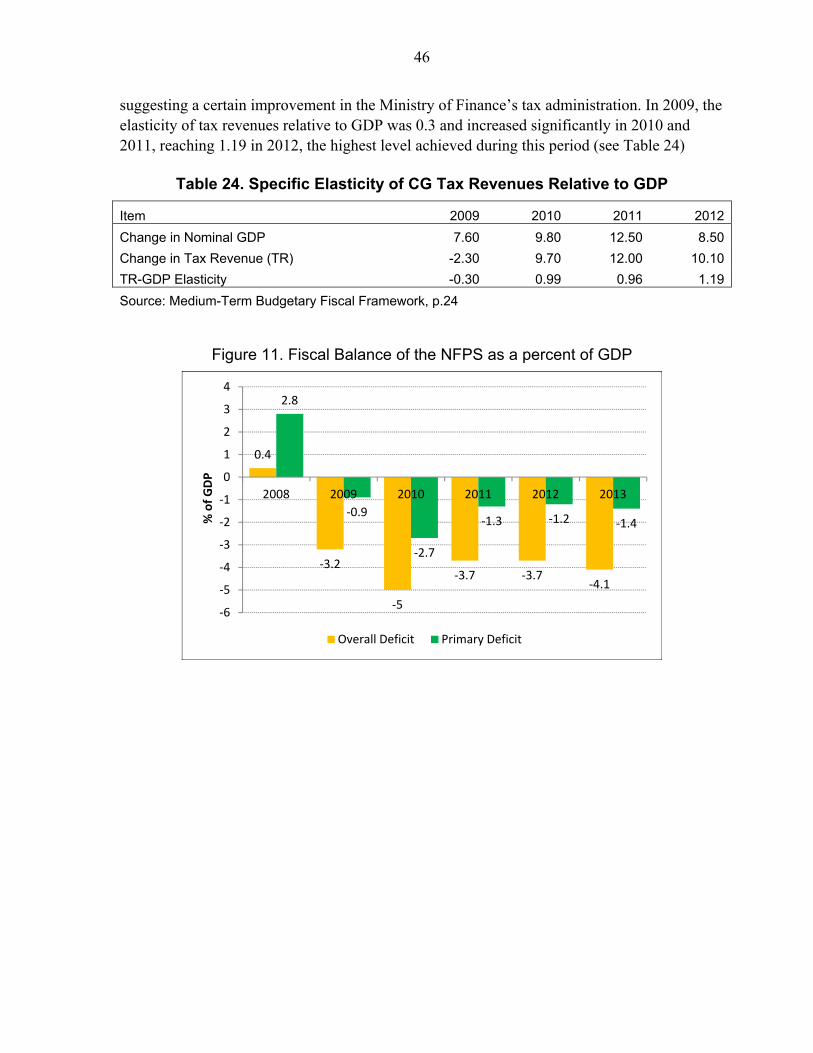
46
suggesting a certain improvement in the Ministry of Finance’s tax administration. In 2009, the elasticity of tax revenues relative to GDP was 0.3 and increased significantly in 2010 and 2011, reaching 1.19 in 2012, the highest level achieved during this period (see Table 24)
Table 24. Specific Elasticity of CG Tax Revenues Relative to GDP
Item 2009 2010 2011 2012
Change in Nominal GDP 7.60 9.80 12.50 8.50
Change in Tax Revenue (TR) -2.30 9.70 12.00 10.10
TR-GDP Elasticity -0.30 0.99 0.96 1.19
Source: Medium-Term Budgetary Fiscal Framework, p.24
Figure 11. Fiscal Balance of the NFPS as a percent of GDP
0.4
-3.2
-5
-3.7 -3.7-4.1
2.8
-0.9
-2.7
-1.3 -1.2 -1.4
-6
-5
-4
-3
-2
-1
0
1
2
3
4
2008 2009 2010 2011 2012 2013
% o
f G
DP
Overall Deficit Primary Deficit

47
Figure 12. GDP Gap as a Percent of Potential GDP
Source: IMF staff calculations, Article IV, 2012
Public debt 45. In the Annual Report on the Situation of Domestic and External Public Debt, the government partially recognizes the risks of the debt policy. In the DCP, sensitivity analyses are conducted on a monthly basis or whenever a significant change is noted in one of the macro variables. Risk analyses are also conducted on a monthly basis. The debt strategy is prepared on a half-yearly basis and is presented to the media and is also subject to sensitivity analyses. Of these three exercises, only the strategy is published on the Ministry of Finance website. However, the risks associated with monetary and exchange rate policies are not analyzed in the Macroeconomic Programming publication, since it is limited to the projection of macroeconomic variables. Exchange rate 46. Exchange rate variations may also pose a risk to the financing of governmental activities. However, for the moment the current exchange rate policy guarantees relative stability. The current exchange rate policy is that of an exchange rate that fluctuates within a band. The government is partially financed with dollar-denominated securities (19.6% of total debt in 2011), so that depreciation in the exchange rate may represent an increase in the cost of financing to the government, since it has to look for more colones to meet its foreign currency-denominated financial obligations. A ready supply of funds on international financial markets and high yields on domestic securities usually allows the country to take in external savings, strengthening the exchange rate through the accumulation of international reserves in the financial system.
3.5
-1.6 -1 -1 -1 -1
-3
-2
-1
0
1
2
3
4
2008 2009 2010 2011 2012 2013
GD
P G
ap a
s a
% o
f P
oten
tial
GD
P

48
Specific fiscal risks (3.1.2)
47. The main explicit risks of fiscal forecasts, such as those related to pensions, natural disasters, and lawsuits are not explained in qualitative terms (LESS THAN BASIC). In Costa Rica, there are systemic risks such as the aging of the population – which would affect the financing of future pensions – as well as legal and constitutional rigidity in the exercise of fiscal and budgetary policy.
Figure 13. Deposit Interest Rate, State and Private Banks
Source: BCCR
Figure 14. Public Debt of the NFPS and the BCCR as a Percent of GDP
Source: IMF, Article IV, p. 34, 2012
6.67
8.35
7.37
8.81
6
6.5
7
7.5
8
8.5
9
9.5
jan feb mar apr may jun 2012
jul aug sep oct nov dec
Pas
ive
Inte
rest
Rat
es
%
Public Banks Bancos Privados
36
38.3
39.8
43.4
48.3
49.9
0
5
10
15
20
25
30
35
32
34
36
38
40
42
44
46
48
50
52
2008 2009 2010 2011 2012 2013*
Debt
/GDP
as a
%
External Debt/GDP Domestic Debt/GDP Debt/GDP

49
Legal and budgetary framework 48. Another long-term risk is the legal and constitutional inflexibility of budgetary policy. There are laws that target taxes intended for certain institutions and the Constitution of the Republic has similar provisions. One example of this is the targeting of taxes from fuels, vehicle ownership, and a percentage of tolls to finance CONAVI. There is also the case of the targeting of the equivalent of 8 percent of GDP to the education sector under the Constitution. Similarly, universities are autonomous entities with budgets that also depend on special laws. In addition, there are deconcentrated institutions to which funds are transferred through the budgets of some ministries and these budgets are executed under the supervision of the CGR. Table 25 lists some laws that allocate revenues to specific institutions.
Table 25. Examples of Laws with Earmarked Budget Targets
Entity Specific Target Legal Basis
Special Fund to Finance Higher Education
1.5 % of GDP Leading ministries five-year
liaison commission
Judicial Branch 6% of current revenues Constitution, Art. 177
National Roads Council (CONAVI), cantonal network
75% of 29% of taxes received: fuels, vehicle
ownership, and tolls
Law on Tax Simplification and Efficiencies, Law No.
8114, Art. 5
CONAVI road network maintenance 50% of taxes collected on
vehicle ownership Law Creating de CONAVI,
Art. 20
Municipalities 25% of 29% of taxes
received on fuels, vehicle ownership, and tolls
Paragraph b) Art. 5, No. Law 8114 on Tax
Simplification and Efficiency
Technical Civil Aviation Council $12.85 of $26
Art. 1, Law 8316, Regulating Duties on
Departure from National Territory, as amended
Election Spending 0.11% of GDP Art. 96(1) of the
Constitution
Source: Medium-Term Budget Framework, 2009-2012, page 13. 49. The dual budgetary system that makes the Assembly responsible for only 41 percent of total public expenditures plus the degree of budgetary rigidity means that some 80 percent of the budgets sent to the National Assembly are linked to legal or constitutional mandates, significantly limiting the Ministry of Finance’s fiscal policy-making capacity and the Assembly’s supervision. In this regard, it is institutionally very

50
difficult to define fiscal policy, specifically the government’s investment policy or policy on compensation or procurement in the public sector. There is very limited room to maneuver in establishing fiscal rules to strengthen, consolidate, and preserve macroeconomic stability through the implementation of a more flexible fiscal policy. It is also very difficult to establish principles of efficiency and effectiveness in the use of public resources because control over budgetary execution is diffuse. 50. The short-term risks are associated with the performance of public policies, particularly in the area of coordinating fiscal and monetary policy. Although the authorities assess these risks, they do not disclose them. For example, counter-cyclical fiscal policy could affect economic growth18 and thus government revenues. The overall fiscal deficit of the nonfinancial public sector (NFPS) averaged 3.9 percent of GDP between 2009 and 2013,19 indicating a decline compared to the surplus achieved in 2008 (0.4%). This increase in government expenditure closed the gap between potential output and current output,20 generating inflationary pressures and inducing the BCCR to slow down demand in order to maintain the inflation goal. This also occurs with the assessment of the external risks the Costa Rican economy faces by maintaining the growth of public spending. 51. Various official reports point to the need for fiscal consolidation in order to prevent growth of the public deficit. However, the analysis in the reports does not include the automatic adjustment in expenditure each year. In effect, the BCCR sets an annual inflation goal of 5% (± 1 pp). It is this rate that is used to define public spending in the next budget, regardless of projected revenues. This mechanism leaves little room for budgetary adjustments in accordance with changes in relevant national and international macroeconomic variables. In view of the counter-cyclical expansion of public spending, the BCCR – whose basic purpose is to maintain price stability – increased interest rates, seeking to slow down domestic absorption (investment and consumer durables), shrink output, and reduce inflation. Nonetheless, output has continued to grow and interest rates continue to rise, increasing the cost of the government’s domestic financing and increasing service on the debt, particularly domestic debt, which is currently equal to 84 percent of total debt. This is one of the reasons why financing to the government grew rapidly and nearly doubled during the period between 2009 and 2012.
18 The benefits of fiscal expansion are limited to the extent that the ratio of public spending to GDP is low, in that the fiscal multiplier is significantly less than one (0.3), IMF Article IV, 2012, page 17.
19 IMF staff projection, Article IV, Costa Rica, February 2013, page 32.
20 The GDP gap is measured as (Y* - Y)/Y*, so that if Y (actual output) is greater than Y* (potential output) the gap is negative and, thus, there are inflationary pressures.
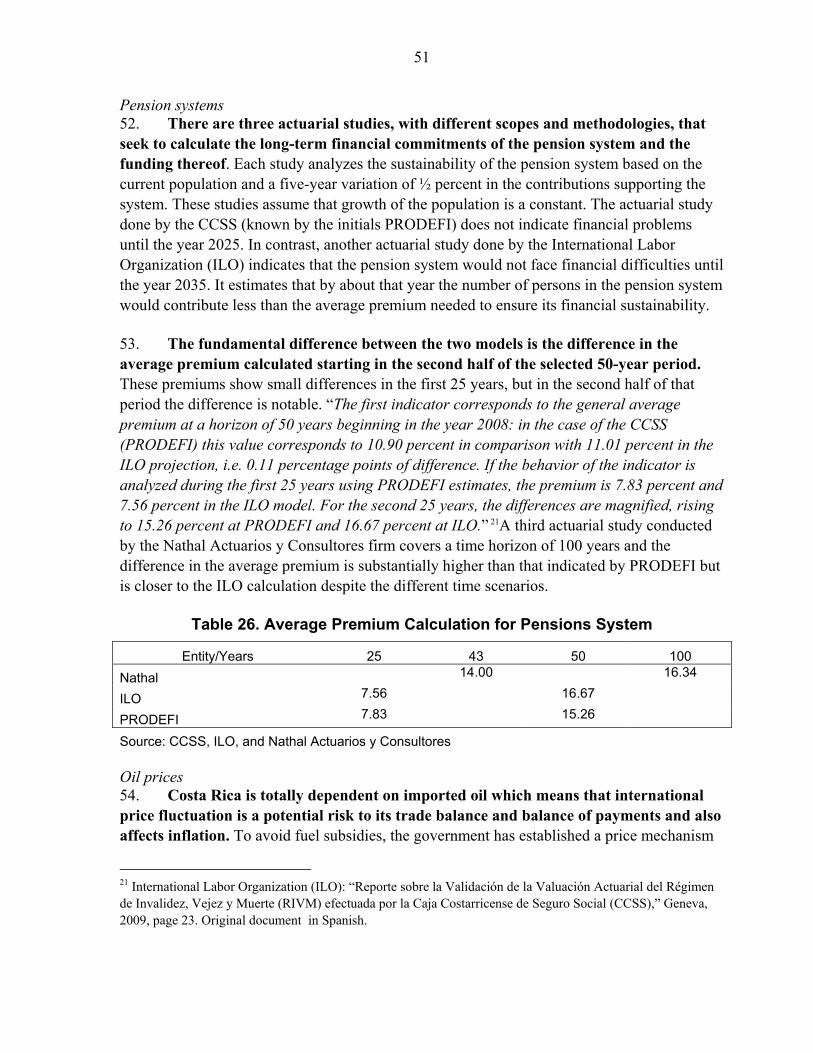
51
Pension systems 52. There are three actuarial studies, with different scopes and methodologies, that seek to calculate the long-term financial commitments of the pension system and the funding thereof. Each study analyzes the sustainability of the pension system based on the current population and a five-year variation of ½ percent in the contributions supporting the system. These studies assume that growth of the population is a constant. The actuarial study done by the CCSS (known by the initials PRODEFI) does not indicate financial problems until the year 2025. In contrast, another actuarial study done by the International Labor Organization (ILO) indicates that the pension system would not face financial difficulties until the year 2035. It estimates that by about that year the number of persons in the pension system would contribute less than the average premium needed to ensure its financial sustainability. 53. The fundamental difference between the two models is the difference in the average premium calculated starting in the second half of the selected 50-year period. These premiums show small differences in the first 25 years, but in the second half of that period the difference is notable. “The first indicator corresponds to the general average premium at a horizon of 50 years beginning in the year 2008: in the case of the CCSS (PRODEFI) this value corresponds to 10.90 percent in comparison with 11.01 percent in the ILO projection, i.e. 0.11 percentage points of difference. If the behavior of the indicator is analyzed during the first 25 years using PRODEFI estimates, the premium is 7.83 percent and 7.56 percent in the ILO model. For the second 25 years, the differences are magnified, rising to 15.26 percent at PRODEFI and 16.67 percent at ILO.” 21A third actuarial study conducted by the Nathal Actuarios y Consultores firm covers a time horizon of 100 years and the difference in the average premium is substantially higher than that indicated by PRODEFI but is closer to the ILO calculation despite the different time scenarios.
Table 26. Average Premium Calculation for Pensions System
Entity/Years 25 43 50 100
Nathal 14.00 16.34
ILO 7.56 16.67
PRODEFI 7.83 15.26
Source: CCSS, ILO, and Nathal Actuarios y Consultores Oil prices 54. Costa Rica is totally dependent on imported oil which means that international price fluctuation is a potential risk to its trade balance and balance of payments and also affects inflation. To avoid fuel subsidies, the government has established a price mechanism
21 International Labor Organization (ILO): “Reporte sobre la Validación de la Valuación Actuarial del Régimen de Invalidez, Vejez y Muerte (RIVM) efectuada por la Caja Costarricense de Seguro Social (CCSS),” Geneva, 2009, page 23. Original document in Spanish.

52
whereby the increase in international fuel prices is fully reflected in domestic prices, reducing domestic demand for fuel and affecting, to some extent, the collection of taxes on this item. In addition, the increase in fuel prices is reflected in companies’ costs through the cost of electricity, which would be passed on to their sales prices, depending on the price elasticity of the goods they produce. The sum of both effects could reduce the population’s buying power, affecting tax collections. It would be advisable for the budget documents to include this aspect in the risk calculations.
C. Risk Management
Contingency reserves (3.2.1)
55. The budget does not include an allocation for contingencies. However, there is a fund for natural disasters that is partially financed with surpluses (LESS THAN BASIC). Legislation established an emergency fund (National Commission for Risk Prevention and Emergency Response) for unforeseen events such as natural disasters and wars, but it does not cover other contingencies like those arising from macroeconomic effects on budgetary revenues or events of a legal nature such as judgments against the State. The fund is made up of 3 percent of the earnings of public corporations and the budgetary surplus of revenues not allocated to specific expenditures. Table 27 shows the financial execution of the fund. However, in practice almost all of these funds have been used each year. Table 27. National Commission for Risk Prevention and Emergency Response
Billions of colones
Heading 2009 2010 2011 2012
Revenues 9.1 5.9 6.1 6.7
Expenditures 8.6 5.4 5.9 6.4
- administration 1.7 2.2 1.9 2.3
- risk management 6.9 3.2 4.0 4.1
Balance 0.5 0.5 0.2 0.3
Source: Office of the Comptroller General of the Republic. Assets and liabilities management (3.2.2)
56. All assets and liabilities are authorized by legislation, reported, and managed according to a published strategy (ADVANCED). All increases in domestic debt must be certified by the BCCR. External debt must be approved by the Legislative Assembly and revalidated through Executive Branch decrees. The government announces the domestic debt placement strategy for the upcoming six months and evaluates the results from the previous six months compared to the previously disclosed strategy. The calendar of auctions, new projects, and the schedule of swaps to be carried out during the six-month period are reported. The “Annual Report on the Situation of Domestic and External Public Debt” explains changes

53
in the key components of nonfinancial public sector and central bank debt (public debt), fiscal outcomes during the period, physical and financial progress in projects financed with external credit, and risks and debt sustainability analysis. 57. The government has no participation in private companies or openly traded public companies. Similarly, there are no financial assets other than the funds deposited in the treasury single account administered by the National Treasury of the Republic that is deposited at the BCCR. The Treasury was recently authorized by law to purchase securities in small amounts. The management of the Treasury’s fund is limited by the resources assigned to specific uses in the budget. Transfers to deconcentrated and autonomous entities are carried out on the basis of an established schedule and independently of revenue collections. Temporary cash shortfalls are covered with short-term debt that can be purchased by public institutions. The BCCR does not pay interest on the treasury single account. 58. The aggregate amounts of financial and cash liabilities of the Treasury are consolidated by the MOF in the financial statements of the Executive Branch and sent to the CGR, which submits an annual evaluation report to the Legislative Assembly.
Figure 15. Trends in Maturity of Total Debt Percentage Distribution
Source: MOF, Annual Report on the Status of Domestic and Foreign Public Debt
Guarantees (3.2.3)
59. Amounts guaranteed by the government are published annually in the financial statements of the Executive Branch and legislation requires that debt be certified in advance by the BCCR, with the exception of the municipalities, the ICE, and the
0
10
20
30
40
50
60
70
80
90
100
2009 2010 2011
less than 1 year 1 to 5 years more than 5 years
54
universities (BASIC).22 Article 7 of Law 7010 states that no public institution from the decentralized central government sector, or any company in which the State or its institutions hold more than fifty percent of the shares, may contract external or domestic debt without prior authorization of the project prepared by the Ministry of Planning and a favorable opinion from the BCCR as well as the authorization of the Budgetary Authority. Article 80(d) of Law 8131 of 2011 states that the Directorate of Public Credit is the competent authority to recommend authorization by the Budgetary Authority of requests submitted to it by public sector entities with a view to entering into public debt transactions. Article 38 of Law 8131 of 2011 establishes that as part of the budget documentation the government must submit certification from the BCCR with respect to its borrowing capacity. Municipalities are exempt from this requirement, however, following a court decision taken a couple of years ago. The ICE and the universities are also exempt. In accordance with Law 8131, the General Directorate of Public Credit (DGCP) must maintain control of domestic and external debt. The DGCP prepares and sends to the CGR an annual report on the public debt situation that covers the entire public sector. However, there is no separate information on guarantees. In its annual report, the BCCR summarizes the certifications issued regarding new debt requests. In 2011, the BCCR issued 15 favorable opinions on loans. Not all debt needs to be guaranteed by the central government. In the section dealing with contingent liabilities, the DGCN presents information on both domestic and external loans for which the State acts as guarantor. At December 31, 2011, the amount stood at $417.37 million and amounted to $427.5 million in 2012. Financial sector exposure (3.2.4)
60. The government’s potential fiscal exposure to the financial sector is reported through quantified assessments of the sector’s stability and disclosed at least annually (ADVANCED). The General Superintendency of Financial Entities (SUGEF) actively supervises financial entities and prepares and publishes an annual report with a detailed analysis of the key indicators of bank solvency. The report analyzes solvency risk based on various aspects such capital adequacy and loan payments with more than 90 days in arrears (Table 28). Financial institutions in general are well capitalized and profitable.
22 See financial statements at https://www.hacienda.go.cr/Msib21/Espanol/Contabilidad+Nacional/Bienvenida.htm
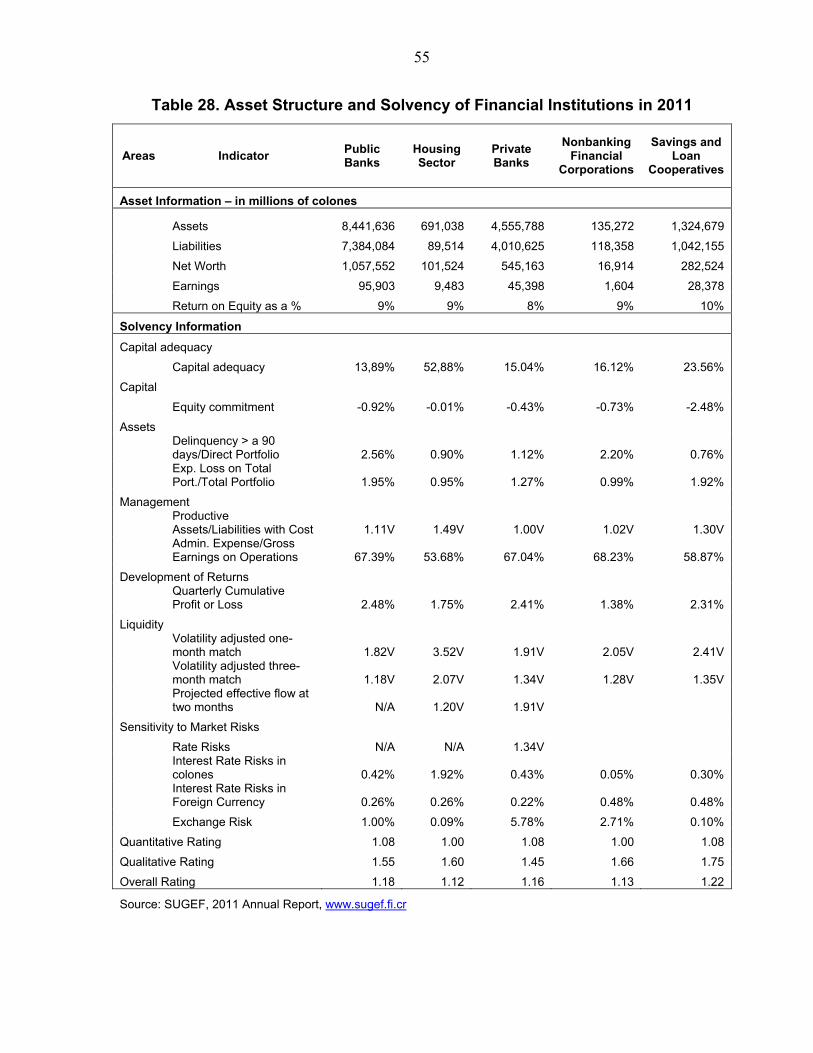
55
Table 28. Asset Structure and Solvency of Financial Institutions in 2011
Areas Indicator Public Banks
Housing Sector
Private Banks
Nonbanking Financial
Corporations
Savings and Loan
Cooperatives
Asset Information – in millions of colones
Assets 8,441,636 691,038 4,555,788 135,272 1,324,679
Liabilities 7,384,084 89,514 4,010,625 118,358 1,042,155
Net Worth 1,057,552 101,524 545,163 16,914 282,524
Earnings 95,903 9,483 45,398 1,604 28,378
Return on Equity as a % 9% 9% 8% 9% 10%
Solvency Information
Capital adequacy
Capital adequacy 13,89% 52,88% 15.04% 16.12% 23.56%
Capital
Equity commitment -0.92% -0.01% -0.43% -0.73% -2.48%
Assets Delinquency > a 90 days/Direct Portfolio 2.56% 0.90% 1.12% 2.20% 0.76% Exp. Loss on Total Port./Total Portfolio 1.95% 0.95% 1.27% 0.99% 1.92%
Management Productive Assets/Liabilities with Cost 1.11V 1.49V 1.00V 1.02V 1.30V Admin. Expense/Gross Earnings on Operations 67.39% 53.68% 67.04% 68.23% 58.87%
Development of Returns Quarterly Cumulative Profit or Loss 2.48% 1.75% 2.41% 1.38% 2.31%
Liquidity Volatility adjusted one-month match 1.82V 3.52V 1.91V 2.05V 2.41V Volatility adjusted three-month match 1.18V 2.07V 1.34V 1.28V 1.35V Projected effective flow at two months N/A 1.20V 1.91V
Sensitivity to Market Risks
Rate Risks N/A N/A 1.34V Interest Rate Risks in colones 0.42% 1.92% 0.43% 0.05% 0.30% Interest Rate Risks in Foreign Currency 0.26% 0.26% 0.22% 0.48% 0.48%
Exchange Risk 1.00% 0.09% 5.78% 2.71% 0.10%
Quantitative Rating 1.08 1.00 1.08 1.00 1.08
Qualitative Rating 1.55 1.60 1.45 1.66 1.75
Overall Rating 1.18 1.12 1.16 1.13 1.22
Source: SUGEF, 2011 Annual Report, www.sugef.fi.cr

56
Long-term contracts (3.2.5)
61. Each year the government publishes total liabilities on long-term contracts. However, it does not calculate the associated financial risks (BASIC). The National Concessions Council (CNC) is the entity responsible for management of public-private partnership contracts. There are five current contracts: two highways, two port terminals, and one airport passenger terminal. Three of the contracts include a minimum guarantee on the volume of vehicles or passengers. The contracts and other concession documents are available on the CNC website. So far the government has not had to provide funds to cover potential losses due to volumes lower than projected. However, there is no assessment of the risks associated with possible reductions in volume and no funds are set aside to cover such risks. The five contracts total US$1.7 billion (3.5 percent of GDP). Needs for investments in infrastructure are high. It is estimated that investments amounting to 3.5 percent of GDP would be needed in the area of transportation each year. However, annual investment deficits are estimated to be 2 percent of GDP, so it would be attractive for the government to expand the concessions. The government did not establish a ceiling on the total amount of concessions or an annual ceiling on the risks of potentially having to cover the guarantees provided to concession holders. 62. The concession contract for the Daniel Oduber airport terminal that established a minimum incremental volume of passengers for 15 years is described as an example of risk assessment. However, if the volume of passengers was to increase at a rate similar to the rate of GDP growth (4 percent a year), the government would have to contribute close to US$3.6 million on the total contract (Table 30). More sophisticated calculations based on probability analysis are recommended to provide a more accurate estimate of the amount that should be reserved for the potential need to provide guarantees. Similarly, a report should be published annually with data on the concessions’ financial and operational performance and measures taken to minimize associated risks. Financial derivatives (3.2.6)
63. The central government does not operate with derivatives (NOT APPLICABLE). Central government entities have no operations based on derivatives. Only the Costa Rican Electricity Institute (ICE) has ten contracts with derivatives to cover exchange rate and interest rate risks. The total amount involved in derivatives contracts was US$650 million as of 12/31/2011. Market risk positions are disclosed in the annual financial statements of the ICE.

57
Table 29. Characteristics of Public-Private Partnerships
Concession Total Value of Investment in Thousands of
US$
Concession Period (years)
Type of Guarantee
San Jose – San Ramón Road Corridor
523.700 25 Minimum volume of vehicles for 10 years
San José – Caldera Highway 265,860 25,5 Minimum volume of vehicles for 10 years
Design, Financing, Construction, Operation, and Maintenance of Moín Containers Terminal
812,100 33 No guarantees
Daniel Oduber International Airport Passenger Terminal
35,000 25 Minimum entry of passengers for 15 years
Terminal in Puerto Carrera 40,000 No guarantees Total 1,676,660Percentage of GDP (%) 3.5
Source: National Concessions Council, www.cnc.go.cr
Table 30. Example of Simulated Calculation of Risk Associated with a
Concession Contract for the Daniel Oduber International Airport Passenger Terminal
Year Concession Contract 2% Simulation 4% Simulation
Minimum Volume
% Potential Revenue
Volume Cost Volume Cost
2009 208,500 1,459,500 208,500 208,500
2010 226,000 8.39 1,582,000 212,670 93,310 216,840 64,120
2011 243,000 7.52 1,701,000 216,923 182,536 225,514 122,405
2012 259,500 6.79 1,816,500 221,262 267,667 234,534 174,761
2013 275,000 5.97 1,925,000 225,687 345,190 243,916 217,591
2014 290,000 5.45 2,030,000 230,201 418,594 253,672 254,295
2015 304,500 5.00 2,131,500 234,805 487,866 263,819 284,767
2016 318,500 4.60 2,229,500 239,501 552,993 274,372 308,898
2017 331,500 4.08 2,320,500 244,291 610,463 285,347 323,073
2018 344,500 3.92 2,411,500 249,177 667,262 296,761 334,176
2019 356,000 3.34 2,492,000 254,160 712,878 308,631 331,583
2020 368,000 3.37 2,576,000 259,244 761,295 320,976 329,167
2021 379,000 2.99 2,653,000 264,428 802,001 333,815 316,293
2022 389,500 2.77 2,726,500 269,717 838,481 347,168 296,325
2023 399,000 2.44 2,793,000 275,111 867,221 361,055 265,618
Total 32,847,500 7,607,758 3,623,074
Source: CNC, concession contracts and simulation by the mission.
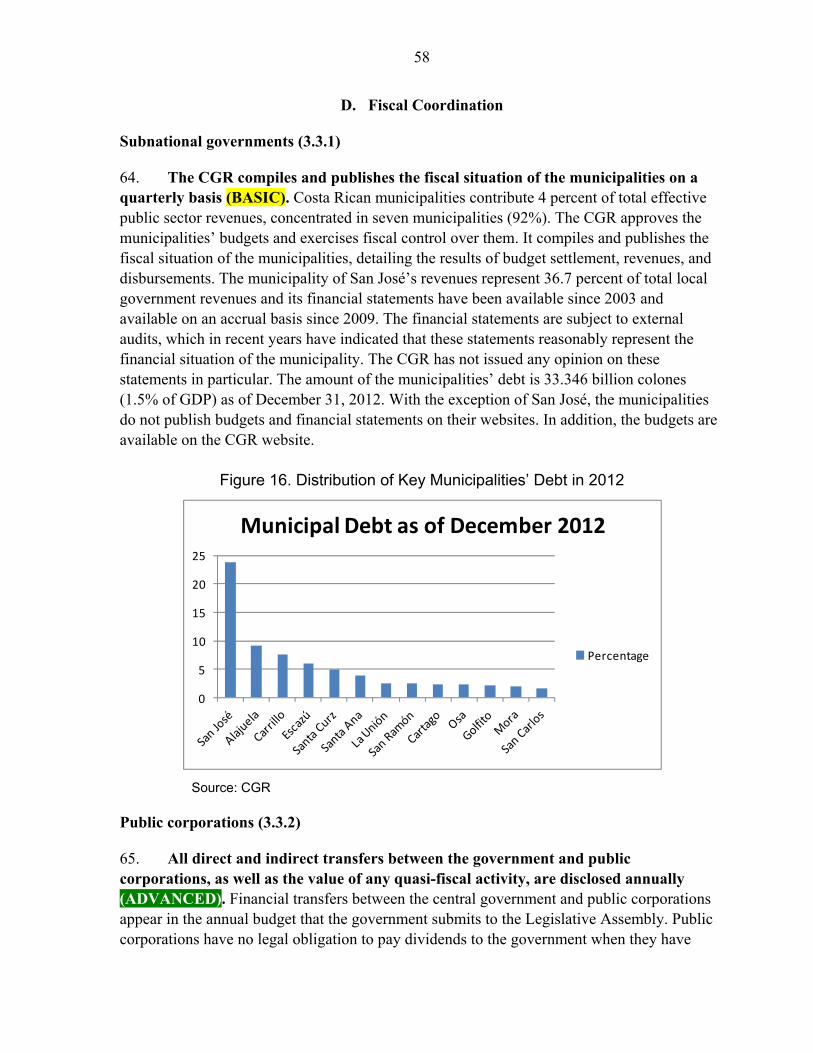
58
D. Fiscal Coordination
Subnational governments (3.3.1)
64. The CGR compiles and publishes the fiscal situation of the municipalities on a quarterly basis (BASIC). Costa Rican municipalities contribute 4 percent of total effective public sector revenues, concentrated in seven municipalities (92%). The CGR approves the municipalities’ budgets and exercises fiscal control over them. It compiles and publishes the fiscal situation of the municipalities, detailing the results of budget settlement, revenues, and disbursements. The municipality of San José’s revenues represent 36.7 percent of total local government revenues and its financial statements have been available since 2003 and available on an accrual basis since 2009. The financial statements are subject to external audits, which in recent years have indicated that these statements reasonably represent the financial situation of the municipality. The CGR has not issued any opinion on these statements in particular. The amount of the municipalities’ debt is 33.346 billion colones (1.5% of GDP) as of December 31, 2012. With the exception of San José, the municipalities do not publish budgets and financial statements on their websites. In addition, the budgets are available on the CGR website.
Figure 16. Distribution of Key Municipalities’ Debt in 2012
Source: CGR
Public corporations (3.3.2)
65. All direct and indirect transfers between the government and public corporations, as well as the value of any quasi-fiscal activity, are disclosed annually (ADVANCED). Financial transfers between the central government and public corporations appear in the annual budget that the government submits to the Legislative Assembly. Public corporations have no legal obligation to pay dividends to the government when they have
0
5
10
15
20
25
Municipal Debt as of December 2012
Percentage

59
surplus earnings. Accordingly, public corporations may accumulate surpluses in their favor. The MOF conducts a study to evaluate the financial behavior of the public sector and verify whether there is a medium-term accumulation of operational and financial deficits that would necessitate significant financial contributions. The studies cover 12 of the largest nonfinancial public corporations over the period 2012-2017. The conclusion is that only one company has ongoing operational deficits and that financial deficits are due to investments that will be financed through specific loans for investing in increased capacity to produce goods and services. However, this report is an internal MOF document and is not published. 66. Public corporations engage in few quasi-fiscal operations. The Public Services Regulatory Authority (ARESEP) is responsible for authorizing prices on utilities providing electricity, fuels, telecommunications, transportation, and water. Prices are determined based on the cost recovery principle. As can be seen in Figure 17, total revenues in 2012 were almost enough to cover expenditures.
Figure 17. 2012 Budgetary Execution of Nonfinancial Public Corporations
0 1 10 100 1,000
CAJA COSTARRICENSE DE SEGURO SOCIAL (CCSS)
REFINADORA COSTARRICENSE DE PETROLEO
COMPAÑIA NACIONAL DE FUERZA Y LUZ
UNIVERSIDAD DE COSTA RICA
INSTITUTO MIXTO DE AYUDA SOCIAL
UNIVERSIDAD NACIONAL (UNA)
INSTITUTO NACIONAL DE APRENDIZAJE (INA)
INSTITUTO COSTARRICENSE DE ACUEDUCTOS Y …
JUNTA ADMINISTRATIVA DEL SERVICIO ELECTRICO MUNICIPAL DE …
EMPRESA DE SERVICIOS PUBLICOS DE HEREDIA (ESPH)
INSTITUTO TECNOLOGICO DE COSTA RICA (ITCR)
UNIVERSIDAD ESTATAL A DISTANCIA (UNED)
PATRONATO NACIONAL DE LA INFANCIA (PANI)
JUNTA DE ADMINISTRATIVA PORTUARIA Y DE DESARROLLO …
UNIVERSIDAD TECNICA NACIONAL (UTN)
INSTITUTO COSTARRICENSE DE TURISMO (ICT)
JUNTA DE PENSIONES Y JUBILACIONES DEL MAGISTERIO NACIONAL
AUTORIDAD REGULADORA DE LOS SERVICIOS PUBLICOS
CORREOS DE COSTA RICA S.A.
INSTITUTO COSTARRICENSE DE PUERTOS DEL PACIFICO
INSTITUTO COSTARRICENSE DE FERROCARRILES
SERVICIO NACIONAL DE AGUAS SUBTERRANEAS RIEGO Y …
PROGRAMA INTEGRAL MERCADEO AGROPECUARIO
OPERADORA DE LA CAJA COSTARRICENSE DE SEGURO SOCIAL …
SISTEMA NACIONAL DE RADIO Y TELEVISION CULTURAL (SINART)
COLEGIO UNIVERSITARIO DE CARTAGO
COLEGIO UNIVERSITARIO DE LIMON
HOSPITAL DEL TRAUMA S.A.
EDITORIAL COSTA RICA
ALMACEN FISCAL AGRICOLA DE CARTAGO S.A.
COMISION NACIONAL DE ASUNTOS INDIGENAS
COLEGIO SAN LUIS GONZAGA
DEPOSITO AGRICOLA DE CARTAGO S.A.
billion colones
Entity
Revenues Expenditure

60
67. According to the CGR’s annual audit of the 2011 financial statements of the Executive Branch, no figures were included or disclosed with respect to the government’s ownership or participation in public corporations.
E. Recommendations
The Ministry of Finance should prepare an annual document reporting on fiscal risks as part of the budget documents. This document should contain information on macroeconomic risks, public debt, public corporations, debt guarantees, contingent liabilities, concession contracts, natural disasters, financial institutions, subnational governments and social security and health.
F. Conclusions
Table 31. Summary Assessment of Risk Analysis and Management Practices
Item DIMENSION PRINCIPLE TRANSPARENCY ASSESSMENT
3 Analysis and management of fiscal risks
Governments must analyze and manage fiscal risks and ensure effective coordination of fiscal decision-making of the entire public sector
3.1 Risks analysis
Government must publish regular reports on the risks to which their fiscal outlooks are subject
3.1.1 Macroeconomic risks
The government reports on how fiscal outcomes might differ from forecasts as a result of macroeconomic shocks.
The budget documentation includes an explanation on the sensitivity of the debt but not on the fiscal forecasts and the key macroeconomic assumptions (BASIC).
3.1.2 Specific fiscal risks
The government regularly reports on the main sources of specific risks to its fiscal forecasts, such as contingent liabilities.
The principal specific risks of fiscal forecasts, such as those related to pensions, natural disasters, and lawsuits, are not explained in qualitative terms (LESS THAN BASIC).
3.2 Risk management Specific fiscal risks must be monitored and managed regularly
3.2.1 Contingency reserves
The budget has adequate and transparent provision for contingencies that arise during budget execution.
The budget does not include an allocation for contingencies. However, there is a fund for natural disasters that is partially funded by financial surpluses (LESS THAN BASIC).
3.2.2 Assets and liabilities management
Risks relating to major assets and liabilities should be disclosed and managed.
All assets and liabilities are authorized by legislation, disclosed, and managed according to a published strategy (ADVANCED).
3.2.3 Guarantees Government guarantees are regularly disclosed and actively managed.
The amounts guaranteed by the government are published in the financial statements of the Executive Branch and the legislation requires that debt be certified in advance by the BCCR, with the exception of the municipalities, the ICE, and the universities (BASIC).

61
Table 31. Summary Assessment of Risk Analysis and Management Practices (concluded)
Item DIMENSION PRINCIPLE TRANSPARENCY ASSESSMENT
3.2.4 Financial Sector Exposure
The government’s potential fiscal exposure to the financial sector is analyzed and managed.
The government’s potential fiscal exposure to the financial sector is reported through quantified evaluations of the stability of the sector and disclosed at least annually (ADVANCED).
3.2.5 Long-term contracts
The government’s rights and obligations under long-term contracts, including public-private partnerships and contracts for the exploitation of resources, are regularly disclosed and actively managed.
Each year the government publishes its total obligations based on long-term contracts. However, the associated financial risks are not estimated (BASIC).
3.2.6 Financial derivatives
The government’s derivative positions are regularly disclosed, assessed, and managed in the context of the overall balance sheet.
The government does not operate with derivatives ( NOT APPLICABLE)
3.3 Fiscal coordination
The fiscal relationships of the entire public sector must be clear and coordinated
3.3.1 Subnational governments
Consolidated and comprehensive information is on the fiscal conditions of the subnational government is collected and published.
The CGR compiles and publishes the fiscal situation of the municipalities on a quarterly basis (BASIC).
3.3.2 Public corporations
Government oversees and regularly publishes comprehensive information on the fiscal performance of public corporations.
All direct and indirect transfers between the government and public corporations, as well as the value of any quasi-fiscal activity, are disclosed annually (ADVANCED).

62
ANNEX. COSTA RICA: RECOMMENDATIONS AND ACTION PLAN TO IMPROVE FISCAL TRANSPARENCY AND ANALYSIS OF FISCAL
RISKS Recommendation 2014 2015 2016 2017 2018 Responsible
Coverage of flows, balances, and budgetary classification, accounting and statistics. 1.1.2 and 1.3.1
Complete the implementation of the international public sector accounting standards for the public sector, ensuring that accounting and budgetary classifications are harmonized. This reform can take from 6 to 12 years to be completed.
Modify the accounting standards and regulations to the international accounting standards. Start recording the expenses in accordance with the accrual basis
Record revenues according to the modified cash basis (tax settlement and recognition of the tax return)
Make provisions for major fiscal risks. Record revenues according to the accrual principle (1-3 years).
Record assets and long-term financial liabilities in accordance with the principle of amortized cost (present value) (1-3 years).
Record fixed and intangible assets. Inventory and cost all physical assets, including infrastructure. (1-3 years). The last stage is the consolidation of public sector financial statements (2 years).
DGPN, DCP, DGCN, DG Tributación, DG Aduanas
Consistency and reliability of budgetary, accounting, and statistical information. 1.3.2, 1.3.3, and 1.3.4 Reconcile fiscal reports and produce timely audit reports to ensure the reliability of the information.
Harmonize the classification of accounts with the IMF GFSM 2001. Develop fiscal statistics according to the IMF GFSM 2001, reconciled to the Financial Statements
CGR should prepare audit of the consolidated annual budget execution report in a maximum period of nine months from the end of the fiscal year.
Adjust the financial statements as identified by the CGR to avoid abstention of the audit opinion. Reconcile cash flow statement with budgetary outcomes (IPSAS 24, paragraph 47)
Audit the annual consolidated financial statements of the NFPS
STAP, DGCN, Tesoro Nacional y CGR

63
Budgetary unit, proposal and approval of budget. 2.1.1, 2.2.2, and 2.2.3
Prepare budget reports with analysis of situation and outlooks by the end of the year for the public sector.
Present individual annual budget execution reports before January 31
Coordinate the timing of the budget execution statements of public entities to become quarterly for all entities. Prepare quarterly progress reports by 30 days after the end of the quarter.
Prepare the consolidated annual budget execution report by April 1 of the following year.
Public Entities, STAP y DGCN
Amend the Constitution to make the Legislative Assembly responsible for approving the budget for the entire public sector.
Conduct studies to identify legal alternatives for the unification of the budget.
Discuss with the Assembly a proposal for constitutional change.
Propose modification of the constitution and define transition period.
Implement a unified budget approval to the entire public sector.
MOF and Legislative Assembly
Medium-term budgetary framework, report on fiscal strategy and fiscal policy objectives. 2.1.4, 2.2.1, and 2.3.1 Improve the medium-term budget framework (MTBF).
Strengthen macroeconomic analysis, preparation and publication of macroeconomic and fiscal projections.
Define fiscal rules to assure the stability of public finances in the medium and long term.
Include in the MTBF medium term information on the sectoral ministries.
Include in the MTBF information on programs for the medium term. Include operation and maintenance costs of investment projects in the multi-year projections.
Evaluate the MTBF.
DGPN, DCP
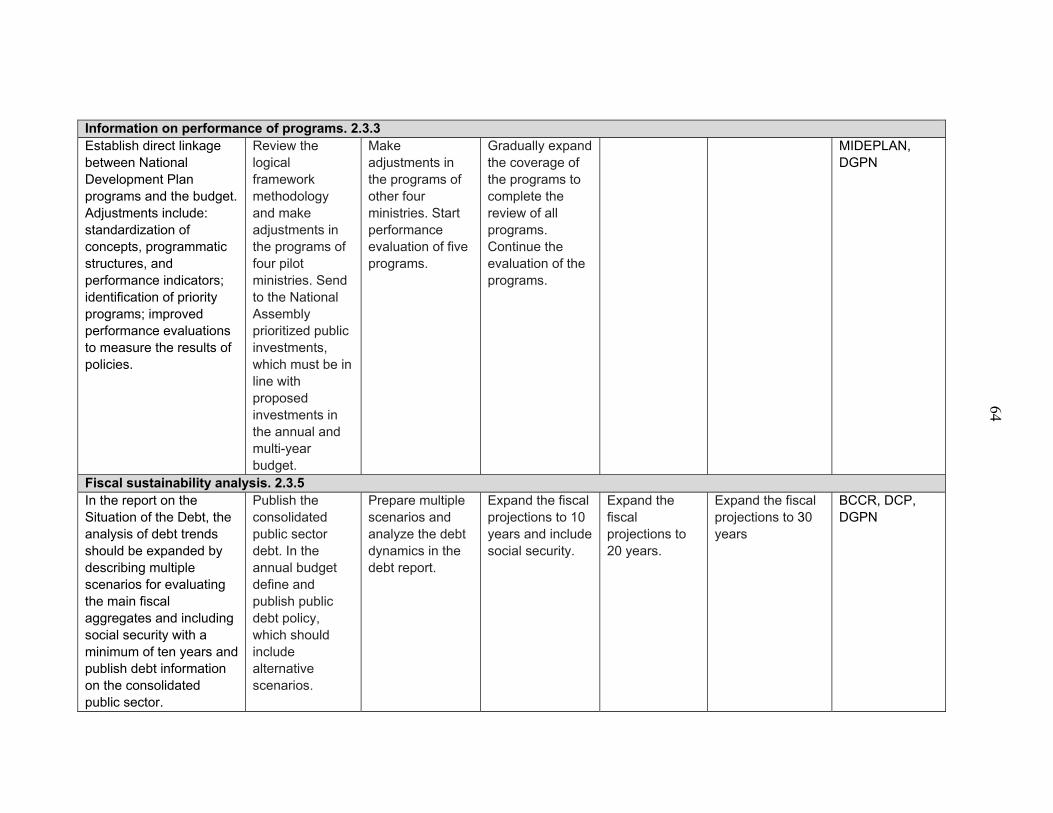
64
Information on performance of programs. 2.3.3 Establish direct linkage between National Development Plan programs and the budget. Adjustments include: standardization of concepts, programmatic structures, and performance indicators; identification of priority programs; improved performance evaluations to measure the results of policies.
Review the logical framework methodology and make adjustments in the programs of four pilot ministries. Send to the National Assembly prioritized public investments, which must be in line with proposed investments in the annual and multi-year budget.
Make adjustments in the programs of other four ministries. Start performance evaluation of five programs.
Gradually expand the coverage of the programs to complete the review of all programs. Continue the evaluation of the programs.
MIDEPLAN, DGPN
Fiscal sustainability analysis. 2.3.5 In the report on the Situation of the Debt, the analysis of debt trends should be expanded by describing multiple scenarios for evaluating the main fiscal aggregates and including social security with a minimum of ten years and publish debt information on the consolidated public sector.
Publish the consolidated public sector debt. In the annual budget define and publish public debt policy, which should include alternative scenarios.
Prepare multiple scenarios and analyze the debt dynamics in the debt report.
Expand the fiscal projections to 10 years and include social security.
Expand the fiscal projections to 20 years.
Expand the fiscal projections to 30 years
BCCR, DCP, DGPN

65
Analysis and management of fiscal risks. Pillar 3. prepare an annual document reporting on fiscal risks as part of the budget documents. This document should contain information on macroeconomic risks, public debt, public corporations, debt guarantees, contingent liabilities, concession contracts, natural disasters, financial institutions, municipal governments, and social security and health.
Define the unit in the MOF that will be responsible for the preparation of the risk assessment. Define the structure of a fiscal risk report, identify the units responsible for the preparation of information, and prepare a pilot report to assess the methodology and consistency of the information.
Publish the first fiscal risk report that includes macrofiscal risks, and risks related to public enterprises and the financial sector. Define policies to mitigate those risks.
Include in the fiscal risk report information on public private partnership contracts, subnational governments, and debt guarantees.
Include in the fiscal risk report information on contingent liabilities such as pension funds and judicial demands.
DGPN, BCCR, ARESEP, CNC, INS and other areas that manage potential fiscal risks.